
Abstract
Abstract
Background:
Aerosol delivery of surfactant and perfluorocarbon (PFC) is a desirable therapeutic approach for the treatment of various lung diseases in patients undergoing mechanical ventilation. However, the behavior of these substances during aerosolization differs significantly from that of aqueous solutions. In particular, the high vapor pressure of many PFCs tends to result in greater evaporation during mechanical ventilation.
Methods:
Three PFCs and surfactant were aerosolized during mechanical ventilation by means of three intratracheal inhalation catheters (IC) with different air flow rates (IC-1.23, IC-1.1, and IC-1.4), with their aerosol generating tip placed at the distal end of the endotracheal tube (i.d. 4 mm). The influence of four different ventilation strategies on aerosol production rate and PFC and surfactant recovery was studied. The changes in intrapulmonary pressure produced by the air jets of each IC were measured.
Results:
With IC-1.23 and IC-1.1, the highest rates of aerosol production were achieved using FC75 (2.27±0.18 and 0.76±0.01, respectively) followed by PFOB (1.74±0.06 and 0.56±0.04), PFD (0.82±0.01 and 0.21±0.01), and surfactant (0.42±0.05 and 0.092±0.01). With IC-1.4 modest aerosol production was obtained irrespective of the aerosolized compound. Mechanical ventilation influenced aerosol recovery, with the trend being toward recovering higher percentages of the compounds with lower peak inspiratory pressure (PIP) and lower respiratory rate (RR) settings. The highest percentages of the initial volume were recovered with IC-1.23 (between 65.43%±4.2 FC75 and 90.21%±4.71 surfactant) followed by IC-1.1 (between 46.48%±4.46 FC75 and 73.19%±2.82 PFOB) and IC-1.4 (between 4.65%±4.36 FC75 and 63.24%±9.71 surfactant). Each of three of the ICs were found to increase the intrapulmonary pressure by about 2–3 cmH2O during mechanical ventilation.
Conclusions:
Despite of mechanical ventilation, IC-1.23 and IC-1.1 were able to deliver significant amounts of surfactant and perfluorocarbon to the lung model. Changes in PIP and RR directly influence the percentage of surfactant and perfluorocarbon recovered.
Introduction
These therapies, although very effective, are linked to peridosing adverse events related to the high intratracheal fluid load derived from the instillation of surfactant or PFC. In fact, at the start of both therapies large liquid volumes have to be rapidly administered through the endotracheal tube (ETT), often leading to ETT obstruction, transient hypoxia, hypercarbia, and hemodynamic imbalance,(13–15) which might worsen even further the condition of patients who are already hemodynamically unstable.
To avoid these adverse effects new methods of surfactant and PFC administration are currently under research.(16–18) The aerosol delivery of surfactant and PFC presents a priori various theoretical advantages over instillation: among others, it should avoid the acute fluid load and associated comorbidities,(19,20) the lung distribution might be enhanced,(21) and it may be possible to fine tune the technique via the ventilator settings.(16)
However, most of the current nebulizer techniques are not effective at delivering large amounts of PFC and, especially, large amounts of surfactant to the lung parenchyma.(19,22) This may be related to the type of nebulizer used to produce the aerosol (jet vs. ultrasonic),(23) the ventilator strategy and airway size, especially during neonatal aerosolization,(24) the surfactant preparation,(25) and the biophysical properties of PFCs used,(26) but also to the high percentage of the aerosolized compound that becomes deposited within the ETT and upper airways (rather than the lung), likely due to the turbulent air flow and humidity.(27,28) In patients undergoing mechanical ventilation, lung deposition of surfactant and PFC could be enhanced if an inhalation catheter (IC) were to be advanced through the ETT and the aerosol-generating tip placed above the carina.(29)
In a previous study, we demonstrated that three different intratracheal ICs with different designs were able to continuously aerosolize relatively large amounts of surfactant and PFCs in a respirable size range.(30) However, an important question, namely, the effect of mechanical ventilation on surfactant and PFC aerosolization remained unanswered.
The present study was designed to investigate the feasibility of aerosol therapy with surfactant and three different types of PFC via ICs during mechanical ventilation. To that end, we tested three different ICs under four different ventilation strategies achieved by changing peak inspiratory pressure (PIP) and respiratory rate (RR). In addition, the pressure exerted by the ICs at their distal tip was measured during mechanical ventilation to determine its contribution to the intrapulmonary pressure and assess the potential consequences of this during aerosolization in vivo.
Materials and Methods
Surfactant and PFCs
Curosurf® (Chiesi Farmaceutici S. P. A., Parma, Italy) is a natural surfactant, prepared from porcine lungs, containing almost exclusively polar lipids, in particular, phosphatidylcholine (about 70% of the total phospholipid content), and about 1% of specific low molecular weight hydrophobic proteins SP-B and SP-C at a phospholipid concentration of 80 mg/mL.
Three different types of PFC were used in our study, Perfluorooctyl-bromyde (PFOB; F2 Chemicals Ltd., Lancashire, UK), Perfluorodechalin (PFD; F2 Chemicals Ltd., Lancashire, UK), and FC75 (Fluorinert, 3M, Neuss, Germany). PFOB (density at 25°C=1.93 g/cc; kinematic viscosity=1.1 cstokes; vapor pressure at 37°C=11 mmHg; and surface tension=18 dyne/cm) and PFD (density at 25°C=1.95g/cc; kinematic viscosity=2.7 cstokes; vapor pressure at 37°C=14 mmHg; and surface tension=15 dyne/cm) have similar physical properties but differ in kinematic viscosity. In addition, PFOB has a linear structure, whereas PFD is cyclic. On the other hand, FC75 (density at 25°C=1.78 g/cc; kinematic viscosity=0.81 cstokes; vapor pressure at 37°C=63 mmHg; and surface tension=15 dyne/cm) has a lower density, lower kinematic viscosity, and higher vapor pressure than either PFOB or PFD. These PFC species have previously been used in several in vivo and in vitro experiments.(2,4,8–10, 30)
Inhalation catheters and catheter control unit
A pneumatic catheter control unit (LABneb*CCS, Trudell Medical International, London, ON, Canada) operated at 6.9 bar connected to three different intratracheal ICs (AeroProbe INC, Trudell Medical International, London, ON, Canada) was used to produce the aerosols. Briefly, these ICs consist of several outer lumens, through which a driving gas passes at a high velocity, and a central lumen for the fluid that is to be aerosolized. Due to the large decrease in pressure (Bernoulli Effect) created by the pressurized gas in the outer lumens, the liquid is drawn up and reduced to droplets of a respirable size range. In the present study, we tested three ICs, which we refer to according to the air flow rate generated by each one: IC-1.23 (air flow rate of 1.23 L/min), IC-1.1 (air flow rate of 1.1 L/min), and IC-1.4 (air flow rate of 1.4 L/min). The characteristics and design of these ICs have been previously described elsewhere.(30)
Aerosolization rate, emission rate, and compound percentage loss during mechanical ventilation
Once the catheter control unit was connected to the corresponding IC, each one was inserted into an ETT with an internal diameter of 4 mm (Mallinckrodt Medical, St Louis, MO), until the distal tip of the IC was approximately 1 mm beyond the end of the ETT. A test lung (weight 23g, compliance 0.6–1.2 mL/mbar, and resistance 160–999 mbar/L/sec at flow 6, manufacturer information, Draeger Medical Inc., Lübeck, Germany) was then coupled to the distal end of the ETT and sealed with a cable clip to prevent any potential escape of PFC or surfactant. The catheter control unit was then connected to a neonatal mechanical ventilator (BP200, Beard Med Sys., Riverside, CA) using a pressure transducer (Fig. 1), so that the catheter control unit was triggered only during the inspiratory phase. Each IC and compound combination was then tested during different mechanical ventilation strategies. We used four ventilation strategies, defined as a function of PIP and RR: (1) RR=30 bpm, PIP=20 cmH2O, minute volume (VE)=320 mL; 2) RR=60 bpm, PIP 20 cmH20, VE=625 mL ; 3) RR=30 bpm, PIP=35 cmH2O, VE=540 mL; and 4) RR=60 bpm, PIP 35 cmH20, VE=1030 mL. The positive end expiratory pressure (PEEP) was kept at 5 cmH2O, and the flow of the ventilator was set at 10 L/min with an inspiratory/expiratory (I:E) ratio fixed at 1:2.
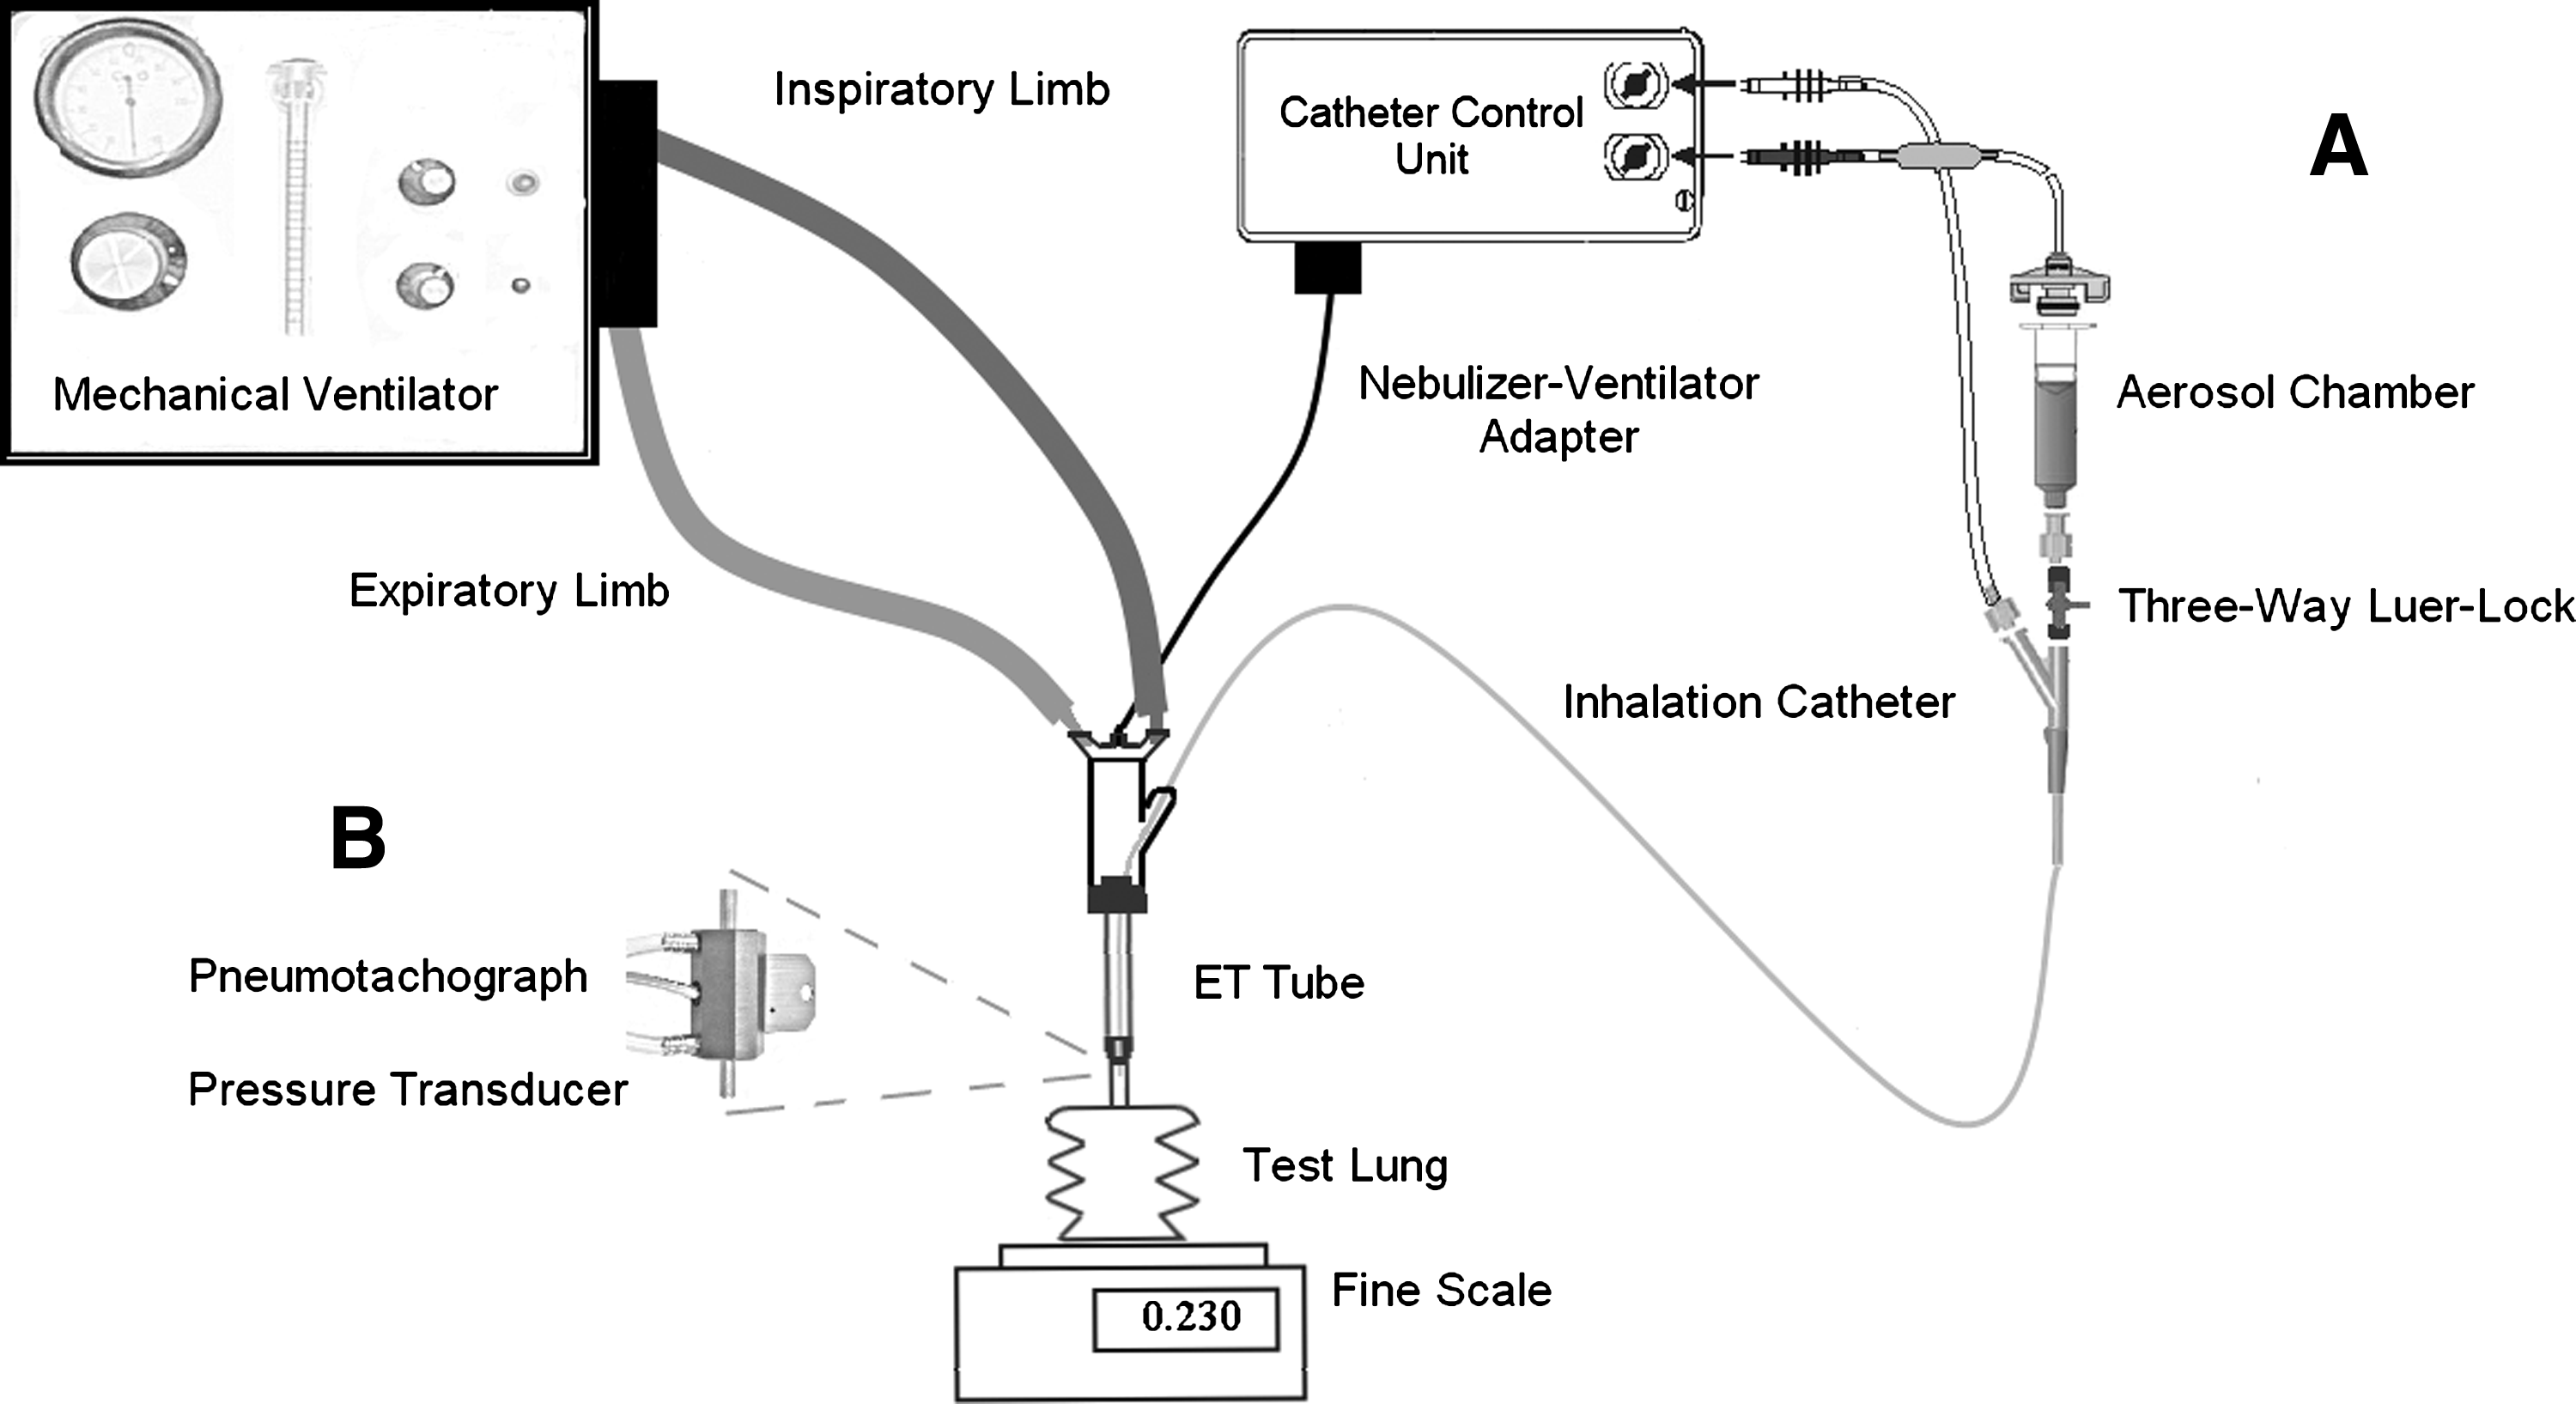
Schematic diagram of the experimental setup. Adapted from the AeroProbe® user's guide. The aerosolization rate was assessed as the amount of compound that disappeared from the aerosol chamber after 1 min of ventilator-adapted aerosolization, and the emission rate as the weight gain of the test lung after 1 min of ventilator-adapted aerosolization (
If the RR was set at 60 bpm (inspiratory time=333 ms at I:E=1:2), the catheter control unit was programmed to aerosolize for 300 msec. On the other hand, if the RR was at 30 bpm (inspiratory time=666 msec at I:E=1:2), the catheter control unit was programmed to aerosolize during the first 600 msec of the inspiratory phase. That is, irrespective of the RR the aerosolization was performed for 90% of the inspiratory phase, with a total aerosolization time of 18 sec per minute.
For every case, the aerosololization rate (ARMV), the emission rate (ERMV), and the PFC or surfactant recovery percentage (RMV) during mechanical ventilation (MV) were calculated. The ARMV was determined as the amount of compound that disappeared from the aerosol chamber after 1 min of ventilator-adapted aerosolization. For that purpose, the aerosol chamber was filled up with the corresponding compound, weighed in a precision balance (capacity 310 g and readability 0.001 g, PL-303 Mettler Toledo, Barcelona, Spain), and subsequently the catheter control unit was triggered allowing 1 min of ventilator-adapted aerosolization. Immediately afterward, the aerosol chamber was weighed again (Fig. 1A).
The empty test lung was also weighed before every aerosolization procedure. After 60 sec of ventilator-adapted aerosolization, the test lung was weighed again (now containing the emitted dose), allowing the emission rate to be calculated as the difference in weight between the test lung before and after 60 sec of ventilator-adapted aerosolization.
Finally, the PFC or surfactant RMV was calculated from the ratio between the ERMV and the ARMV:
Between each test procedure, the same process was repeated with saline to monitor the accuracy of the inhalation catheters over time. All the experiments were conducted in a dry circuit at room temperature (24°C).
Measurement of the intrapulmonary pressure added by the inhalation catheters during mechanical ventilation
Because the ICs are operated at high pressure (6.9 bar; 7036.23 cmH2O), we measured the additional pressure added by the ICs to the flow determined by the preset ventilator setting with different mechanical ventilation strategies. To assess the changes in intrapulmonary pressure a differential pressure transducer (range: 0–71 cmH2O, Honeywell, NJ) fitted to a pneumotachograph (Fleisch 000, Laussane, Switzerland) was placed between the distal tip of the ETT, which contained the distal tip of the IC, and the test lung (Fig. 1B). First, we measured the intrapulmonary pressure during mechanical ventilation alone during each ventilation strategy and, subsequently, the intrapulmonary pressure using the ventilator and the ICs operated in synchrony, with each IC and each ventilation strategy. No liquid compound was aerosolized during the pressure measurements, the ICs were operated with just compressed air.
The differential pressure transducer was used to obtain pressure curves for each case, with and without ICs, for at least 10 sec, and the pneumotachograph allowed us to assess the VE of each ventilation strategy. The data were automatically recorded electronically (PowerLab/16sp, ADInstr, CO; Chart 5, ADIinstr., CO).
Statistical analysis
Statistical analysis of the data was carried out using JMP8 software (Statistical Discovery, SAS, NC). The ARMV, ERMV, and surfactant and PFC RMV measurements with each IC, each compound and each ventilation strategy were repeated five times and the means±SD were calculated. For the measurements of the pressure contribution of the ICs, the mean±SD of the intrapulmonary pressure of 10 respiratory cycles, with and without the ICs, during each ventilation strategy was calculated.
A one-way ANOVA was performed to identify any statistically significant differences between each IC, and each ventilation strategy for ARMV, ERMV, and RMV, and to identify differences between the intrapulmonary pressure with and without the ICs. A p<0.05 was accepted as significant.
Results
Aerosolization and emission rates during mechanical ventilation (ARMV and ERMV)
Regardless of the aerosolized compound, the highest ARMV values were measured with IC-1.23, followed by IC-1.1, and the lowest values were found with IC-1.4. Among the different compounds and regardless of the IC, the highest ARMV values were achieved with FC75. Specifically, the highest ARMV was recorded after FC75 aerosolization with IC-1.23 under a low PIP (20 cmH2O) and high RR (60 bpm) regime. However, the different ventilation strategies did not have a significant impact on FC75 aerosolization (Fig. 2, top, gray-lined empty bars).

Aerosolization (mL/min; gray-lined empty bars) and emission rates (mL/min; black-lined solid bars) during four different mechanical ventilation strategies [1. Peak inspiratory pressure (PIP) 20 cmH2O and respiratory rate (RR) 30 bpm; 2. PIP 20 cmH2O and RR 60 bpm; 3. PIP 35 cmH2O and RR 30 bpm; 4. PIP 35 cmH2O and RR 60 bpm] achieved with IC-1.23 (top), IC-1.1 (middle), and IC-1.4 (bottom), for FC75, PFOB, PFD, and surfactant. Differences between the aerosolization and emission rates correspond to the amount of compound lost during mechanical ventilation. Light gray and black asterisks represent statistically significant differences (p<0.05) between two ventilation strategies in the aerosolization rate, or in the emission rate respectively. Mean±SD are shown. ANOVA.
In contrast, the lowest ARMV values were found for PFD at high PIP (35 cmH2O) regardless of the RR with IC-1.4. On the other hand, at low PIP the ARMV value of PFD with IC-1.4 was significantly (p<0.05) affected by changes in RR (Fig. 2 bottom, gray-lined empty bars).
Indeed, at low PIP the ARMV values were significantly (p<0.05) affected by changes in RR in the cases of PFD and of surfactant with IC-1.23, and of PFOB with IC-1.1. Further, at high RR, changes in PIP significantly (p<0.05) influenced the ARMV values in the cases of PFOB with IC-1.1 and of surfactant with both IC-1.23 and IC-1.4 (Fig. 2, gray-lined empty bars).
Regardless of the aerosolized compound, the highest ERMV values were recorded after aerosolization with IC-1.23, followed by IC-1.1 and IC-1.4. Specifically, the highest aerosol ERMV was achieved with FC75 at a high PIP and low RR (30 bpm) using IC-1.23, whereas the lowest the ERMV was obtained after PFD aerosolization with IC-1.4. As a matter of fact, with IC-1.4 all of the four compounds tested in the present study showed emission rates below 0.08 mL/min during mechanical ventilation irrespective of the ventilation strategy.
The effect of the minute ventilation on the ERMV was investigated by changing in RR (30 or 60 bpm) and PIP (20 or 35 cmH2O). In the cases of IC-1.23 and IC-1.1, irrespective of the PIP, the ERMV of PFCs and surfactant were higher at low RR. In fact, at low PIP, moving to the higher RR produced significant decreases (p<0.05) in the ERMV of PFD and of surfactant with IC-1.23, and in the ERMV of FC75, PFOB, and PFD with IC-1.1. In addition, at high PIP, increasing the RR also produced significant decreases (p<0.05) in the ERMV of FC75 and PFD with both IC-1.23 and IC-1.1 (Fig. 2, shaded bars).
With IC-1.1, changes in PIP particularly affected the ERMV of PFCs. For instance, the ERMV of PFD and FC75 were significantly (p<0.05) influenced by changes in PIP both at high and at low RR. Further, the ERMV of PFOB with IC-1.1 was significantly (p<0.05) affected by changes in PIP at high RR (Fig. 2, middle, shaded bars). With IC-1.23, the ERMV of FC75 and surfactant were also affected by changes in PIP and again only at high RR.
PFCs/surfactant recovery percentage (RMV)
The calculation of the RMV reflects the ratio between the ARMV and ERMV, therefore representing the whole aerosolization process, including the amount of compound that disappears from the aerosol chamber, the amount deposited in the test lung, and the nondetected fraction. That said, with IC-1.23 and IC-1.4 the highest RMV were registered after surfactant aerosolization, ranging between 86–90% for IC-1.23 and between 40 and 60% for IC-1.4. With IC-1.1 the highest RMV values were registered after PFOB aerosolization (65–70%).
The influence of vapor pressure on PFC aerosolization was analyzed with the four different mechanical ventilation strategies. In this regard, the lowest RMV values were found with FC75, the PFC with the highest vapor pressure, regardless of the inhalation catheter. Specifically, with IC-1.1 and IC-1.4, the recovery percentage of FC75 significantly increased (p<0.05) with low PIP compared to high PIP. With similar vapor pressures, PFOB and PFD registered similar values of RMV with IC-1.23 (72–81%) and IC-1.4 (14–34%). However, with IC-1.1, the RMV was higher for PFOB (65–70%) than for PFD (55–65%). In addition, the RMV of PFD was significantly (p<0.05) affected by changes in PIP with both IC-1.23 and IC-1.1, being increased with low PIP (Fig. 3).

Percentage of the initial amount of FC75 (top left), PFOB (top right), PFD (bottom left), and surfactant (bottom right) recovered after a minute of mechanical ventilation with IC-1.23, IC-1.1, and IC-1.4. The different ventilation strategies [1. Peak inspiratory pressure (PIP) 20 cmH2O and respiratory rate (RR) 30 bpm; 2. PIP 20 cmH2O and RR 60 bpm; 3. PIP 35 cmH2O and RR 30 bpm; 4. PIP 35 cmH2O and RR 60 bpm] influence the compound recovery percentage. A black asterisk represents statistically significant difference (p<0.05) between two ventilation strategies. Mean±SD are shown. ANOVA.
Changes in RR at a given PIP also influenced the RMV. At high RR, the RMV was always lower, regardless of the compound or the IC, except after aerosolization of surfactant with IC-1.4 at low PIP.
Measurement of the intrapulmonary pressure added by the inhalation catheters during mechanical ventilation
The changes in intrapulmonary pressure produced by the air jets of each IC at the distal tip of the ETT (simulating their placement above the carina) were investigated with the four mechanical ventilation strategies. The greatest addition to the baseline intrapulmonary pressure was found with IC.1.1, at high PIP and high RR; before IC-1.1 was triggered, the intrapulmonary pressure was 35.32 cmH2O (i.e., during mechanical ventilation only) and after triggering IC-1.1 in synchrony with the ventilator the intrapulmonary pressure reached 39.28 cmH2O (i.e., mechanical ventilation+IC-1.1).
On the other hand, the air jets of IC-1.23 produced the smallest addition to the baseline intrapulmonary pressure regardless of the ventilation strategy. At low RR, the additional intrapulmonary pressure due to the ICs never exceeded 2 cmH2O, with the PIP set at either at 20 cmH2O (1.84 cmH2O) or 35 cmH2O (1.99 cmH2O). Last, an intrapulmonary pressure increase of about 3 cmH2O was registered for IC-1.4 irrespective of the ventilation strategy.
Discussion
The main finding of the present study is that even though changes in ventilator settings may significantly affect surfactant and PFC aerosolization, some types of inhalation catheters, namely, IC-1.23 and IC-1.1, are able to efficiently deliver PFC and surfactant aerosols to test lungs during mechanical ventilation. However, in our mechanical ventilation model, the performance of one of the catheters, IC-1.4, with PFC and surfactant was not adequate; for instance, during mechanical ventilation with this catheter up to 90% of the aerosolized FC75 was lost. Because differences in terms of density, vapor pressure, kinematic viscosity, and molecular structure of surfactants and PFCs have a significant impact on their aerosolization,(31) studies are warranted to explore whether the devices that are commercially available are able to achieve proper surfactant and PFC aerosolization and, in turn, effective delivery to the lungs in vivo.
In the report of a previous in vitro study on PFC aerosolization, it was suggested that the aerosol production rate might be enhanced with PFCs with higher vapor pressures and lower densities.(26,32) The results of this present study with PFCs partially agree with these findings. In particular, irrespective of the IC, the highest ARMV values were registered for FC75, the PFC with the highest vapor pressure and lowest density.
Kinematic viscosity may also play a relevant role in aerosol production rates. A previous study we conducted, on continuous aerosolization, showed that the PFCs with a higher kinematic viscosity were aerosolized at a lower rate (PFD, 2.7 cstokes<PFOB, 1.1 cstokes<FC75, 0.81 cstokes).(30) The present study conducted with the same PFCs but during mechanical ventilation yielded similar results with respect to the impact of kinematic viscosity. In addition, considering the density of natural surfactants (close to that of water) and their high kinematic viscosity,(33) the modest aerosol production rates observed in the present study after natural surfactant aerosolization would also be in accordance with this hypothesis.
During mechanical ventilation other biophysical properties such as vapor pressure may play a major role during PFC aerosolization. A higher vapor pressure might lead to smaller droplets(31) or even to the generation of PFC vapor, resulting in it reaching smaller airways but also promoting PFC loss during expiration. Irrespective of the IC used to produce the aerosols, we found a greater loss of PFC during mechanical ventilation for those PFCs with a higher vapor pressure. For instance, the RMV for FC75 (vapor pressure 63 mmHg at 37°C) aerosolization was the lowest, while the recovery for both PFD (14 mmHg at 37°C) and PFOB (11 mmHg at 37°C) with similar vapor pressure values was much higher with IC-1.23, and slightly higher for PFOB with IC-1.1 and IC-1.4. Unfortunately, due to the closeness between the kinematic viscosity values of PFOB, PFD, and FC75 and the vapor pressures of PFOB and PFD, no correlation analysis could be performed to determine the effect of these parameters on PFC aeroslization during mechanical ventilation.
Along with the biophysical properties of PFCs and surfactants, ventilator settings also influence aerosol delivery. In this regard, the effect of minute ventilation on PFC and surfactant aerosolization was investigated by changing PIP and RR. Gregor et al.(32) found a significant increase in PFC delivery, when the RR was increased at constant ventilation pressure, and when the PIP was raised at a given PEEP. In the present study we found statistically significant differences in the ARMV and the ERMV values of several of the compounds used in different ventilation strategies; however, the data do not show a clear pattern either for ARMV or for ERMV. Because small variations in ARMV condition the ERMV values it is necessary to consider the whole aerosolization process to identify the influence of the different ventilation strategies on aerosolization. Consequently, as the RMV of the surfactant and PFCs is derived from the ratio of ARMV and ERMV, this parameter being a better indicator of the influence of the changes in minute ventilation.
If RMV is considered, a clear pattern is observed during surfactant and PFC aerosolization. Higher values of RMV were obtained for both the surfactant and PFCs at low RR and low PIP, than at high RR and high PIP. This might seem to conflict with the findings of Gregor et al.(32) but the lack of agreement can be explained by differences in the in vitro setups. On the one hand, they placed the nebulizer prior to the ETT, whereas in our model surfactant and PFC aerosolization were performed at the distal end of the ETT tube. On the other hand, they measured the amount of PFC retained in a zeolite adsorber, and therefore the retained dose does not reflect the fraction of inhaled PFC that would be exhaled in vivo, whereas we measured the amount of surfactant and PFC deposited (not retained) in the test lung after a minute of inspiratory and expiratory phases. Even if these two in vitro models are not directly comparable, an important conclusion can be drawn considering both models: higher RRs and higher PIPs might enhance surfactant and PFC delivery to the lungs but might also increase compound loss during the expiratory phase.
The air flow required to achieve optimal aerosol particle sizes is usually 4–6 L/min.(34) In contrast, the ICs tested in the present study are operated with an associated gas flow below 1.5 L/min, which might be of particular interest if aerosol therapy is carried out in pediatric and neonatal populations.(24) However, concerned about the high pressure at which the ICs are operated (6.9 bar), we decided to measure the intrapulmonary pressure changes that might occur after the placement of the aerosol-generating tip ICs above the carina. Unfortunately, no compound could be used for the assessment of the intrapulmonary pressure contribution of the ICs, due to the known disturbances caused by surfactant and PFCs on the measurements of the pneumotachograph,(35) and therefore, the additional intrapulmonary pressure just reflects the contribution of each air jet of the ICs. Although the intrapulmonary pressure increased by up to 4 cmH2O during pressure measurements with IC-1.1, on average an intrapulmonary pressure increase of around 2–3 cmH2O should be considered during mechanical ventilation for the three ICs across this range of ventilation settings (Fig. 4). This increase should be carefully considered if the ventilator is pressure controlled as changes in the intrapulmonary pressure might occur while the PIP remains unchanged.
Representative intrapulmonary pressure (P pulm) curves obtained during mechanical ventilation alone (MV; solid lines) and during mechanical ventilation in synchrony with IC-1.1 (MV+IC-1.1; top; dotted line), IC-1.23 (MV+IC1.23; middle; dotted line) and IC-1.4 (MV+IC-1.4; bottom; dotted line) with the mechanical ventilator set at a peak inspiratory pressure (PIP) of 20 cmH2O and a respiratory rate (RR) of 60 bpm. Neither perfluorocarbons nor surfactant was aerosolized during the intrapulmonary pressure measurements. The additional intrapulmonary pressure just reflects the contribution of each air jet of the inhalation catheters.
Our findings suggest that this type of system, in particular using either IC-1.23 or IC-1.1, could dramatically increase the amount of surfactant and PFC reaching the lungs. Together with high emission rates, the particle size measured in terms of mass median aerodynamic diameter (MMAD) for all the PFCs with IC-1.1 (FC75 0.78 μm, PFD 0.77 μm, and PFOB 4.48 μm) and for FC75 with IC-1.23 (4.84 μm) was below 5 μm,(30) and therefore suitable for deep lung delivery. In the cases of IC-1.1 with surfactant (8.29 μm) and IC-1.23 with PFD (12.35 μm), PFOB (13.42 μm), and surfactant (10.64 μm)(30) a larger MMAD value might not be a problem if the ICs are placed intratracheally, because particles with a diameter greater than 5 μm could reach the lungs along with finer particles that could penetrate further into the smaller airways for deep lung delivery.(29) However, the clinical or experimental use of this delivery system with surfactant and PFCs will remain unclear until in vivo data are available.
Limitations of the study
To allow comparison to previous studies with PFCs,(26,30,32) the present study was conducted at room temperature and in a dry circuit. Humidity and a higher temperature in vivo might therefore alter the results. The gravimetric method allowed us to determine how much compound left the aerosol chamber and how much ended up in the test lung. However, what happened to the fractions of PFC or surfactant that were not recovered remains speculative; a mass balance approach should be used in further in vitro studies involving surfactant or PFCs.
Finally, our experimental setup was composed of a neonatal mechanical ventilator, an ETT with an internal diameter of 4 mm, and a simple passive test lung. The lungs were not modeled. As many children who benefit from surfactant require ETTs in the 2.5–3.5 mm internal diameter range, the expiratory resistance might be further increased by the use of ICs. The additional intrapulmonary pressure just reflects the contribution of each air jet of the inhalation catheters, and therefore, the effect of PFC or surfactant aerosolization on the intrapulmonary pressure remains unknown. These limitations and other issues should be addressed in further in vitro and in vivo studies.
In conclusion, despite mechanical ventilation, IC-1.23 and IC-1.1 were able to deliver significant amounts of surfactant and PFC to the lung model. Changes in PIP and RR directly influence the percentage of surfactant and PFC recovered.
Footnotes
Acknowledgments
This study was partially supported by The Carlos III Health Institute: FIS 07/733 and RD08/072 (Red SAMID: Maternal, Child Health and Development Network within the framework of the VI National R+D+i Plan 2008-2011) and the Government of the Basque Country (2007111046).
Author Disclosure Statement
The authors declare that no conflicting financial interests exist.