
Abstract
Abstract
Radiolabeling of pharmaceutical inhalation aerosols began in the late 1970s. Since then, well over 100 studies have been published. These studies have documented lung deposition for all inhalation dosage forms; pressurized metered dose inhalers (pMDIs), dry powder inhalers (DPIs), soft mist inhalers (SMIs), and nebulizers. They have provided valuable insight into the factors that influence total and regional lung deposition. Taken globally, this collection of data has recently been used to elucidate the influence of intersubject variability in head geometry on total lung deposition, showing good correspondence between theory and experiment. The analysis reported here is an attempt to take this data set one step “deeper” into the airways and understand the relationship between P/C ratio, derived from 2D imaging, and a more anatomically relevant biological distribution within the lung, 24-h clearance. Intersubject variability in regional deposition is also analyzed, although due to the sparse nature of the reported individual data only tentative conclusions can be drawn. Many different techniques for derivation and analysis of scintigraphic data have been reported in the literature, and this leads to some difficulties when performing the “meta-analyses” reported below. In this regard it is recommended that standardization of scintigraphy techniques should be a future goal.
Introduction
Since the advent of inhalation therapy a good deal of effort has been devoted to understanding the site of action of the various molecular therapies. The current belief is that anticollinegics need to be delivered more centrally than β2-agonists, and that steroids are needed in the peripheral airspaces.(9) Matching, or targeting, aerosol distributions with receptor distributions within the lungs is thus a potentially attractive proposition. It would, in principle, allow effective therapy at lower doses because drug would not be wasted at unnecessary locations and the lower dose would increase the margin between effective therapy and systemic side effects even more than is currently achieved by whole lung targeting. Recent studies with monodispered aerosols appear to indicate that manipulation of particle size, all be it in a laboratory situation, can potentially shift the dose–response curve in relation to the inhaled dose.(10) These types of studies, however, are carried out in very limited numbers of volunteers and the results from similar studies can be variable and contradictory.(11,12) The question that needs to be answered is, with the documented biological variability in both oropharyngeal and conducting airway geometry(13,14) and the consequential effect on variability in deposition patterns, can any reliable form of targeting, that is, targeting to specific lung regions or specific airway generation, really be achieved in a general population.
The published gamma camera deposition studies would appear, when combined with empirical modeling,(7,8) to be capable of answering this question at least at a qualitative level. A measure of lung distribution is generally included in most deposition studies in the form of a peripheral to central index (P/C ratio). Although only limited analysis is possible because of the differing techniques and zone definitions (P/C regions of interest) applied by different study centers,(15) there does appear to be sufficient data to draw some valuable conclusions.
This article thus sets out to develop a perspective on the usefulness and meaning of P/C ratio. Because 24-h retention represents a more physiological measure of aerosol distribution in the lung,(16) compared to the spatial distribution derived from scintigraphy, correlations between the two will be used as a means of “validating” the relevance of P/C ratios. In a similar fashion to Borgstrom et al., the literature on biological variability of airway geometry and aerosol deposition generated by the occupational exposure and industrial hygiene groups will then be used to model the expected deposition and variability in lung distribution patterns.
Methods
Literature survey
The following analysis is based on a literature search of peer reviewed journals and conference proceedings for reports detailing gamma scintigraphic studies of lung deposition from pharmaceutical inhalation products. In particular, the search was targeted at reports where some measure of regional lung distribution was presented. It was apparent early in the literature search that each study center employed their own methodology for assessing/describing regional distribution. Thus, after the initial phase the survey focused on the center with the highest number of reports. This facilitated comparisons where the same definition and method for describing regional distributions was used. Further, the analysis focused only on pMDIs, DPIs, and SMIs as different theoretical models are required to analyze nebulizer deposition data, and because the majority of the papers found related to these three modalities. The following analysis therefore focuses on studies performed by Newman and coworkers over a period from 1982 to the present.
In addition, a search was performed for reports detailing the relationship between regional distribution, determined by scintigraphy, with other more anatomically relevant methods. This part of the search was mainly targeted at articles where some measure of penetration index was correlated to 24-h clearance/retention measurements. These data allowed an investigation of the relevance of the spatial distributions determined by gamma-imaging to more anatomically and physiologically relevant lung compartments. In particular, one report (to be discussed below) allowed insight into the relationship between the methods of Newman and coworkers to determine P/C ratios and regional distribution as defined by 24-h retention. This report also allowed P/C values to be interpreted with reference to theoretical deposition models. The models chosen were the semiempirical model of Sthalhofen et al.(7) and the model developed by Thiel,(17) which is an adaptation of the Sthalhofen model, that accounts for the dynamic behavior of pharmaceutical aerosols.
Theoretical modeling
In order to interpret the regional lung distribution data derived from the literature survey two theoretical models were employed.
The first was the semiempirical model developed by Stahlhofen.(7) The Stahlhofen model, in the algebraic form presented by Rudolf,(8) is based on a meta-analysis of a number of data sets from different laboratories and is essentially a group of fitted algebraic equations defining deposition in the three airway compartment, the oropharynx, the conducting (ciliated) airways, and the peripheral (nonciliated) airways. The data sets themselves were all obtained under controlled flow rates and inhaled volumes. The algebraic model allows the computation of total lung deposition and regional distribution (based on 24-h clearance/retention). The model was modified to account for pharmaceutical aerosol inhalation breathing patterns by assuming total lung deposition is equal to the inhaled dose minus that deposited in the head and oropharynx. That is, the exhaled fraction was assumed to be zero. This assumption is supported by the majority of the scintigraphy data, and all of those used in this analysis, which show that less 1–2% of the inhaled dose is exhaled for pMDI and DPIs. (A notable exception to this is QVAR when inhaled without a breathhold,(17) but the assumption is valid for data used in this analysis.) In addition to calculating mean deposition values the coefficients for the 95% confidence limits around the mean given by the model allow an assessment of expected variability about the mean. This model and the 95% confidence coefficients were used to calculate mean lung deposition, conducting airway (ciliated airway) deposition, and the expected variability about the mean values for log-normally distributed aerosols of various mass median aerodynamic diameters and geometric standard deviations.
The second model was that developed and reported by Thiel.(17) The Stahlhofen/Rudolf model was developed to describe deposition from “stable” inhalation aerosols under occupational exposure conditions. Thiel's model, while built upon Stahlhofen's model, was designed to take into account the dynamic and multimodal nature of pharmaceutical inhalation aerosols. Mathematically, the model separates the ballistic component of a pMDI, or coarse mode for a DPI, of the inhaled aerosol from the “true” aerosol, the “true” aerosol component being defined by a log-normal fit to the lower mode of the aerosol size distribution. It then assumes the ballistic component (or coarse mode) deposits completely in the head and oropharynx. Oral deposition from the “true” aerosol is then added to calculate the total orophayngeal deposition. The remaining fraction is assumed to be the lung dose. Finally, the distribution within the airways is computed using the standard Rudolf equations. This second model was used selectively on papers where sufficient aerosol size information was available to facilitate calculation (unfortunately, a very limited subset of the total data). The model was used to “remove” the ballistic component from the experimentally determined orally deposited fraction in order to facilitate comparisons between the theoretical lung deposition and P/C ratio. Thus, it was used to help explain deviations between the reported regional lung distribution and those predicted by the Stahlhofen model.
Finally a correlation developed from data reported by Newman et al.(18) between P/C and 24-h retention was used to facilitate comparison of the theoretical models with published P/C values.
Results
Relationship between Penetration index and 24-h clearance/retention
The measure of regional distribution within the lung most frequently included in planar scintigraphy studies is the penetration index (P/C ratio). Although P/C is defined differently by each study group the general principle is to ratio the specific activity, from an inhaled radiolabeled aerosol, in the peripheral area of the lung image to that in the center. This ratio, although generally considered to be qualitative in nature, is assumed to give a measure of regional distribution. A number of articles were found that detailed the relationship between penetration index and 24-hr clearance, and these will be discussed later. However, only two relevant published comparisons of P/C ratio to 24-h clearance measurements(18,19) were found during the literature search. These studies used insoluble materials such as sulfur or iron colloid as the substrate for the label to ensure clearance over the 24-h period was solely due to material being removed for the conducting airway by mucocillary clearance. The activity remaining after 24 h therefore represented that fraction of the aerosol deposited in the peripheral, nonciliated, airways. These data allow “calibration” of P/C to a more relevant anatomical measure of regional deposition. It should be noted here that these data were obtained in normal subjects and, although the correlations should be relevant, caution should be applied if they are assumed to apply directly to a patient population.
The data are summarized in Figure 1, where 24-h retention is plotted against P/C ratio. The two sets of data from different laboratories each show reasonable correlations between the two parameters. Perhaps not surprisingly, however, each data set shows a different relationship. The data of Clark(19) are obtained using a transmission scan from a flood source to define the regions of interest and the counts were normalized to area. The data of Newman(18) were obtained using krypton gas scans to define the regions of interest and the count ratios were not normalized to area. Also presented in the figure is a least-squares regression line for the Newman et al. data set. This fitted equation was used in the analysis and help interpretate the P/C ratio data described below.
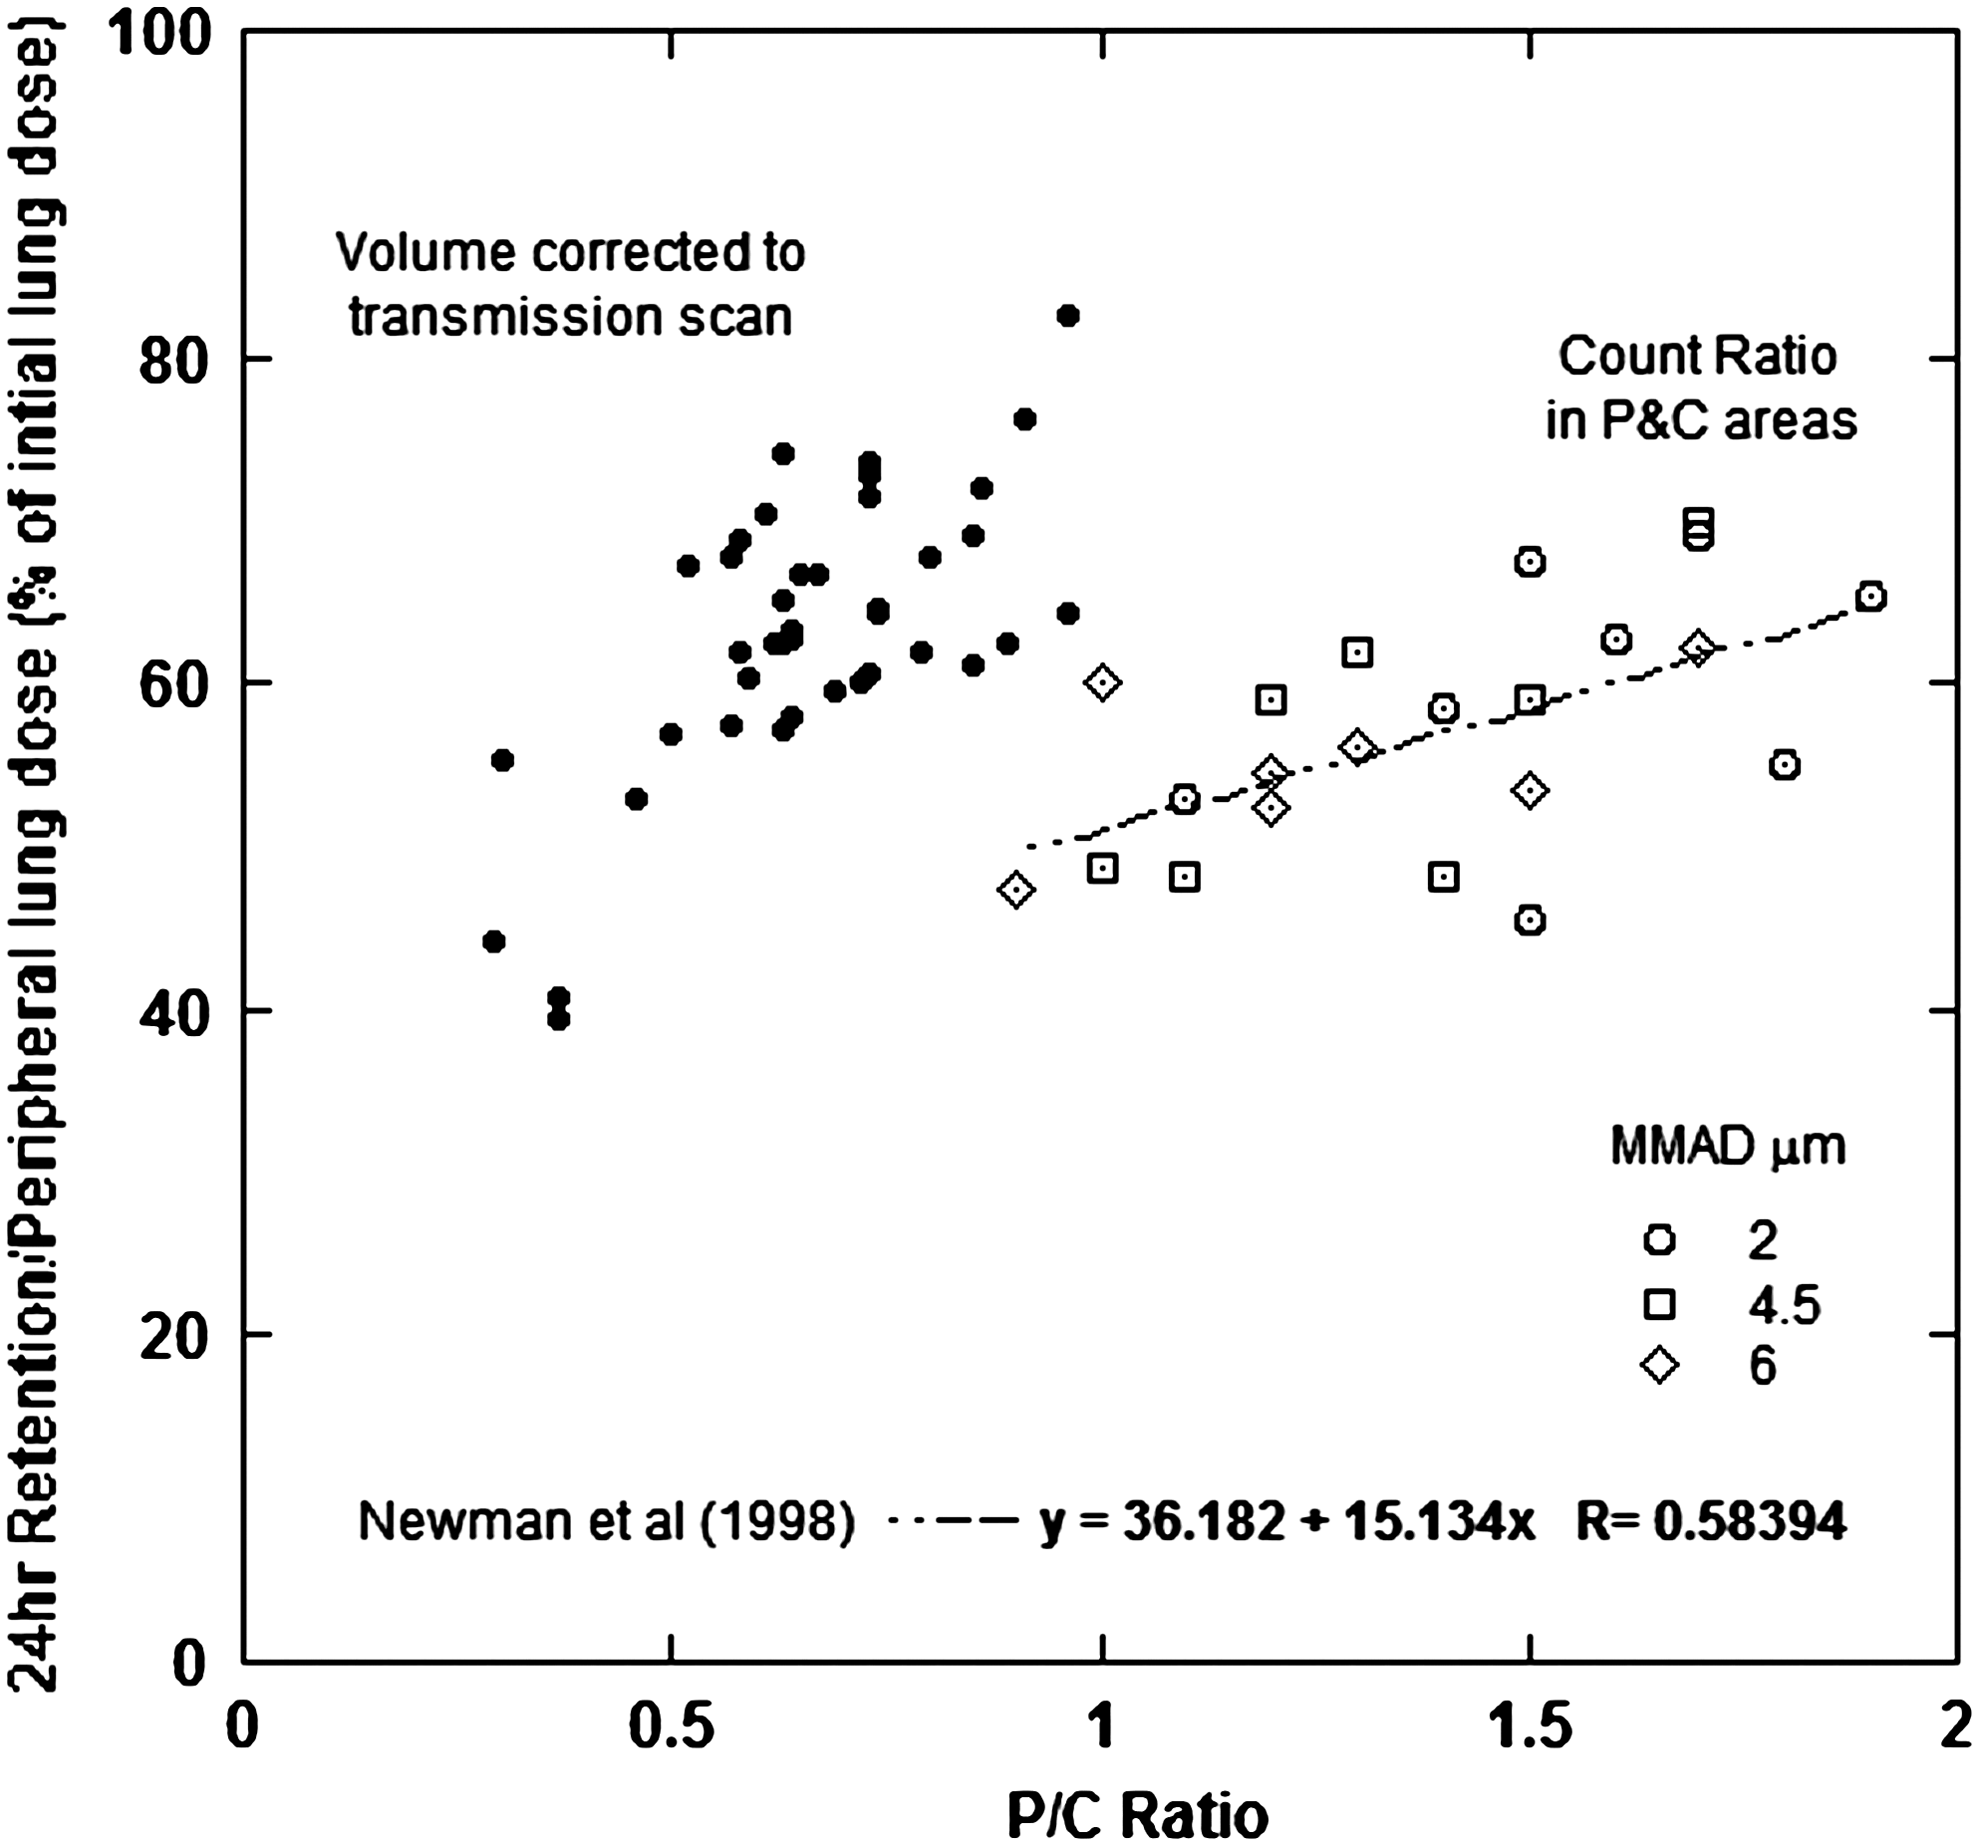
It is worthy of note here that the data presented in Figure 1 were generated using three nebulizers which each produced aerosols of different median size; 2.5, 4, and 6 μm, respectively. Statistical analysis showed that aerosol size was not a significant factor in controlling 24-h retention, 59, 56, and 55%, respectively, but that there was a significant difference in P/C ratio, 1.56, 1.31, and 1.26, respectively. The 2.5-μm aerosol produced a statistically higher P/C ratio than the other two, coarser, aerosols, and a small trend was observed in both 24-h retention and P/C ratio. These small differences in regional lung deposition are in line with previous work, which suggests that there should be little difference in the regional deposition profiles from nebulized aerosols in this size range.(20)
Relationship between penetration index and total lung deposition
Overall, 90 articles were discovered detailing deposition and lung distribution. Thirty-seven of these were from Newman and coworkers,(21–58) and these data are summarized in Figure 2. The abscissa is reported as P/C ratio, the ordinate is reported as total lung deposition expressed as a fraction of the inhaled dose. The theory line presented in the figure is derived by applying the Sthalhofen deposition model to log-normally distributed aerosols with various mass mean aerodynamic diameters, a geometric standard deviations of 2.0, and assuming an inhaled volume of 2 liters.
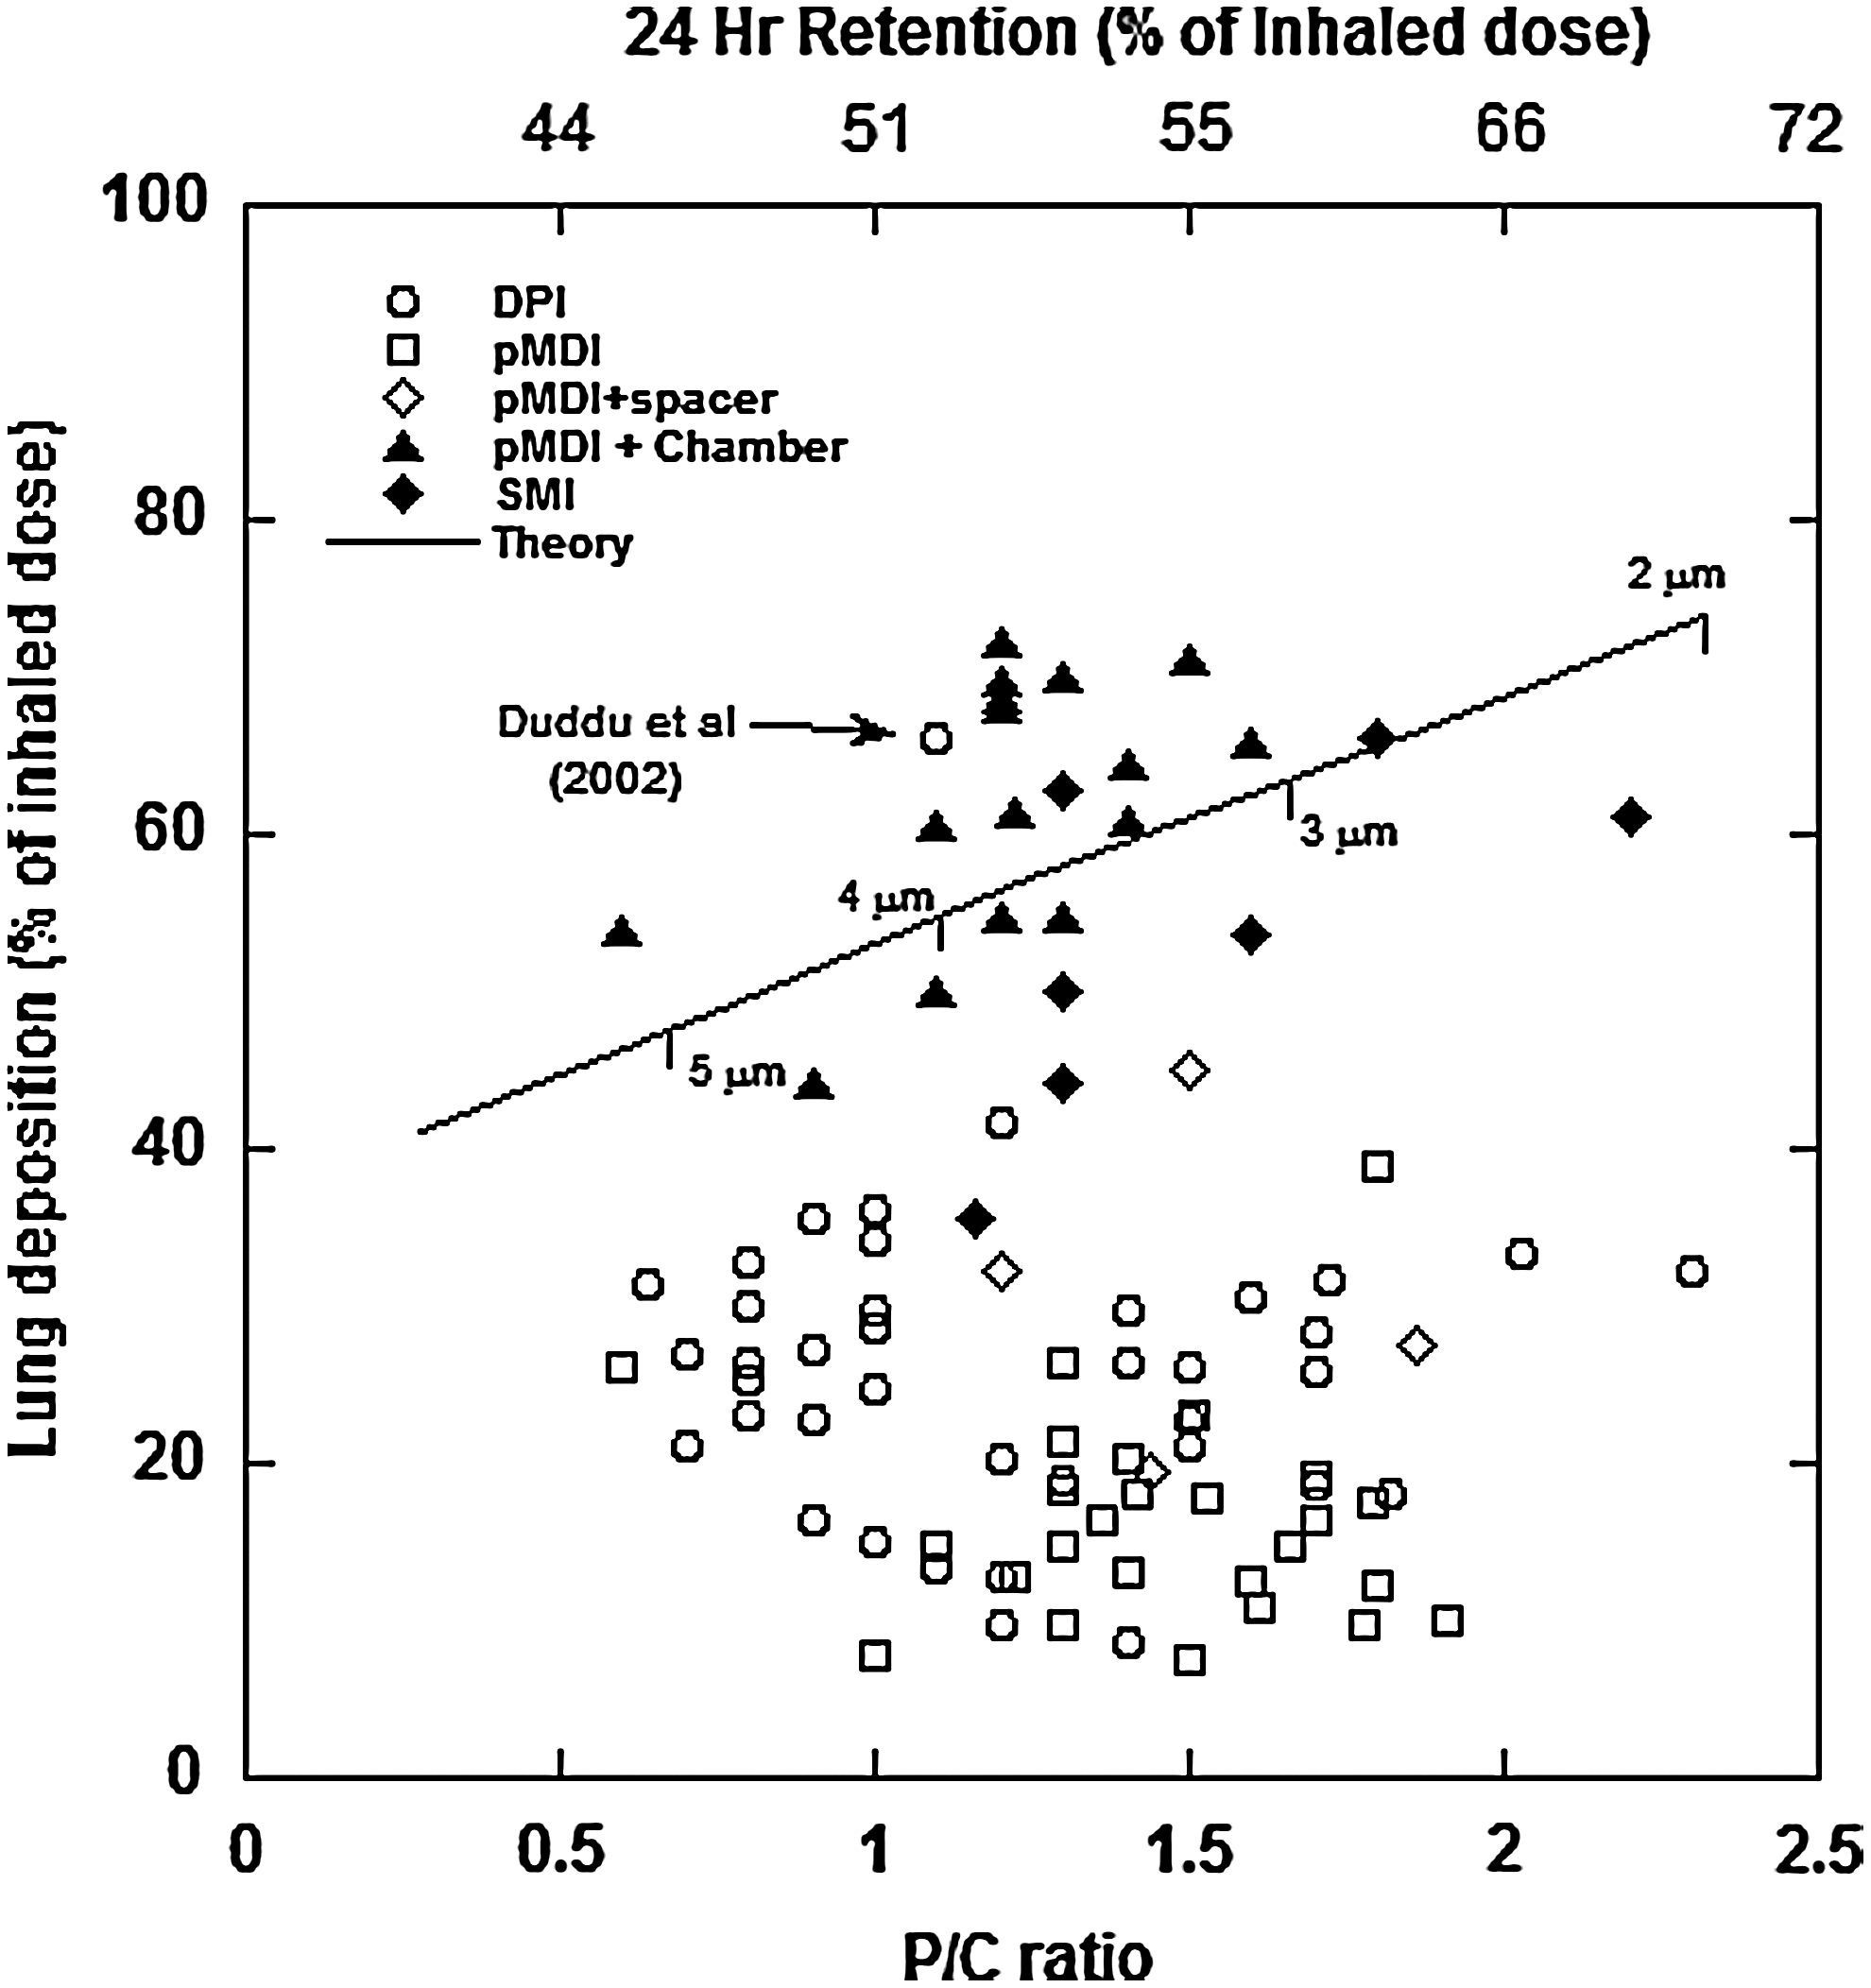
A plot of lung deposition versus P/C ratio for data from 37 papers (containing 97 study arms) published by Newman and coworkers(18) between 1982 and the present. The theoretical line was derived using the algebraic representation of Sthalhofen's model(7) given by Rudolf.(8) The upper abscissa is 24-h retention calculated using the model. The MMAD values placed on the theory line correspond to an inhaled flow rate of 60 L/min. The equivalent D2Q values are 25,000, 16,000, 9000, and 4000 μm2·mL·s and diameters corresponding to other inhalation flow rates can be readily calculated using these d2Q values.
Thence, calculating equivalent P/C ratios using the relationship presented in Figure 1 (lower X axis). (It should be noted that in the 24 retention range of 40–75% the theoretical relationship between 24-hour retention and total lung deposition was found to be only weakly dependent upon the geometric standard deviation (GSD); thus. only a single theory line is plotted in Fig. 2).
The Sthalhofen model is formulated in terms of aerosol Stokes number, which is proportional to the product of the aerodynamic diameter squared multiplied by the inhaled flow rate. For illustrative purposes a flow rate of 60 liters per minutes was assumed as typical for the inhaled flow used with pharmaceutical aerosols and the equivalent mass median aerodynamic diameters (MMADs) are shown on the theory line. The diameters shown can readily be recalculated using the d2Q values for other flow rates (e.g., at a flow rate of 30 liters per minute the diameter sequence shown would be 7, 5.6, 4.2, and 2.8 μm, respectively). For illustrative purposes the upper x-axis shows the 24-h retention values as calculated directly for the Sthalhofen model.
It is apparent from Figure 2 that there is a reasonable agreement between theoretical expectations and measured values for those aerosol systems that deliver “stable” monomodal aerosols, that is, pMDI plus holding chambers and SMIs. For those aerosols with highly dynamic components (pMDIs) and those with marked aerosol bimodality (DPIs) the data are not fitted by the model.
Five out of the 37 articles found used the Andersen cascade impactor to validate the effects of the radiolabeling process.(21,35,47,53,54) It was felt that these papers contained aerosol size data with sufficient resolution and sufficient flow rate information to apply the Thiel model. Figure 3 presents the results of calculating what the whole-lung deposition would have been if the dynamic or bimodal nature of the aerosol is theoretically “removed.” With the exception of two pMDI data points it can be seen that that the data more closely follows theoretical expectations. This would indicate that whole-lung deposition is primarily controlled by the ballistic/bimodal nature of these aerosols, whereas the P/C index is controlled by the nature of the “true” aerosol distribution. It should also be noted that despite the many and varied nature of the aerosol delivery systems 24-h clearance values only range from 50% to 70% of the inhaled dose. That is the “peripheral” lung dose only changes by 20–30%.
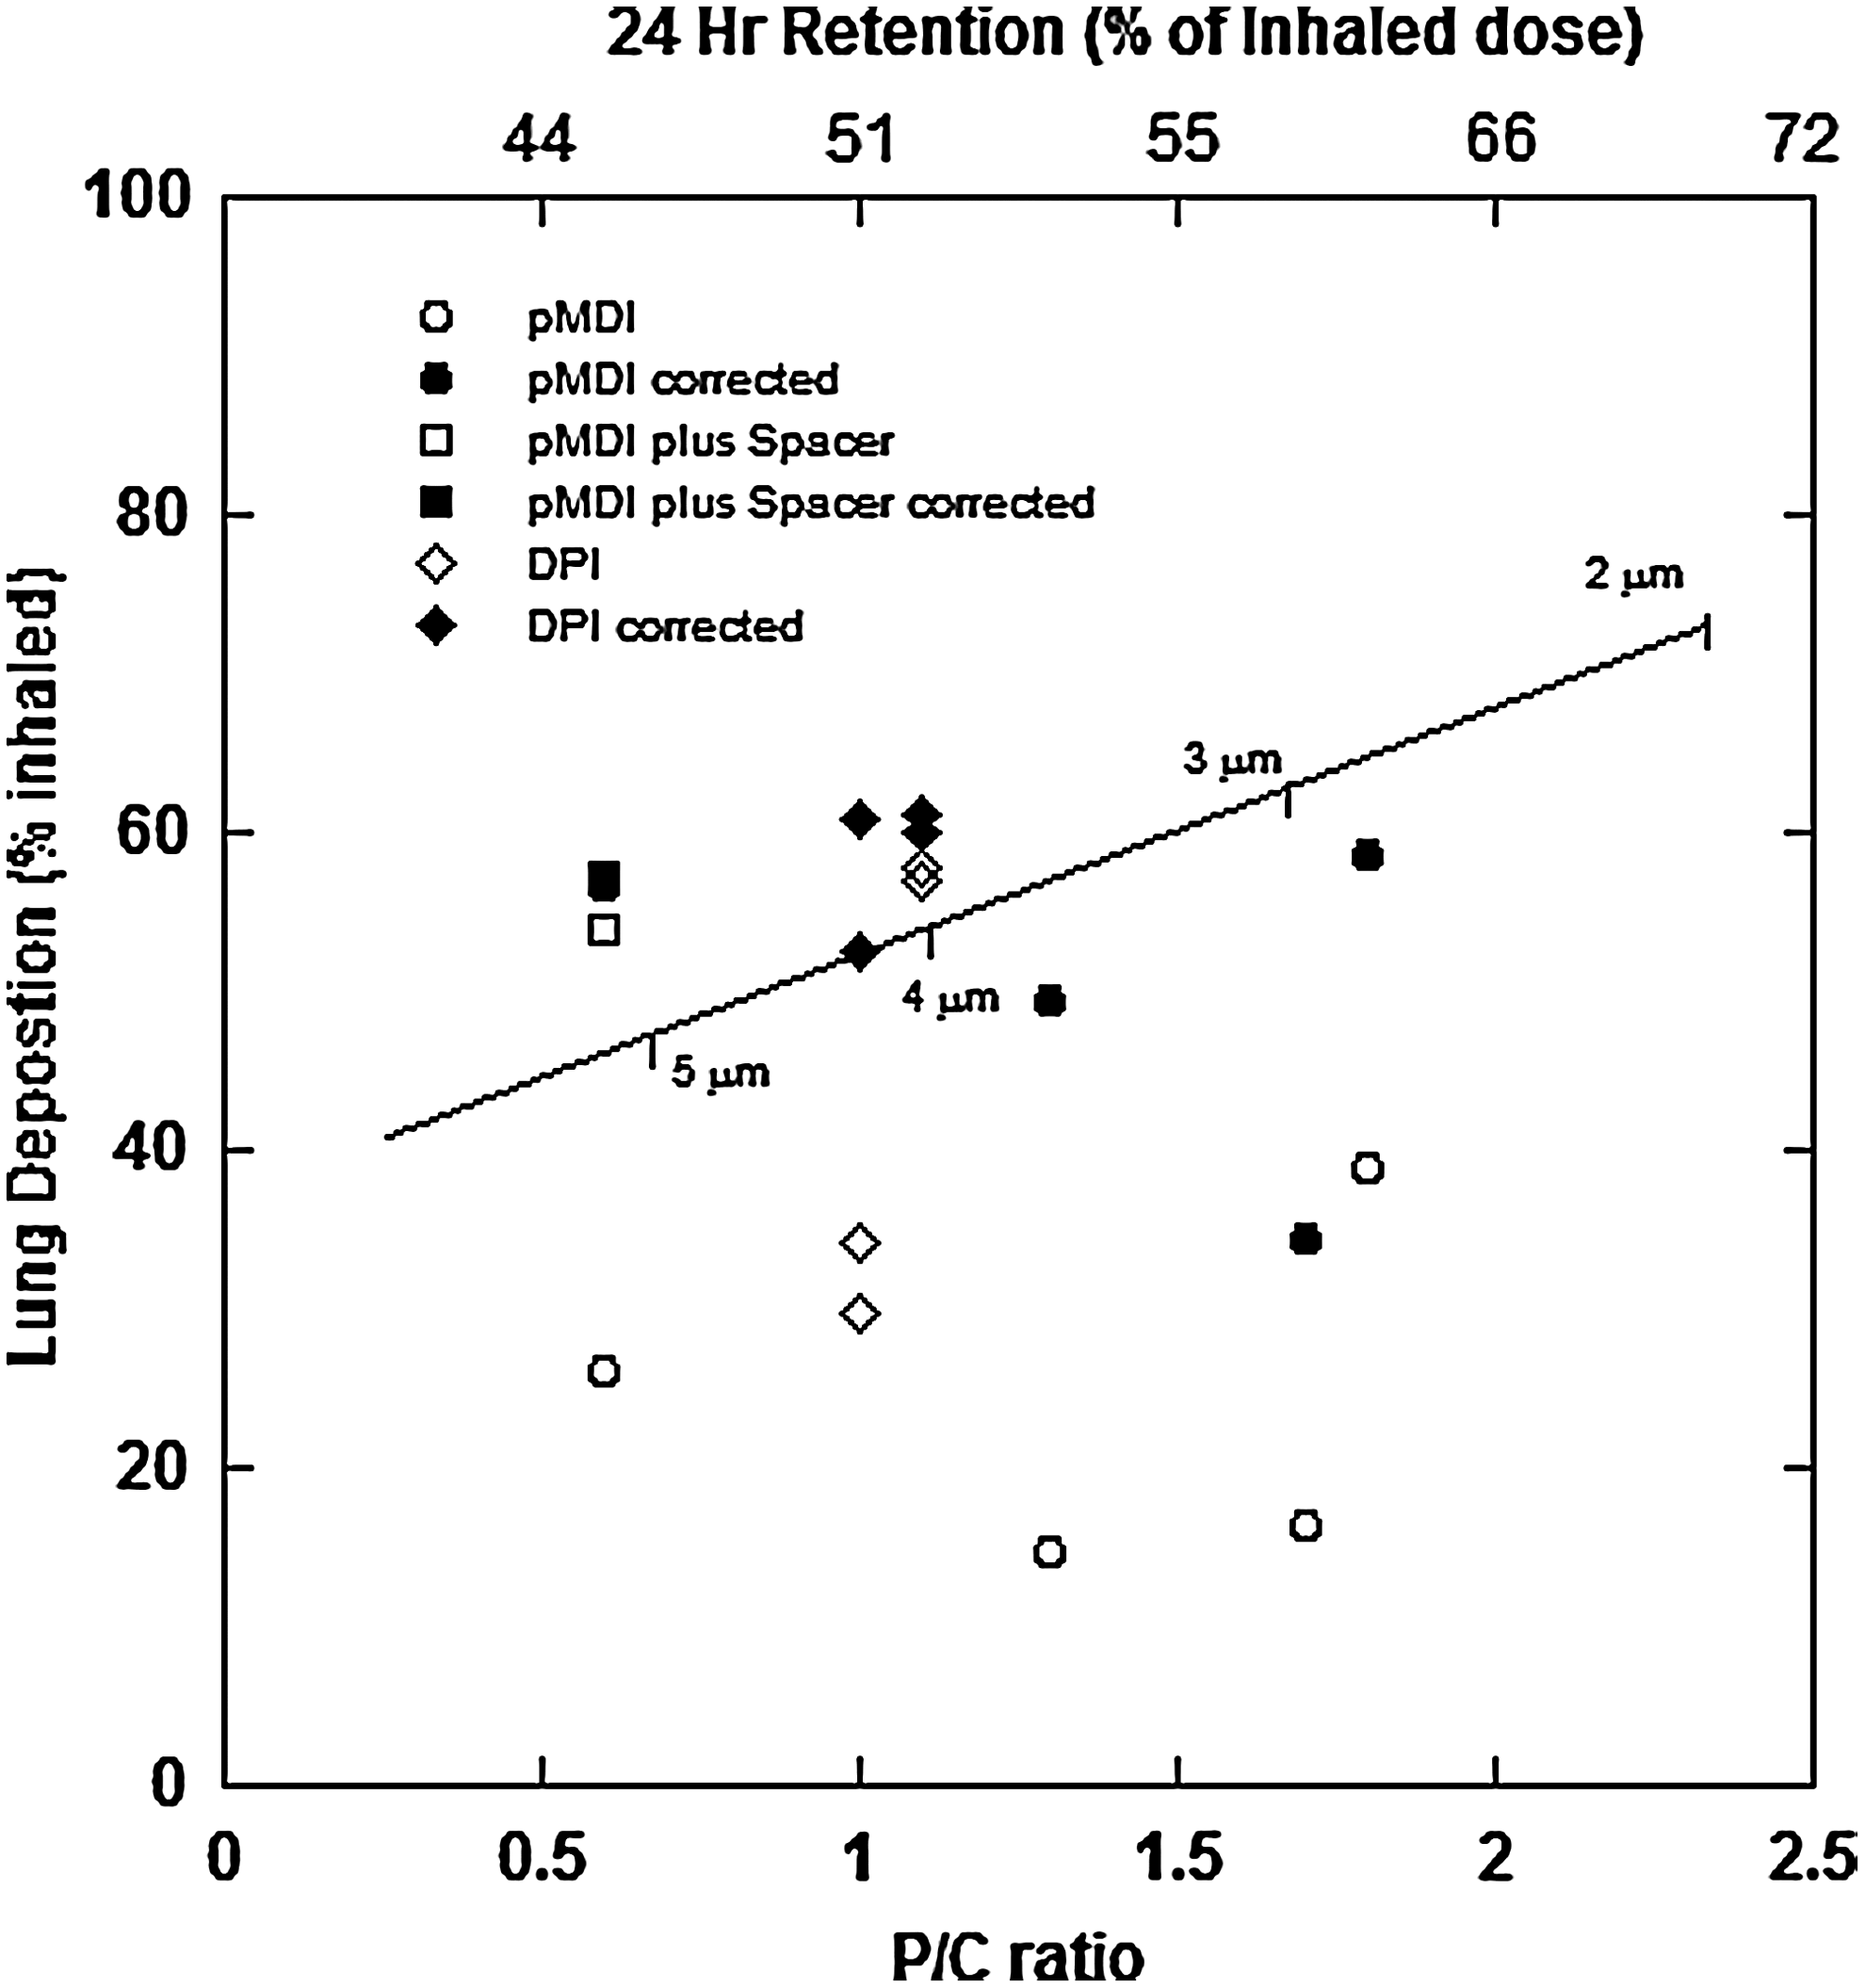
A plot of theoretical lung deposition versus P/C ratio for five studies where the Andersen impactor was used to measure the size distributions of the inhaled aerosols.(21,35,47,53,54) Lung deposition was calculated using the model proposed by Thiel,(17) which compensates for the ballistic or bimodal nature of pMDI and DPI aerosols.
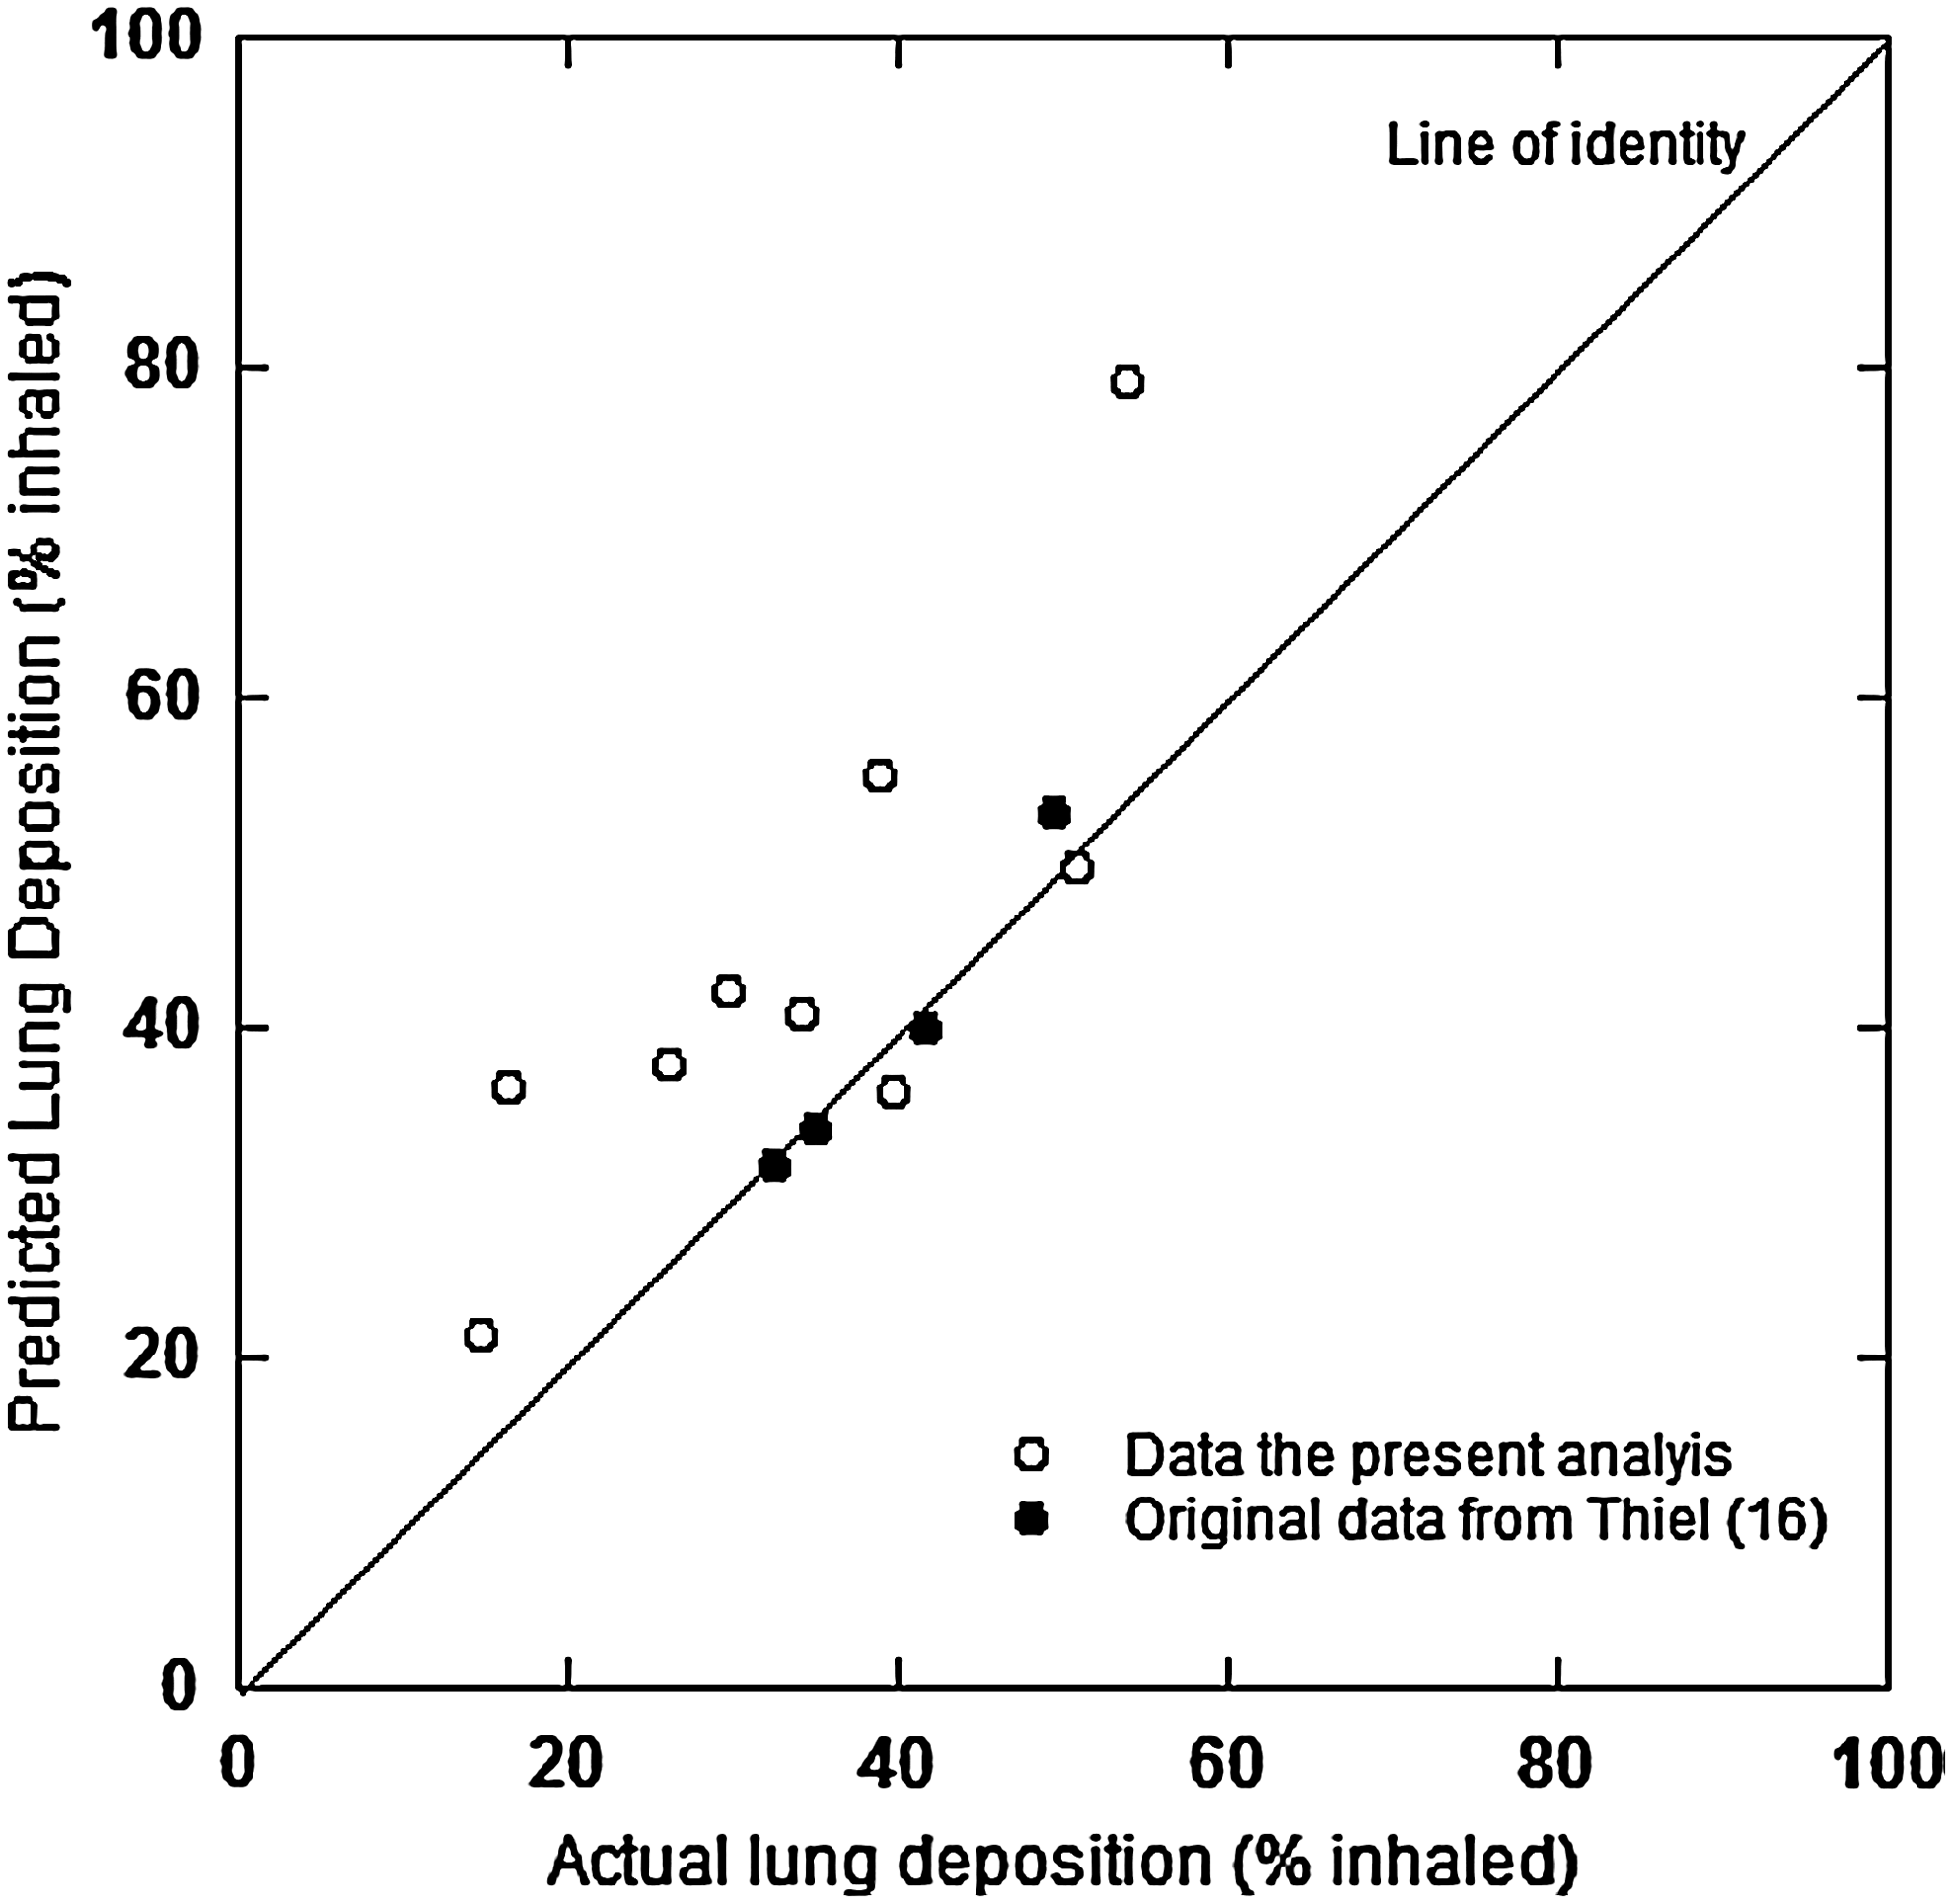
As a check on the accuracy of Thiel's model whole lung deposition was also computed from data in each of the five articles, and this was compared to the experimental determined values. Figure 4 present this comparison. For completeness the data previously report by Thiel(17) is included. It can be seen that the model tends to overestimate whole lung deposition slightly, but that the agreement is not unreasonable for this type of calculation.
Effects of airways disease on P/C ratio
Figure 5 presents the P/C/lung deposition plot for volunteers with Asthma or COPD versus those with normal airways. Although subtle, it is apparent that in general volunteers with airways disease have lower P/C ratios than normals. However, the interpretation of this plot is confounded by the fact none of the studies reported in the figure were of a parallel group design (airways disease vs. normals) and the two groups were not balanced in terms of the number and type of aerosol delivery modality used. Because of these inbalances no formal statistical analysis was performed. Thus, this conclusion, although supported by other published data,(18) remains qualitative in nature.
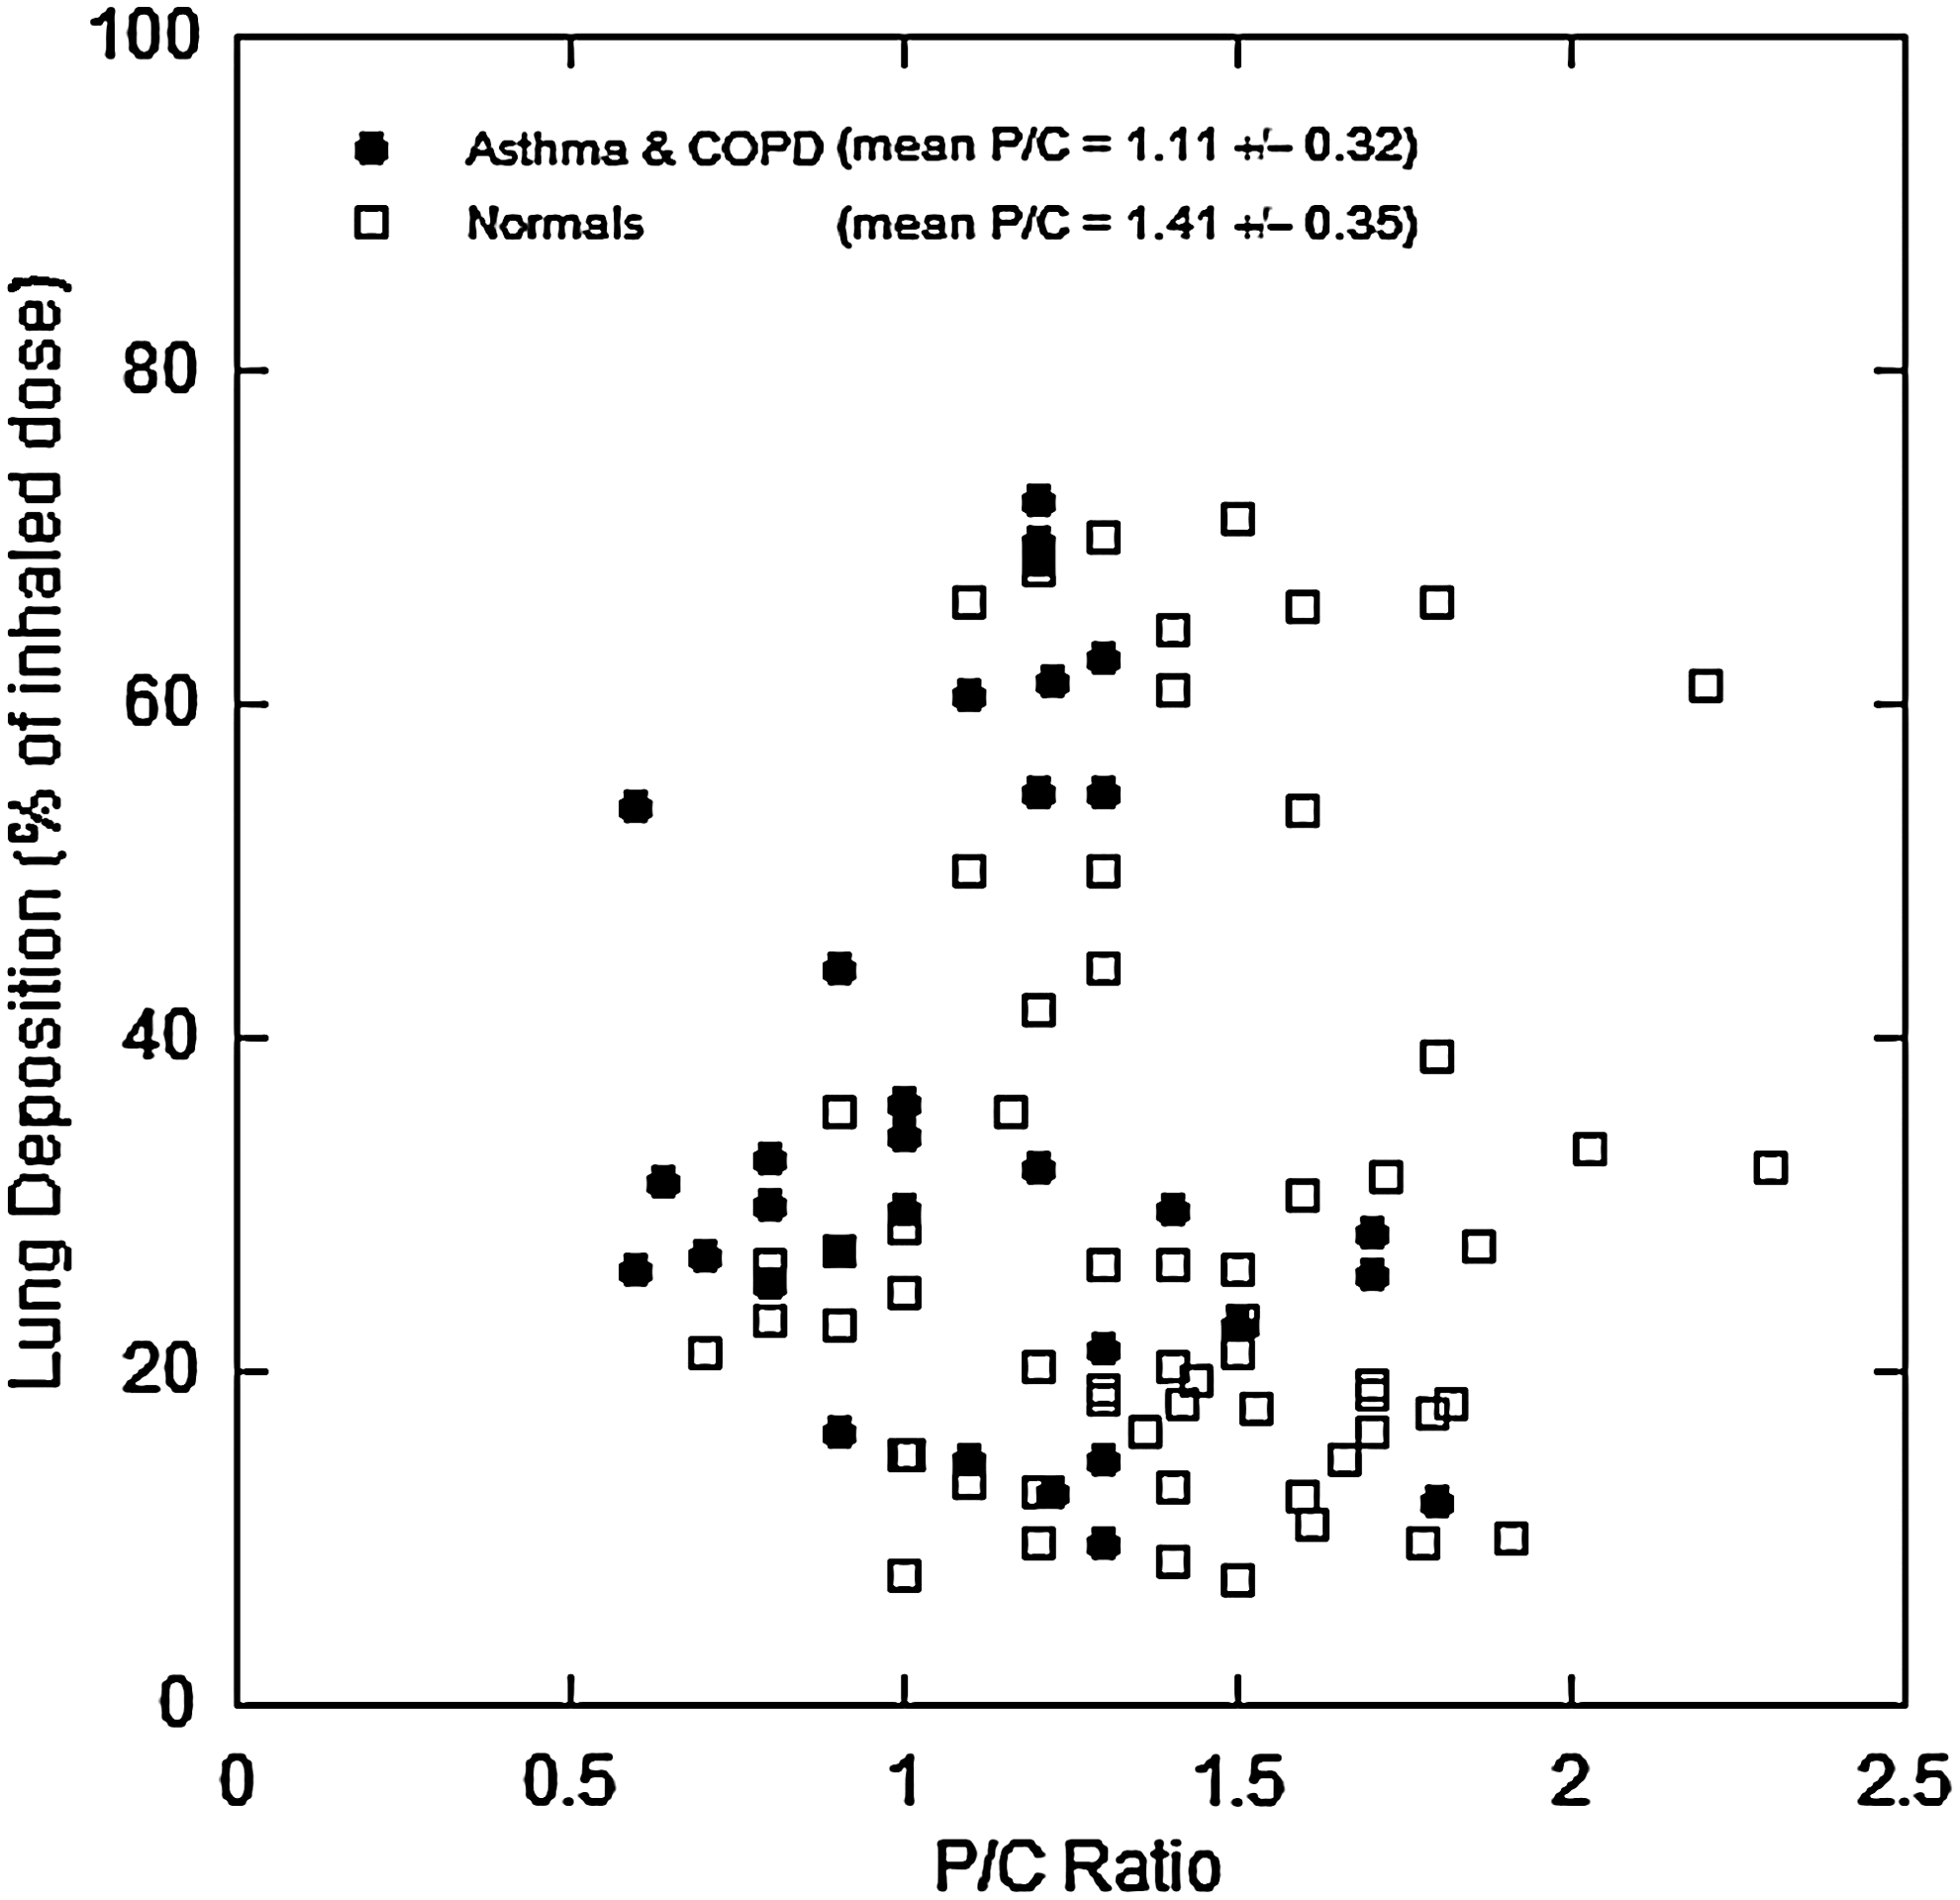
A comparison of the P/C ratios in healthy volunteers to those with COPD and asthma.
Intersubject variability
Out of the 37 articles detailing P/C ratios only four were found to contain individual P/C values.(29,30,33,48) These data are summarized by study in Figure 6A–D. The P/C values have been plotted in ascending order by volunteer to exemplify the rather dramatic effect of subject. It can be seen that in every study the effect of delivery modality on P/C ratio is far less than the subject effect.
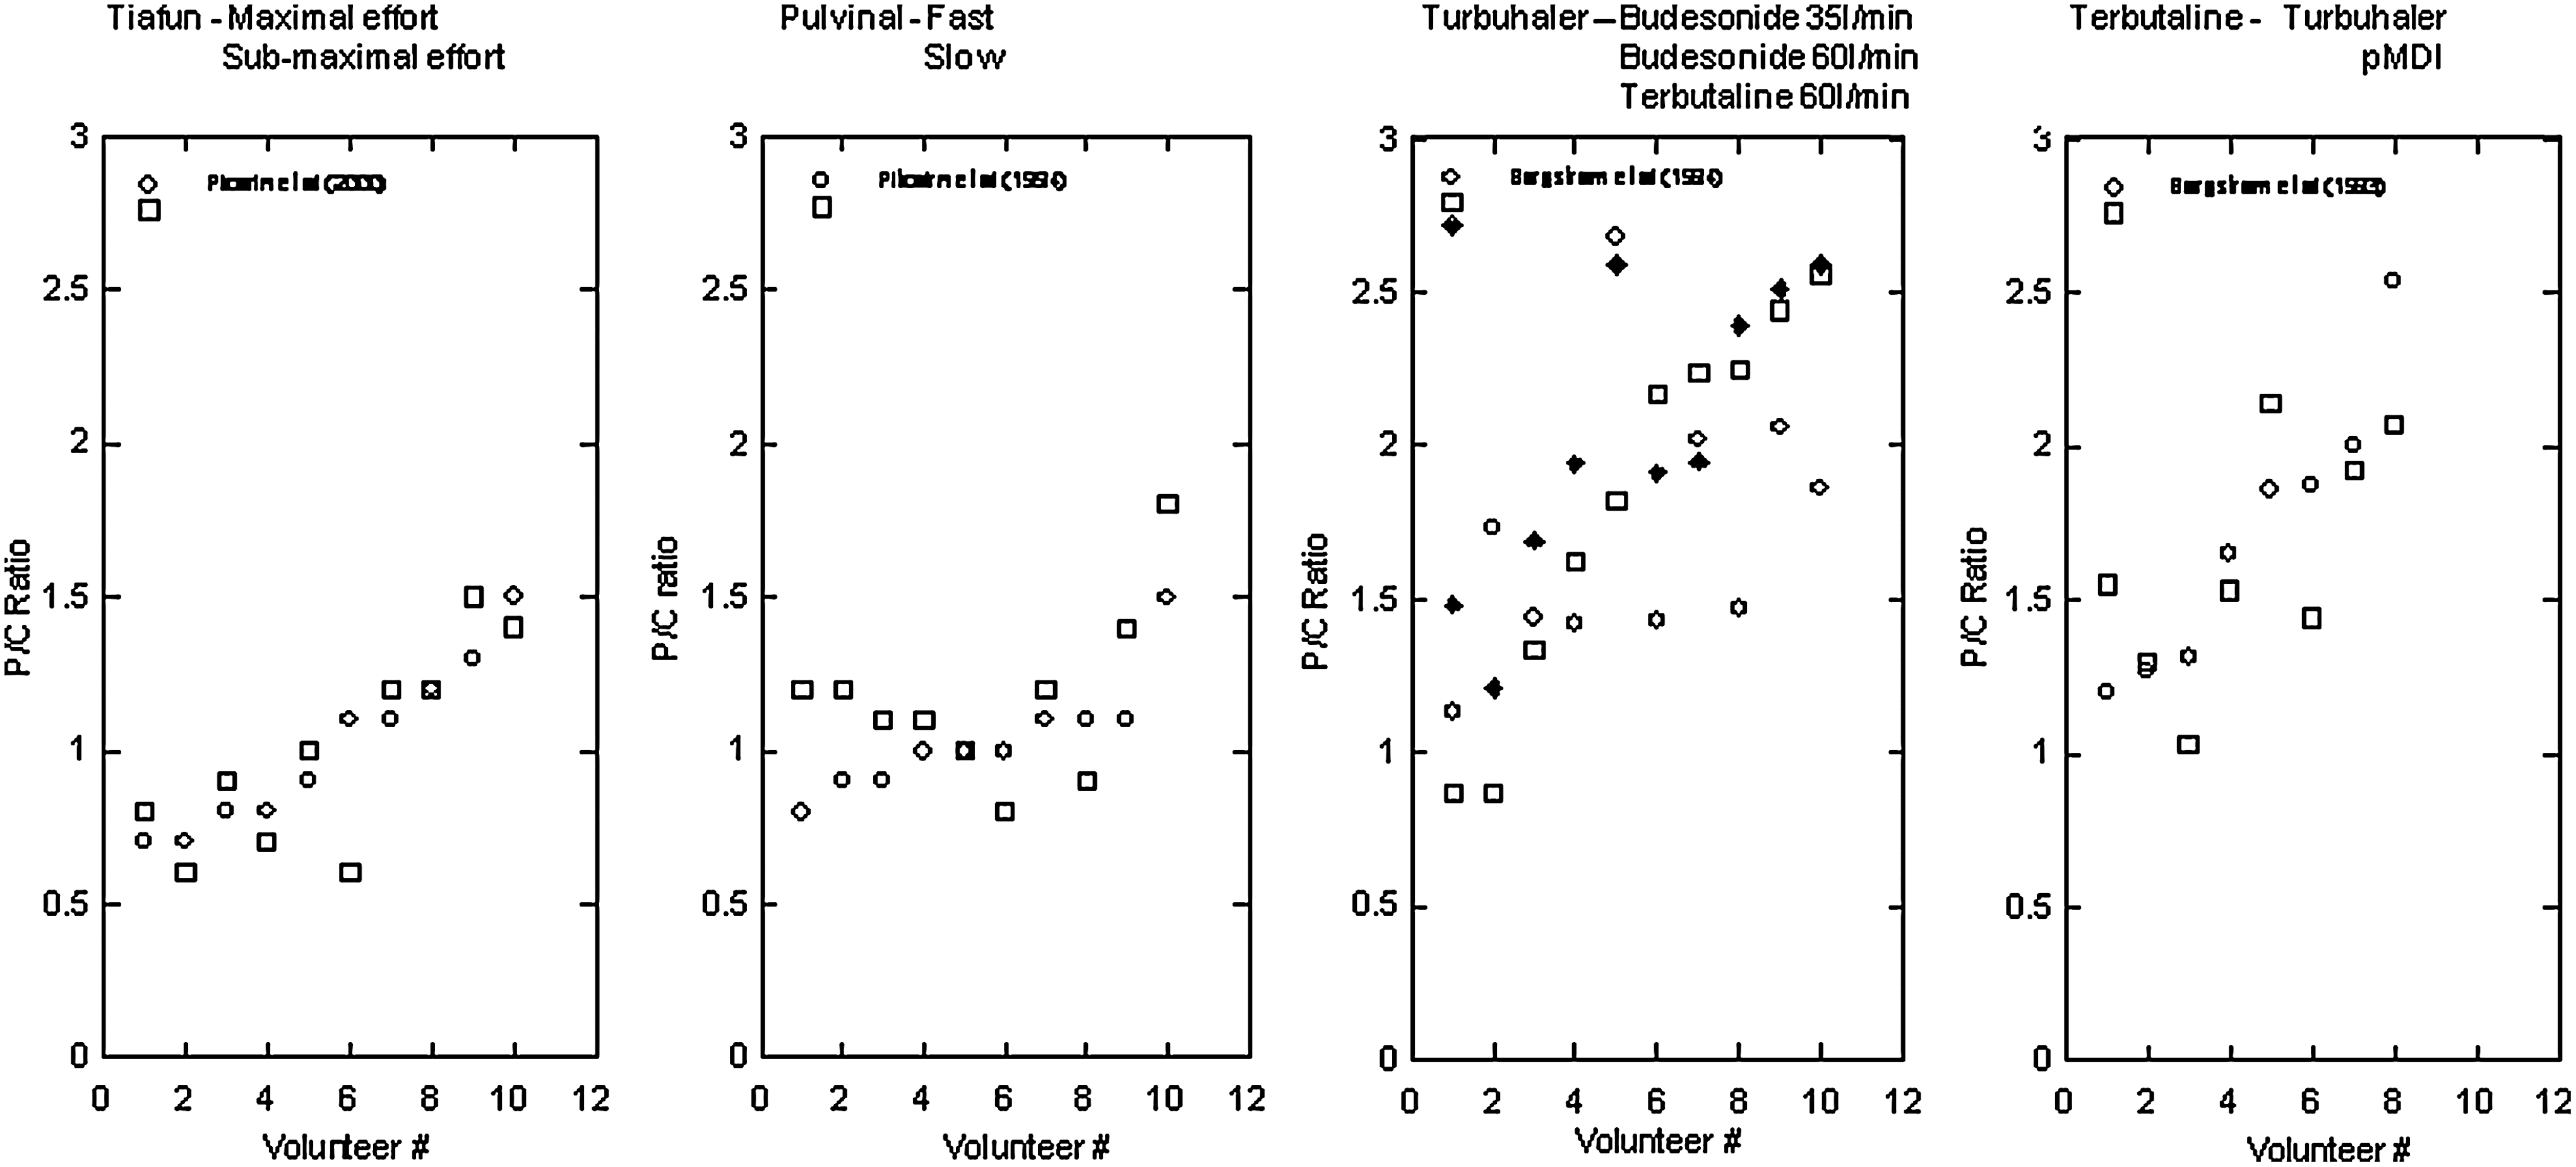
It should be noted here that most published reports contained detailed demographics of the volunteers, but rarely the individual deposition values. It was possible for the four articles above to perform an ANOVA analysis in an attempt to relate P/C values to patient demographics. No statistically significant relationships were found. However, it should be understood that this might have been due to the very sparse nature of the data set rather than no “real” underlying trends.
The true nature of the subject effect is hard to differentiate. There would appear to be three major effects that could account for the observed variability. The first is simply the geometrical relationship between P/C regions of interest and overall lung dimensions for individuals. That is, the P/C ratios are influenced by the aspect ratios of the volunteers external lung shape as projected onto the gamma camera. This effect is supported by the data presented in Figure 1. The second, and related effect, is differences in conducting airway positions relative to the external lung image. That is, the P and C regions of interest represent different airway groups in different subjects. Last, the effect could be caused by actual differences in regional deposition between subjects. This later effect would perhaps not be too surprising in light of the large variability highlighted in the published deposition literature.(7,8)
In an attempt to understand the magnitude and cause of the subject effect an analysis was performed to compare the observed variability in the above studies to that expected from the theoretical model described above. The 95% confidence intervals given in the model were used to calculate a frequency distribution of 24-h retention values normalized to the mean. Then, for each study arm (a total of nine for the four studies) the P/C values were each divided by the mean P/C ratio for the study arm. The data were then combined to produce a single frequency plot of the normalized P/C ratios from all nine study arms. The theoretical 24-h retention frequency distribution was then compared to the observed P/C frequency distribution by converting the former using the correlation equation shown in Figure 1. (It is understood that this is not a wholly satisfactory way of proceeding because the correlation equation itself may contain the other two sources of error described above. However, it is felt to be an acceptable way of making a qualitative comparison.) Theoretical calculations were performed for 3-μm MMAD aerosols with GSDs of 2.0 and 1.5. Two GSDs were used so as to span the typical widths of inhaler aerosol size distributions observed in the data. This was also done because it was observed during modeling that, although the relationship between the mean lung deposition and P/C ratio was only slightly influenced by GSD, the variability about the mean was more sensitive to GSD than MMAD over the range of aerosol sizes observed in these studies. The results of this analysis are presented in Figure 7. By the very nature of the experimental data set and the method of theoretical calculation this comparison is, at best, very qualitative in nature. However, the width and form of the plot for the experimental data are surprisingly close to that expected from the theoretical model. Because the algebraic model was derived from actual deposition data(7) this similarity would indicate that at least some of the variability seen in P/C ratio is due to intersubject variability in regional deposition caused by variability in airway dimensions between the study subjects. However, no doubt, a major component of the variability is related to the imaging issues described above. More data, where these factors are standardized and controlled, is obviously needed to be able to differentiate between true deposition variability and imaging “artifacts.”

Discussion
From the data of Newman(5) and Borgstrom(6) it can be seen that the basic requirements of pharmaceutical aerosol delivery to the lung are well understood. That fraction of an inhaled aerosol less than approximately 3 μm gives an estimate of the fraction likely to penetrate beyond the oropharynx and deposit in the lungs. The forgoing analysis, using the model of Thiel(17) clearly indicates that for most pharmaceutical aerosols, pMDIs and DPIs, head deposition is primarily controlled by either the ballistic component in the case of the pMDI, or the coarse mode in the bimodal distribution usually seen with DPI aerosols. The regional deposition within the lungs itself is controlled by the “true” aerosol component of the delivered aerosol cloud. The study conducted by Duddu et al.,(54) highlighted in Figure 2, exemplifies this. Duddu et al.(54) used an almost monomodal dry powder aerosol of Pulmospheres™ delivered by a conventional powder inhaler. That is, the aerosol contained no coarse mode, but only a “true” aerosol, approximately log-normal, component. This particular formulation gave the expected relationship between total lung and regional lung deposition.
The relationship between 24-h retention and P/C ratio exemplified in Figure 1 does not appear to be strong with an r2 value of approximately 0.6. However, considering the sources of variability in the imaging techniques this value is probably quite reasonable. The belief that there is a correspondence between P/C ratio and 24-h retention is also supported by a series of studies conducted by Agnew et al.(59–61) Although Agnew et al. used a different definition of penetration index than that used to derive the data presented in Figure 1 (they were investigating clearance in smokers), they did find similar correlations and similar levels of variability.
The analysis of individual P/C values, for the four studies where individual values were presented, clearly shows a subject effect that is far larger than the effect of either flow rate or delivery modality. Because the calibration data and the investigations of the relationship between 24-h retention and P/C ratio are very limited, it is hard to unequivocally ascribe the root cause of this large subject effect. The lack of data describing experimental variables, such as inhalation flow rate and inhaled volumes, in these studies, together with variability in the individual relationships between regions of interest and airway generations (e.g., there are always varying percentages of peripheral airways in the central regions) further confounds the analysis. However, the modeling presented above, using published data describing the variability of deposition,(62,63) seems to indicate that at least some fraction of this subject effect is due to differences in regional deposition between volunteers. In this respect it would support the use of the published literature to estimate variability and allow conclusions about the possibility of targeting specific regions of the lung to be drawn.
It should also be noted that despite the wide variety of delivery modalities used in the reported studies the data indicate that peripheral to central deposition, as assessed by 24-h retention, only changes from approximately 1:1 to 2.5:1 in terms of dose ratios. That is, that it would be surprising, given the large variability in lung dose, if this difference could be seen in pharmacodynamic dose–response studies.
Finally, from the analysis of the literature it is very apparent that there are many differences between laboratories in how they conduct and analyze data from scintigraphic studies. These differences make it impossible to compare data sets between study centers and, in effect reduces, the value of the data that is generated. Of course comparisons within studies can be used to inform on the influences of such things as the general effects of flow rate or differences between inhaler designs. However, only trending is possible as the relationship to absolute doses in the different lung compartments would still remains unclear. It is thus very apparent that there is a real need to standardize methodologies and agree on standard ways to perform image analysis(64) and work has began in this area.(65) It is also very apparent that the value of P/C ratio could be considerably enhanced if more work was done to understand how the spatial distribution from the images are related to anatomical measures of deposition.(64) This would help us to understand how much of the subject effect noted above is really due to image geometry, to lung geometry, and placement of airways in the P and C regions between volunteers and how much is really due to real differences in regional deposition. In this regard much work is being done on SPECT imaging in attempts to relate 3D spatial distributions to anatomically relevant distributions,(66) although it remains unclear as to how successful this will be, or indeed if the extra effort required to perform 3D SPECT is reflected in the relevance and usefulness of the data.(64)
Footnotes
Acknowledgments
The author thanks Charles Theil for his helpful advice and for computing the data presented in Figures 3 and ![]() .
.
Author Disclosure Statement
The author declares that no conflicting financial interests exist.