
Abstract
Abstract
Background:
Small rodents continue to be the mainstay for the assessment of pharmacological and toxicological data of inhaled therapeutics. For meaningful interpretation of the results information about deposition of aerosol particles in the respiratory tract is warranted, but not trivial to obtain for animals with nose-only aerosol exposure. The purpose of this study was to develop and evaluate a general method to characterize the deposition of inhaled test particles in an in vitro model (IVR) of the rat's respiratory tract.
Methods:
A highly detailed, realistic and representative image using micro-CT scanning technology was obtained and the generated morphological data was used to construct a plastic replica of the average rat respiratory tract. The model was connected to a rodent ventilator, which allowed the breathing frequency (f, min−1) and tidal volume (VT, mL) to be varied as required. Polydisperse fluorescent microsphere particles with an average mass median aerodynamic diameter (MMAD) of 3.1 μm and geometric standard deviation (GSD) of 2.2 μm were used as model compound.
Results:
Comparison of the experimental data for total and regional deposition levels with predicted outputs using the in silico MPPD model showed reasonably good relative agreement between the two models. The predictions were closest to the experimental values when default respiratory conditions of f=102 breaths/min and VT of 2.0 mL were used. Moreover, the IVR model revealed good correlation with published in vivo data.
Conclusion:
Using the IVR model allows an easy, fast and reasonably precise estimation of the inhaled dose in rodent inhalation studies. The IVR has the potential to be used along with live rats in inhalation exposure studies, and thus provides the unique possibility to run an internal standard for dose deposition in the respiratory tract in each inhalation experiment. This should contribute to enable a greater understanding of drug pharmacokinetics and dynamics in rats and may improve dose extrapolation from animals to humans.
Introduction
A number of mathematical deposition models have been described in the literature.(4) Of these, the Multiple-Path Particle Dosimetery (MPPD) model is perhaps the most widely used. The model was developed jointly by the Chemical Industry Institute of Toxicology (CIIT, currently The Hamner Institutes for Health Sciences) and the Dutch National Institute for Public Health and the Environment (RIVM).
The model calculates deposition and clearance of monodisperse and polydisperse aerosols in the respiratory tract of human and rat for particles ranging in size from ultrafine (0.01 μm) to coarse (20 μm). In addition, the model allows the user to input experimentally derived parameters for particle size, aerosol concentration, and breathing conditions such as breathing frequency, tidal volume, and breath hold-times in order to generate predictions for total and regional deposition levels in rodent inhalation studies.(5)
There have been a number of publications that have used the MPPD model to compare estimates of deposition in rats versus experimentally derived deposition results. Overall, the results of this comparison have been somewhat mixed. One study found good accuracy.(5) Another reported inaccurate predictions of the dose delivered.(6)
Thus, as a means of overcoming some of these limitations we developed an in vitro model (IVR) of the rat respiratory tract. This was achieved by first producing a highly detailed, realistic, and representative image using micro-CT scanning technology of a number of Sprague-Dawley rats.(7) Thereafter, the morphological data generated was used to construct a plastic replica of the average rat respiratory tract. In order to simulate the various breathing patterns typically observed in rats, the model was connected to a rodent ventilator that allows the breathing frequency (f, min−1) and tidal volume (VT, mL) to be varied as required.
The main objective of this study was to develop and evaluate a general method to characterize the deposition of inhaled test particles in this IVR model. The influence of inhalation parameters such as the breathing frequency and tidal volume on total and regional dose distribution in the model was evaluated. In addition, the experimental data generated using the IVR was compared with the MPPD model predictions and in vivo literature data.
Materials and Methods
Blend manufacture
Monodispersed fluorescent microspheres (FMS) with a geometric particle size of 2 μm and a geometric standard deviation (GSD) of 0.095 mixed with inhalation grade lactose in proportion of 0.8% w/w served as the test compounds. FMS is a proprietary product of Polysciences Inc., Warrington, PA, USA. Inhalation grade lactose (Grade A) was obtained from Friesland Food Domo, Zwolle, The Netherlands. The percent level of fines is stated as 4.4% for % <4.5μm on the certificate of analysis. Blends were prepared using a high shear M-Pro mixer (ProCepT nv, Zelzate, Belgium), operated for 30 min at 900 rpm. Blend content uniformity analysis using high-performance liquid chromatography (HPLC) showed a mean content of 0.704 % w/w and 3.01% CV.
Aerosol generation
The test aerosol material was generated using a simplified exposure system that consisted of two main parts: a fluidized bed aerosol generator (FBAG) and connection of the generator output to a nose only exposure flow-through chamber consisting of four exposure ports (Fig. 1).
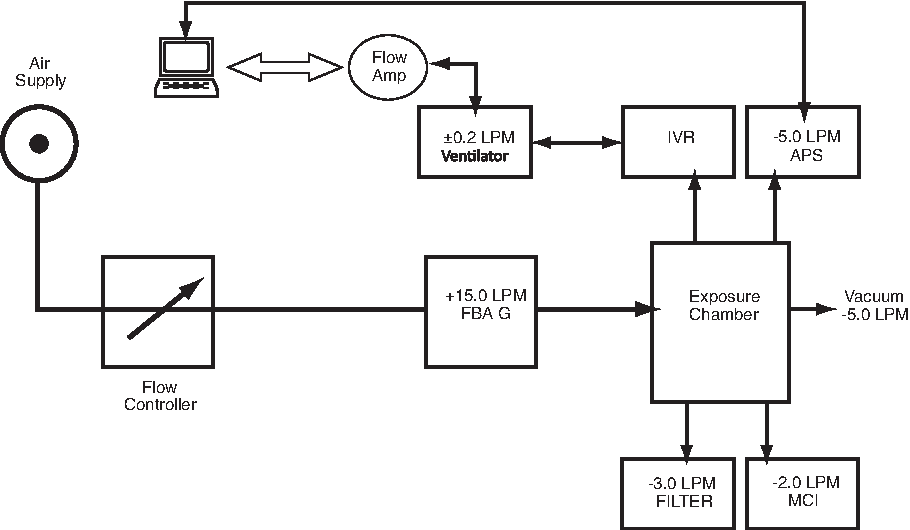
Experimental setup used to assess deposition of aerosol particles in the in vitro rat model (IVR). The setup consisted of the following principal components: exposure chamber (volume: 1250 mL), FBAG to generate aerosol particles, aerodynamic particle size (APS) to monitor the aerosol atmosphere in the chamber and Marple cascade impactor (MCI) to measure the mass median aerodynamic diameter of the active particles. Other components included the rodent ventilator to ventilate the IVR model during experiments, airflow sensors to measure the airflow conditions supplied to the IVR, and filters to measure the aerosol concentration of the active particles. Airflow into the chamber was 15 L min−1.
The FBAG 3400A is a commercially available apparatus (TSI Incorporated, Shoreview, MN, USA) that deagglomerates and forms dry aerosols from the bulk powder by agitating 100 μm-sized bronze fluidizing beads, generating aerosol particles in the size range between 0.5 to 40 micrometers in size.(8)
Of the four exposure ports, one was used for sampling the test atmosphere for concentration and particle size in real-time using an aerodynamic particle spectrometer (APS 3321; TSI Inc.). The APS 3321 uses a time-of-flight technique to calculate number-weighted aerodynamic size distributions that are transformed to a mass-weighted basis using software provided with the instrument. Another port was fitted with a cascade impactor (Marple Personal 298, Smyrna, FL, USA) in order to allow for simultaneous determination of particle size distribution using the cascade impaction method.
A third port was fitted with the IVR model connected to an Ugo Basile ventilator (Model 6025, Comoro, Italy) in order to simulate various respiratory conditions representative of day and night time activity levels of a Sprague-Dawley rat and assess the impact of varying this parameter on the total and regional deposition of inhaled particles in the IVR model.
The remaining port was fitted with a glass-fiber filter (Respirgard II; Vital Signs Ltd, Littlehampton, UK). These filters allowed for evaluation of the aerosol concentration with respect to time using gravimetric and chemical assay techniques. In gravimetric analysis the mass concentration was measured by collecting particles on a filter and measuring the increase in filter weight.
The test material was thoroughly mixed directly with fluidising beads prior to introduction into the fluidizing bed. The time required to achieve a steady-state concentration in the exposure chamber was less than 30 min.
The air flow rate into the FBAG was set at 15 L/min; 5 L of which was required for operation of the aerodynamic particle sizer (APS 3321). Further technical details of the air flow rates of the inhalation chamber components are given in Figure 1.
Under the assumption that the inhalation chamber behaved as a completely mixed chamber, the time required to reach 99% of its equilibrium concentration (t99) is given by the term 4.605 (V/F), where V is the internal volume of inner cylinder of the inhalation chamber and F is the total air flow rate through the chamber. Under these conditions, a steady state should be attained in the chamber within 25 s.(9)
IVR model details
The IVR model used in this investigation was based on a number (n=7) of euthanased, female Sprague-Dawley rats (weight: 372±56 g), which underwent high-resolution micro-CT scans. Detailed morphology of the respiratory airways was obtained from the nostrils down to the central airways at the point where no distinction could be made between intraluminal air and surrounding tissue. In terms of airway morphology obtained from the scanning process, 100% coverage of the airways in generation 4 (bronchiole) was achieved. However, the level of coverage thereafter decreased steadily and by generation 15 (corresponding to the alveolar region), less than 1% of total airways expected in this generation were covered. Full details of the scanning method used are described in the study by De backer et al.(7)
Thereafter, an IVR model cast based on the average lung geometry of the scanned rats was constructed. Rapid-prototyping technique was used to construct the model cast using polycarbonate-based material; SLA resin (Aztec precision engineering, Letchworth, UK). In addition, the inner surface of the cast was coated with Parylene N (Speciality Coating Systems, Woking, UK) material in order to ensure the SLA resin did not come into contact with the organic solvents routinely used to extract drug material deposited in the model.
The model (Fig. 2) consisted of the following sections; Extra-Thoracic region containing the snout and nasophyarynx (ET; sections 1and 2), trachea-bronchial region containing the trachea, bronchi, and bronchioles (TB; Sections 3, 4, and 5). All sections of the model were attached to one another in numerical order and housed within a containment unit made from SLA resin. At the rear end of the cast, a flexible diaphragm was attached in order to collect the fraction of inhaled particles exiting the TB section and possibly reaching the lung (referred to as the Post-TB section). The volume of the containment section enclosing this diaphragm was approximately 7000 mm3. The nasopharyngeal volume of the representative model was 373 mm3, the tracheal volume 173 mm3, and the volume of the central airways amounted to 233 mm3.

Average rat model derived from micro CT scans (top). The model consisted of the following sections: 1 and 2 covered the Extrathoracic (ET) region, 3, 4, and 5 covered the Tracheobronchial (TB) region. The TB region in more detail, showing the presence of some respiratory bronchioles (bottom).
Prior to the start of experimental procedure the inner surface of the IVR model were coated with a solution containing a mixture of Brij 35: PEG 200 and acetonitrile (all components were purchased from Sigma-Aldrich, St. Louis, MO, USA) in order to mimic the wet mucus layer coating the rat's airway surfaces and minimize particle bounce.
The rear end of the model (at the far side of the diaphragm) was connected to the Ugo Basile Rodent ventilator (Model 6025; Comoro, Italy) in order to simulate the various respiratory conditions, which were considered to be representative of day and night time activity levels of a Sprague-Dawley rat. These conditions were simulated by varying the tidal volume and breathing frequency supplied to the model as shown in Figure 3.
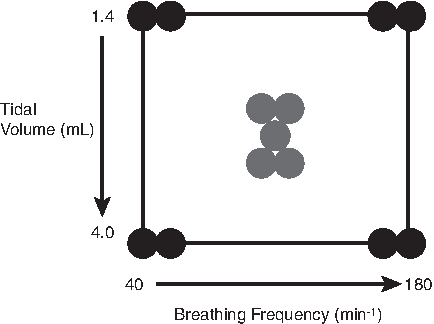
Schematic plot of the experimental design implemented for this investigation.
During operation, the airflow conditions were continuously monitored via an airflow sensor (TPF 100 Flow Transducer; EMMS, Bordon, UK) placed in the airflow path between the ventilator and rat model. This sensor was connected to a flow transducer (Adaptive Amplifier; AMP 110; EMMS, Bordon, UK) which transformed the electrical signals to flow traces of the inhalation manoeuvres and displayed on a personal computer using a data acquisition program (eDacq software; EMMS, Bordon, UK).
The theoretical total dose of inhaled fluorescent microspheres deposited (Minh) for each IVR model experimental conditions were calculated as follows:
where [aerosol concentration] is the aerosol concentration of FMS, expressed in μg/L. RMV is the respiratory minute volume of the rat, t is the time of aerosol exposure (usually 45 min), and IF is the inhaled fraction which is assumed to be 100% for particles <7 μm.(10)
Furthermore, due to the practical difficulties in measuring the amount of aerosol particles deposited during the exhalation phase in the IVR model, no attempt was made to quantify these losses or differentiate between inspiratory and expiratory deposition fractions. However, these losses are not expected to be a significant as it is widely accepted in the literature for both animal and human models that deposition losses on exhalation are negligible.(11)
HPLC method details
The FMS deposited in the various sections of the IVR model and filters were recovered using 2-Ethoxyethyl acetate solvent (98% purity; Sigma-Aldrich) and analyzed using an isocratic validated HPLC assay method.
The HPLC system (Agilent Technologies, Placerville, CA, USA) consisted of a quaternary pump, a degasser, a fluorescent detector, a column oven, and an auto sampler. The mobile phase was composed of 80:20 v/v acetonitrile: water. The flow rate was set at 1.0 mL/min. The column (Zorbax® SB-C18, 3.5 μm, 4.6×50 mm) was heated to 35°C. The injection volume was 50 μL. The fluorescence excitation and emission of each sample was measured to be 441 and 486 nm, respectively. The analytical method linearity range was determined to be 0.003–30.8 μg/mL.
Statistical design details
A multifactorial statistical design was implemented for this study. The parameters selected were tidal volume (VT, mL) and breathing frequency (f, min
Within the limits of the model selected, combinations of f and VT were evaluated (Fig. 3). These combinations are considered to be representative of the different breathing patterns that have been reported in rats.(12) For example, breathing with high VT (2.5–4 mL) and lower f (40–80 breaths/min) corresponds to deep anaesthesia; breathing with lower VT (1.5–2.5 mL) and higher f (80–160 breaths/min) is considered to be representative of the breathing pattern of conscious animals. Conversely, breathing with large VT (4.0 mL) and low f (40–80 breaths/min) is considered to be representative of a sigh breath.(13) Finally, a number of experimental runs (five runs) were operated under normal rat's breathing conditions of a VT of 2.1 mL and respiration frequency of 102 min−1.(5)
The statistical design consisted of 13 experimental runs, 8 of which are for the corners of the design (2 replicates of each corner) and representative of intermediate conditions between high and low extremes and 5 replicates for the center point, which provide a measure of experimental variation. The resulting experimental matrix is shown in Table 2. All experiments were carried out in randomized run order to mitigate the effect of environmental variance. The software Design Expert DX7 (Stat-Estate Corporation, USA) was employed for this work.
Dose estimation using MPPD
The MPPD modeling software (v1.1; National Institute for Public Health and the Environment, Bilthoven, The Netherlands) was used to predict deposition, of FMS particles for each IVR experimental run conditions.
The model takes into account a detailed description of the airway and lung geometry for Long-Evans rats. The model consisted of detailed morphometric mapping of 2404 conducting airways collected by Raabe et al.(14) A symmetric nine-generation model acinus was attached to the end of each terminal bronchiole in order to model the pulmonary region in the rat lung. Deposition within each region or airway is calculated using theoretically derived equations for deposition by diffusion, sedimentation, and impaction within the airways.(5)
The model allows the assessor to test a variety of inputs, such as lung geometry, breathing conditions, and particle characteristics such as size distribution and mass density.
Model output included deposition for the following regions: (1) nasopharyngeal, (2) tracheobronchial, and (3) pulmonary. IVR run-specific respiration data obtained using the eDacq data acquisition software were input into the model; these parameters included breathing frequency (f, min−1) and tidal volume (VT, mL). In addition, exposure aerosol conditions of aerosol concentration and particle size distribution (MMAD and GSD) were input into the model. Finally, for all model runs, the inhalability adjustment was selected, and the pause fraction was the default value (0.0).
Results and Discussion
Aerosol generation and particle size analysis
The FBAG produced a mean aerosol concentration of 2.2±0.4 mg/m3 in 13 experimental runs (Table 1). This equates with an overall variability of 20.1% and is in keeping with temporal variability values of 5–19% reported in other studies of animal exposure chambers.(15–17)
Particle size analysis using the Marple cascade impactor showed the average mass median aerodynamic diameter (MMAD) to be 3.1 μm and the GSD to be 2.10. Thus, the particle size distribution generated is typical of rodent inhalation studies and thus demonstrates the suitability of this experimental setup for evaluating the deposition behaviour of test material in the in vitro respiratory rodent model (IVR).
This setup also enabled the determination of the impact of breathing patterns on total and regional deposition of the IVR model to be assessed and compared against existing literature data and in silico predictions using the MPPD model.
Influence of ventilation parameters on lung deposition in the IVR model
The impact of tidal volume and breathing frequency variation on the deposition levels (in μg) in the head region of the IVR model is shown in Figure 4. In general, the data reveals an increase in particle deposition levels with increase in breathing frequency; with variation in the tidal volume at low breathing frequency (40 min−1) having almost no impact on the fraction of particle deposited in the head region. However, variation in the tidal volume at higher breathing frequency (180 min−1) resulted in an increased fraction of particles in the head region.

Interaction plot showing the effect of tidal volume and breathing frequency on absolute deposition levels (μg) in the head region. The plot shows a synergistic interaction where the deposition levels are much increased at high tidal volume and breathing frequency. However, at low tidal volume (1.0 mL) and high breathing frequency (180 min−1) the corresponding deposition levels are reduced.
The high level of deposition seen in this region may be explained if we consider that particle deposition in the head region is governed by inertial impaction, as flow velocities in this area are relatively high and the residence time of the particle is short. Consequently, a higher particle fraction is expected to deposit in the upper regions of the model.(18) Other investigators have demonstrated similar trends with higher particle deposition noted in the nasal regions in comparison with the tracheobronchial and pulmonary regions of the rat respiratory tract.(19)
The experimental data (in μg) for deposition in the in the head region was fitted to a statistically significant quadratic model accounting for 93.8% of the variance. The final equation to describe the deposition in the head region (D) as function of tidal volume (α) and breathing frequency (β) was as follows:
The effects of ventilation parameters variation on TB deposition are shown in Figure 5. The data showed that changes in tidal volume did not have a significant impact on deposition levels, whereas a reduction in breathing frequency for different tidal volumes resulted in significantly higher deposition levels. As the predominant deposition mechanisms acting in this region are inertial impaction and gravitational sedimentation, lowering the breathing frequency leads to a substantial increase in the residence time of particles in the conducting airways and a greater deposition levels due to sedimentation.(18)

The simultaneous effects of two parameters; tidal volume and breathing frequency on the percentage deposition in the TB region are shown in this interaction plot. Results show that changes in tidal volume have little effect, whereas decreasing breathing frequency resulted in an increase in the percentage deposition levels in the TB region.
A 3D plot visualized the relation of breathing frequency and tidal volume with deposition in the post-TB region (Fig. 6). The model identified breathing frequency as a statistically significant factor affecting deposition (p<0.05) with the lower the breathing frequency the higher the deposition in the post-TB region, whereas variation in tidal volume in the range explored (1.4–4.0 mL) did not affect deposition in the post-TB region.
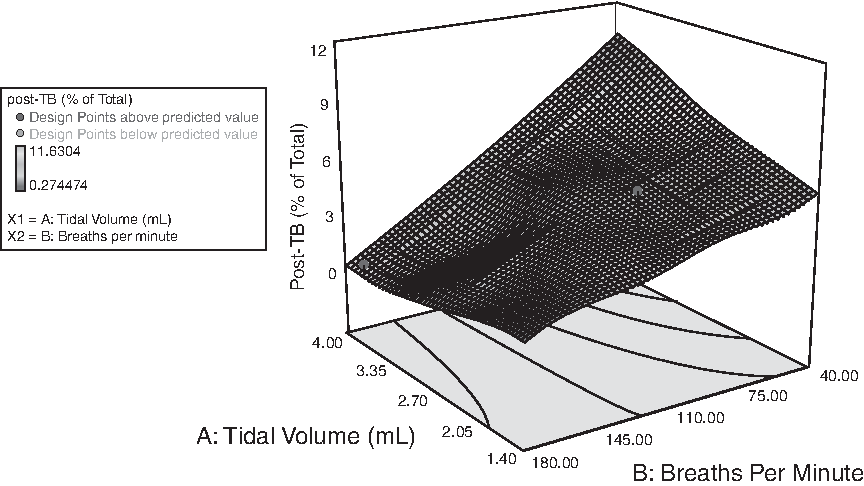
The simultaneous effect of two parameters; tidal volume, and breathing frequency on the percentage depositions in the post-TB region are shown in the 3D surface response plot. Results show that changes in tidal volume have little effect, whereas decreasing breathing frequency resulted in an increase in the percentage deposition levels in this region.
This trend is consistent with the hypothesis that for a given particle size, the residence time in the pulmonary region is the main factor affecting deposition. Particle deposition by sedimentation and Brownian diffusion are the main deposition mechanisms in this region and both are dependent on residence time, thus, any factor that increases this time, such as reduction in breathing frequency, will result in higher deposition levels.(18)
Total deposition in the IVR model compared to the MPPD model predictions
After calculating the theoretical total dose of inhaled fluorescent microspheres deposited (Minh) for each IVR model experimental condition, it was possible to compare this calculated dose with the measured deposition in the IVR model. In addition, comparison was made between the measured deposition to that predicted by the MPPD model using the run-specific conditions and default inputs (Table 2). The data showed that the experimentally determined total deposition in the IVR model underestimated the theoretical total dose prediction by an average factor of 0.86±0.29 (CV=33.2%).
RMV: Respiratory minute volume.
Duration of exposure: 45 min.
Average body weight of rats: 0.37 kg.
Minh: calculated theoretical total dose of inhaled fluorescent microspheres deposited for each IVR model experimental condition.
This is assumed to be 100 % for particles<7 μm.
Predicted using both rat-specific and default inputs.
In terms of comparison between the IVR and MPPD model predictions, the IVR model exceeded the MPPD model predictions by an average factor of 1.51±0.70 (CV=46.5 %). However, the agreement between the two models is much closer when the MPPD default breathing conditions were used; 102 breaths/min for f, 2.1 mL for VT. In this case, the agreement between the two models is much closer and agree with a factor of 1.08±0.15 (CV=13.6%).
Interestingly, in a study conducted by Casse et al.(6) comparing the MPPD model prediction with measured pulmonary deposition levels for cadmium chloride aerosol, the MPPD model overestimated measured pulmonary deposition when f and VT were entered as experimentally determined rather than default breathing parameters.
Another study by Wichers et al.(19) involving rats exposed to oil combustion-derived particulate matter showed the MPPD model to underestimate the measured pulmonary fraction by more than 60% of the measured dose. As in the case of Casse et al.(6) study, experimentally determined rather than default breathing parameters were entered into the MMPD model. Therefore, these findings in addition to our study, albeit for total deposition levels, may highlight the limitation of the MPPD model for estimation of the total and pulmonary inhaled dose for breathing conditions other than those under normal level.
Regional deposition in the IVR model compared with the MPPD model predictions
The percentage deposition level of FMS particles in the IVR and MPPD model for the five replicate center point experimental runs were compared (Fig. 7). These runs used a tidal volume of 2.1 mL and breathing frequency of 102 min−1 to mechanically ventilate the IVR model. These ventilation settings are the default setting for the MPPD model.(5) The aerosol concentrations levels (mg/m3) and particle size distribution (μm) for all the replicates runs were input into the MPPD model in order to generate regional distribution predictions for the inhaled dose of FMS particles.

Plot showing regional deposition of FMS particle deposition in the different regions of the rat's respiratory tract; Head, Tracheobronchial (TB), and Pulmonary (P) regions in the IVR and MPPD models. For the IVR model, the pulmonary fraction refers to the percentage of particles in the diaphragm placed at the rear of the TB section of the model. Exposure conditions: Aerosol concentration; 2.48±0.34 mg/m3. MMAD (GSD): 3.04 (>1.2). Inspiratory breathing conditions representative of a normally breathing rat were simulated using a ventilator coupled with the IVR model. Average tidal volumes and breathing frequency conditions were 2.11±0.17 ml and 104.9±2.02 min−1, respectively, n.s: not significant.
The results showed good agreement between IVR and MPPD model with regard to the regional distribution of the FMS particles, especially for head region. In both cases, the highest deposition levels were seen in the head region, with 88.14±6.63% and 94.50±0.34% deposition recorded for the IVR and MPPD model respectively (p=0.065).
For the tracheobronchial region, much higher deposition levels were noted for the IVR (8.93±4.7%) in comparison with the MPPD model (1.85±0.16%) (p<0.05). This difference may be attributed to the higher deposition levels in the head region for the MPPD in comparison with the IVR model, as the head region acts as a highly efficient filter in removing the majority of inhaled FMS particles. Consequently, the fraction of particles reaching the TB region will be relatively reduced for the MPPD in comparison with the IVR model owing to the higher head filtration efficiency of the former.
For the peripheral lung structures, comparison between the fraction of FMS particles collected in the diaphragm section post the tracheobronchial region of the IVR model and the pulmonary region of the MPPD model were made. In the case of the IVR model, the current limitations of the micro-CT scanning technology did not enable scanning much beyond generation 4 of the model to be made. Hence, the amount of particles collected in the post-TB region may be regarded as containing a combination of particles collected in the small TB and pulmonary fractions. Therefore, the results generated for this region should be treated with some caution and not interpreted as been absolutely reflective of actual deposition in the pulmonary region.
Nonetheless, despite these limitations for a direct comparison between the two models, similar deposition fractions were observed for both with 2.92±2.05% and 3.69±0.23% deposition recorded for the IVR and MPPD model predictions, respectively (p>0.05). Overall, there is reasonable general agreement for regional deposition in the rat respiratory tract for the inhaled FMS particles between the two models.
Deposition in the IVR model compared with in vivo data from literature
The measured deposition levels in the lung region of the IVR model versus changes in the breathing frequency were compared with data from a number of published rodent inhalation studies using particles of approximately the same size as generated in this investigation (MMAD: 2–4 μm).(13,20,21)
For the purpose of this comparison, the lung region is regarded as consisting of the sections in TB and post-TB regions of the IVR model. This definition is required as the in vivo data for pulmonary deposition of particles is generally stated in the literature as lung fraction and contains particles deposited in both the tracheobronchial and pulmonary region. Therefore, in order to generate a valid comparison, the fraction of particles deposited in the TB and post-TB region of the IVR model were summed and compared with the corresponding literature data. Additionally, the corresponding MPPD predicted levels (TB and pulmonary fractions) for the IVR settings were included for comparison (Fig. 8).
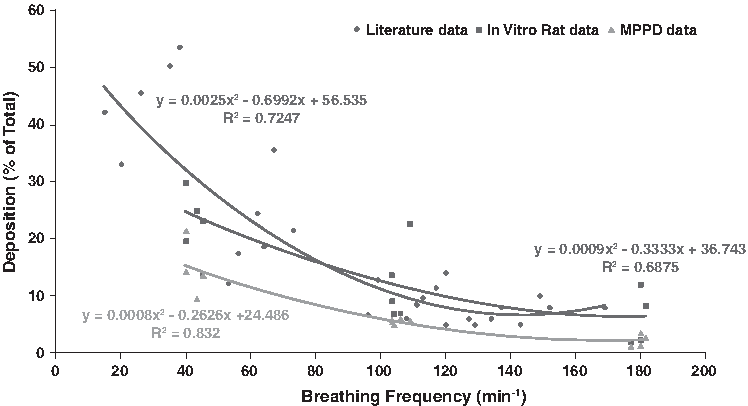
In general, the data shows an inverse relationship between the measured breathing frequency of the rats and lung deposition and this trend is consistent for all three data sets. The MPPD predicted levels are consistently the lowest of the three sets and across the entire range of breathing frequencies under evaluation. This observation is in general agreement with a number of published studies that showed the MPPD model to consistently underestimate deposition in the lung region.(6,19)
Notably, our data for the IVR model is in good agreement with data published in in vivo rodent studies, despite the fact that the data pool from rodent studies assessing deposition in the pulmonary region are relatively scarce and shows greater levels of variability in comparison with the extrathoraic and tracheobronchial regions.
Impact of polydispersity of aerosolized FMS particle on the variability in experimental data
Some of the variability exhibited in the IVR model, especially for the post-TB region can be attributed to variations in the particle size characteristics of the FMS particles aerosolised in the exposure chamber. Despite using monosized FMS particles as input material with Geometric diameter of 2 um and GSD of 1.2, the resultant particle size distribution of FMS particles in the exposure chamber varied from 2.28 to 4 microns for MMAD and 1.81 to 2.49 microns for GSD, indicating that polydisperse aerosols of FMS particles were produced. This can be attributed in part to the inefficiency of the FBAG aerosol generator system used in our experimental set up to adequately deagglomerate the FMS particles.
However, it is expected in principle that the regional distribution of polydisperse aerosol should exhibit the same trend as the corresponding distribution levels for monodisperse MMAD-aerosol with the fraction of particles deposited in the head and pulmonary region flattened out to some extent.(22)
In addition, various models of particle deposition in the respiratory tract of rats show that for particle in the range of 3 to 10 microns, most particles will deposit in the extrathoraic region, and this trend has been demonstrated in our experimental data ( see Fig. 7).(4)
Limitation of the IVR model
The present IVR approach also has some limitations. First, the model is based on scans up to generation 4 of the rat respiratory tract as this represents the current limits of the micro-CT scanning technology. Thus, particle deposition in deeper lung regions might not be reflected precisely. Second, the current model does not take into account lung clearance. However, data on mucociliary clearance is sparse and is generally not reflected accurately in the current in silico models. Consequently, the results generated using this IVR model for drug molecules with high mucociliary clearance rate should be treated with some caution.
Third, the IVR model does not account for hygroscopic growth of particles in the rat's respiratory tract. This is a common limitation of most deposition models with the exception of the recently proposed model by Schmid et al. (4)
Conclusion
An in vitro deposition (IVR) model for the respiratory tract of rats has been developed. Studies using this model with polydisperse fluorescent microsphere particles (MMAD; 3.1 μm, GSD: 2.1) showed it to be sensitive to changes in breathing parameters especially respiratory frequency (f), where the data showed increased deposition with decreased respiratory frequency. This observation is in good agreement with previously published in vivo rodent studies for particles of the same size.
Comparison of the experimental data for total and regional deposition levels with predicted outputs using the in silico MPPD model showed reasonably good relative agreement between the two models. The predictions were closest to the experimental values when default respiratory conditions of 102 breaths/min and tidal volume 2.0 mL were used.
To summarize, the reasonably good agreement of the data generated with our IVR model and the MPPD model and the high correlation with in vivo data of the rat support the validity of our rat respiratory tract model. Using the IVR model allows an easy, fast and reasonable precise estimation of the inhaled dose in rodent inhalation studies.
The IVR has the potential to be used along with live rats in an inhalation rig in biopharmaceutics research and thus provides the unique possibility to run an internal standard for dose deposition in the respiratory tract in each inhalation experiment. This should contribute to enable a greater understanding of drug pharmacokinetics and dynamics in rats and may improve dose extrapolation from animal to man and interpretation of data from rodent inhalation studies.
Footnotes
Acknowledgments
The authors acknowledge Dr Nia Stevens (GlaxoSmithKline Research and Development, Inhaled Product Development, Ware, UK) for her thoughtful review of the manuscript. The authors wish to thank Peter Connors of EMMS for the loan of the ventilation monitoring equipment and technical assistance in its operation.
Author Disclosure Statement
The authors declare that no conflicting financial interests exist.