
Abstract
Abstract
Background:
A standardized protocol for measuring mucociliary (MCC) and cough clearance (CC) was developed and tested at the University of North Carolina at Chapel Hill, NC (UNC), Johns Hopkins University (JHU), and the University of Pittsburgh (Pitt).
Methods:
A total of 50 healthy nonsmoking adults with normal lung function were studied at the three sites: 30 [21 males/9 females (21M/9F)] at UNC, 10 (6M/4F) at JHU, and 10 (4M/6F) at Pitt. Subjects inhaled an aerosol of 99mtechnetium sulfur colloid in 0.9% saline (mass median aerodynamic diameter=5.4 μm) under controlled breathing conditions (500 mL/sec, 30 breaths/min) by following a metronome and flow signal from a commercial dosimeter. Following inhalation, subjects sat in front of a gamma camera as sequential lung images were acquired for 60 min. Subjects then coughed 60 times, and images were acquired after each set of 20 coughs, i.e., at 70, 80, and 90 min. Subjects returned to the laboratory approximately 24 hr later for a final image of residual lung activity. Initial aerosol distribution was measured as a central/peripheral (C/P) ratio of activity. MCC/CC was expressed as the area under the retention versus time curve over 90 min (AUC90).
Results:
A multivariate analysis of clearance versus time with site and C/P as covariates showed no significant site-specific differences. Interestingly, MCC/CC was greater in females (n=19) versus males (n=31), with AUC90=0.84±0.11 and 0.90±0.07, respectively (p=0.03), for the combined data set from all sites (not significant for any given site). There were no gender differences for either C/P ratio or 24-hr clearance.
Conclusions:
This standardized protocol may prove beneficial in multicenter trials for testing new therapies that are designed to improve MCC/CC.
Introduction
Measuring MCC/CC rates in humans requires inhalation of nonpermeating, radiolabeled markers that deposit on the airway surface and are then assumed to move out of the lung at the same rate as the airway secretions in which they are immersed. In general, the short half-life isotope 99mtechnetium (99mTc) is used to label the inhaled marker, which is then monitored by gamma camera over periods of 1 to 24 hr to determine clearance rates. Many investigators(7–9) have shown that particle retention (as a function of time) is strongly dependent on the site of particle deposition within the lung as characterized by a central to peripheral (C/P) ratio of lung activity. Regional deposition is in turn influenced by particle size and breathing patterns used for particle inhalation.(10) It is therefore important to control particle size characteristics and breathing pattern of the aerosol in an attempt to reproduce deposition patterns within and between patients. Although uncontrolled, spontaneous coughing can confound measures of MCC,(2) more controlled measures of CC can be obtained by incorporating fixed numbers of controlled, voluntary coughs during the measures of particle clearance.(3,11,12) Finally, the retention of the radiolabel at 24 hr (R24) post deposition is primarily an index of airway versus alveolar initial deposition. This is because R24 is dominated by particles that initially deposit in the alveolar region of the lung. R24 is also inversely related to C/P, such that increased R24 is associated with decreasing C/P.(8,9) Although R24 may depend on deposition pattern, this relationship may be altered by disease. For example, mild to moderate patients with CF may have a greater R24 for a given C/P, compared with healthy subjects,(9) perhaps as a result of depressed MCC from the small peripheral airways of the lung in CF.
To better compare MCC/CC data across multiple laboratories and allow for multisite studies of MCC/CC, standardization of basic procedures needs to be developed, validated, and compared between sites. Accordingly, this report describes the standardization of MCC/CC procedures and comparison of measurements between three sites: University of North Carolina at Chapel Hill, NC (UNC), Johns Hopkins University (JHU), and the University of Pittsburgh (Pitt).
Materials and Methods
The standard methodology chosen for comparison between sites was similar to that used recently by Donaldson et al.,(3) where treatment with hypertonic saline over a 2-week period showed an acute and prolonged improvement of MCC in CF patients. Slight modifications were made (described below) to simplify the procedure for ease of duplication between sites. A total 50 healthy nonsmoking adults with normal lung function were studied at the three sites: 30 [20 males/9 females (21M/9F)] at UNC, 10 (6M/4F) at JHU, and 10 (4M/6F) at Pitt. Mean and ranges of subjects' age and lung function are provided in Table 1.
FEV1, forced expiratory volume in 1 sec.
Inhalation and imaging
Prior to a xenon scan, subjects were seated and positioned with their backs against a large field of view planar gamma camera. A small piece of colored tape was placed at or near the sternal notch for subsequent subject positioning with an external laser and mirror (UNC and Pitt). At JHU, a low-dose external source of 99mTc was briefly held at the sternal notch of the patient such that radiation detected at that position coincided with the location of a circle drawn on a transparency taped to the computer screen. With the subjects maintaining this alignment, they rebreathed 10–20 mCi 133Xe through a Pulmonex system (Atomic Products, Shirley, NY) until equilibrium counts were obtained. This equilibrium image was used to determine the lung outline and lung volume correction for characterizing regional deposition in the lung. A 15-min background image (for the 99mTc window) of the subject was taken prior to and immediately following the xenon scans.
At UNC and Pitt, sulfur colloid particles radiolabeled with technetium (99mTc-SC) were prepared from Sulfur Colloid Kits (CIS-Sulfur Colloid, CIS-US, Inc., Bedford, MA) following the procedure provided by the manufacturer. The binding of 99mTc to SC for these binding kits is greater than 98% determined by paper chromatography.(13) At JHU, 99mTc-SC was obtained prelabeled from a radiopharmaceutical distributor. The submicrometer (0.22 μm, geometric standard deviation 1.75) 99mTc-SC particles(13) are insoluble and suspended in a normal saline solution for delivery by a jet nebulizer.
The radioaerosol inhalation setup is illustrated in Figure 1. Subjects were trained to follow a prescribed breathing pattern during radioaerosol inhalation by matching their inhalation to a lighted graduated flow signal that represented a peak flow rate of 0.5 L/sec (FlowDisplay in Fig. 1) and listening to a metronome such that they inhaled at a frequency of 30 breaths/min. Two milliliters of the 99mTc-SC particle suspension (4–5 mCi) was placed in a Devilbiss 646 jet nebulizer (Sunrise Medical, Somerset, PA). The nebulizer and tubing were connected to a Spira Electro2 Inhalation Dosimeter (Respiratory Care Center, Hämeenlinna, Finland), which provided the digital display of the flow rate and tidal volume (TV) (Fig. 1). The dosimeter also directed compressor actuation air (DeVilbiss Pulmoaide, Model 5610D) to the nebulizer for 0.7-sec duration after a 100-mL delay of onset at the beginning of each 50% duty cycle breath. A Malvern Mastersizer S (Malvern Instruments USA, Westborough, MA) was used to determine the mass median aerodynamic diameter (MMAD) of the aerosol (5.4 μm) and the geometric standard deviation (1.8) (45% fine particle fraction, i.e.,<5 um) measured with dosimeter in the pulsed condition. Subjects wore noseclips and inhaled via a mouthpiece (Care Fusion, Yorba Linda, CA) from the delivery system until approximately 25–40 μCi was deposited in his/her lung. This lung activity was estimated in different ways based on previous experience with radiation health approvals at each institution including: (1) the count rate on a gamma camera/single crystal detector placed against the back of the subject, (2) a fixed inhalation time, or (3) measures of inhaled activity collected on a filter prior to inhalation. Radioaerosol inhalation was generally completed in 1–3 min of breathing. Subjects who had difficulty maintaining the controlled breathing for that period of time were given short breaks to allow them to breathe spontaneously off the delivery system before continuing.
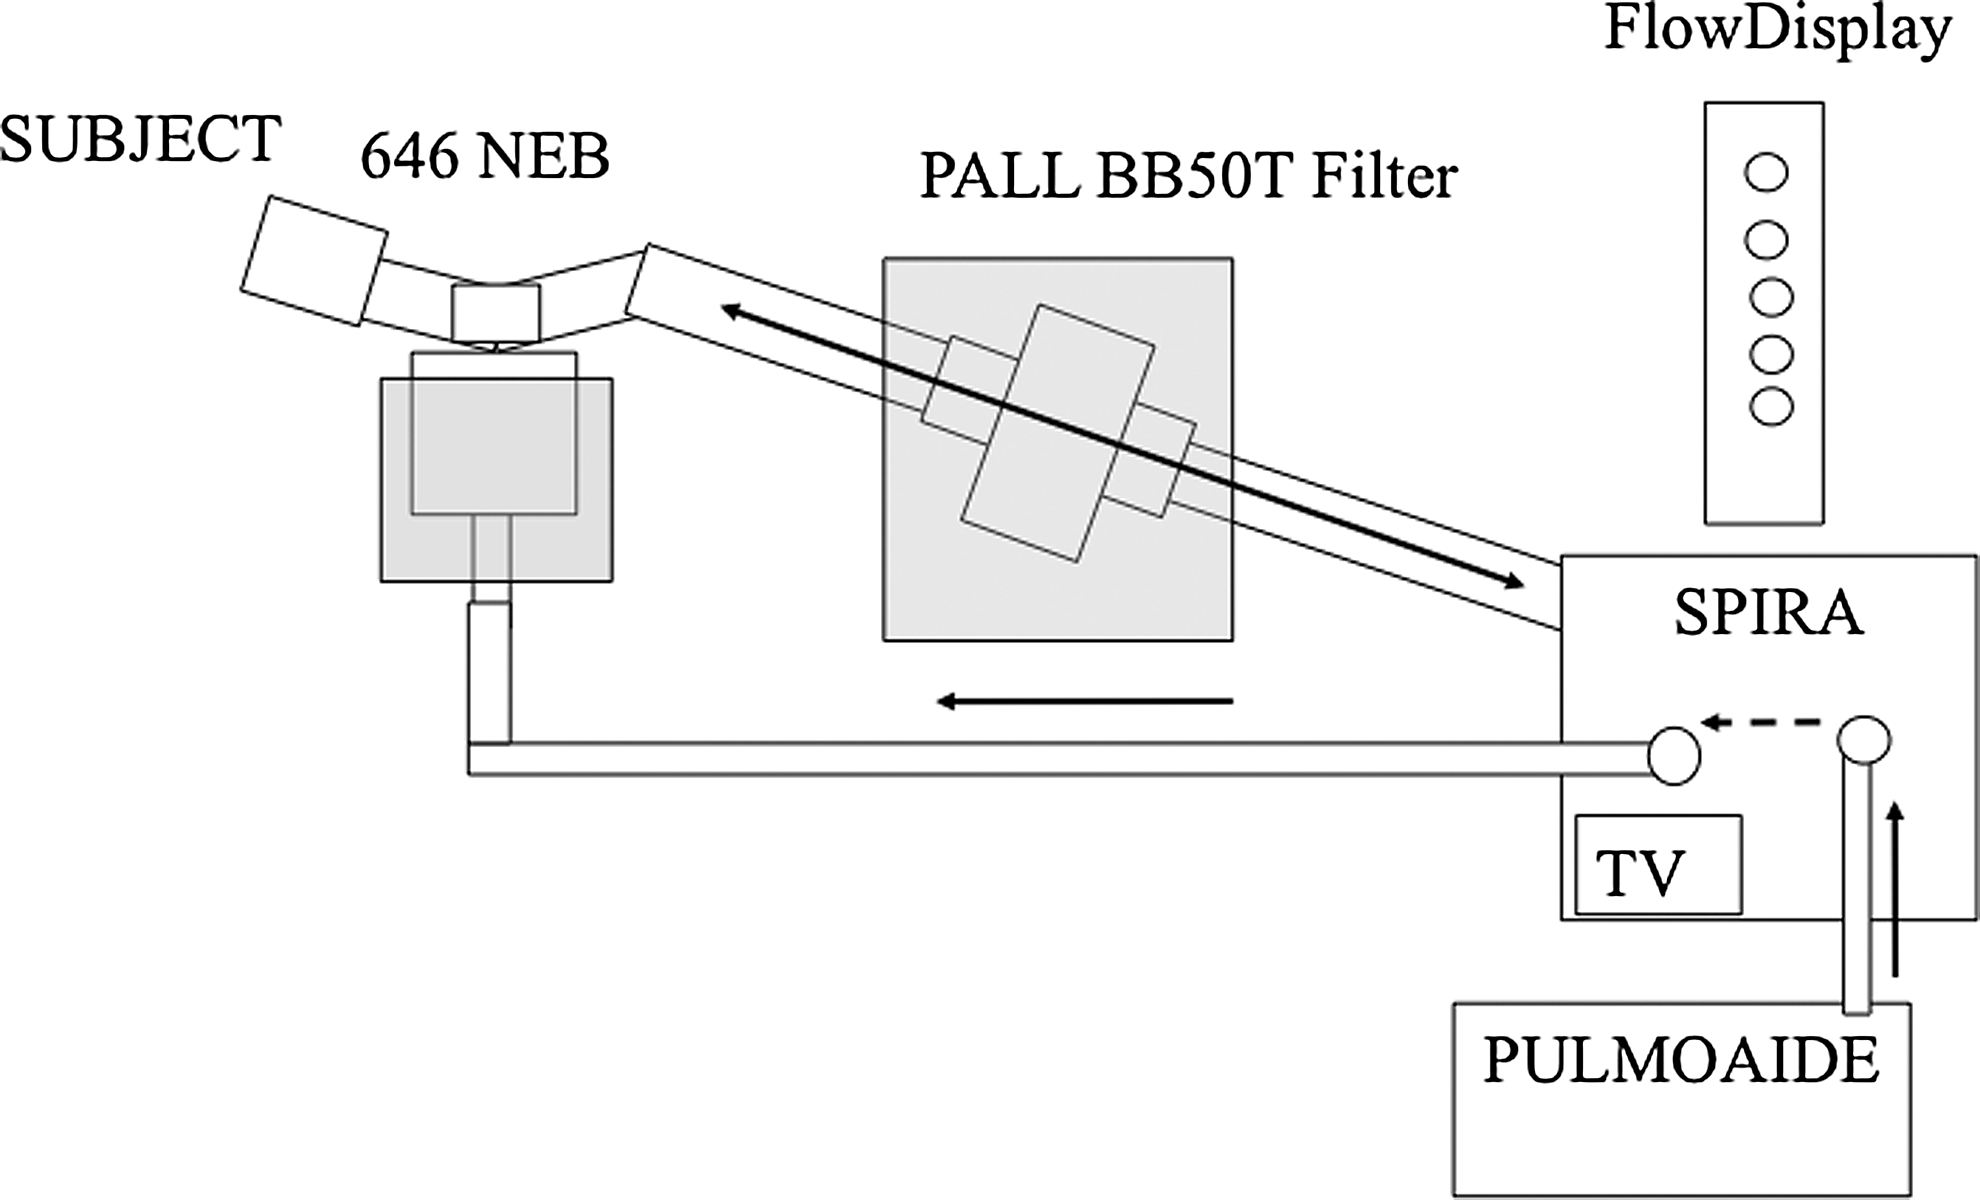
Radioaerosol inhalation setup: Devilbiss 646 nebulizer (NEB) and Spira Electro2 Inhalation Dosimeter (SPIRA). SPIRA dosimeter actuated the nebulizer with compressed air from the PULMOAIDE compressor, while indicating flow rate in L/sec (FlowDisplay) and tidal volume (TV).
Immediately following inhalation, the subject was seated in front of the gamma camera and aligned in the same position as for the 133Xe equilibrium scan using the alignment procedures described above, while a series of 2-min posterior images (128×128 pixels) were recorded over a period of 94 min to monitor clearance of particles from the lung. The subject returned the following day (18–28 hr post deposition) after the radiolabeled aerosol exposure to obtain a 30-min scan of 24-hr lung activity/retention.
CC methodology
After 64 min of image acquisition, subjects were asked to voluntarily cough 60 times, distributed evenly over the next 26 min. Between 64 and 70 min, subjects coughed 20 times in four five-cough sets. The same number of coughs occurred at 74–80 min and at 84–90 min. The voluntary coughs were performed through a PiKo-1 electronic peak flow meter (Ferraris Medical, Inc., Louisville, CO), and the peak flow rate associated with each fifth cough was recorded. Peak flows for each fifth cough were averaged over the entire cough period.
Regional deposition and clearance analysis of gamma camera images
The 133Xe equilibrium scan was used to identify the outline of the lung field and to create regions of interest (ROIs) for determining the distribution of aerosol in C and P regions of the lung (Fig. 2).(3) MCC/CC and regional deposition were measured from the right lung because of the confounding effects of stomach activity in the left lung. To assess C versus P deposition, two rectangular ROIs were created on the right 133Xe equilibrium lung image: (1) a rectangular region around the entire right lung (along the edges of an isocontour of 15% peak activity) and (2) a C ROI that was positioned and centered on the interior boundary of the lung that included approximately 25% of the area of the whole lung ROI.(3) The P region was the area lying between the C and whole lung outline. We then calculated the ratio of C to P counts from the initial particle deposition scan, (C/P)Tc, and normalized this ratio by dividing by the C/P for the xenon scan, (C/P)Xe;
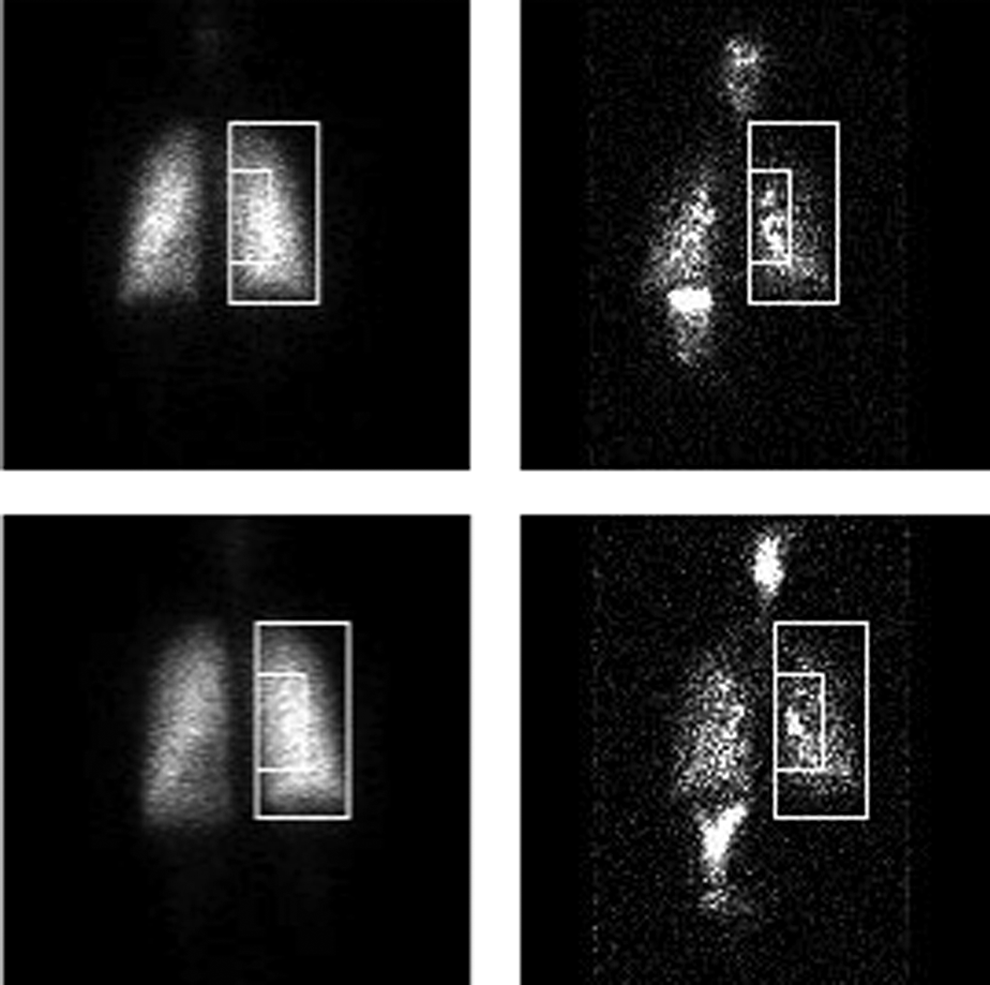
133Xe equilibrium and initial 99mTc-SC aerosol scans with whole lung and central ROI for a male (top) (C/P=1.53) and female (bottom) (C/P=1.54) subject at UNC.
This normalization was done to account for the difference in relative lung areas and thickness between the C and P regions.(14) The C/P ratio provides an index of relative deposition between the two regions that can be used to relate to MCC, i.e., as a covariate to consider in MCC analysis. A C/P of 1.0 reflects equal deposition in each region. However, because the C region outlines both airways and lung parenchyma surrounding these airways, a C/P of about 1 reflects primarily deposition in the pulmonary airspaces distal to anatomic dead space. Increases in C/P to values greater than 1 reflect an increased bronchial airway deposition.
The whole lung ROI of the right lung (Fig. 2) was used to determine, by computer analysis, the whole lung retention (decay and background corrected) as a fraction of the initial counts in the right lung, over the 94-min clearance period. Fractional retention at 10-min intervals throughout the period was determined using the sum of two 2-min images at each time point, e.g., retention at 60 min was determined from the sum of the 60–62- and 62–64-min images. Similarly, R24 was calculated.
Statistical methods
An overall significance level of p≤0.05 was considered to be significant. All values are expressed as the mean (±SD). Comparison of MCC/CC across sites was made by a mixed model analysis (SAS) for retention (a total of 50 subjects, each with nine retention measurements from 10 to 90 min) as a function of time, C/P, site, and gender. Average data at each time point for each of the three centers are presented. In addition, to characterize MCC/CC with a single variable in each individual, the average retention over the 90-min period of observation (AUC90) was computed by area-under-the-curve (AUC) analysis (i.e., average of the 10-min retention values from 10 to 90 min, respectively).(2,3) The same was done for AUC60 (average of retention values at 10–60 min) for MCC and AUC60–90 for the cough (CC) period. AUC analysis provides an average retention for the entire retention versus time curve that is associated in time with the midpoint of the range of time considered (i.e., 35 min for AUC60 and 50 min for AUC90). The AUC90 was then used to compare relationships between MCC/CC with C/P by linear regression analysis, gender comparisons by ANOVA, and for repeat measures comparisons in 16 subjects at UNC.
Results
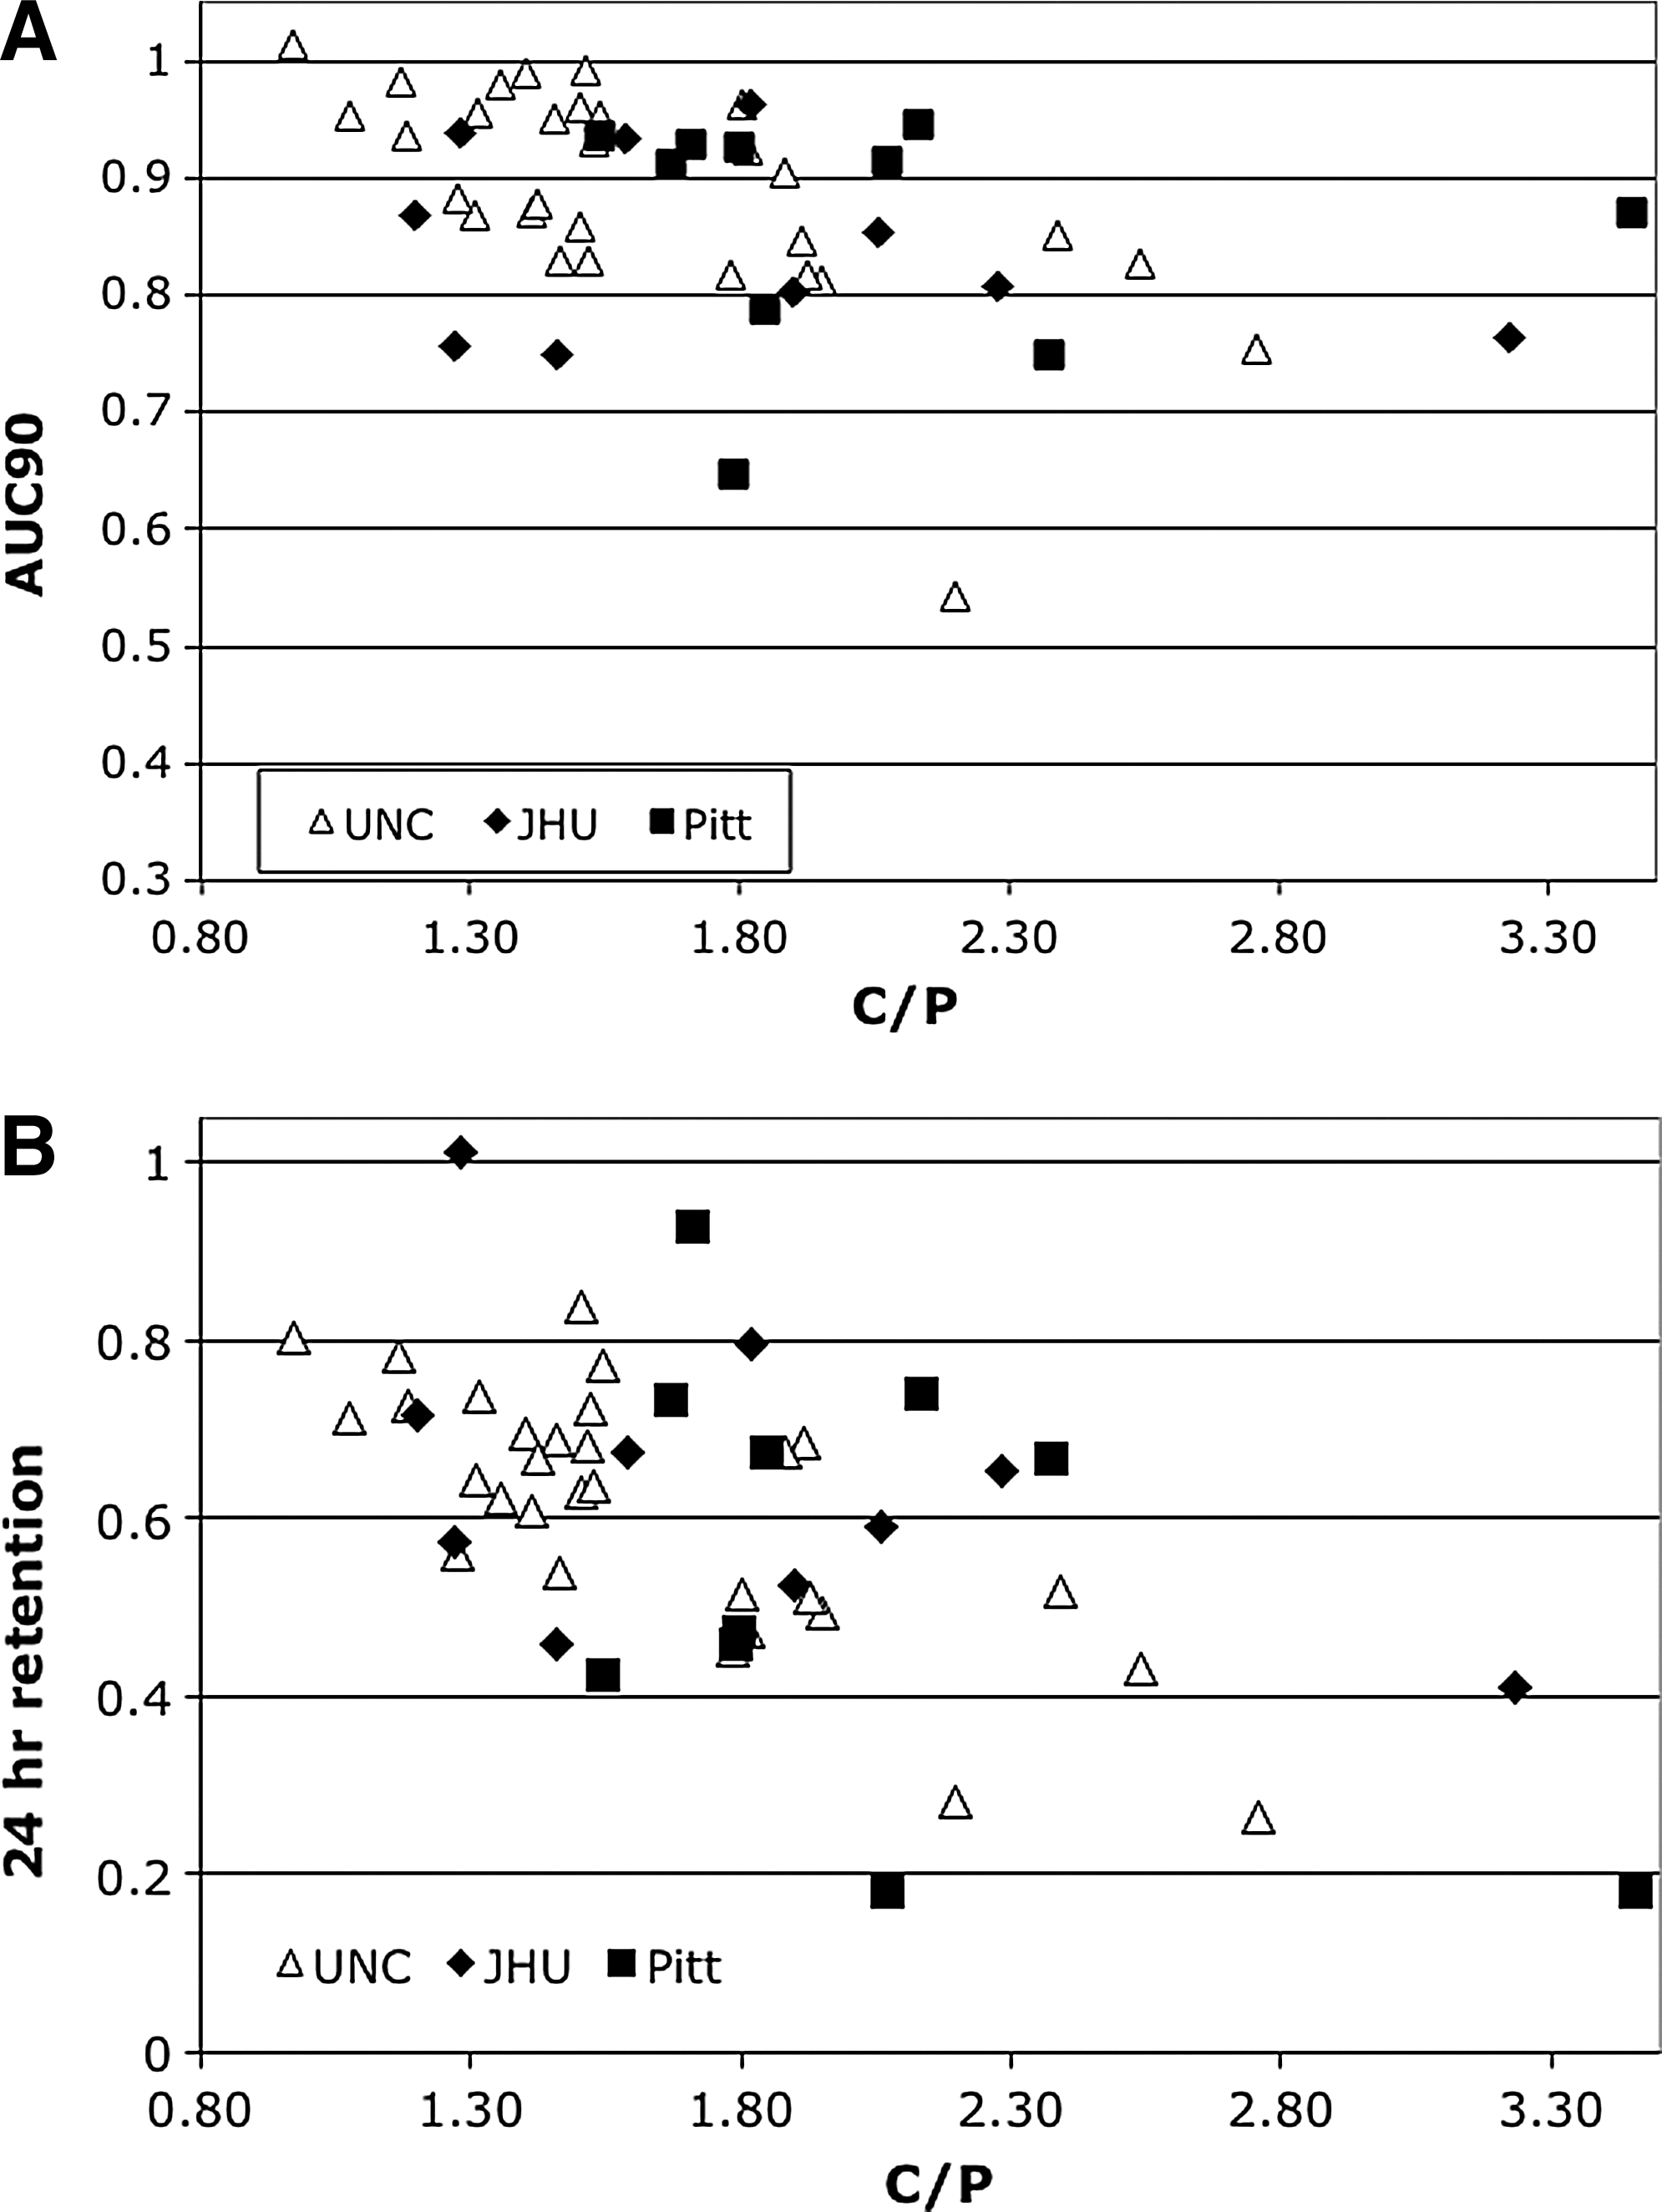
Figure 3 illustrates the retention versus time data for the three sites. Table 2 provides the mean (±SD) C/P and retention values based on AUC analysis for the various time periods by site. There were no differences by site for AUC90, AUC60 (no cough), or AUC60–90 (the period of CC). The only significant difference in values between sites was a larger C/P at Pitt versus UNC (p=0.02). The mixed model analysis showed no significant site-specific effects on retention through 90 min (by either site itself or interactions between site and time, C/P, or gender). The interaction of C/P and time had a significant effect on retention (p<0.0001). Figure 4A illustrates the relationship between AUC90 and C/P by site, showing decreasing AUC90 with increasing C/P (p<0.002). Similarly, R24 was significantly correlated with C/P (Fig. 4B) (p<0.001).

Comparison of average retention at each time point for each of the three sites.
Voluntary cough significantly enhanced clearance rate compared with that immediately pre-cough. For all sites combined, there was a significant increase in fraction cleared during the 60–90-min cough period compared with the 30–60-min pre-cough period (0.10±0.07 vs. 0.06±0.06, respectively; p<0.01). The mean peak flows (±SD) for coughs during the 60–90-min cough period were similar between the three sites (322±115, 368±94, and 336±101 L/min for UNC, JHU, and Pitt, respectively).
Gender was a significant predictor of retention in the mixed model analysis (p=0.02) and by group comparison of AUC90 [mean AUC90=0.90±0.07 (M) vs. 0.84±0.11 (F); p=0.03] (Fig. 5). AUC60 was also significantly different between genders (p=0.01). However, the gender difference in either AUC90 or AUC60 retention was not statistically significant within any given site (best was at UNC with N=30, p=0.10), even though all showed the trend in faster clearance for females. There was no gender difference in either C/P or R24 for all sites combined (mean C/P=1.73±0.31 and 1.76±0.60 and mean R24=0.59±0.18 and 0.61±0.17 for females vs. males, respectively). Mean lung volumes and subject heights differed by gender [mean forced vital capacity (FVC)=3.9±0.6 and 5.2±0.8 L and subject height=165±6 and 180±7 cm for females vs. males, respectively; p<0.001]. There was a significant correlation between AUC90 and lung volume (FVC) (R=0.4, p<0.01), but not with subject height.
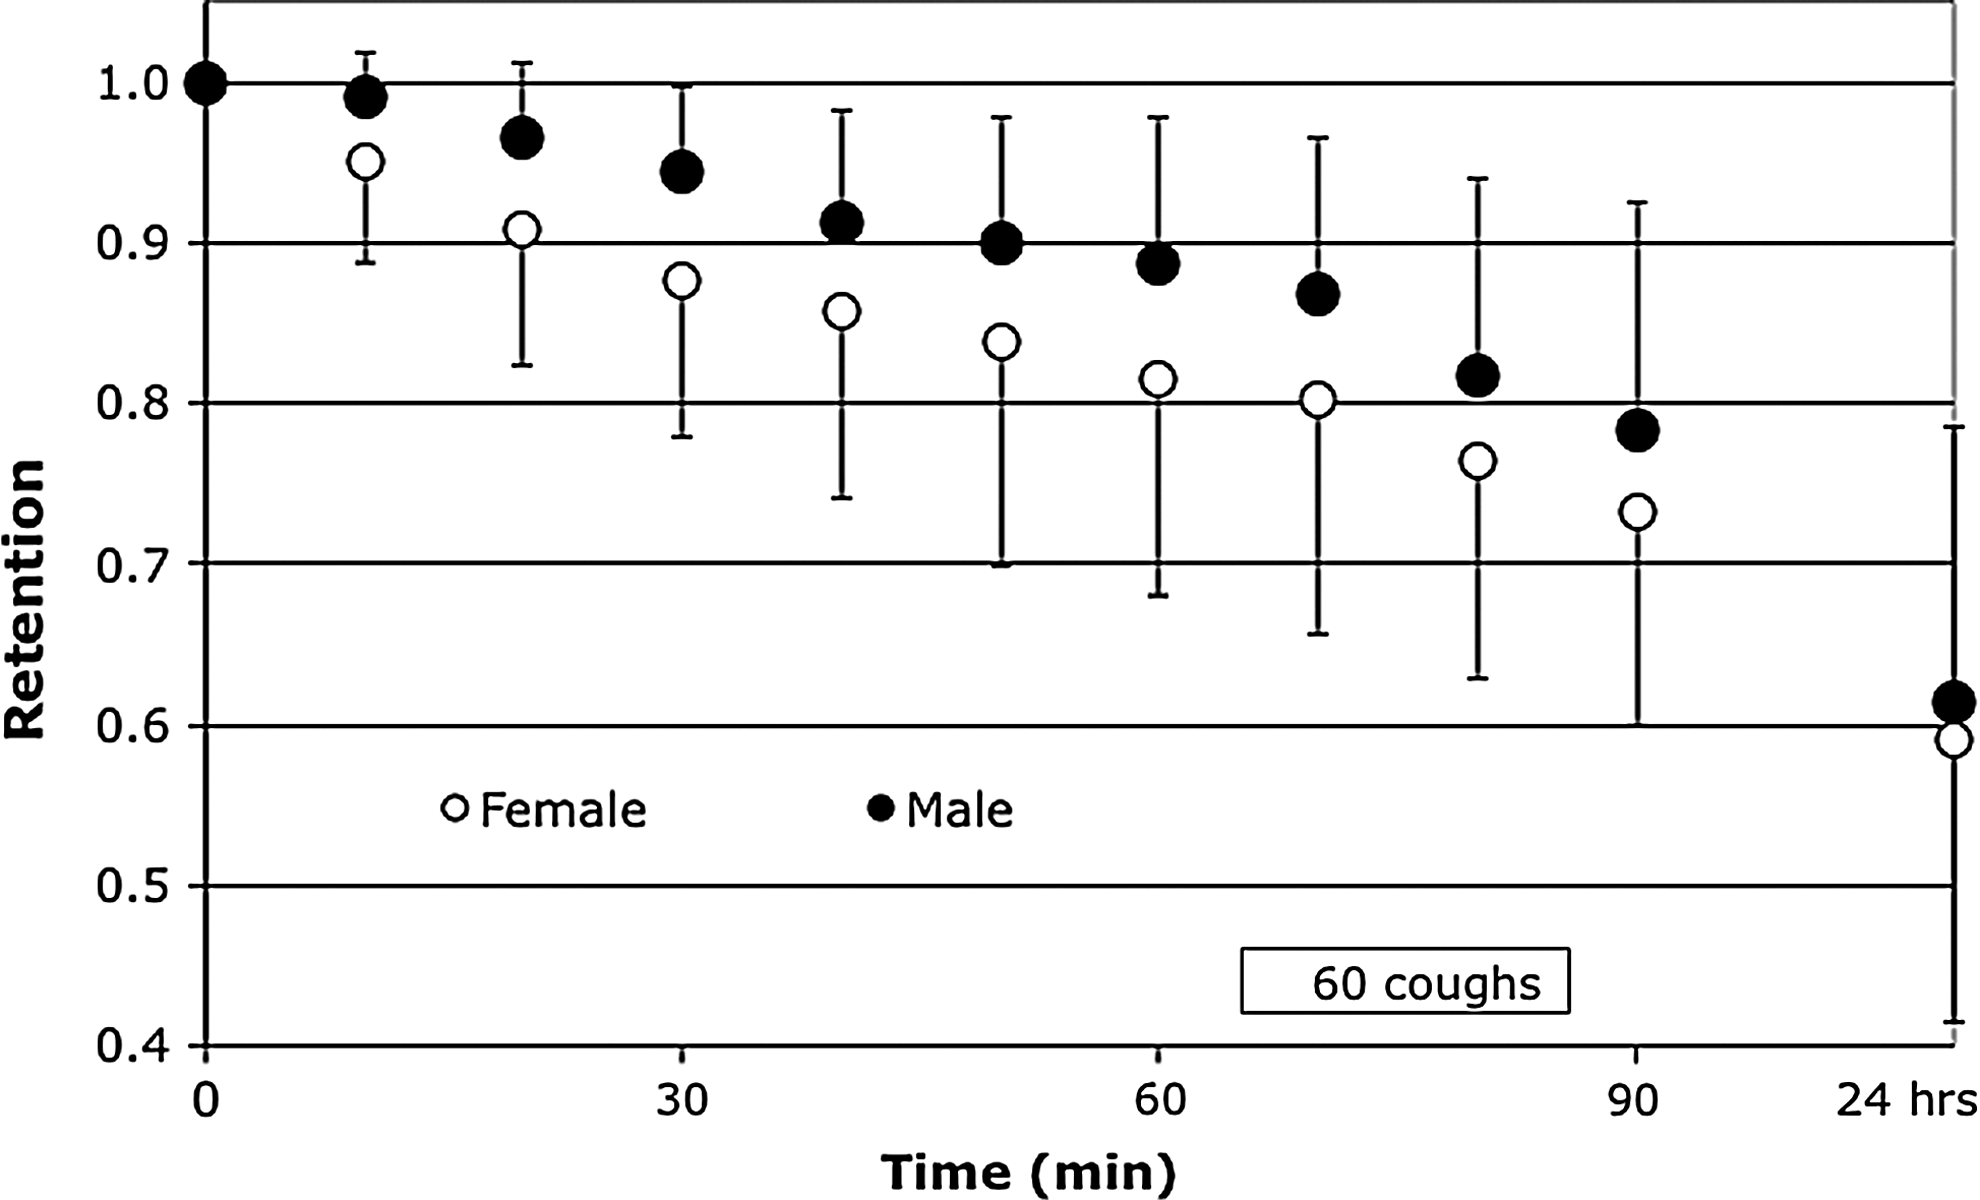
Average retention at each time point for males (n=31) vs. females (n=19) [mean C/P=1.76 (M) vs. 1.73 (F)].
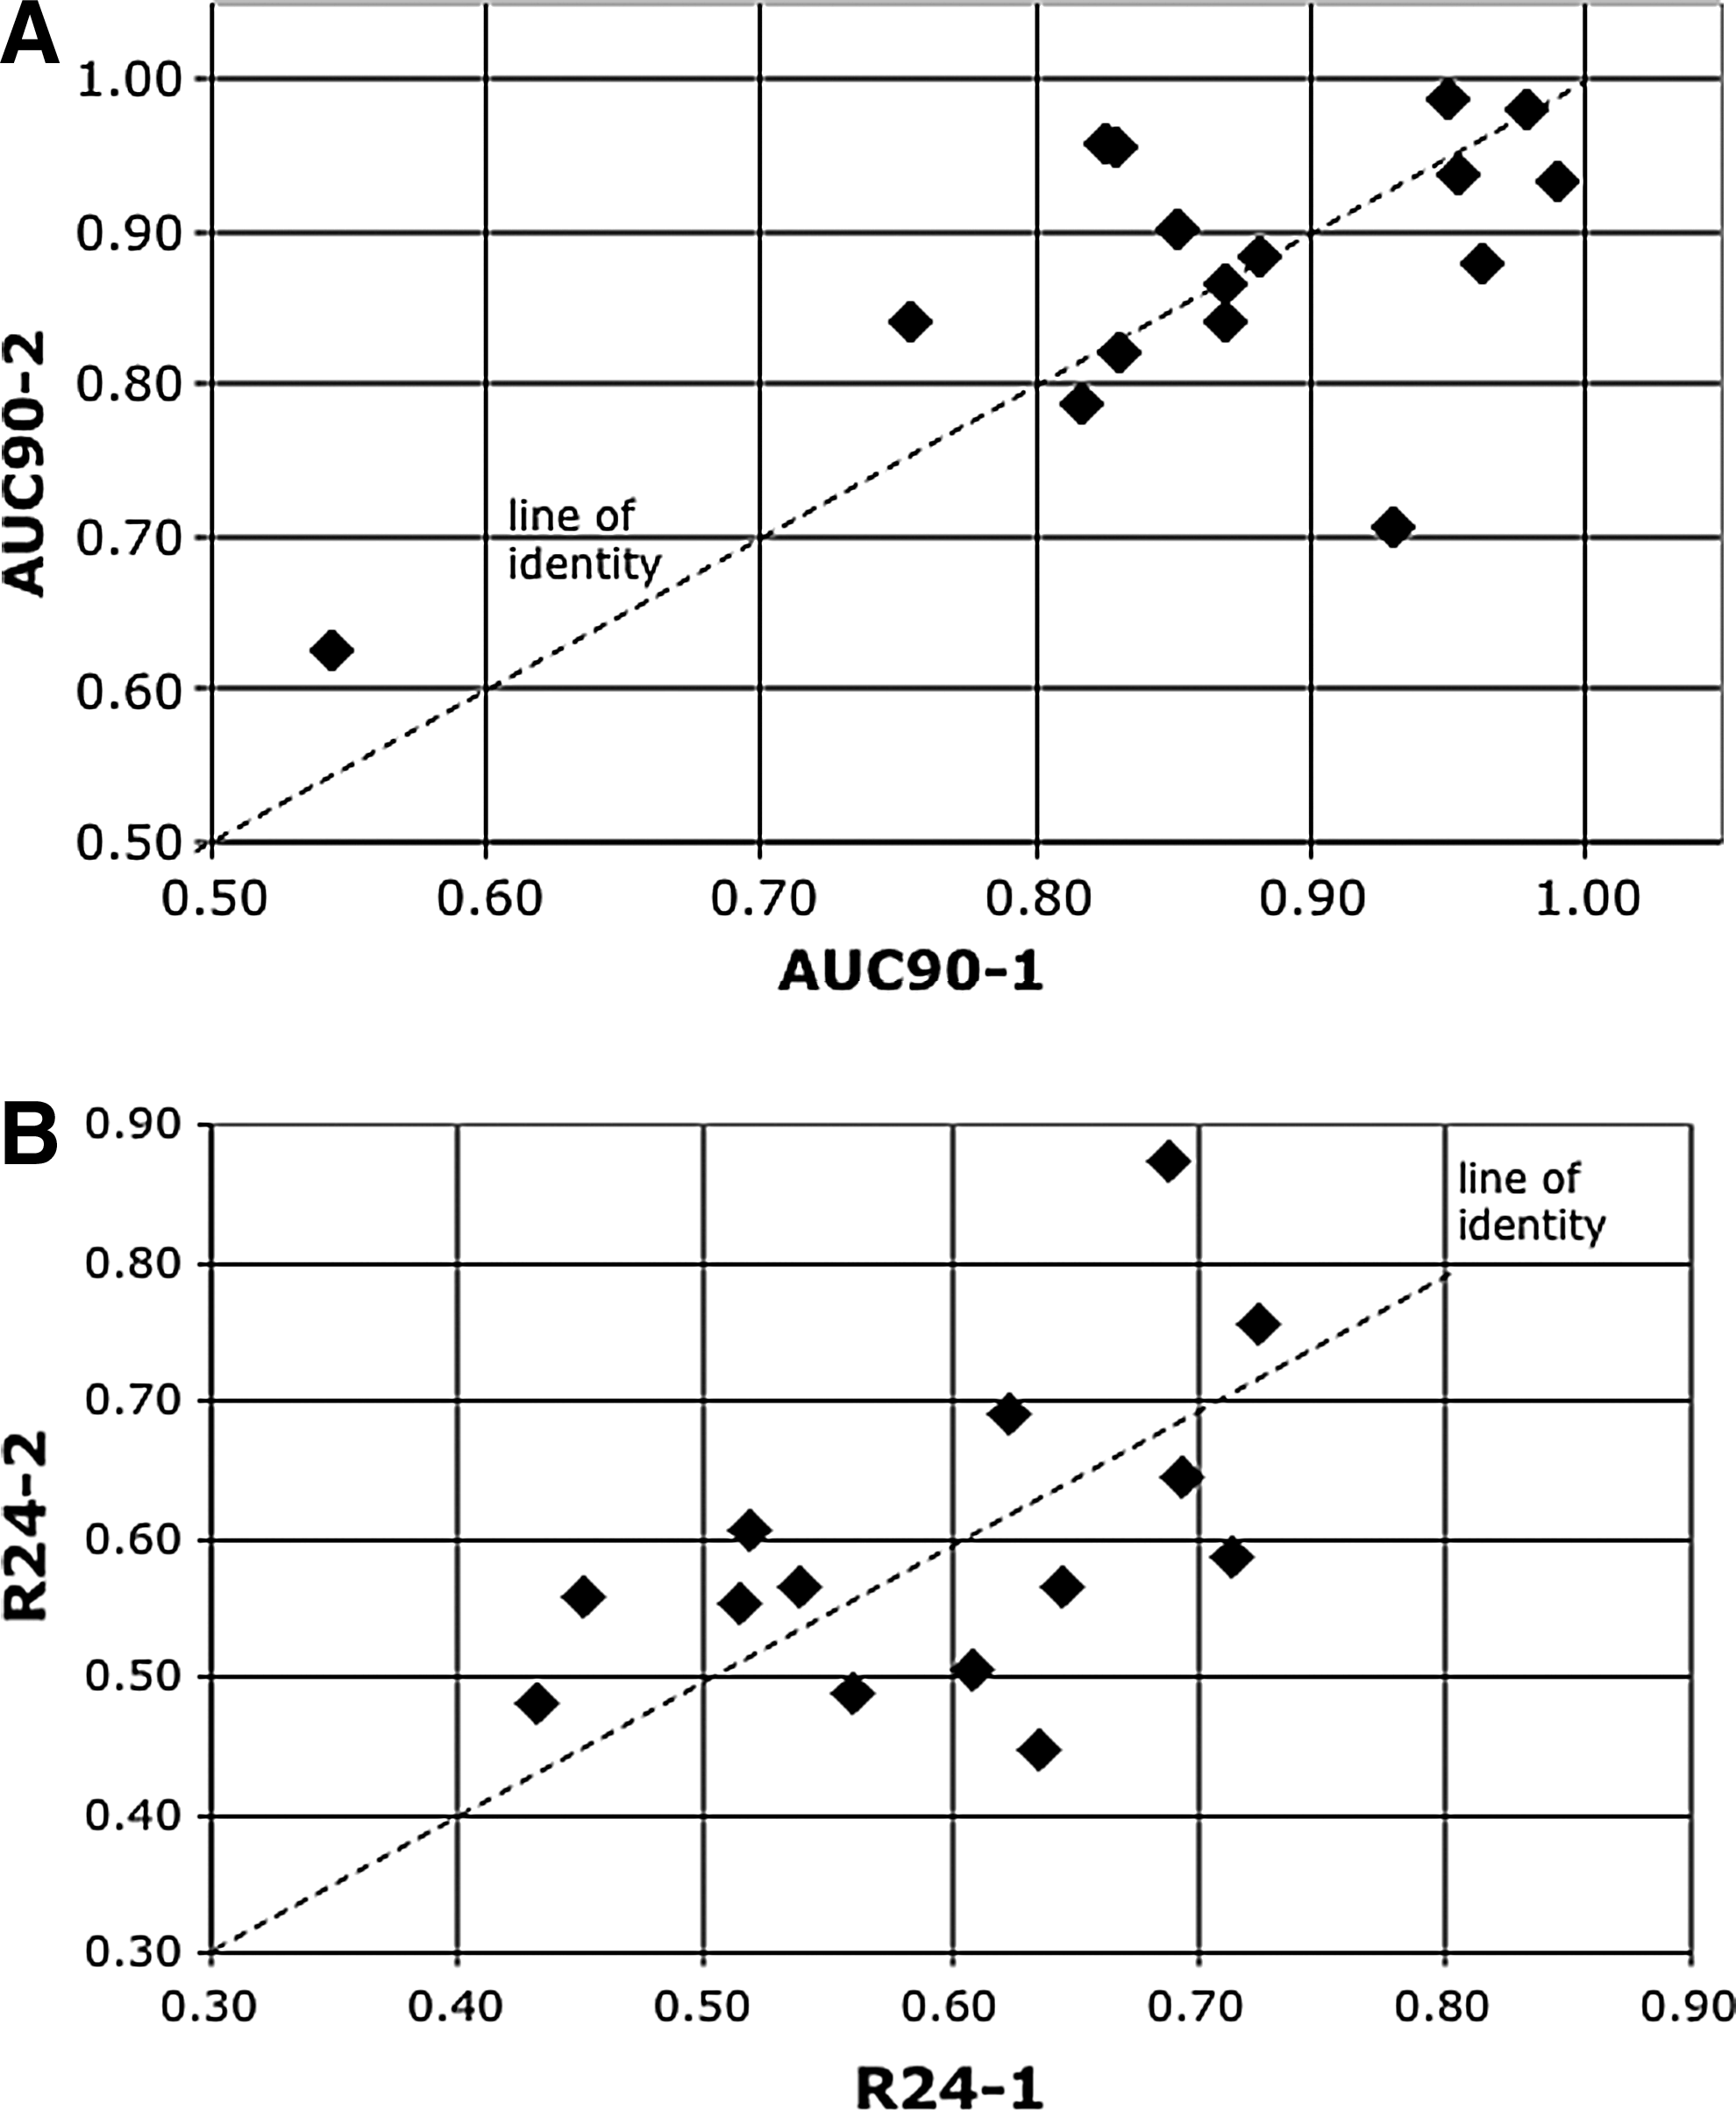
At UNC, measures of MCC/CC were repeated in 16 subjects (Fig. 6). The standard deviations of ΔAUC90 and ΔR24 were 0.087 and 0.10, respectively, for the paired measures. The mean time between measures was 14±7 days, but there was no association between this interval and either ΔAUC90 or ΔR24.
Discussion
Using a standardized method for radioaerosol delivery, we have shown a similarity in lung retention of deposited particles over an initial 90-min period and at 24 hr post deposition at three separate study sites. The choice of particles (99mTc-SC) was based on ease of preparation, stability, and previous evidence that such particles are effectively transported by the mucociliary apparatus in normal and diseased airways.(3–6,13) These particles are readily dispersed in normal saline and can be nebulized to produce aerosol droplets large enough (5 μm MMAD) for deposition in the bronchial airways when inhaled with a suitable breathing pattern. The standardized breathing pattern (500 mL/sec and 30 breaths/min) was similar to that used in previous studies.(3–6) However, this breathing pattern was made simpler and more reproducible between sites with the use of the Spira dosimeter, which provides a flow signal feedback for subjects to monitor. This breathing pattern was chosen because it produced sufficient inspiratory flow rates to allow impaction of particles in the large bronchial airways with a relatively small TV (less than 500 mL) to minimize penetration and deposition of particles in the alveolar region. Nevertheless, the mean R24 of about 0.6 for all sites suggests that a large proportion of alveolar deposition still occurs for the particle size/inhalation pattern used in these studies. Further development of methods should consider optimizing particle size/inhalation maneuvers to allow for an improved “signal” from the bronchial airways.(15)
As a metric for comparing our retention versus time curves in this report, we have used the AUC or average retention over the 90-min period of observation (AUC90) (i.e., average of the 10-min retention values from 10 to 90 min, respectively). There has not been a single method for analyzing retention versus time curves in the literature.(2) Approaches have ranged from reporting retentions at a given time point to multiexponential fits of the retention versus time data. Once an intervention occurs, e.g., in our case CC or with therapies,(5,6) it becomes more difficult to attribute exponential decay to these data. Exponential fits of retention versus time data may also be better than linear fits over very long observation periods. Figure 7 shows that, for the period of MCC observation in our study prior to cough intervention (60 min), there is no difference between a single exponential versus a linear fit of the data and the slopes (either exponential or linear in percent clearance/time is similar between the two fits), e.g., 0.23 and 0.21%/min, respectively, for the UNC data in Figure 3. For retention versus time data where the time points are equally separated, e.g., every 10 min in our case, the average of the retentions over that period (e.g., 10–60 min for AUC60), or AUC, provides a similar metric to the slope for linear fit through the retention values. For example, the AUC60 (Table 2) for UNC is 0.92 (associated with the mean retention at the midpoint of the time points, 35 min). To obtain an average %/min cleared, one would divide 100 * (1 – 0.92) by the average time point of the data, in this case 35 min, to get 0.23%/min (similar to the linear and exponential slopes discussed above). In other words, all these metrics provide similar characterization of the retention versus time data over our period of observation. In the interest of simplicity, we propose to take the average of the 10-min retention values over the period of observation (AUC analysis) for data with equally spaced retention values in time. For different data sets, e.g., uneven time intervals or longer periods of observation, linear or exponential fits may be more appropriate.
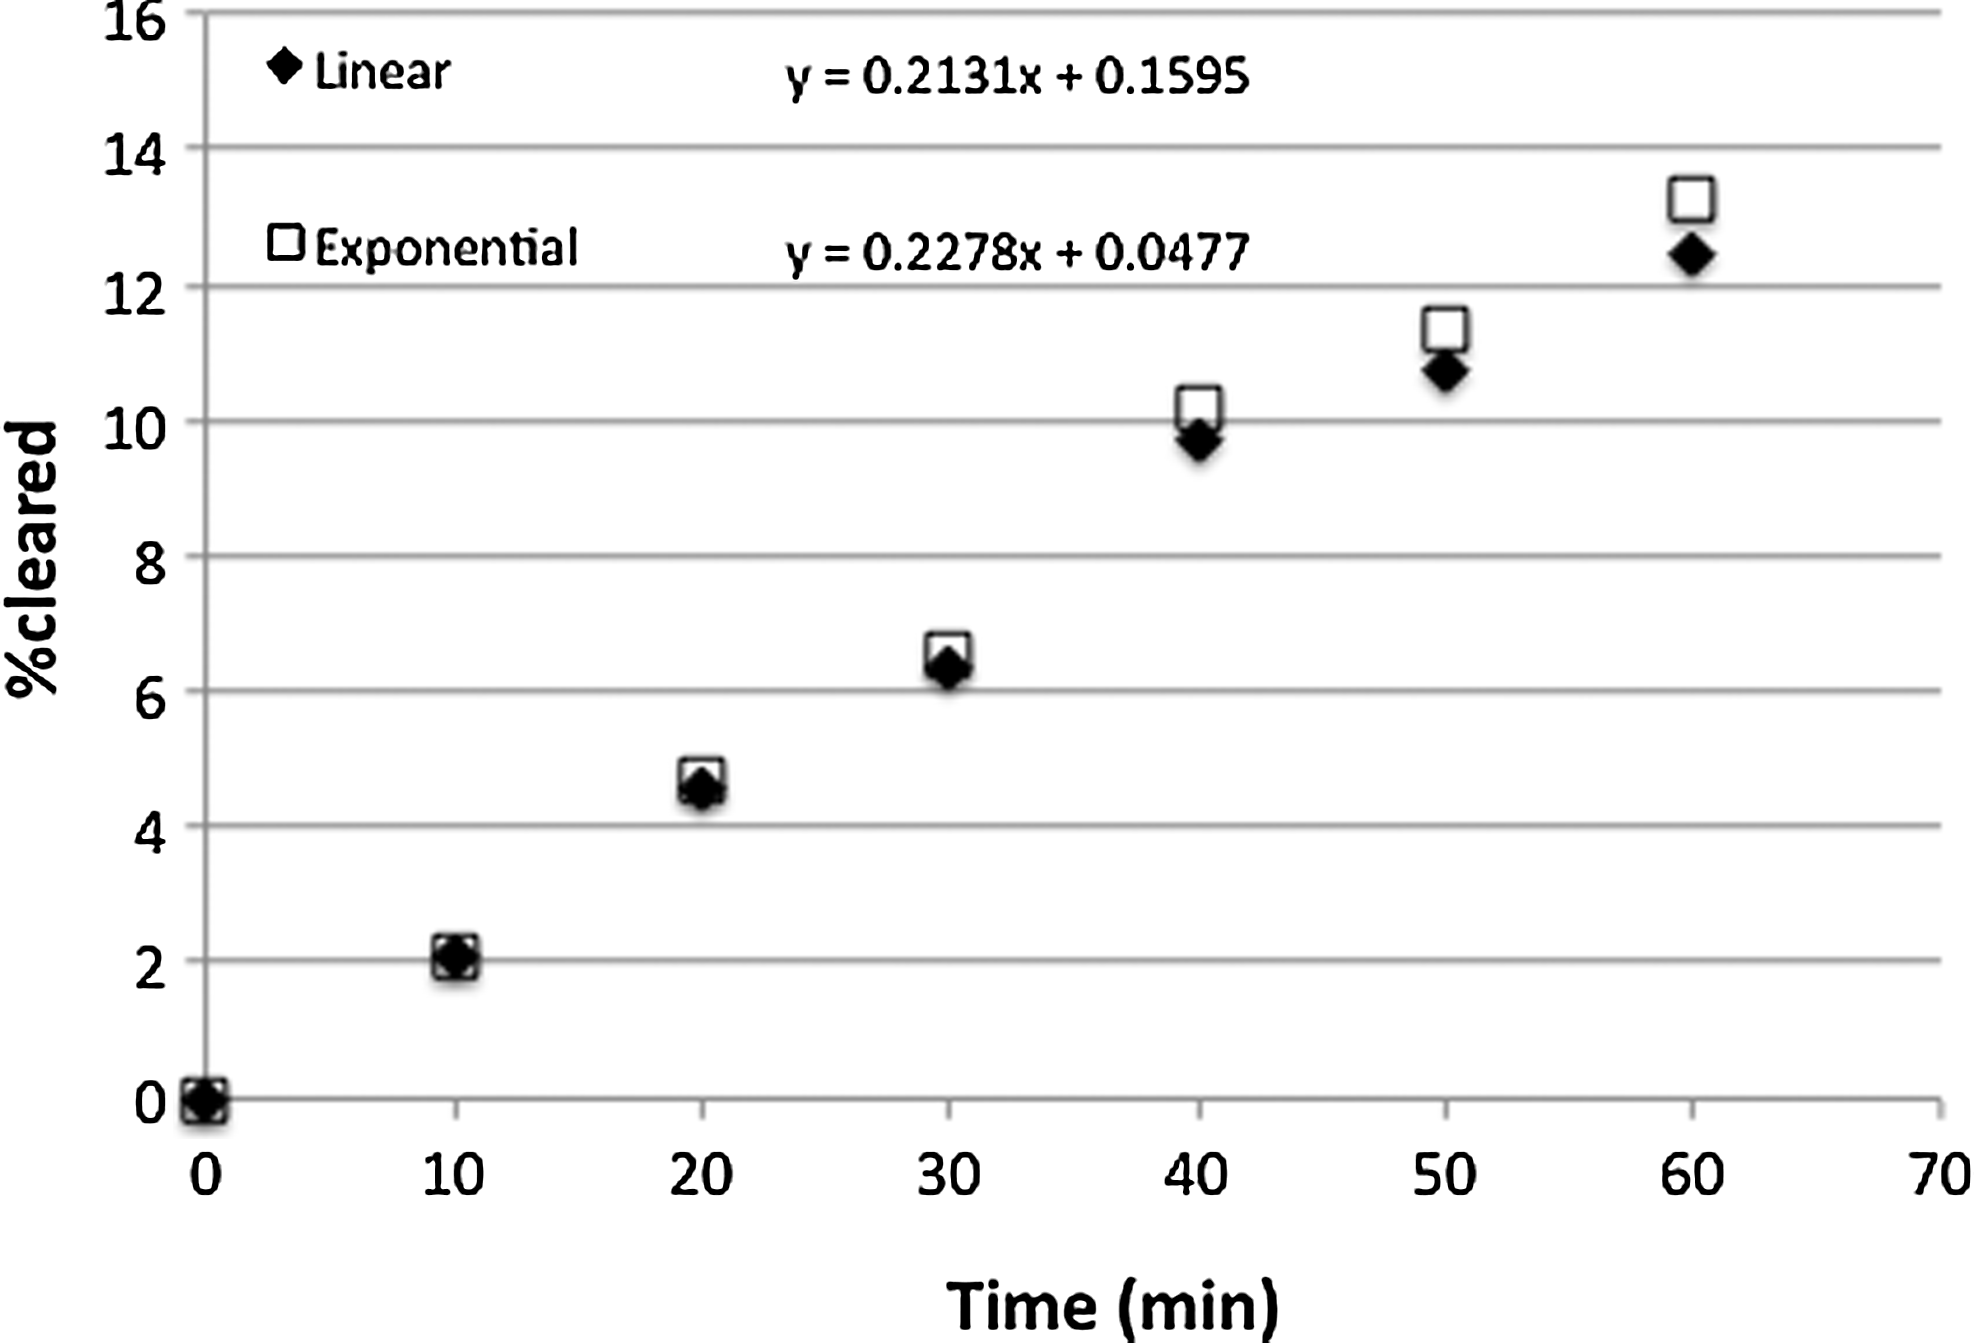
Comparison of linear (data expressed as % cleared=100 * [1 – Ret(t)]) vs. exponential (data expressed as % cleared=100 * [–Ln (Ret(t))]) fit for UNC mean data in Figure 3. R2=0.99 for both regressions.
As others,(7–9) we found a relationship between regional deposition (i.e., C/P ratio) and clearance of particles from the lungs, such that increasing C/P was associated with a greater fraction of particles cleared over a given time (Fig. 4). Nevertheless, there was considerable variability in these C/P versus clearance regressions, suggesting that the C/P ratio may not be the most sensitive deposition index to relate to subsequent clearance. For these comparisons, we used a 133Xe equilibrium scan to outline the lung and normalize C/P ratios for differences in lung area/volume between the C and P regions. We recognize the limitations that may occur with this approach in patients with severe lung disease, where 133Xe gas may not equilibrate evenly through all portions of the lung. It may be that transmission scans,(4,5) with either 99mTc or 57Co flood sources, will prove more useful in such patients for lung definition, although that approach may present different limitations. A comparison of these two methodologies for defining the lung for regional analysis of deposition should be considered as the methodologies are further refined. It also may be that other indices of regional deposition that are not dependent on specific ROIs may provide more sensitive measures of airway versus alveolar deposition. For example, the coefficient of skew for the histogram distribution (counts/pixel versus no. of pixels) within the whole lung ROI increases with increased frequency of “hot spots” in the lung.(16) It is assumed that these hot spots are due to increased deposition within bronchial airways throughout the lung (i.e., not only within the C region), making skew independent of a specific region within the lung.
In our comparisons, we obtained an index of CC, by incorporating controlled, voluntary coughs during the 60–90-min period of retention versus time acquisition. We also showed similarity of clearance during this period of observation between the three sites. Consistent with previous studies,(17) we found that cough significantly enhanced clearance in our healthy subjects [i.e., as indicated by the increase in fraction cleared between the pre-cough (30–60 min) and cough (60–90 min) periods]. Clearly, these measures are the result of both mucociliary and cough action during this period and, in fact, may still be dominated by the former in healthy subjects. However, there was a greater fraction of particles cleared during the 30 min of coughing (60–90 min) compared with that during the 30 min immediately pre-cough (30–60 min), i.e., the normal rate of clearance would have been lower during 60–90 min had we not intervened with cough. On the other hand, for some patient groups (e.g., primary ciliary dyskinesia), the primary mechanism of interest may be that of coughing. Furthermore, delaying measures of cough clearance beyond 1–2 hr likely diminishes any chance of seeing effects on CC, because it is generally believed that cough is most effective in the larger bronchial airways, and these usually clear during the first 1–2 hr of observation.(13) Whether or not to incorporate controlled coughing into a study design may depend on the patient group and/or the therapeutic intervention to be studied.(2) Postintervention measures of baseline MCC may also be important (e.g., beyond 90 min in our case) for understanding the effect of the intervention. However, it should also be recognized that postintervention MCC may be slower simply because the signal (tracer) has been removed from the fastest clearing airways by the end of the intervention, i.e., not that the intervention has resulted in a slowing of MCC post intervention.
We observed significantly faster clearance through 90 min in females versus males in our combined data set. Furthermore, this finding was not dependent on gender differences in regional deposition, i.e., there were no differences in C/P ratio or R24 between the two groups. This finding suggests that gender distribution should be considered in study design and data analysis when comparing an intervention at one, or several sites, in future clinical studies of MCC. Our observed differences in gender are similar to those previously reported by others. Svartengren et al.(18) reported a higher percent retention (i.e., slower MCC) in healthy males (41±23%) versus females (26±17%) 2 hr after inhalation of 6-μm particles, and Garrard et al.(19) reported slower proximal clearance in nine men compared with four women. On the other hand, Yeates et al.(20) reported no difference in tracheal transport rates in 32 healthy men versus 10 healthy women, and Hasani et al.(21) also found no gender difference in tracheobronchial MCC (i.e., corrected for 24-hr retentions) over a 6-hr period. The explanation for our observed gender differences in MCC is unknown. However, our data suggest that the gender difference might be most evident in the early period of observation post deposition of the radioaerosol, which involves clearance from the most proximal bronchi. Compared with adult males, females likely contain proximal bronchi with shorter pathway lengths(22–24) and consequently shorter times required for particle transit and clearance. These airway path lengths may not correlate with the patient's height, because we observed no relationship between AUC90 and subject height in this study.
Repeat measures at the UNC site provide paired standard deviation data that should be useful for calculating sample sizes in crossover studies of MCC/CC associated with an intervention. For example, to show a decrease of 0.065 in AUC90 [i.e., an improvement of 50% in MCC/CC associated with an intervention over the mean AUC90 of 0.87 (i.e., 0.13 clearance) for this group of subjects], an N of 15 would be required for a two-sided paired analysis with α=0.05 and power=0.80. Previous studies at UNC in healthy subjects (n≤15), using methods similar to those described here, have found statistically significant enhancement of MCC/CC following an intervention,(12,17,25,26) e.g., we found an 80% enhancement of MCC with aerosolized uridine 5′-triphosphate compared with normal saline in n=12 healthy adults.(25) Repeatability in patients, e.g., in CF, should also be determined, but previous studies also suggest that therapeutic improvements can be observed in such patients(3,27) with similar patient numbers (n≤15) also using methods similar to those described here.
R24 has been used as an index of alveolar versus airway deposition of the inhaled radioparticles. Consequently, repeat measures of R24 provide data on our ability to reproduce regional deposition from day to day. The repeatability of R24 (Fig. 6B) may have been affected by the relatively low deposited activity (40 μCi) that was used in these experiments compared with others.(2) Despite this, we were able to show significant correlations between C/P and R24 (Fig. 4B), some degree of repeatability (Fig. 6B), and, previously, the ability to observe effects on R24 associated with treatment in CF(3) with relatively low numbers of patients studied (n=12). Minimizing radiation dose per MCC measure may be especially important when subjects are studied multiple times (e.g., to test combinations of drugs/placebo, and duration of action). Because the initial activity will have decayed 4 half-lives by 24 hr post deposition, it is important to acquire the image for sufficient time (at least 30 min) to ensure that the statistical errors in the lung count after subtraction of background are sufficiently small. In these studies, the measurements of R24 were not always made at precisely 24 hr post deposition. If the variability in R24 were primarily due to low signal to background at these time points, we would expect the repeat measures to be more variable with greater differences in actual “24-hr times” post deposition between the repeat measures. Among the 16 repeat measures of R24, 10 subjects had differences of less than 90 min between their “24-hr times” and the other six had a difference of greater than 200 min. Interestingly, the variability of repeat R24 measures was no different between these two groups (mean ΔR24=0.09 for those with less than 90-min difference versus ΔR24=0.06 for those with greater than 200- min difference in “24- hr time”). The fact that those with greater differences in the time associated with their repeat R24 measures were no more variable (similar absolute difference) than those closer in time would suggest that the loss of signal associated with low initial counts and isotope decay is not primarily responsible for the intersubject variability we see in R24 (Fig. 6B).
Conclusions
Using standardized methods, we found that MCC and MCC/CC were similar in healthy adult subjects studied at three different sites. In addition, clearance was significantly faster in females than males over the 60- and 90-min periods post deposition of radioaerosol, suggesting a gender difference in large airway clearance. The standardized protocol used here may prove beneficial in multicenter trials for testing new therapies that are designed to improve MCC and MCC/CC, allowing more subjects to be studied in a shorter period of time, and thus bringing new therapies to patients more rapidly. Toward that end, multisite comparisons and repeatability for MCC/CC in patients with airways disease should also be determined. Further improvements to the methodology described here may provide greater differentiation between airway versus alveolar deposition of particles, thereby enhancing the MCC/CC signal and leading to greater sensitivity for assessing therapeutic effects.
Footnotes
Acknowledgments
This study was funded by a grant from the CF Foundation. We gratefully acknowledge the statistical input of Hongtao Zhang and Haibo Zhou, PhD, and for the mixed model analysis of MCC data.
Author Disclosure Statement
The authors declare that no conflicts of interest exist.