




Abstract
Abstract
Background:
Dosing of tobramycin solution for inhalation (TSI) in cystic fibrosis (CF) patients was based on single-dose pharmacokinetic studies. This investigation was prompted by evidence of possible antibiotic accumulation in respiratory secretions with repeated dosing. The objectives were to evaluate whether tobramycin accumulates in respiratory secretions with repeated inhalation, compare total and biologically active tobramycin concentrations in CF sputum, and evaluate sputum induction for obtaining secretions for drug concentration assay.
Methods
: Individuals with CF ≥10 years of age were enrolled at the beginning of a course of TSI, 300 mg twice daily for 28 days. Two study visits were conducted, 1–2 days and 24–28 days after initiation of TSI treatment. Induced sputum and expectorated sputum samples were collected for measurement of trough and peak tobramycin concentrations at each visit. Total tobramycin concentrations were measured by high-pressure liquid chromatography and bioactive concentrations by bioassay.
Results:
Twenty participants completed the study. Trough concentrations were similar at visits 1 and 2, as were peak concentrations. Trough bioactive and total tobramycin concentrations were similar (mean ratio 1.2, 95% CI 0.56, 1.87), but peak bioactive concentrations were significantly lower than peak total concentrations (mean ratio 0.33, 95% CI 0.23, 0.44). Sputum induction was well tolerated.
Conclusions
Introduction
The twice-daily TSI dosing regimen was based in large part on studies of tobramycin concentrations in expectorated sputum (ES) after administration of a single dose to adolescents and adults with CF, in which high but variable peak sputum tobramycin concentrations were achieved, followed by a rapid decline in concentrations.(3–5) Although these single-dose studies suggested a short sputum half-life, we found evidence of potential tobramycin accumulation in respiratory secretions with repeated dosing in CF patients <6 years old.(6) In that trial of TSI 300 mg twice daily for 28 days followed by bronchoalveolar lavage (BAL), tobramycin was detectable in the epithelial lining fluid (ELF) an average of 12 hr after the last dose, at a mean [standard deviation (SD)] concentration of 74 (50) μg/mL. In an earlier study, the mean (SD) ELF tobramycin concentration ∼45 min after a single 300-mg dose of TSI in young CF patients was 90 (54) μg/mL.(7) The similarity between tobramycin concentrations 45 min after a single dose and 12 hr after 28 days of exposure suggested possible drug accumulation with repeated dosing. Evidence of TSI accumulation in respiratory secretions could inform investigation of alternate dosing strategies (less frequent dosing or shorter duration) that might provide equal efficacy with less overall exposure, cost, and burden.
CF sputum is known to partially inactivate aminoglycosides, due to high concentrations of divalent cations, low pH, and binding by extracellular DNA fibrils and mucin.(8,9) In vitro investigations have suggested that bioactive tobramycin concentrations may be 10–25-fold lower than total drug concentrations in CF sputum.(10,11) Prior pharmacokinetic studies have measured tobramycin concentrations in CF sputum only by chemical means [immunoassay or high-pressure liquid chromatography (HPLC)].(3–5,12) In the current study, measurement of sputum tobramycin concentrations by bioassay(13) as well as HPLC allowed, for the first time, a comparison of bioactive and total tobramycin concentrations in respiratory secretions.
Sputum induction by inhalation of hypertonic saline allows noninvasive sampling of respiratory secretions from patients unable to expectorate sputum, and appears to sample the more distal conducting airways,(14) the site of infection in CF. Feasibility and safety of sputum induction have been demonstrated in stable CF patients with mild to moderate lung disease.(15,16) Sputum induction offers high recovery rates of bacterial pathogens, inflammatory cells, and proinflammatory cytokines.(16–18) Although to our knowledge it has never been utilized to assess airway drug concentrations, sputum induction has the potential to offer a safe, noninvasive alternative to BAL in pre-expectorating young CF patients, and may allow measurement of antibiotic concentrations more directly at the site of infection than ES.
This pilot study was designed to evaluate whether tobramycin accumulates in respiratory secretions of CF patients with repeated inhalation, to compare total and biologically active tobramycin concentrations in CF sputum, and to evaluate sputum induction as a means of obtaining secretions for assay of drug concentrations.
Materials and Methods
Individuals with CF ≥10 years of age were enrolled in an Institutional Review Board (IRB)–approved protocol at two CF care centers between July 2003 and February 2006. Inclusion criteria included an established diagnosis of CF, ability to expectorate sputum, and 1-sec forced expiratory volume (FEV1) of ≥50% of predicted.(19) In addition, participants had to be prescribed TSI (300 mg twice daily for 28 days) for clinical indications, or they had to have Pa isolated from their most recent respiratory culture, with a history of TSI treatment within the past 5 years and willingness to complete a course of TSI 300 mg twice daily for 28 days (TOBI®; Novartis Pharmaceuticals, Cambridge, MA). Exclusion criteria included treatment with TSI or any other aminoglycoside within the preceding 2 weeks, oxygen saturation ≤92% on room air, hemoptysis within the past 3 months, diagnosis of pneumonia or pneumothorax, or sensitivity to β-agonists or TSI.
Two study visits were conducted; visit 1 was scheduled 1–2 days after initiation of TSI (i.e., around the second or third dose of TSI) to measure tobramycin concentrations associated with acute therapy, and visit 2 was scheduled after 24–28 days of TSI treatment to measure tobramycin concentrations associated with chronic administration. Induced sputum (IS) and ES samples were collected for measurement of tobramycin trough and peak levels at each visit. Participants were randomized (1:1) into two groups, stratified on study site. Group 1 participants provided trough IS and peak ES samples at each visit. Group 2 participants provided trough ES and peak IS samples at each visit. This study design was motivated by two concerns. First, the potential risks of repeated sputum induction precluded obtaining both peak and trough samples by sputum induction during a single study visit. Concerns that obtaining both expectorated and induced samples at the same time point (peak or trough) might falsely lower the apparent concentration in the second sample precluded obtaining expectorated and induced samples at the same time point in an individual participant.
IS and ES samples were collected according to standardized protocols. Study visits were scheduled 10–14 hr following a TSI dose at home. At the study visit, a trough sample was collected immediately preceding administration of a TSI dose, and a peak sample was collected 15 min after TSI administration.(3,4) The TSI dose at the study visit was administered via Pari LC Plus nebulizer and Pulmo-Aide® compressor (DeVilbiss Healthcare, Somerset, PA). Prior to collection of each trough or peak sample, participants performed three oral rinses with sterile saline and then expectorated to remove residual oral tobramycin. All sputum samples were collected in sterile plastic containers and frozen at −70°C.
For IS sample collection, participants were pretreated with albuterol via metered dose inhaler. Participants inhaled nebulized sterile 3% hypertonic saline solution for 12 min using an Ultra-Neb 99 ultrasonic nebulizer (DeVilbiss Healthcare) according to the protocol of Fahy et al.(20) At 4-min intervals, participants expelled saliva and were then encouraged to cough and expectorate sputum. Peak flow monitoring was performed after albuterol administration and every 4 min during sputum expectoration, and if the value dropped to ≤80% of the post-albuterol value, spirometry was repeated. Sputum induction was terminated if FEV1 was ≤80% of the post-albuterol value. Samples were considered unacceptable for study purposes if sputum induction time was <4 min or if the IS sample volume was <0.5 mL.
Total tobramycin concentrations in IS and ES samples were measured by HPLC using a modification of the method of Baran et al.(21) All measurements were performed in triplicate. The lower limit of quantitation (LLQ) for the HPLC assay was 2 μg/g.
Bioactive tobramycin concentrations in IS and ES samples were measured according to the standard Clinical and Laboratory Standards Institute protocol, a modification of the methods of Bennett et al.(13) and Lehrer et al.(22) For the bioassay, plates were poured with a 1-mm-thick lawn of Bacillus subtilis in cation-depleted Mueller-Hinton agar, and 5.5-mm-diameter wells were punched into the lawns. Homogenized sputum (75 μl) was added per well and incubated at 35°C for 10–20 hr, and the resultant clear zone around each sample was measured. Bioactive tobramycin concentrations were determined by referencing a standard curve generated by adding known tobramycin concentrations to nonbacteriostatic saline solution. Results are therefore independent of the bacterial species used. Each sample was assayed in triplicate, with standard concentrations assayed in duplicate on the same plate.
The target sample size of this pilot study was 20 participants (10 per group), providing 88% power to detect a 1 SD change in tobramycin concentration, assuming a one-sample t test on paired data (two-sided α=0.05). Based on the unexpected finding of high trough tobramycin concentrations at visit 1, despite the exclusion criteria of no treatment with TSI or any other aminoglycoside in the 2 weeks preceding enrollment, five additional participants were recruited as part of an IRB-approved study extension designed to characterize sputum tobramycin concentrations at a time when there had been no recent aminoglycoside exposure. Entry criteria were similar to those in the original study, with the added requirement of at least one 28-day course of TSI in the past 12 months with no aminoglycosides (intravenous or inhaled) for at least 3 weeks prior to enrollment. Participants in the study extension had a single study visit with collection of an ES sample for measurement of HPLC tobramycin concentration.
Data were reported using descriptive statistics. For HPLC and bioactive tobramycin concentrations, the mean value of triplicate measurements was analyzed. Trough and peak tobramycin concentrations were summarized using descriptive statistics and graphical displays. Comparisons of tobramycin concentrations between visit 1 and visit 2 were performed using the Wilcoxon matched-pairs signed-rank test. Comparisons of tobramycin concentrations in IS versus ES at each visit were performed using the Wilcoxon rank-sum test. To compare bioactive versus total (HPLC) tobramycin, concentrations were expressed as ratios, and the significance of each ratio was tested relative to a null value of 1.0 in a regression model that accounted for repeated observations per participant.
Analyses were performed using Stata 9.2 (StataCorp LP, College Station, TX) and Splus 6.2 (TIBCO Software Inc., Palo Alto, CA).
Results
A total of 20 participants (10 per group) completed both study visits; their demographic and clinical characteristics are reported in Table 1. Six additional participants were enrolled but then withdrawn before completing one or both study visits; three did not meet eligibility criteria, two experienced an adverse event (drop in FEV1 during sputum induction at first study visit and occurrence of pulmonary exacerbation), and one was withdrawn due to participant decision.
Group 1, trough IS and peak ES; Group 2, trough ES and peak IS.
Results shown are either N (%) or mean (SD).
Trough sputum samples were collected an average of 11.8 (SD 1.1) hr following the TSI dose at visit 1 and 11.6 (SD 1.6) hr at visit 2. Peak sputum samples were collected an average of 0.6 (SD 0.1) hr following the TSI dose at visit 1 and 0.5 (SD 0.1) hr following the TSI dose at visit 2. Time from TSI dose to collection of peak ES sample at visit 2 was missing for three participants. There was no significant difference in time from TSI dose to sputum sample collection between groups or between study visits.
HPLC trough and peak tobramycin concentrations for each group, visit, and sample type are shown in Table 2. Three features of tobramycin concentrations are evident. First, concentrations were variable. At visit 1, trough concentrations (per protocol, collected 12–15 hr after the first or second dose) ranged from nondetectable to 735 μg/g, including four participants with trough tobramycin concentrations greater than 100 μg/g (three IS samples and one ES sample). At visit 2, trough concentrations ranged from nondetectable to 2,126 μg/g. Peak values were similarly variable, ranging from 32 to 4,138 μg/g. Second, there was no evidence of significant accumulation of tobramycin with repeated dosing in the group as a whole, as the visit 2:visit 1 ratio of mean trough and peak concentrations was not significantly different from unity. Finally, concentrations in ES and IS were not significantly different, with the exception of peak values at visit 1, where concentrations were higher in ES (p=0.006).
Group 1, trough IS and peak ES.
Group 2, trough ES and peak IS. IS and ES samples at visit 2 for one participant were lost in transit.
p values reflect the Wilcoxon matched-pairs signed-rank test comparing concentrations between visits 1 and 2. Within each visit, we also compared trough IS vs. trough ES and peak IS vs. peak ES concentrations by the Wilcoxon rank-sum test. Resulting p values for trough IS vs. ES were p=0.16 (visit 1) and p=0.35 (visit 2); p values for peak IS vs. ES were p=0.006 (visit 1) and p=0.22 (visit 2).
The change in total tobramycin concentration for individual participants over the course of the study is depicted in Figure 1A. The general pattern was one of a rise in concentration from the predose trough to the postdose peak at each visit, with a drop in concentration between the peak at visit 1 and the trough at visit 2. As can be seen, there were four participants in whom tobramycin concentrations did not decrease as expected from the peak concentration at visit 1 to the trough concentration at visit 2.
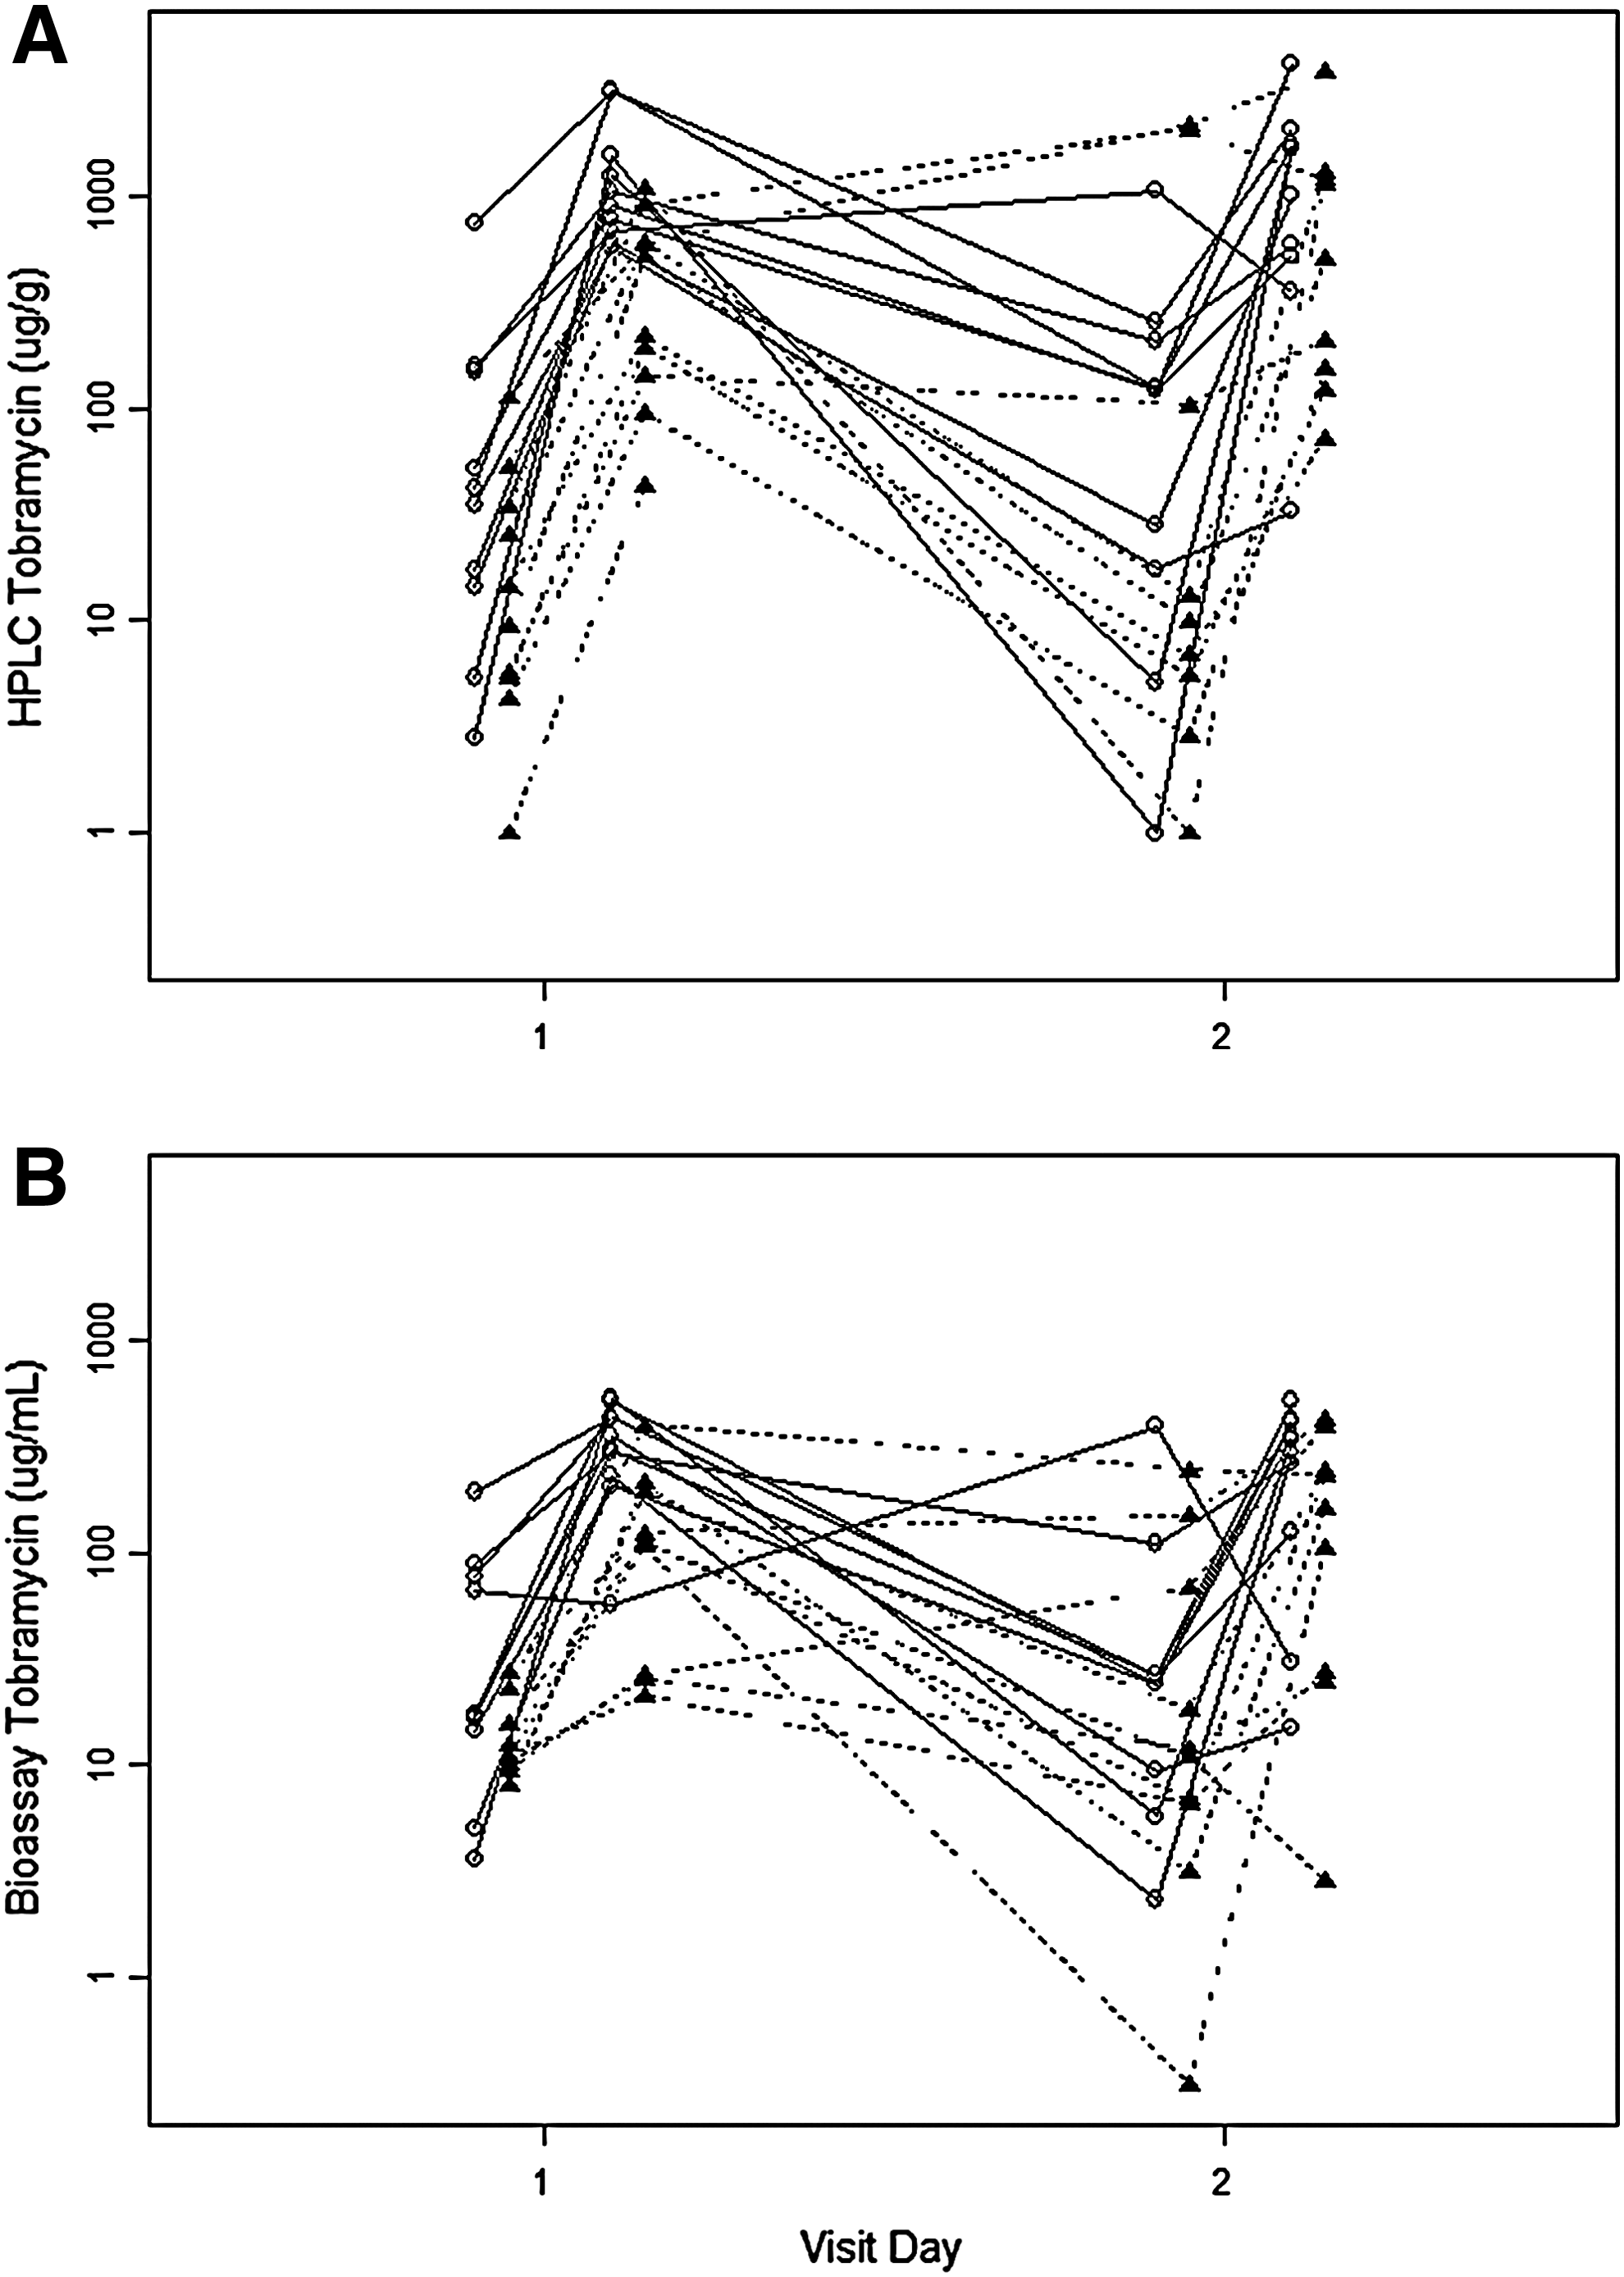
HPLC trough and peak tobramycin concentrations (μg/g)
Bioactive tobramycin concentrations are summarized in Table 3. Similar to findings by HPLC, both trough and peak concentrations were variable and there was no evidence of accumulation in the group as a whole (visit 2:visit 1 ratio not significantly different from unity). The change in bioactive tobramycin concentration for individual participants over the course of the study is depicted in Figure 1B. The pattern is very similar to that seen with total measurements in Figure 1A. Three participants had bioactive trough tobramycin concentrations at visit 2 higher than their peak concentrations at visit 1; two of these individuals showed this same pattern with total tobramycin concentrations.
Group 1, trough IS and peak ES.
Group 2, trough ES and peak IS.
p values reflect the Wilcoxon matched-pairs signed-rank test comparing concentrations between visits 1 and 2.
Total and bioactive tobramycin concentrations are compared in Figure 2. Trough tobramycin concentrations were generally similar; the mean ratio of trough bioactive to total concentrations was 1.21 (95% CI 0.56, 1.87; p=0.51 testing the null hypothesis that the mean ratio=1.0). However, bioactive peak concentrations were significantly lower than total peak concentrations; the mean ratio of peak bioactive to total concentrations was 0.33 (95% CI 0.23, 0.44; p<0.001).
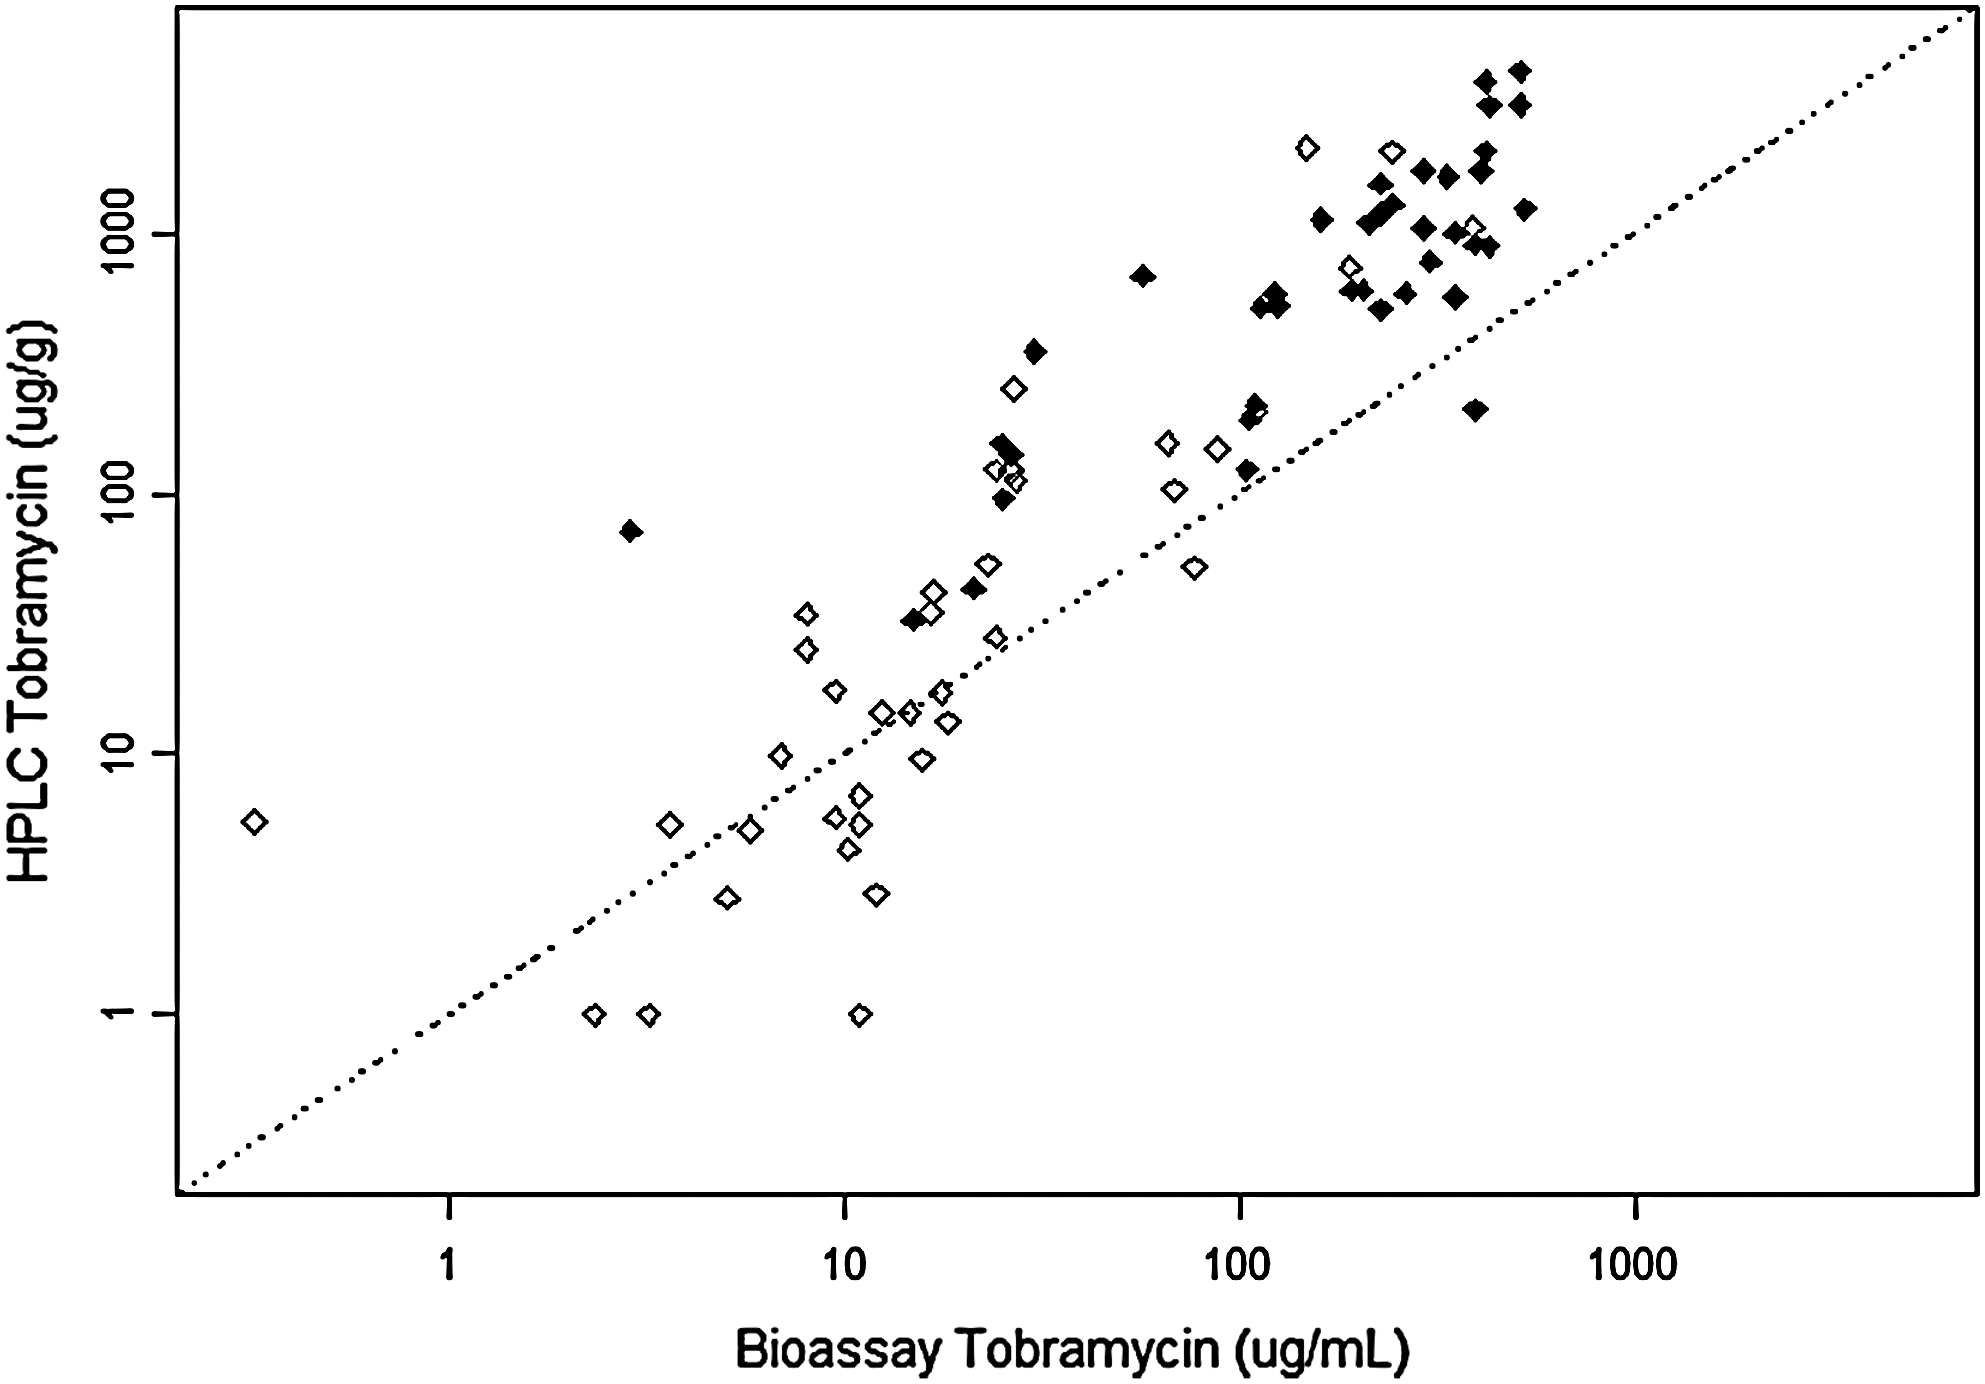
Comparison of bioassay tobramycin concentrations (μg/mL) on the x-axis and HPLC tobramycin concentrations (μg/g) on the y-axis is plotted on a log scale. Open diamonds denote trough values, and solid diamonds denote peak values. The dotted line represents the line of identity.
To address the finding of high initial trough concentrations in some participants despite the exclusion criterion of no treatment with TSI or other aminoglycosides in the 2 weeks preceding enrollment, a single random ES sample was obtained from five additional participants who had not recently taken TSI. Four participants were able to provide a sample. The last dose of TSI was 3–6 weeks prior to the study visit (three participants) or >12 weeks prior to the study visit (one participant). Tobramycin concentrations measured by HPLC were nondetectable (<LLQ) in all four samples.
Discussion
In this pilot study, we did not detect evidence of significant tobramycin accumulation in the respiratory secretions of CF patients during a 28-day course of TSI, as the ratios of both trough and peak concentrations at the end compared with the beginning of treatment were close to unity. Although our limited sample size precluded detecting modest accumulation, our results suggest that there is not a large degree of accumulation, and therefore do not support the investigation of alternate dosing regimens such as less frequent dosing or shorter duration of treatment.
To our knowledge, two prior studies have evaluated ES tobramycin concentrations in CF patients with repeated inhalation, with conflicting results.(12,23) Geller et al., in an analysis of data from the original Phase III trials of TSI,(2) found similar sputum tobramycin concentrations 10 min after the initial and final doses of TSI.(23) In a randomized crossover study of TSI for 15 days by LC Plus or eFlow nebulizer among 21 adults with CF, Hubert et al. did find evidence of accumulation; the accumulation ratio [the geometric mean ratio of the area under the curve from 0 to 8 hr (AUC0–8) at day 15 compared with AUC0–8 at day 1] was 2.1±3.1 with the LC Plus nebulizer.(12) However, the peak and trough concentrations were similar in both magnitude and variability to those in our study and that of Geller et al.(23) The reason for these discordant findings may be that Hubert et al.(12) evaluated the AUC0–8 using hourly sputum sampling, whereas we only evaluated trough and peak concentrations and Geller et al. (23) only evaluated peak concentrations.
We did not measure serum tobramycin concentrations, as the Phase III TSI trial(2) and the more recent pharmacokinetic study of Hubert et al.(12) had already demonstrated a lack of accumulation in serum. We focused on evaluating concentrations in respiratory secretions based on our unanticipated finding of potential accumulation as described above and the fact that concentrations in respiratory secretions with repeated dosing had been only minimally evaluated.
To our knowledge, ours is the first pharmacokinetic study to measure tobramycin concentrations in respiratory secretions by bioassay as well as chemical means. We were motivated by the fact that CF sputum is known to inactivate aminoglycosides through binding and antagonism by cations,(8,9) so that in vitro studies of dialysates of CF sputum showed bioactive drug concentrations to be 10–25-fold lower than total drug concentrations.(10,11) In our study, bioactive peak concentrations were on average 66% lower than total peak concentrations, corroborating the prior in vitro observations though with a smaller magnitude of sputum inactivation. Bioactive and total trough concentrations in respiratory secretions were similar, suggesting that sputum inactivation of aminoglycosides may be concentration-dependent, occurring to a greater extent at higher concentrations.
Importantly, bioactive peak concentrations were generally well within the target concentration recommended by previous studies. In the original studies of tobramycin pharmacokinetics,(3,4) the target sputum concentration was 128 μg/g, 10-fold above the minimal inhibitory concentration (MIC) of 90% of Pa isolates at our institutions to account for sputum aminoglycoside inactivation. In the current study, 12 of 20 participants had a bioactive peak tobramycin concentration >128 μg/g at both visits, with an additional four having a bioactive peak tobramycin concentration between 100 and 128 μg/g. Thus, the dose and device used generally achieved the target sputum tobramycin concentration. The clinical implications of achieving airway concentrations above the MIC, however, are less clear given the known poor correlation between in vitro susceptibility testing and clinical response to antibiotics in CF.(24)
The high degree of variability in peak and trough tobramycin concentrations in the current study is an expected finding that has been observed in all prior pharmacokinetic studies.(3–5,7,12,25) Importantly, despite the observed variability, peak concentrations were generally in the bactericidal range as described above. In the current study, several participants had higher trough than peak tobramycin concentrations. This observation may be due to regional variability in both drug deposition and respiratory secretion sampling. In addition, sputum samples collected at different time points may represent samples from different lung regions. Variability in inhaled drug deposition may be due to patient-related factors, including oral and airway anatomy, breathing pattern, degree of airway obstruction, mucus impaction, and nebulizer technique.(25)
The current study was motivated by our finding of potential accumulation of tobramycin in <6-year-old CF patients in a clinical trial of TSI twice daily for 28 days(6); these patients had measurable levels of tobramycin in ELF an average of 12 hr after the last dose of TSI. We chose to evaluate participants with mild to moderate obstructive lung disease based on the finding in that study of potential tobramycin accumulation in patients <6 years old with likely mild obstructive lung disease. In the only prior single-dose tobramycin pharmacokinetics study in which samples were obtained for more than 2 hr, concentrations were undetectable in most samples at 8 hr.(5) In the current study, we were therefore surprised to find measurable tobramycin concentrations, in some cases >100 μg/g, 12 hr after the first or second inhaled dose and again at the end of treatment. We therefore evaluated tobramycin concentrations in an additional four patients who had not received TSI for at least 12 weeks and found no measurable tobramycin. Interestingly, Hubert et al. found trough tobramycin concentrations very similar to ours (148±354 μg/g) on day 15.(12) Thus, it appears that the explanation for our motivating observation was that, in some patients, it may be cleared less rapidly from respiratory secretions than previously believed.
An additional aim of our study was to assess the safety and feasibility of sputum induction for measuring drug concentrations in respiratory secretions. To our knowledge, ours is the first study to utilize sputum induction for this indication. Sputum induction was well tolerated in all but one subject, who experienced a drop in lung function. Tobramycin concentrations in IS were in general similar to those in ES, with the exception of significantly higher peak tobramycin concentrations in expectorated than induced samples at visit 1. This may reflect greater oral contamination in expectorated samples, dilutional issues with induced samples, or the possibility that sputum induction more heavily samples distal airway secretions.(15) Sputum induction thus appears to be a viable method for assessment of drug concentrations, and may be of particular value in pre-expectorating young CF patients.
Limitations of our study include the relatively small sample size, lack of serum sampling, and the restrictions placed on study design due to the potential risks of repeated sputum induction at a single study visit. For example, we only obtained trough and peak samples rather than multiple samples over an extended period, precluding the ability to calculate an area under the curve.
In conclusion, this study does not provide evidence of significant drug accumulation in respiratory secretions with repeated dosing of TSI over a 28-day period. Importantly, peak bioactive tobramycin concentrations are lower than total concentrations, although not as low as anticipated based on prior in vitro studies and still generally well within the target range. High trough levels observed in some participants in this study and others(6,12) lead us to speculate that TSI may not have as rapid a clearance from respiratory secretions in all individuals as previously determined.(5) Sputum induction appears to be a safe and feasible method for obtaining sputum for measurement of drug concentrations, and may be particularly helpful in pre-expectorating CF patients.
Footnotes
Acknowledgments
The authors wish to thank Jessica Foster for performing bioassays; Eric Kantor for performing the HPLC assays; and Colleen Dunn, RRT, CCRC, and Zoe Davies, PNP, for their excellent research coordination of Stanford participants. The authors wish to acknowledge the following sources of support: NIH 5K23RR15529 (M.R.); Seattle Children's Hospital Research Endowment Award (M.R.); and NIH 1UL1 RR025744 (R.M.). Study sponsors had no role in the study design, in the collection, analysis, and interpretation of data, in the writing of the manuscript, or in the decision to submit the manuscript for publication. Portions of this article were presented as an oral presentation at the 2006 North American Cystic Fibrosis Conference.
Author Disclosure Statements
The authors have no conflicts of interest to disclose.