
Abstract
Abstract
Background:
Rats are frequently used to study the pharmacological and toxicological effects of inhaled aerosol particles. The deposition behavior of aerosol particles in airways is affected by their hygroscopic properties, which accordingly influence the results of such studies.
Method:
A recently published nonhygroscopic aerosol particle deposition model for rat airways was extended with equations for hygroscopic particle growth in humid air and with a model to mimic the temperature and relative humidity conditions in the rat airways transformed from the upper human airways. As there are no experimental data available for hygroscopic deposition in rat lungs, several model assumptions were made for the humidity distribution in the upper rat airways.
Results:
The total and regional deposition probability of salt particles in the diameter range 0.02 to 5 μm in rat lung was significantly changed by the hygroscopic properties. The maximum ratios of the total deposition of inhaled initially dry sodium chloride, cobalt chloride, and zinc sulfate particles compared with nonhygroscopic particles were 3.28, 2.44, and 2.13, respectively, and the minimum ratios 0.57, 0.63, and 0.70, respectively. The corresponding maximum (and minimum) ratios for the hygroscopic drugs histamine dihydrochloride, carbenicillin disodium, and atropine sulfate were 1.86 (0.65), 1.53 (0.70), and 1.35 (0.76), respectively. Total deposition was about 20% higher in human airways than in rat airways. The flow regime in the rat upper airways influenced total and regional deposition much less than it did in human airways.
Conclusion:
The hygroscopicity of salt and drug aerosol particles is an important factor in rat lung deposition.
Introduction
Respiration experiments in humans using sodium chloride aerosol particles have shown that the proportionate change in particle size increases with particle size. The diameter of dry sodium chloride particles has been reported to increase by a factor of 2 to 4 for particles of diameter 0.012 to 0.3 μm,(1,2) a factor of 3.5 to 4.5 for particles of diameter of 0.03 to 0.4 μm,(3) a factor of 4.3 to 5.5 for particles of diameter of 0.025 to 0.02 μm,(4,5) a factor of 6 for particles of dry diameter around 1 μm,(6) and a factor of 6 for particles of diameter 0.5 to 4 μm.(7)
The particle growth can be explained by assuming the aerosol particles to be in equilibrium with RH of 0.995 in the alveoli, which corresponds to the osmolality of 287 mosm kg−1(8) of human blood, which has been confirmed theoretically(9–11) and experimentally.(12–14)
The dynamics of change in particle size can be described theoretically in terms of the water vapor and heat transport to or from the surface of an aerosol particle.(10,15,16) This theory has been confirmed experimentally by Gebhart et al.,(7) who measured the size of inhaled and exhaled aerosol particles using an aerosol bolus technique.
A number of deposition models have been developed for the human respiratory tract(17–19) that consider the hygroscopic properties of the aerosol particles. They include profiles for air temperature and RH optimized by experimental data from the literature(20) and the growth of a single aerosol particle with changing RH. Several researchers have provided overviews of hygroscopic effects in human airways.(11,14,21–24)
Deposition models have been described in the literature for nonhygroscopic aerosol particles in rat airways.(25–27) A model has been published recently that was optimized using experimental deposition data.(28) However, there are no experimental data available on the growth and deposition of hygroscopic aerosol particles in rat airways, and it is only possible to make estimates of the effects. Such estimates can be considered to be reliable to some extent if the same physical principles are used as for human airways,(17,20) but adjusted to rat-specific lung structure and respiration conditions.
In the modified rat deposition model(28) presented here, these adjustments have been made. The effect of hygroscopicity on lung deposition is demonstrated for three inorganic salts and three drugs, representing large, medium, and small particle growth in humid air. In addition, the differences in airflow conditions between rat and human upper airways are discussed and the lung deposition data in rat and human airways are compared.
Materials and Methods
The model that provided the basis for the model described here was developed to represent the behavior of nonhygroscopic particles in human airways(29) and then extended to hygroscopic particles.(17,20,30) This human deposition model was adapted for use in simulations of rat airways and optimized using experimental data for nonhygroscopic particles.(28) Now, we describe the extension of the model to hygroscopic particles.
The model for nonhygroscopic particles was extended by adding two modules, one describing the temperature and RH of the air in the upper rat airways, and a second that calculates the growth or evaporation of a single salt or drug particle in humid air as a function of lung depth. By using these modules, the local diameter of a hygroscopic particle within the rat airways can be calculated and its deposition determined.
Rat airways
The model uses a lung structure for rat airways(31,32) consisting of a trachea, bronchi, and alveolar ducts in 24 lung generations, extended with a nose and pharynx.(28) Table 1 shows the values for the model at full lung inflation, i.e., total lung capacity (TLC) or a defined lung volume LV. For the rat lung, LV is taken to be equal to TLC. The length and diameter of the different lung generations were corrected for the actual respiration conditions using the correction factor fcor
Data are given for total lung capacity (TLC). Ni, Li, and Di are the number, length, and diameter of the tubes in lung generation i, respectively; Ci is the correction factor for a noncircular airway cross section; Li/Qi is the parameter for heat and water vapor transport; and Rei is the Reynolds number for tube i assuming a total airflow Q of 7.14 cm3 sec−1. The nose is approximated by a box with a length, width, and height, as shown in brackets. Data are calculated for quiet respiration with a tidal volume of 2.1 cm3, a respiration frequency of 102 min−1, and constant inhalation and exhalation airflows of 7.14 cm3 sec−1. The size of the airways was corrected using Equation 1 and values of 5.942 cm3 for FRC and 13.73 cm3 for TLC.(33,34)
where FRC is the functional residual capacity and VT is the tidal volume.
A value of 13.73 cm3 was used for TLC(31); FRC was taken to be 0.4*TLC.(26,33) In addition, we assumed quiet respiration conditions with a tidal volume of 2.1 cm3, a respiration frequency of 102 min−1, and a constant airflow rate of 7.14 cm3 sec−1 during inhalation and exhalation.(33,34) The inhalation and exhalation time is 30/102=0.2941 sec.
Human airways
As in previous studies of deposition in human lungs,(17,20) we used the human lung structure of Weibel's model “A” with a regular dichotomy,(35) which consists of a trachea, bronchi, and alveolar ducts in 24 lung generations, extended with a nose or mouth and pharynx. Table 2 shows the values for the model using a lung volume LV of 4,800 cm3, which is 0.75*TLC.(35) The length and diameter of the lung generations were corrected using Equation 1 for the actual respiration conditions, with a value FRC of 3,000 cm3.(20,23,36)
Data are for a lung volume LV of 4,800 cm3, which is 4/3 of TLC.(35) The size of the airways was corrected using Equation 1 and values of 3,000 cm3 for FRC and 4,800 cm3 for TLC.
The original studies by Ferron et al.(17,20) used an airflow of 250 cm3 sec−1. In the present study, we used an airflow of 300 cm3 sec−1 for quiet inhalation and exhalation as suggested by the International Commission on Radiological Protection (ICRP) report.(23) Nasal deposition for micrometer-sized and nano-sized particles was calculated using the equations proposed by Cheng(37) (Appendix 1), which are derived from experimental studies.
Deposition model for nonhygroscopic aerosol particles
Deposition probability was calculated for each lung generation using the equations for sedimentation, diffusion, and impaction.(17,28,29) For the rat airways, corrections were introduced for impaction and diffusion in the nose and alveolar region.(28)
Human nasal deposition was calculated using empirical equations (Appendix 1).(37) First, the probabilities for deposition of a particle by sedimentation, diffusion, and impaction were calculated for each lung generation i. These values were used to calculate the total deposition in lung generation i, taking into account the part of the tidal volume that enters this lung generation and the losses in the preceding lung generations. Similar calculations were made for exhalation, taking the history of the different aerosol volumes into account. Total lung deposition was determined using an algorithm.(17,29)
Temperature and humidity in the human airways
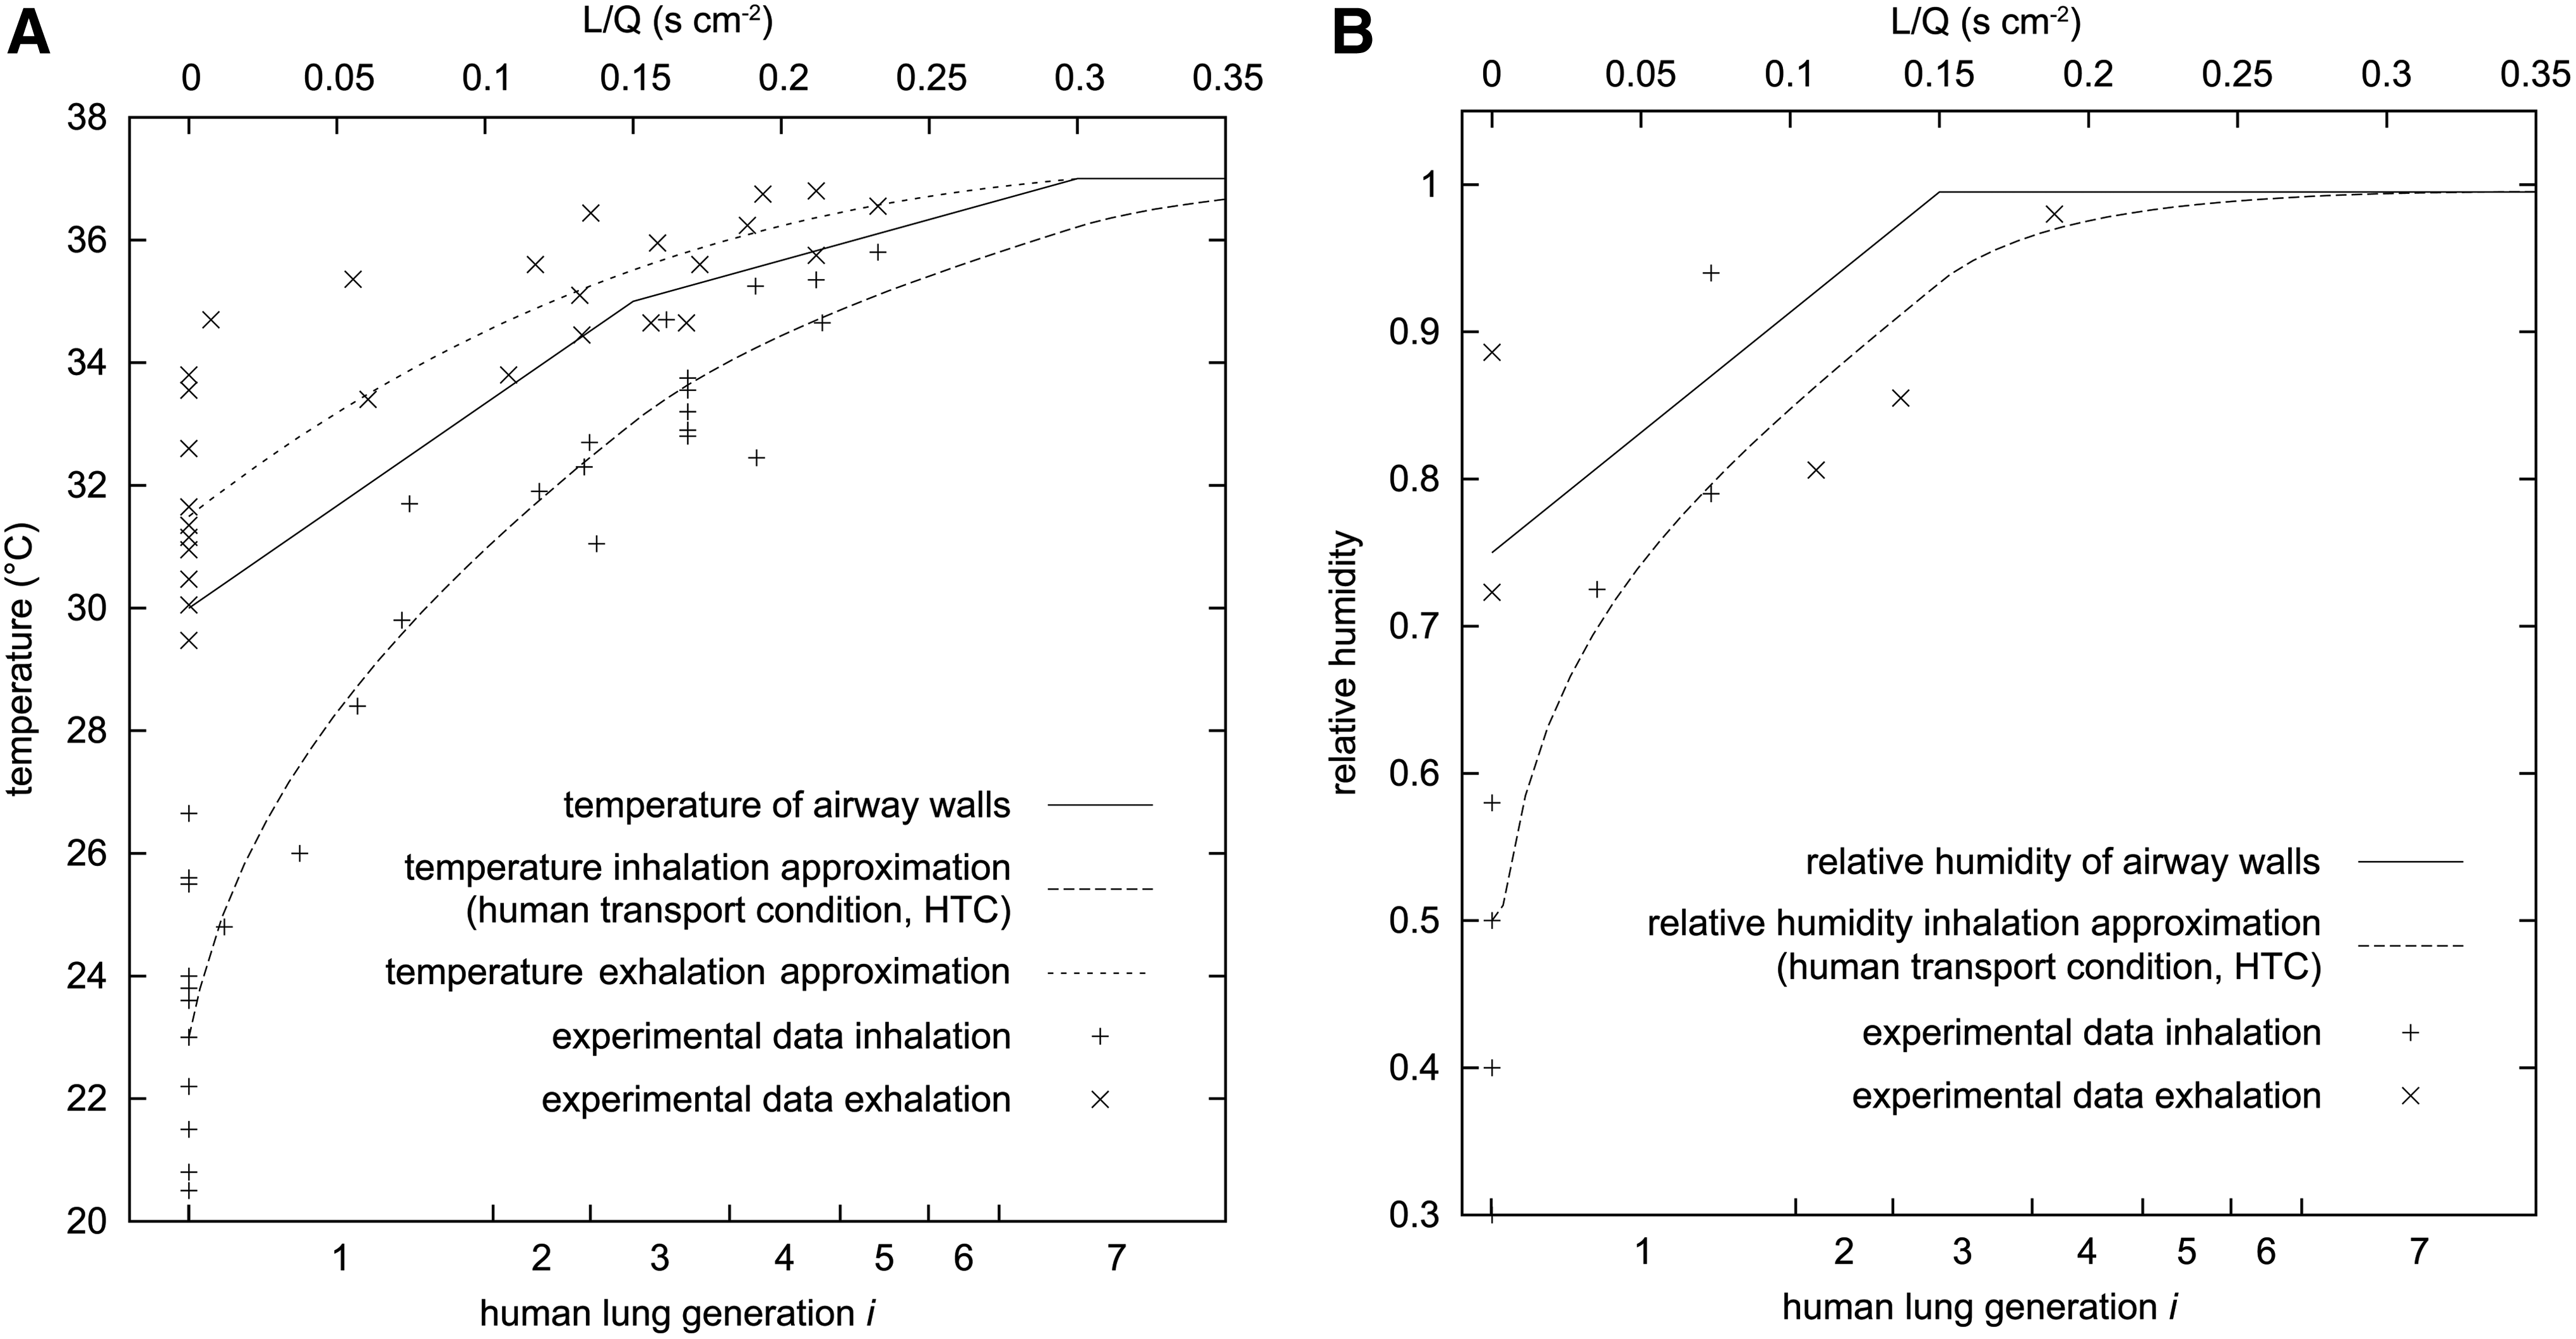
Figure 1 shows the values of temperature and RH in the upper human airways based on experimental data from the literature.(20) The data were approximated by equations for the transport of heat and water vapor concentration in a laminar airflow through a straight tube (Appendix 2). The solutions are a function of the parameter L/Q, where L is the length from the tube entrance and Q is the volume flow rate. The solution for a straight tube is transformed to human airways using
where i denotes the lung generation, Li the length and Qi the airflow through lung generation i, and Ci a correction factor for transport in tubes of noncircular cross section.(20,30) Ci is 1.0 for a circular cross section.
Temperature and RH increase slowly from ambient to lung conditions, with an equilibrium temperature of 37°C and RH of 0.995(9,10) in the alveolar region. It is assumed that the RH of the air in the alveolar sacs is in equilibrium with the vapor pressure of human blood with an osmolality of 287±4 mosm kg−1.(8) Osmolality is defined as the number of osmoles per kilogram of solvent.(8,38) The calculated value for RH of 0.9950 differed by 0.0002 from the experimental value of 0.9948.(13,14,39)
For laminar airflow, the calculated data for temperature and RH as a function of lung depth were much lower than the experimental data.(20,30) A satisfactory approximation of the experimental data(20,30) was obtained for an inhalation airflow of 250 cm3 sec−1 using (1) wall profiles for temperature and RH constant in time during inhalation and exhalation, (2) a laminar boundary layer at the walls, and (3) a nonlaminar core flow using an additional diffusion constant Da of 1.0 cm2 sec−1, which accounts for the instabilities in the airways caused by bends, changes in cross section, and bifurcations.
This solution is called the human transport condition (HTC). It describes the mean air temperature and RH over an airway cross section as a function of L/Q (Fig. 1).
Temperature and RH in the rat airways
Textbooks on veterinary physiology describe different body temperatures for vertebrate animals in the range of 37.5°C to 40.5°C.(40) Values cited for rat body temperature range from 36.7°C to 38.0°C.(41–43)
The RH in the lower rat airways is determined by the blood osmolality. However, the textbooks only cite a general range of 271 to 292 mosm kg−1(44) and do not specify the osmolality for different species. Rat blood osmolality was reported to be more than 300 mosm kg−1, with most values lower than 315 mosm kg−1.(45) In order to check the values given in the literature, blood osmolality was measured directly in 14 adult male WKY rats. Blood was collected from the abdominal aorta under deep anesthesia and centrifuged at g=450 for 10 min to obtain serum. Serum osmolality was measured with an osmometer (OM801, Vogel, Gießen, Germany) calibrated with a sodium chloride solution of 300±1 mosm kg−1.
As the body temperature and blood osmolality of rats and humans are very similar, the values for human airways were used in the model for rat airways, i.e., a temperature of 37°C and RH of 0.995. This also increases the comparability.
As there are no experimental data available for the temperature and humidity profile in the rat upper airways, three scenarios are proposed:
1. In the first scenario denoted here as the HTC, the mean air temperature and RH in an airways cross section in the rat upper airways are obtained from the human upper airways (Fig. 1). It assumes that similar flow conditions are present in human and rat airways. Thereby, L/Q is used as the transformation parameter, and Equation 2 is subsequently used to adjust the temperature and RH profiles to the rat lung generations (Fig. 2). 2. The second scenario is based on a consideration of the Reynolds number. In fluid dynamics, the Reynolds number Re is used to characterize the condition of the flow. Re represents the ratio of dynamic forces and viscous forces in the fluid (Appendix 3, Equation A3.1). As can be seen from Tables 1 and 2, the Reynolds number in rat and human airways differs by a factor of about 9 for the lung generations 2 to 9. The flow through the rat airways is less disturbed and lies in between the flow through human airways and a purely laminar airflow (Re<100). Thus, the second scenario assumes a laminar solution for the heat and water vapor transport (Appendix 2, Equation A2.2) and is called the laminar transport condition (LTC). It assumes a temperature and RH profile set by a constant wall temperature of 37.0°C and RH of 0.995. A particle starts growing after the RH of the air is larger than the deliquescence of the salt or drug in the particle. 3. In the third scenario, it is assumed that the air has a constant temperature of 37°C and a constant RH of 0.995 throughout the whole of the rat airways. This is called the alveolar transport condition (ATC). A particle starts growing immediately after entering the nose.
Each of these three scenarios describes the temperature and RH of the air as a function of the parameter L/Q, which can be converted into lung depth or residence time of a particle in the lungs.
Equilibrium and growth or evaporation of a hygroscopic particle in humid air
The water vapor concentration at the surface of an aerosol droplet differs from the value for pure water. It is reduced by dissolved solutes (Law of Raoult) and increased by the curvature of the droplet surface (Kelvin correction). The equilibrium size of a droplet can be calculated using these corrections (Appendix 4). The corresponding size alteration with respect to the dry particle size is characterized by the particle growth factor, gRH, defined as the ratio of the particle diameter in equilibrium at a specified RH to the dry particle diameter. By convention, the growth factor is calculated neglecting the Kelvin correction unless other stated. Table 3 shows the parameters and growth factors for particle diameter and aerodynamic diameter for three salts and three drugs.
Solubility is in grams of solute per gram of water. The isosmotic concentration is in weight of salt or drug per volume solution in %, e.g., 0.9 g of NaCl in 100 cm3 of solution.(50) Growth factors for the particle diameter gd and the aerodynamic diameter gae were calculated using Equations A4.4 and A4.8, values of 1.0 for the Kelvin correction, and the Cunningham correction C(d). Values in parentheses are estimated, uncertain, or unknown.
An aerosol particle or droplet will grow (by addition of water) or shrink (by evaporation) if the RH at the droplet surface differs from the RH of the air. The size alteration of a particle is calculated using transport equations for both water vapor and heat, because the heat of condensation cannot be neglected (Appendix 5).(10,15,17,46) The transport is calculated numerically using an iterative procedure to take into account the changing particle parameters and particle environment, e.g., during inhalation. Temperature and RH of the air are obtained from one of the transport conditions (HTC, LTC, ATC) as a function of the parameter L/Q.
Calculations
Deposition was calculated using the recently published deposition model for nonhygroscopic aerosol particles in rat airways.(28) This model was extended with a module that defines the temperature and RH in the upper human airways (according to the HTC, LTC, or ATC scenarios) as a function of the parameter L/Q. This module transforms these values to residence time and lung depth for a defined lung structure and inhalation airflow. A second module determines the growth or evaporation of a hygroscopic particle for the chosen transport condition. The mean particle parameters in a lung generation i were used to calculate the local, regional, and total deposition as described previously.
The results are presented as a function of the particle diameter dp or the aerodynamic diameter dae. The aerodynamic diameter dae is defined as the diameter of a sphere with a density of 1 g cm−3 with the same settling velocity as the particle (Equation A4.6). For spherical particles with a density of 1 g cm−3, dp and dae have the same value. The particle diameter dp is the descriptive parameter for diffusion (dp<1.0 μm) and the aerodynamic diameter dae is the descriptive parameter for sedimentation and impaction (dae>0.2 μm).
The growth of a particle was calculated for the three scenarios (HTC, LTC, and ATC) of temperature and RH. Dry sodium chloride particles of size 0.05, 0.5, and 2 μm were used to represent particles deposited by diffusion, by diffusion and sedimentation, and by sedimentation and impaction, respectively. Growth calculations were also performed for dry particles of cobalt chloride and zinc sulfate of the same size. The three salts represented large, medium, and small growth factors in humid air, respectively (Table 3).
Lung deposition was calculated for the three scenarios (HTC, LTC, and ATC) of temperature and RH for the three salts. The size range for deposition modeling was 0.001 to 10 μm.
One of the main applications of the model is to study the effect of the hygroscopicity of drugs. Thus, the hygroscopic deposition model was applied to three drugs: histamine dihydrochloride (a bronchoconstrictor), carbenicillin disodium (an antibiotic), and atropine sulfate (a bronchodilator), representing large, medium, and small growth factors in humid air, respectively.(47)
For comparison, deposition was also calculated for two nonhygroscopic materials of density 1 and 2 g cm−3. The nonhygroscopic material of 1 g cm−3 had the same density as water, and approximately the same as the three drugs; the material of 2 g cm−3 had a similar mean density to the dry salts.
Both rat and human particle deposition were calculated for quiet respiration conditions with inhalation and exhalation airflow rates of 7.14 and 300 cm3 sec−1, times of 0.2941 and 2.5 sec, and tidal volumes of 2.1 and 750 cm3, respectively.
Results
Osmolality of rat blood
The mean osmolality measured for the blood of the 14 WKY rats was 302±4 mosm kg−1. This differs by less than 5% from the value of 287±4 mosm kg−1 for human subjects.(8)
Temperature and RH in the upper rat airways during inhalation
Figure 2 shows the graphs for mean temperature (T) and RH rat airways, transformed for the HTC scenario. Both temperature and RH reach equilibrium faster in rat airways than in human airways as a result of the larger values of L/Q in rat airways (Fig. 1, Tables 1 and 2). The solution for the LTC scenario is shown for comparison (Appendix 2, Equation A2.2). The RH maximum of 0.997 is higher than for the HTC scenario (Fig. 2B) because of the dependency of the water saturation on temperature. This was also observed in an earlier study.(30)

Particle growth
Figure 3 shows the growth of initially dry sodium chloride particles with diameters of 0.05, 0.5, and 2 μm under the HTC, LTC, and ATC scenarios. Particle growth starts immediately under ATC, but there is a delay time of 0.003 sec for HTC and LTC. The graphs for HTC and LTC are nearly identical and separated from that for ATC for all three particle diameters.
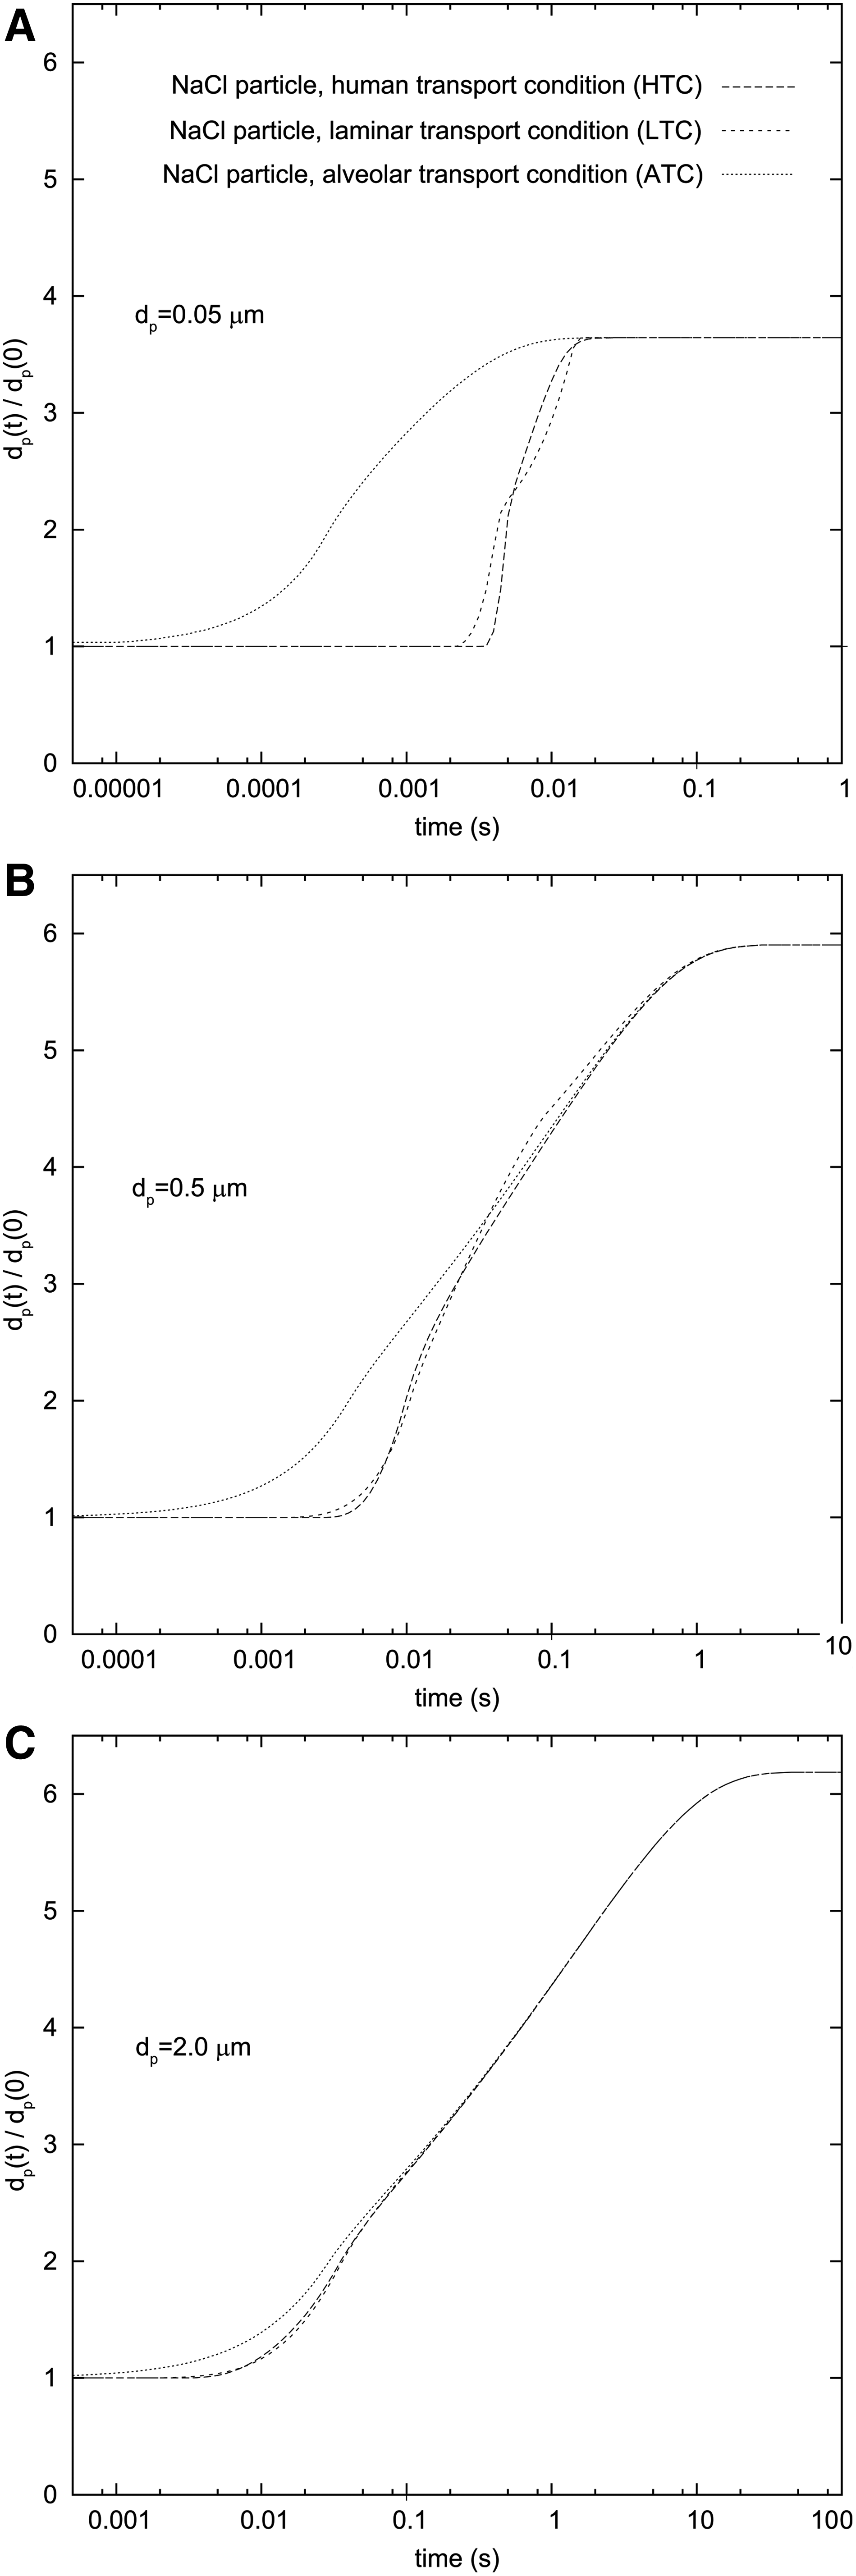
Comparison of the growth over time of initially dry sodium chloride particles of
Figure 4 shows the growth of initially dry particles of the three salts (NaCl, CoCl2·6H2O, and ZnSO4·7H2O) with diameters 0.05, 0.5, and 2 μm under the HTC scenario. Equilibrium particle size was reached within 0.02, 2, and <10 sec, respectively. The growth factor decreased with decreasing dry particle size. This is caused by the surface tension effect, which increases the RH at the particle surface (Kelvin correction, Equation A4.3). Particles with an initial size of more than 1 μm do not reach equilibrium during a single respiratory cycle.
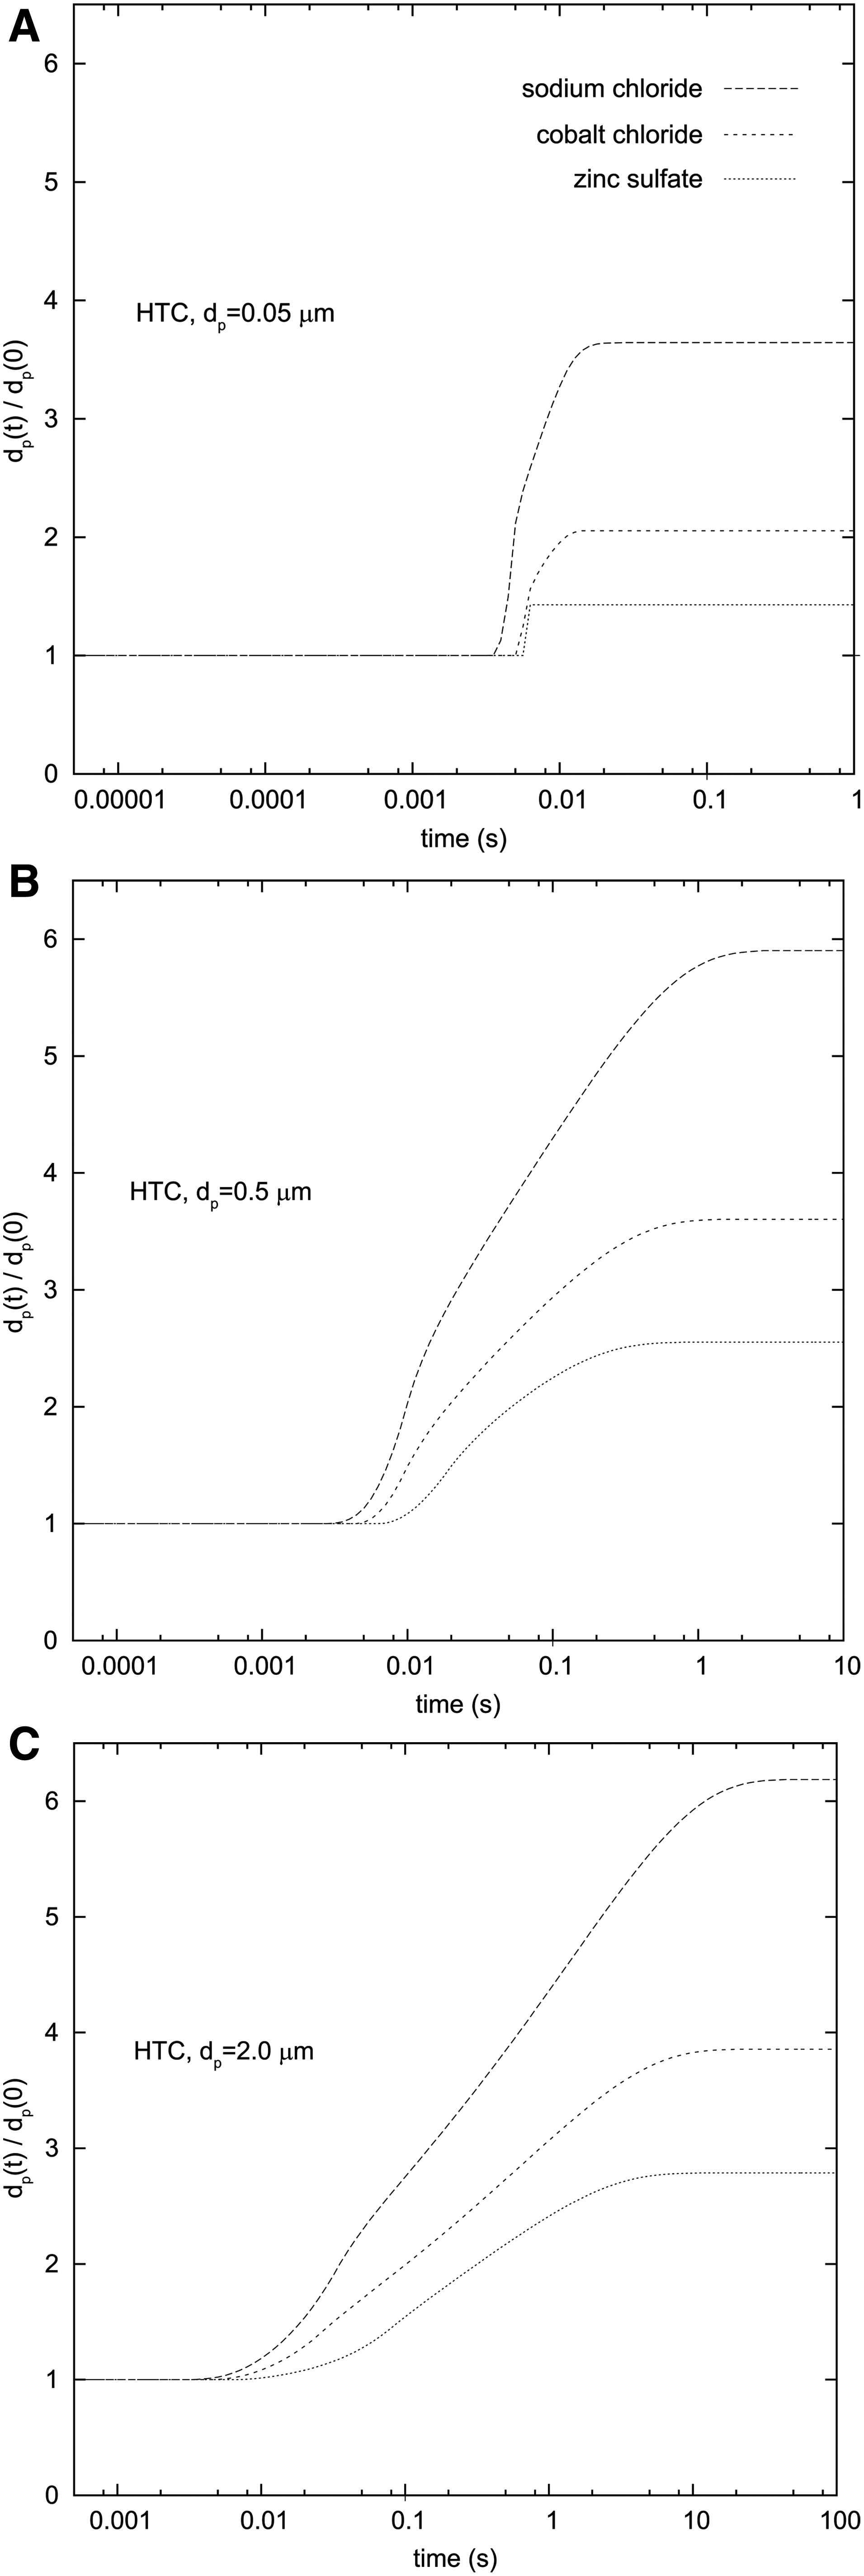
Growth over time of initially dry particles of diameter
Particle deposition
Figure 5 shows the total deposition of initially dry sodium chloride particles as a function of particle diameter under the HTC, LTC, and ATC scenarios. The lung deposition of a nonhygroscopic particle with a density of 1 g cm−3 is shown for comparison. Calculations were performed for quiet respiration with a tidal volume of 2.1 cm3, a respiration frequency of 102 min−1, and constant inhalation and exhalation flow rates of 7.14 cm3 sec−1. The deposition curves for HTC and LTC differ by less than 10% with a maximum at a particle diameter of about 0.1 μm. The deposition curves for HTC and ATC differ by up to 35%, also with a maximum at a particle diameter of 0.1 μm.
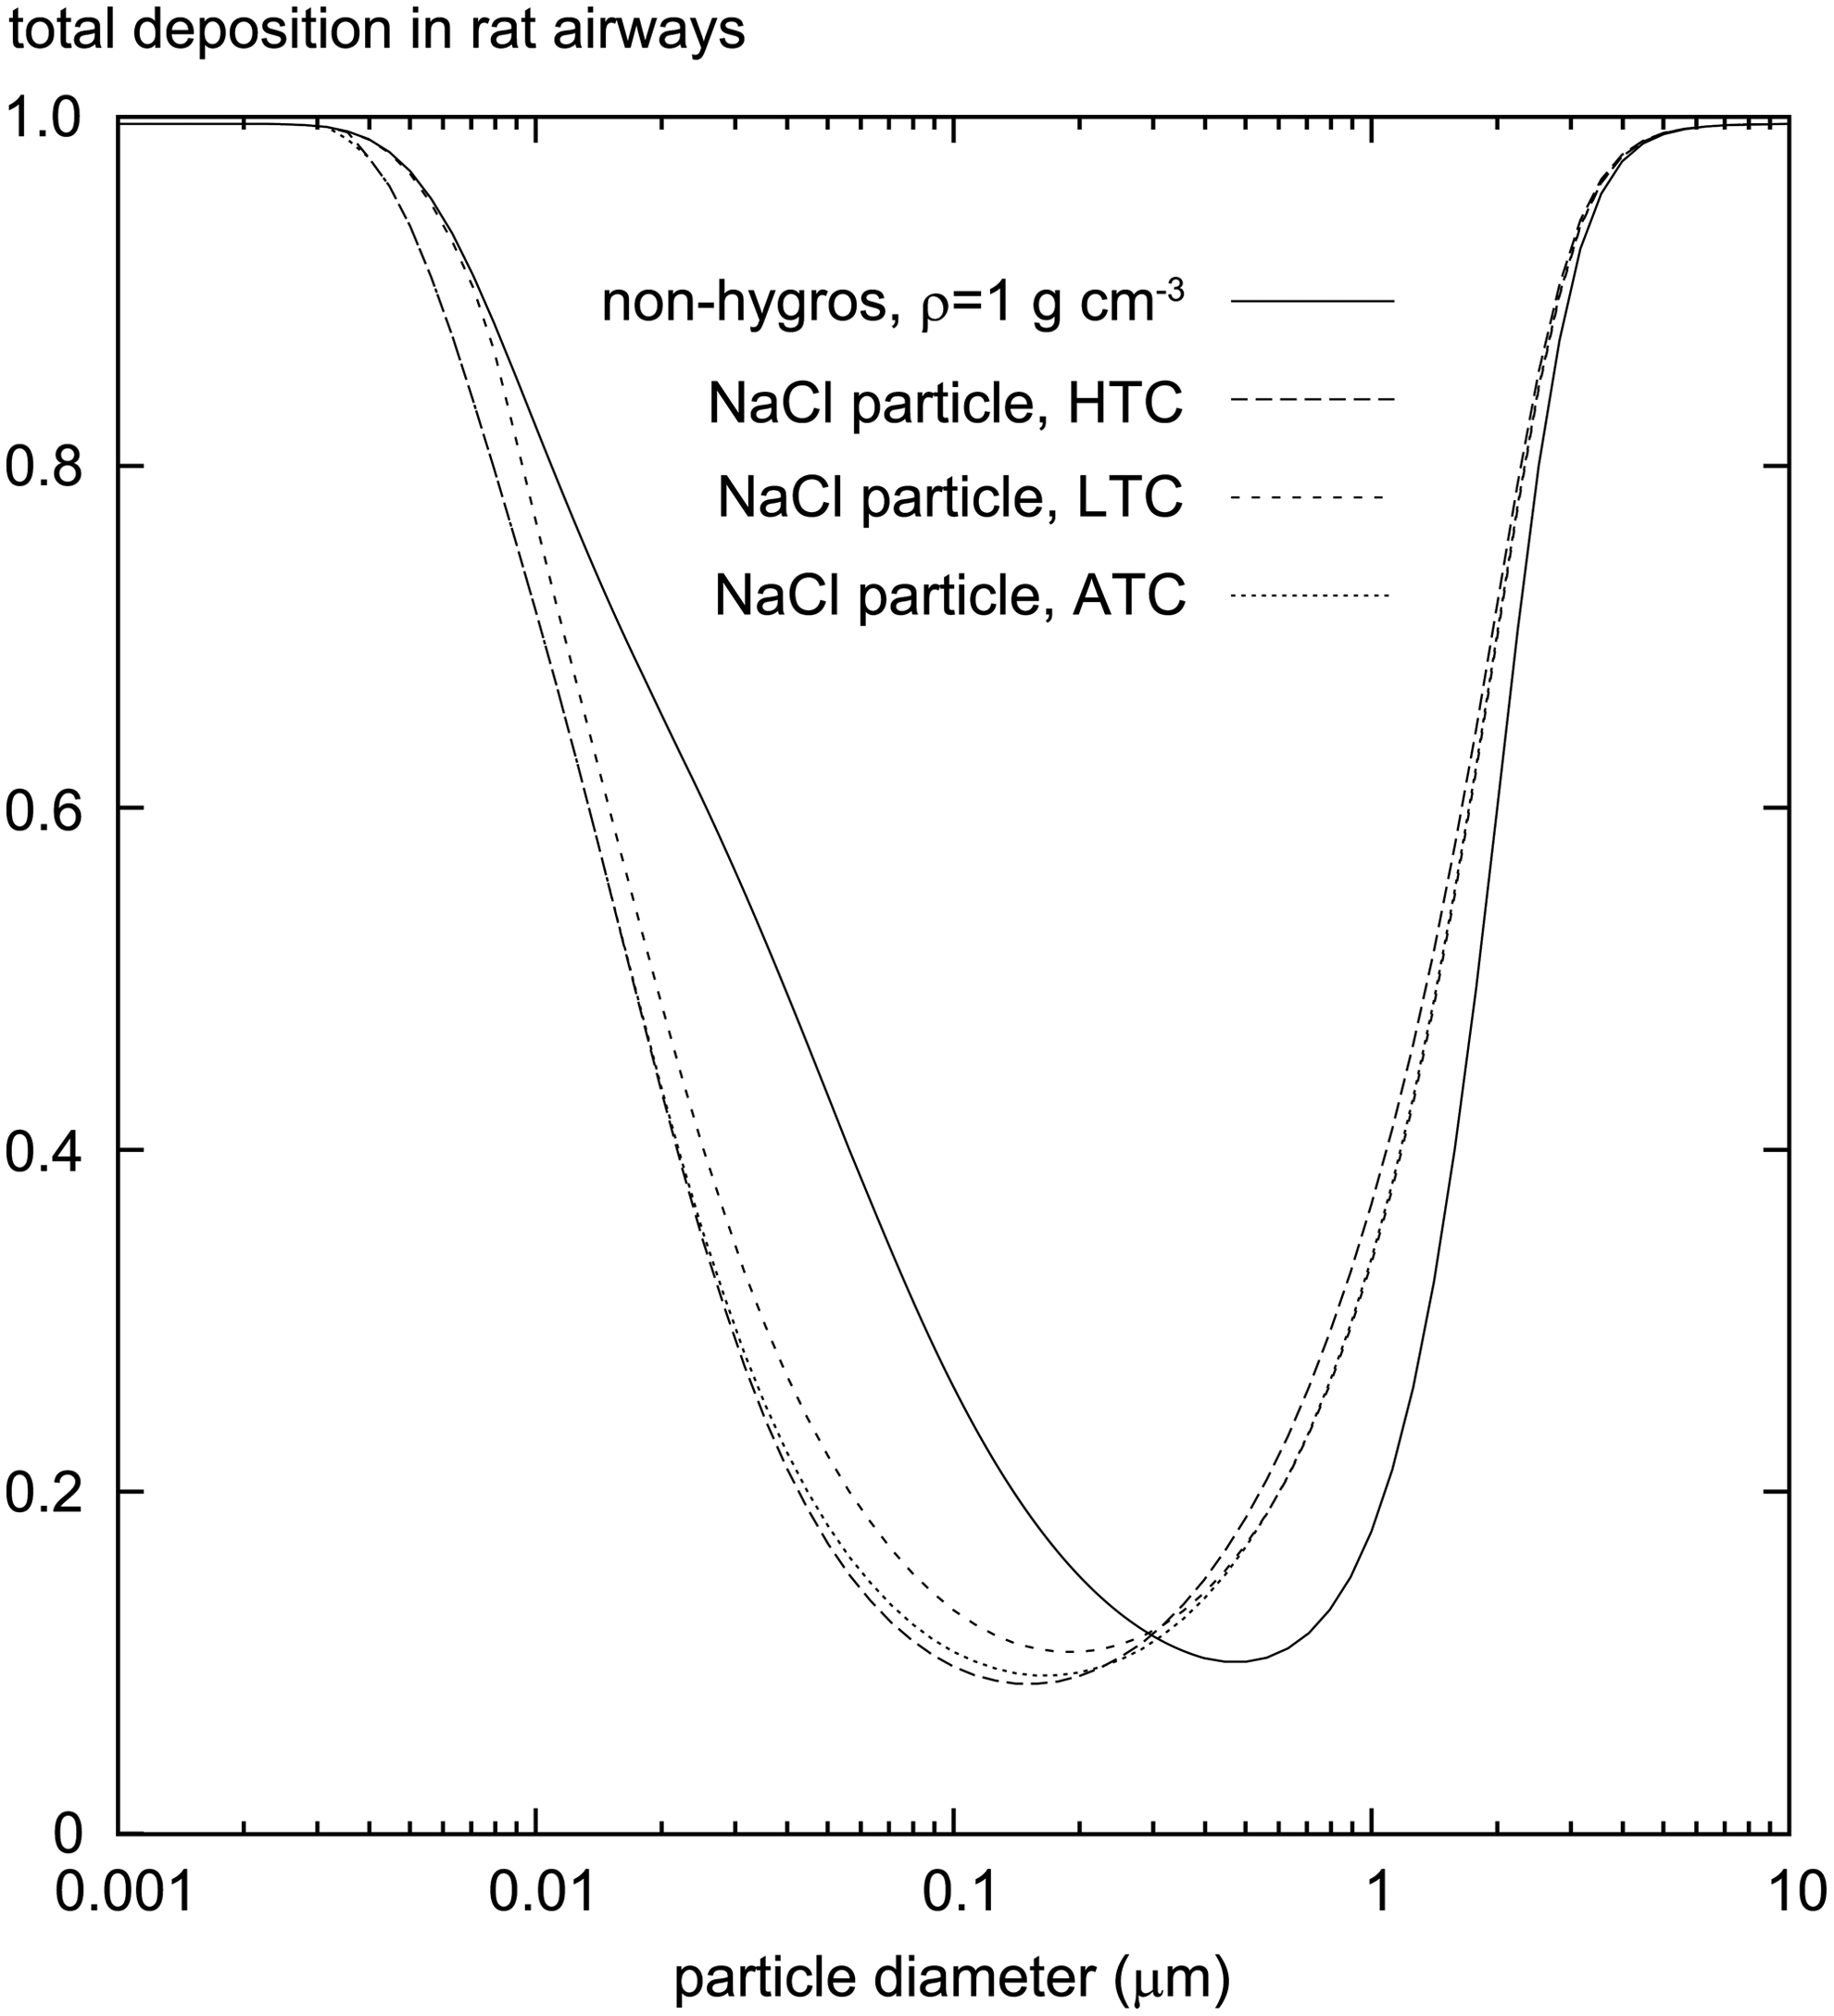
Total lung deposition in the rat airways of initially dry sodium chloride particles and a nonhygroscopic particle with a density of 1 g cm−3 as a function of the dry particle diameter under the three scenarios (HTC, LTC, and ATC) for quiet respiration.
Figure 6 shows the total and regional deposition of the three salts (NaCl, CoCl2·6H2O, and ZnSO4·7H2O) and two nonhygroscopic materials (with densities of 1 and 2 g cm−3) as a function of particle diameter under the HTC scenario for quiet respiration. A particle with a density of 1 g cm−3 shows the same values for particle and aerodynamic diameter. The mean density of the dry salts is about 2 g cm−3 (Table 3). Significant differences are seen in total deposition across the size range 0.02 to 5 μm: salt particles with a diameter between 0.02 and 0.3 μm show a lower total deposition than nonhygroscopic particles, whereas particles with a diameter between 0.4 and 5 μm show a higher deposition. This shift mainly corresponds to the salt growth factor (Table 3) except in the intermediate range between 0.2 and 0.7 μm. Extrathoracic deposition is nearly independent of hygroscopicity (Fig. 6B). Bronchial and alveolar depositions (Fig. 6C and D) are elevated for particles between 0.5 and 2.5 μm diameter with greater elevation for higher hygroscopicity, and represent the main contribution to particle growth in the lungs. Deposition of sodium chloride was about twice the deposition of nonhygroscopic particles. These graphs also show abrupt changes in the curves for regional deposition of the three salts relative to the deposition curve for nonhygroscopic particles at 5, 8, and 20 nm, which result from the Kelvin correction where it increases the vapor pressure at the particle surface to more than 0.995 (Equation A4.3). No growth occurs below this activation diameter, because the RH at the particle surface (increase of RH by the Kelvin correction and reduction of RH by dissolved salts) is larger than the RH in the lungs (0.995) (see Equation A4.1).
Lung deposition in the rat airways as a function of the dry particle diameter for three salts (sodium chloride, cobalt chloride, and zinc sulfate) and two nonhygroscopic materials with densities of 1 and 2 g cm−3 under the HTC scenario:
Figure 7 shows the total deposition as a function of the aerodynamic diameter for the same materials as shown in Figure 6. Deposition of all hygroscopic particles with aerodynamic diameters above 0.4 μm is greater than that of all nonhygroscopic particles with a density of 1 g cm−3. The aerodynamic diameter describes the deposition by sedimentation and impaction and is important for particle sizes larger than 0.1 μm. For particles smaller than 0.1 μm, deposition by sedimentation and impaction are negligible compared with deposition by diffusion, and thus the aerodynamic diameter has no practical application.
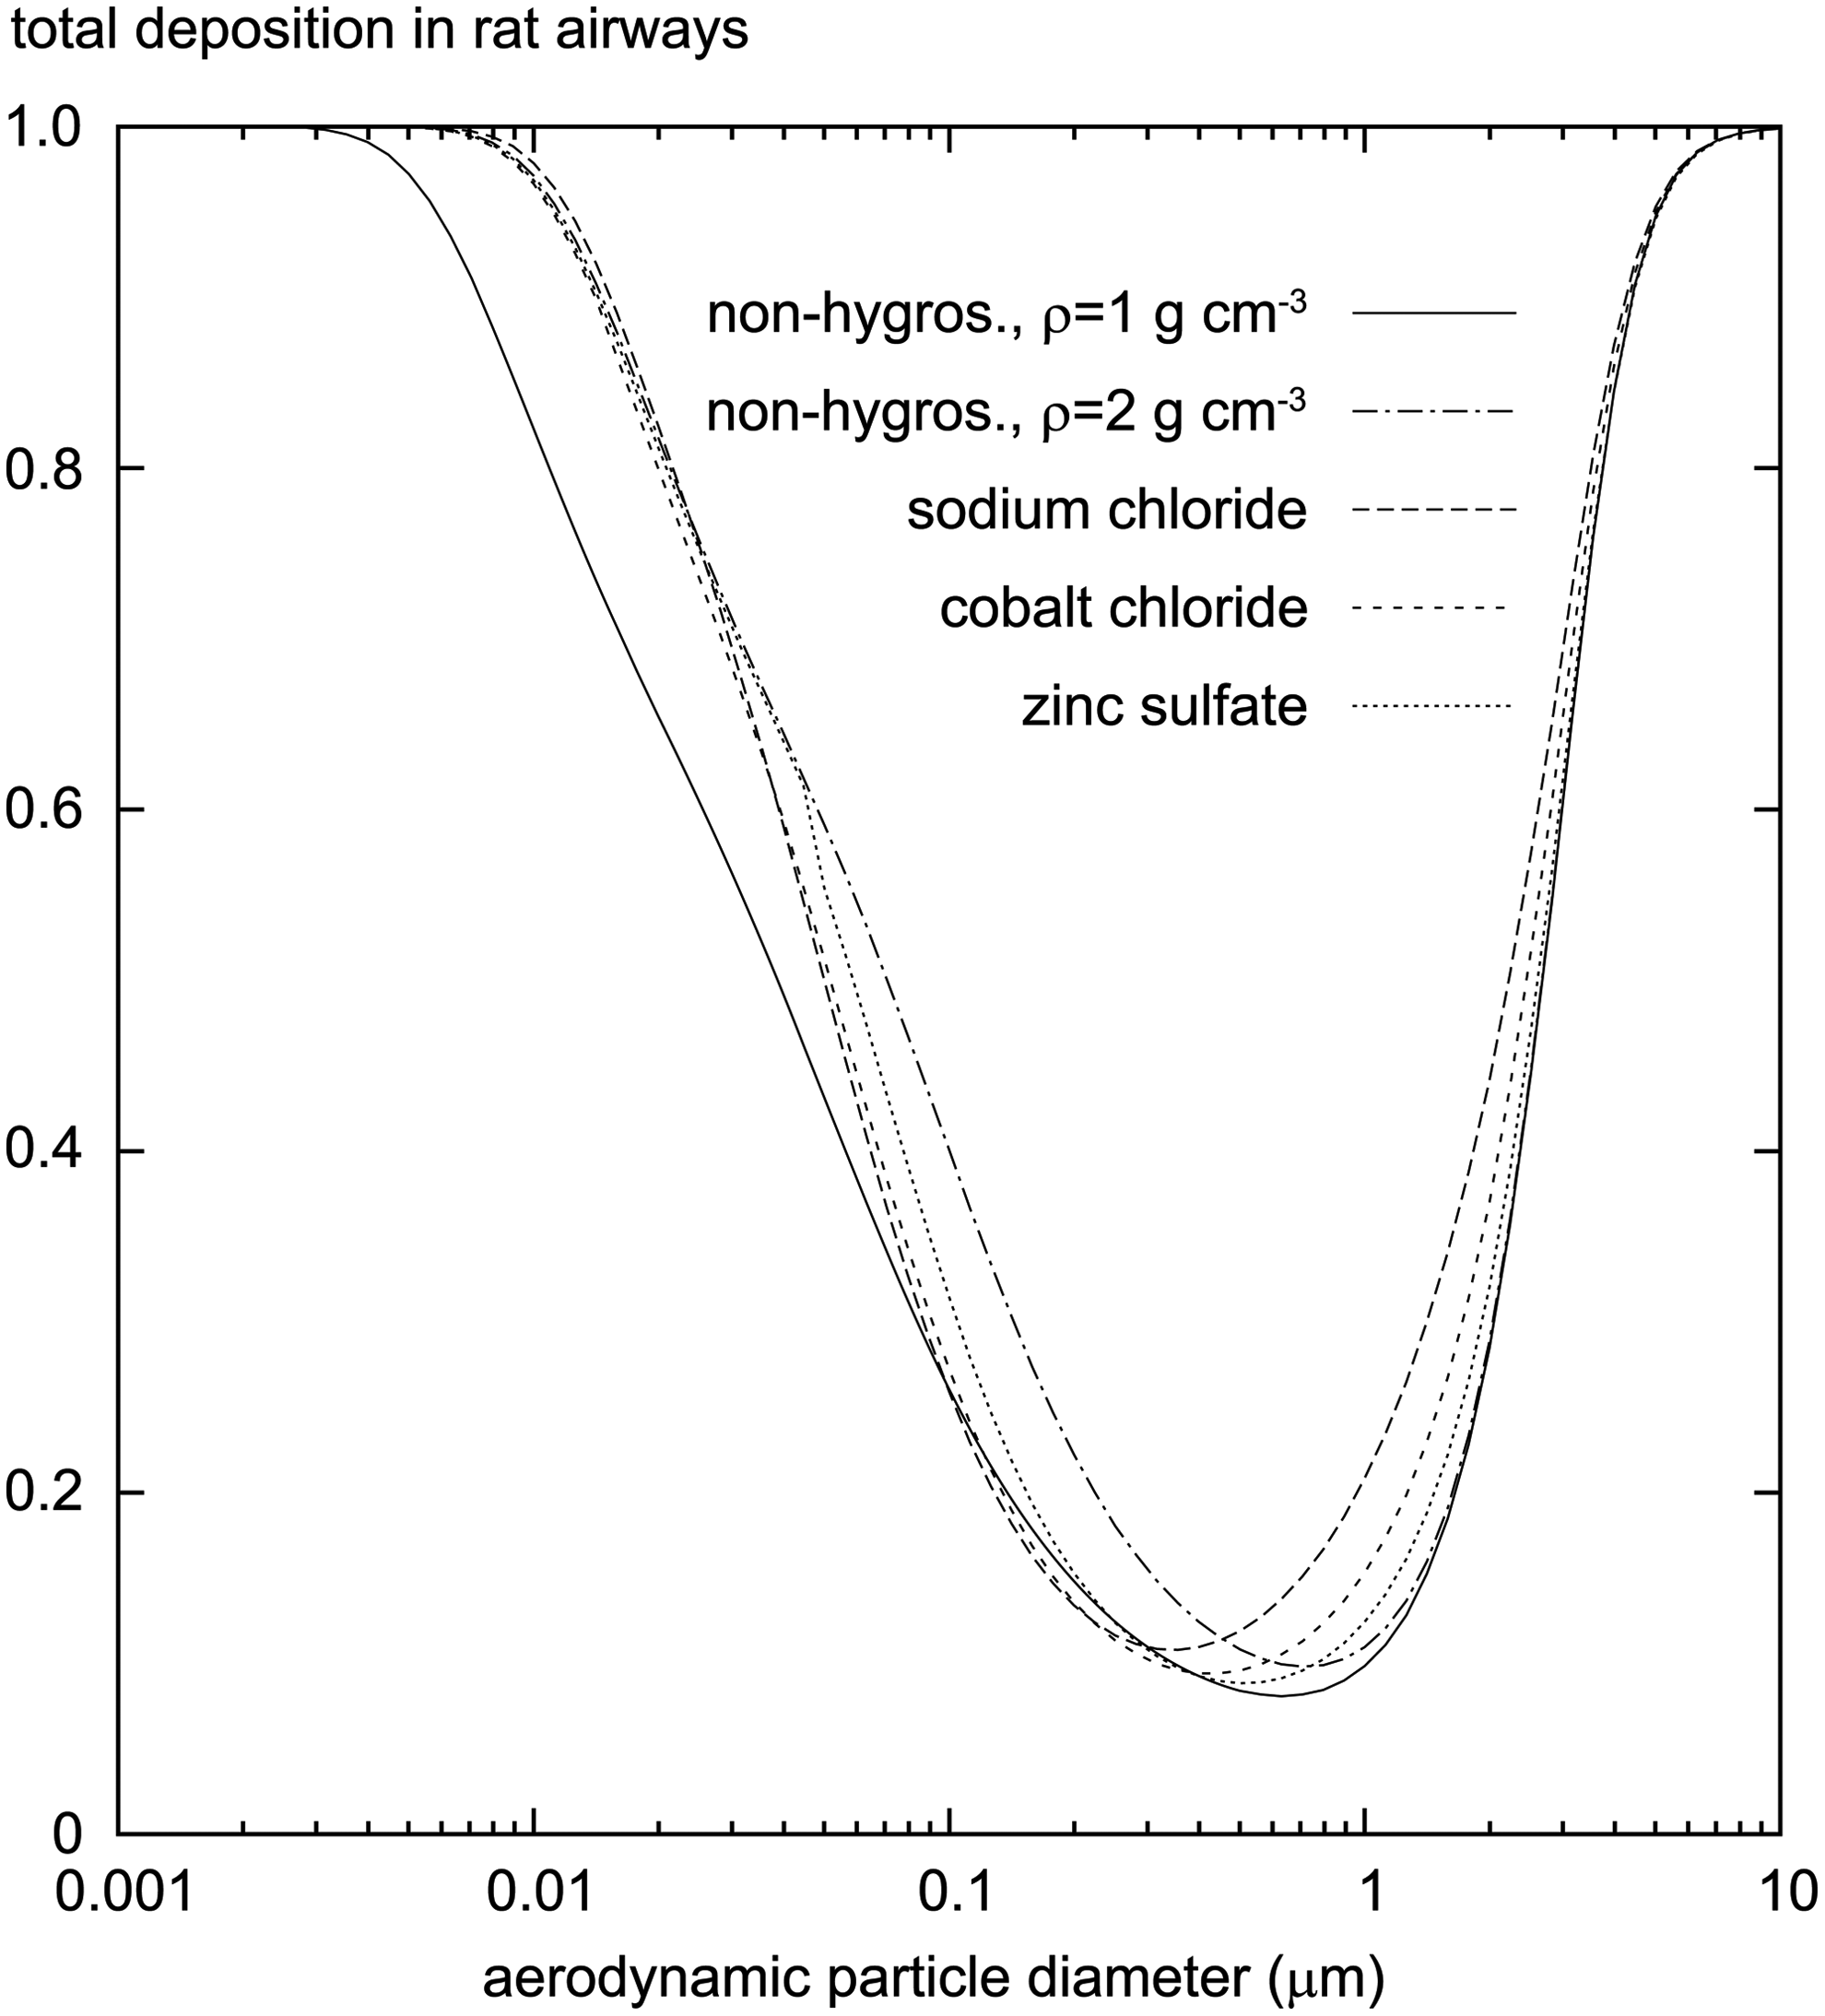
As in Figure 6, but for the aerodynamic diameter.
The differences in total deposition of hygroscopic and nonhygroscopic particles are shown in Table 4. The maximum difference was found at particle diameters of about 1 μm (Fig. 6A); total deposition of hygroscopic particles was greater by factors of 3.3, 2.4, and 2.1 for the three salts. The minimum difference was found at particle diameters of about 0.1 μm; deposition of hygroscopic particles was greater by factors of 0.57, 0.63, and 0.70 for the three salts. The corresponding maximum and minimum factors for aerodynamic diameter were 2.1, 1.56, and 1.33 (maxima), and 0.90, 0.91, and 0.98 (minima) (Fig. 7).
Calculations were performed for rat and human airways, three salts, and three drugs, for the particle diameter dp and aerodynamic particle diameter dae.
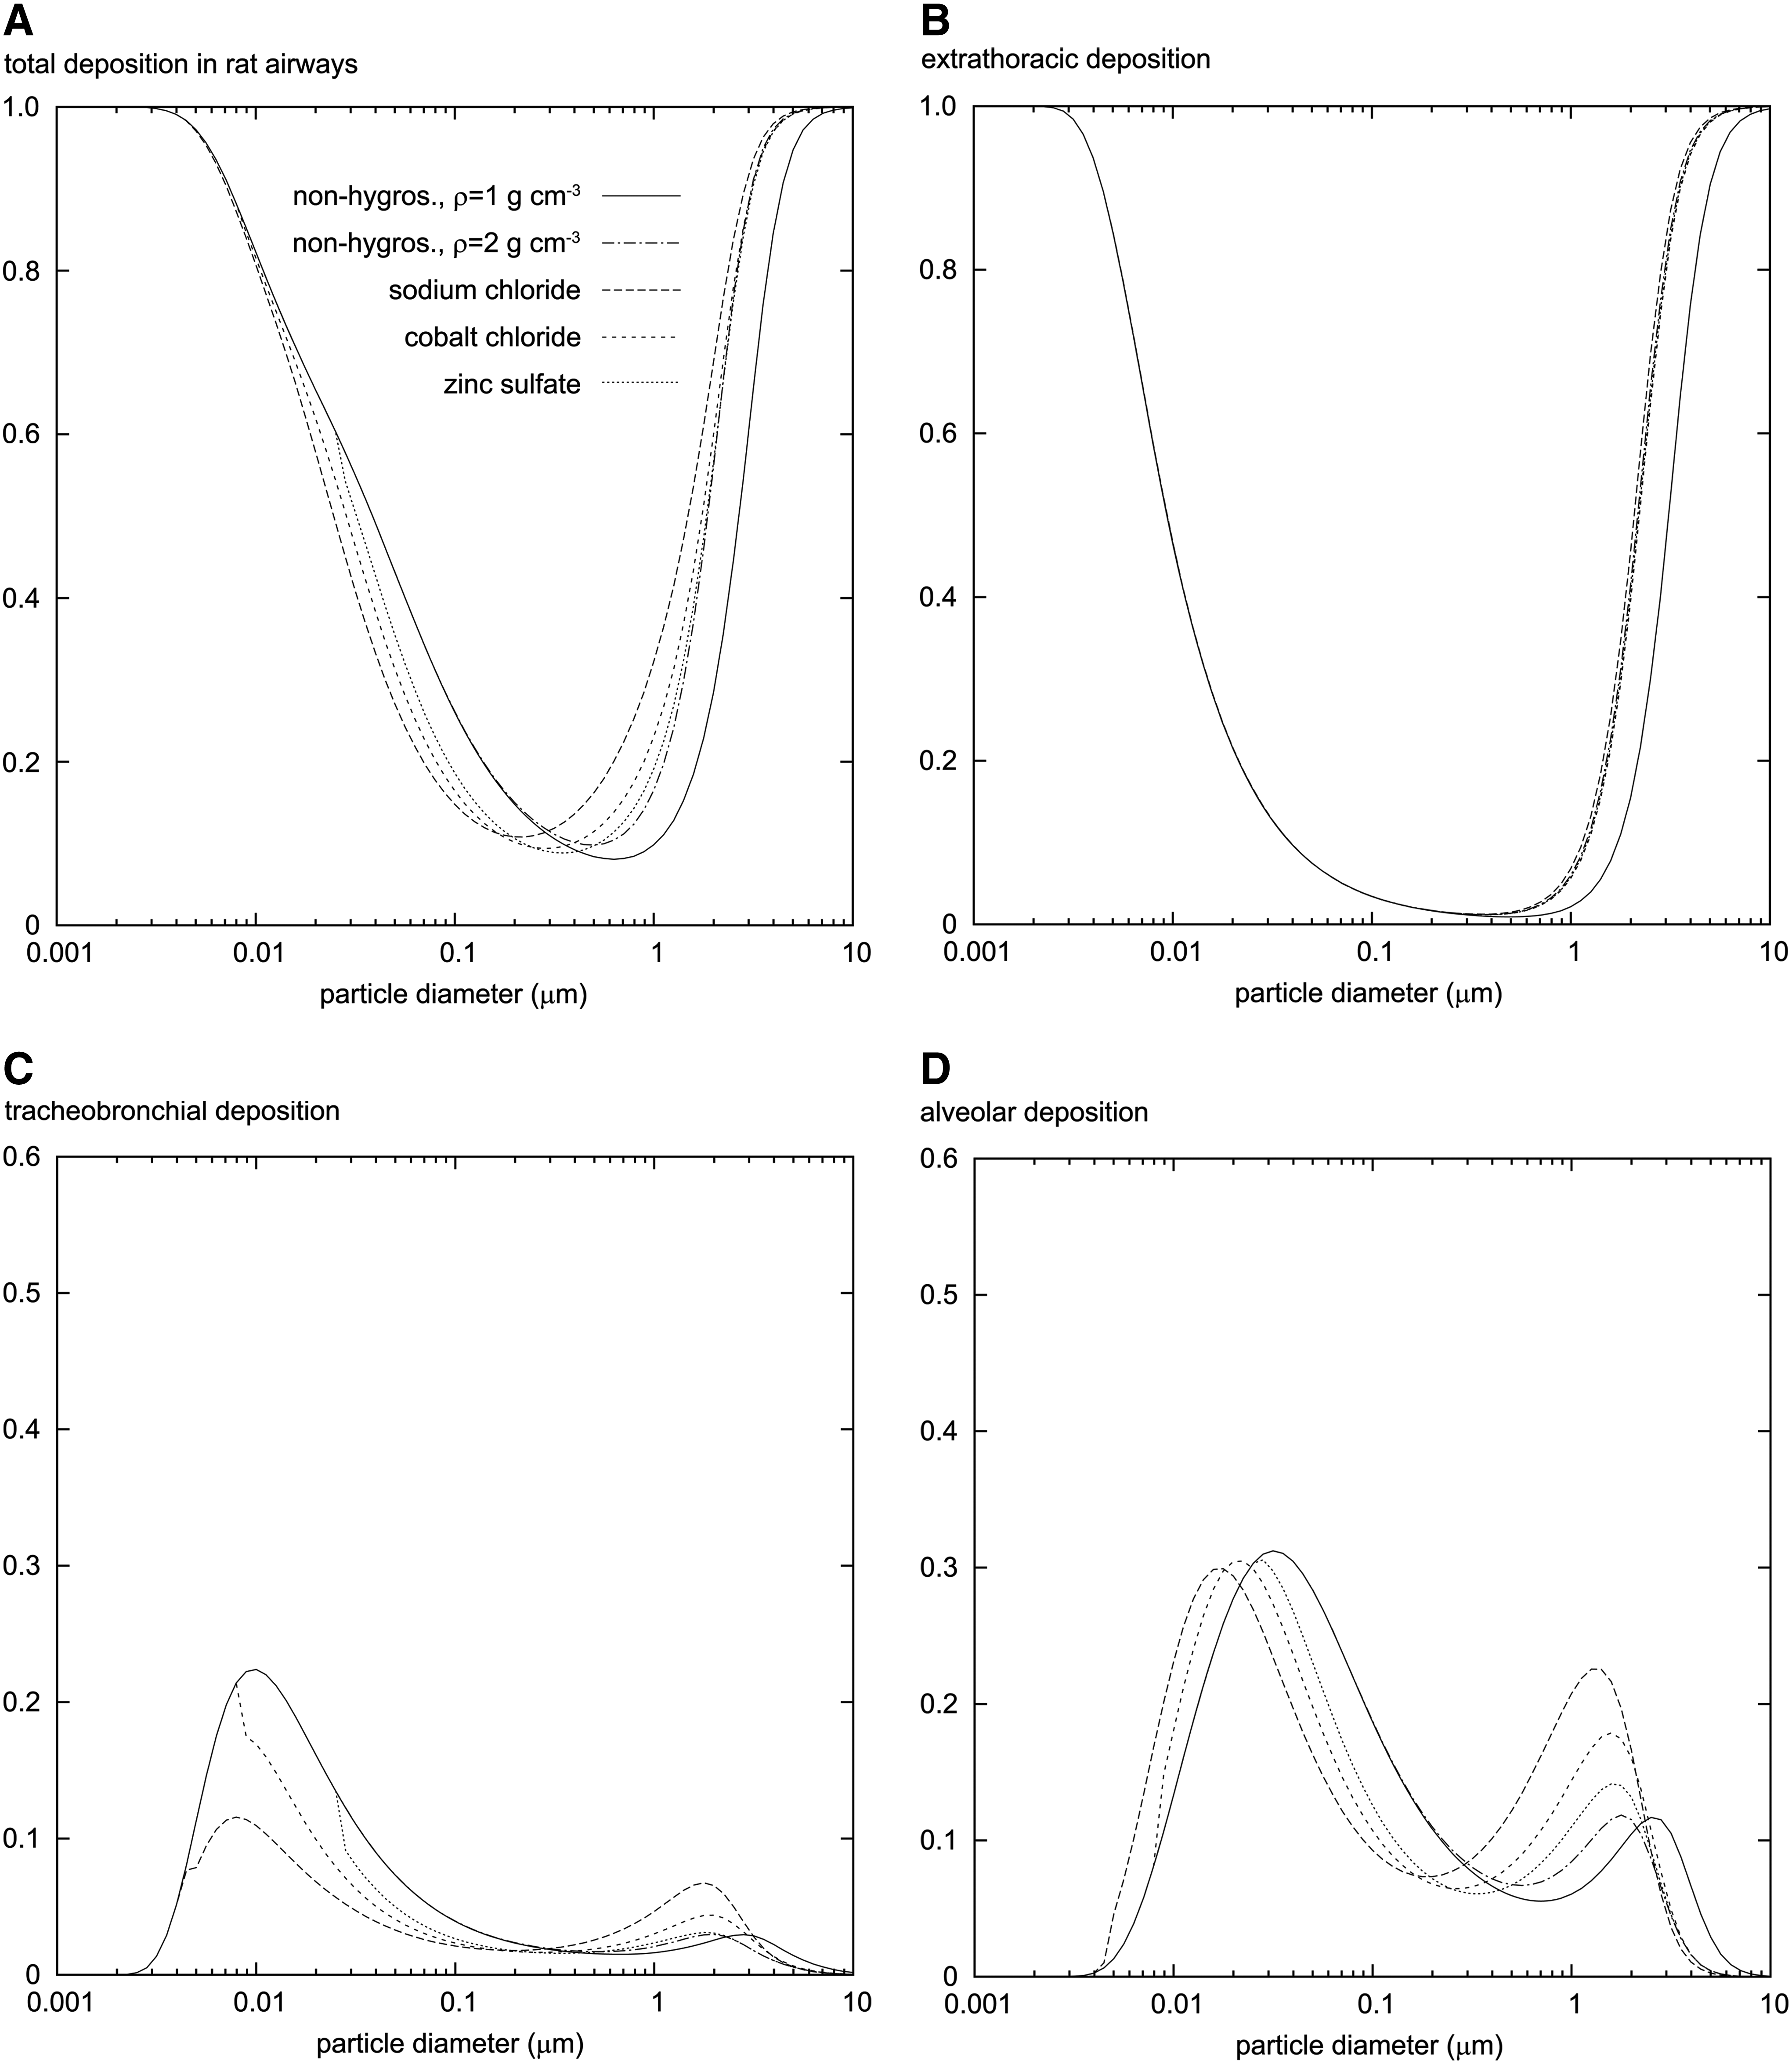
Figure 8 shows the total and regional depositions of the hygroscopic particles of the drugs histamine dihydrochloride, carbenicillin disodium, and atropine sulfate under the HTC scenario (quiet respiration), with a tidal volume of 2.1 cm3, a respiration frequency of 102 min−1, and constant inhalation and exhalation flow rates of 7.14 cm3 sec−1. As for the salts, differences are seen in total deposition across the size range 0.02 to 5 μm. Total lung deposition of drug particles was 1.86, 1.53, and 1.35 times greater than that of nonhygroscopic particles at the maximum (Table 4). The factors are smaller than for the three salts, reflecting the lower growth factors of the drugs (Table 3).

Lung deposition in the rat airways as a function of dry particle diameter for three drugs (histamine dihydrochloride, carbenicillin disodium, and atropine sulfate) and a nonhygroscopic material with a density of 1 g cm−3, using the HTC scenario for quiet respiration:
Figure 9 shows the total and regional deposition data calculated for human airways for the three drugs and a nonhygroscopic material under the HTC (quiet respiration) scenario, with a tidal volume of 750 cm3, a respiration frequency of 12 min−1, and constant inhalation and exhalation flows of 300 cm3 sec−1.
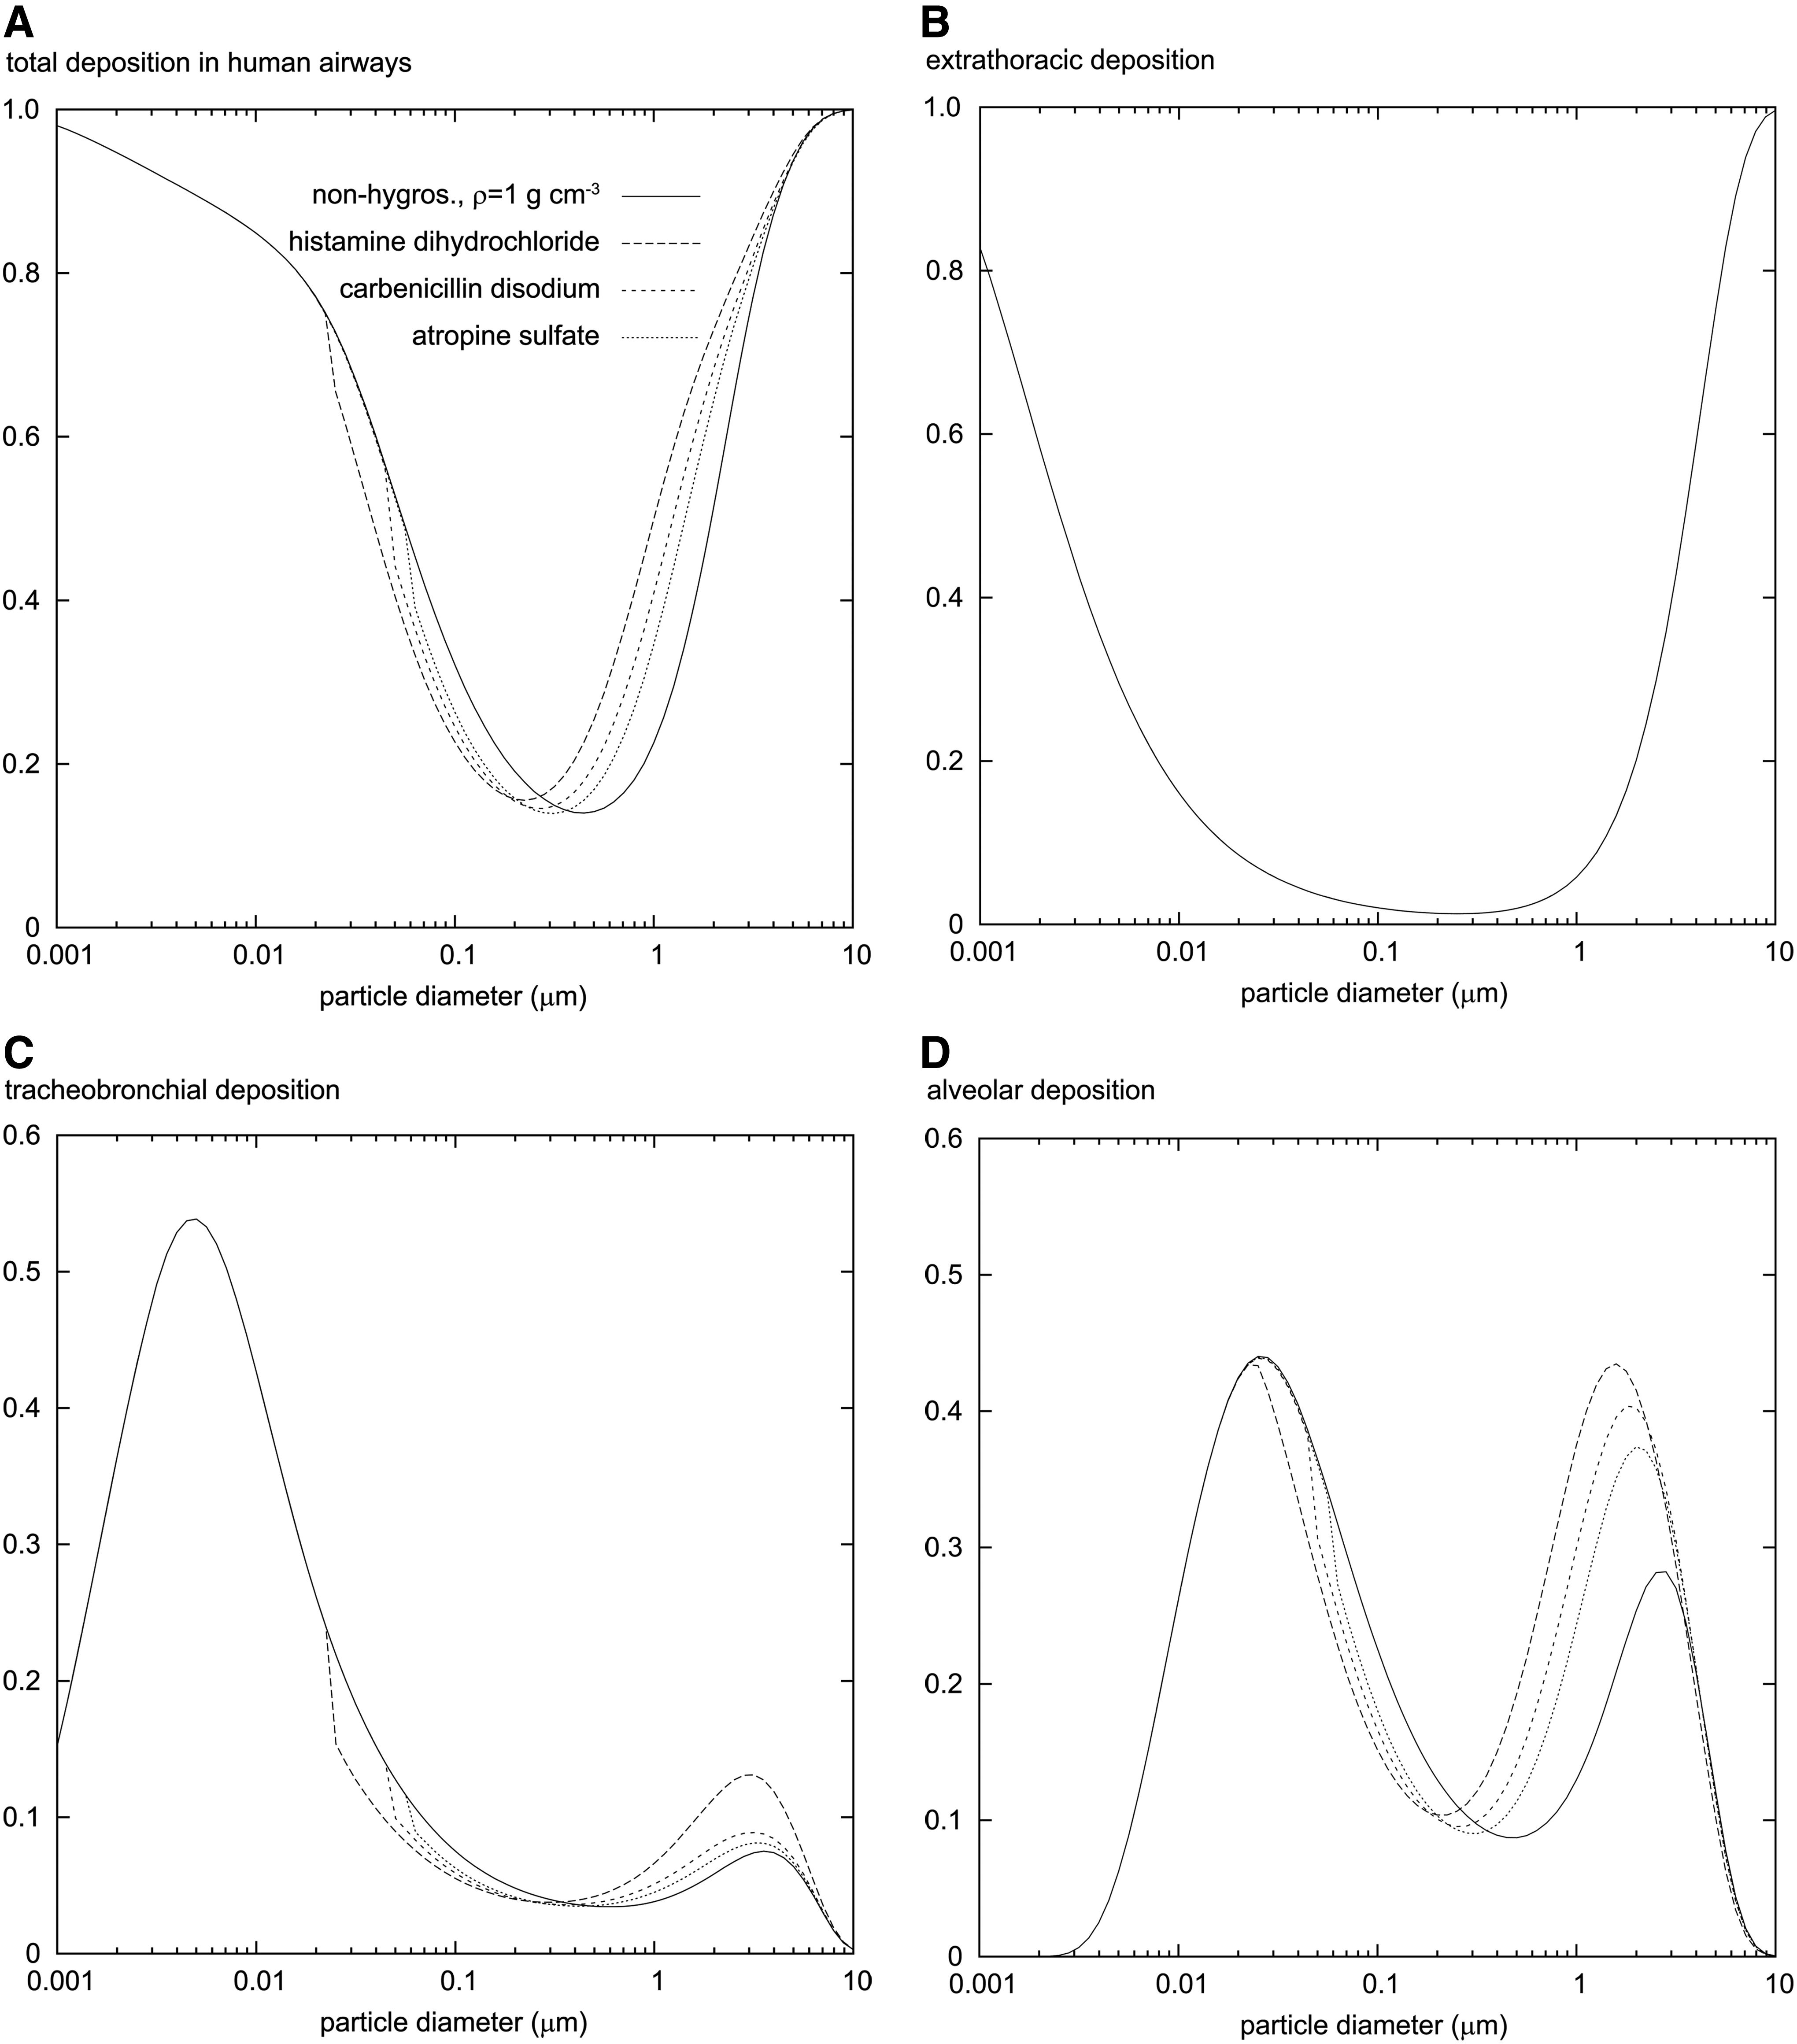
As in Figure 8, but for the human lung deposition and quiet respiration.
Discussion
Influence of physiological, environmental, and particle parameters
The physiological parameter body temperature has only a small influence on the parameter L/Q. For example, a change in body temperature of 1°C (equivalent to a change in inhaled air temperature of 1°C) changes L/Q by less than 0.02 sec cm−2 (Fig. 1A). Similarly, a change in the RH of the inhaled air by 10% modifies L/Q by less than 0.1 sec cm−2 (Fig. 1B). The temperature and RH changes are of minor importance in comparison with the C1L1/Q1 value for a rat nose of 0.7 (Table 1) and can be neglected.
The blood osmolality also has little effect. A change in equilibrium RH from 0.9950 to 0.9948 changes the equilibrium volume of a droplet by a factor of (1 – 0.995)/(1 – 0.9948), or 0.962, which corresponds to a change in equilibrium droplet size by a factor of 0.987. A change in osmolality from 287 mosm kg−1 (human airways)(8) to 302 mosm kg−1 (rat airways; this study) corresponds to a change in equilibrium droplet size by a factor of only 0.983.
Ambient air conditions influence the equilibrium conditions in the upper airways to a greater extent. For example, a reduction in the temperature of inhaled air from 23°C to 10°C or even 0°C can markedly increase the local RH in the upper airways and result in supersaturation of the air during inhalation.(22,24,48) This would lead to a rapid growth in particle size followed by shrinkage to the equilibrium size in the alveolar region, which cannot be neglected.
The growth factor of a salt or drug is directly dependent on the dissociation constant is, which is a function of solute concentration. For example, sodium chloride has a dissociation constant of 2.0 in a dilute solution, 1.85 in a physiological solution, and 2.4 in a saturated solution.(49) Data on the dissociation constant are available for salts,(49) but not for most drugs. However, the values can be obtained from the isosmotic concentration(50) using the equation given in Appendix 4 (Equation A4.9). The sensitivity to the dissociation constant can be estimated as in the following example. After inhalation of a sodium chloride particle with a dry diameter of 2 μm (Fig. 4C), the solution becomes diluted, with corresponding RH values of 0.9, 0.99, and 0.995 reached after about 0.05, 2, and 30 sec, respectively. The corresponding dissociation constants are 2.4, 1.84, and 1.85. Thus, the dissociation constant only deviates markedly during the first 50 msec and then remains more or less constant during the remaining time needed to reach equilibrium of about 30 sec. This means that the dissociation constant can also be considered constant during the mean residence time of an aerosol particle in the rat lungs of about 0.3 sec.
Most salts, and probably most drugs, are known for their characteristic deliquescence RH. This is defined as the RH of a saturated salt solution. The dissociation constant of a salt or drug at isosmotic concentration differs from its dissociation constant at saturation concentration. We determined the value of saturated solubility in such a way that it fits with the dissociation constant for an isosmotic concentration and with the deliquescence RH for the salt.
Influence of flow conditions in rat and human airways
The mean Reynolds number Re (Appendix 3, Equation A3.1) for quiet respiration in the upper human airways is larger than the corresponding number in the rat airways by a factor of about 9 (Tables 1 and 2), showing that the airflow in the rat airways is closer to a laminar condition (LTC) than the airflow in human airways (HTC). So the growth curves (Fig. 3) for rat airways lie between the curves for the HTC and LTC scenarios. The LTC scenario (Equation A2.2) assumes an instantaneous increase in the wall temperature and RH at the lung entrance to values of 37°C and 0.995, respectively. The real growth may be lower than under LTC, because the wall at the nose entrance has not reached body conditions. Figure 5 shows, however, that these differences have a negligible influence on the total and regional deposition; the calculations under the HTC and LTC scenarios result in nearly identical graphs. Thus, the (unknown) flow conditions in the rat airways have little influence on deposition. We therefore assume that the same is true for the wall temperature and RH profiles in the upper airways, which are also unknown. The differences are more pronounced for the ATC, and thus the ATC scenario is considered to be unrealistic.
A similar scenario is found in the literature(9): there also the particle has reached its equilibrium size instantaneously at the entrance of the nose. This neglects, however, both the time the air needs to reach body conditions (T=37°C, RH=0.995) and the time the particle needs to reach its equilibrium. Therefore, this scenario is considered even less realistic than ATC.
Limitations of the model
The model is based on the assumption that the aerosol particle concentration is homogeneously distributed across the airway cross section while entering the next lung generation. A comparison of calculated and experimental human deposition data(51) has shown an overestimation of the calculated deposition in the tracheobronchial region and an underestimation in the alveolar region, with a similar sum overall. This means that part of the calculated tracheobronchial deposition actually occurs in the alveolar region. We expect that the same effect will occur in the rat airways.
A further limitation of the model is the assumption of laminar airflow in all lung generations. As mentioned above, deviations are expected for Re>200. In the rat, this only takes place in the trachea, whereas in human lungs it occurs in the uppermost eight generations. Thus, instability in the laminar airflow is considered to be a minor problem in the rat lung.
Limitations for nano-sized particles and gas molecules
Below 10 nm, particles behave more and more like molecules, depending on the particle substance.(23) For example, large (organic) molecules of about 500,000 Da can reach 10 nm and may behave like particles that are bound to the airway surface by adhesion or van der Waals forces.(52) The small gas molecules, however, are rebounced by electrical forces and are able to escape from the surface, particularly when the vapor pressure in air and mucus are not in equilibrium, for instance for N2, O2, CO2, SO2, and O3.(23) For gas molecules, dissolution, translocation, metabolism, and solution concentration in the body liquids have to be be considered. The assumption that all the particles or molecules deposited on the airway walls are retained is not fulfilled, and the model may generate unrealistic results.
Application to drug aerosols and interpolation of the model results
The effect of hygroscopicity on the deposition of three types of drug particles is shown in Figure 8. The graphs for total and regional deposition are similar to the graphs for the three different salts shown in Figures 6 and 7, but the differences between the curves are smaller for the drugs due to their smaller growth factors (Table 3). In both data sets (Figs. 6 and 8), the shift in hygroscopic deposition results mainly from the growth in the tracheobronchial and alveolar region.
A previous study looked at the interdependence of hygroscopic deposition and the growth factor.(53) In that study, the deposition of cobalt chloride was interpolated using the growth factors of the three salts and the deposition data calculated from the model of sodium chloride and zinc sulfate. The differences between the interpolated and calculated deposition were less than 13%.
This interpolation method (Appendix 6) was applied here to show that the deposition of an arbitrary salt or drug can be estimated from the data in this article and the growth factor (Equation A6.1). As an example, the deposition of carbenicillin disodium was estimated using the deposition data calculated from the model for histamine dihydrochloride and atropine sulfate and the growth factors of the three drugs (Table 3). The differences found between the interpolated total deposition and the total deposition calculated from the model were between −2% and+7% for particles of 0.05 to 5 μm, respectively, and between −7% and+22% for the whole size range. Thus, this method may be a useful tool to estimate the total deposition of an arbitrary drug by calculating its growth factor from its osmolality or isosmotic concentration(50) (Appendix 4, Equation A4.9), which can be measured by osmometry. There is no fundamental difference between the hygroscopicity of a salt or drug (Table 3).(50)
Comparison of the deposition in rat and human airways
The total and regional lung deposition in the rat and human airways can be compared using Figures 8 and 9. The differences between hygroscopic and nonhygroscopic deposition are found mainly for particles with diameters between 0.02 and 5 μm in rat airways (Fig. 8) and particles with diameters between 0.02 and 6 μm in human airways (Fig. 9).
Hygroscopicity reduces the total deposition for particles between 0.02 and 0.3 μm and increases it for particles between 0.3 and 6 μm (Fig. 9A). The difference between hygroscopic and nonhygroscopic deposition for particles of the same size (Table 4) correlates well with the growth factor of the material in both rat and human airways. Deposition as a function of the aerodynamic diameter is about 20% higher for the human airways compared with rat airways, which can be explained by the longer mean residence time inside the human airways.
The graphs for total deposition in rat and human airways (Figs. 8A and 9A) have nearly the same shape, with some differences for particles between 0.001 and 0.050 μm, around 0.4 μm, and above 1 μm. The graphs for regional deposition (Figs. 8B and 9B) show higher deposition in the rat nasopharynx than in the human nasopharynx for particles of 0.001 to 0.05 μm and larger than 1 μm, which results from differences in the experimental data used as a basis for the approximation (Appendix 1).(37) The deposition of dry sodium chloride particles in the nasopharynx is about a factor of 2 larger in human than in rat airways. Both values for the tracheobronchial (Figs. 8C and 9C) and the alveolar deposition (Figs. 8D and 9D) are larger and differences are more pronounced in human than in rat airways for particles of diameter 1 to 3 μm for both hygroscopic and nonhygroscopic particles.
An absolute difference in total deposition is found around a particle size of 0.5 μm. Here total rat deposition is about 9% and in man about 16%, nearly twice as high.
Application to volatile substances other than water
Environmental aerosols (in the workplace, outdoors, indoors) are, in general, a mixture of solids, liquids, and vapors in a gas phase, and each particle substance has a characteristic vapor pressure. In general, one can expect that the vapor concentration in the air is in equilibrium with the vapor pressure at the particle surface caused by the diffusion of vapor molecules. After inhalation, the particles grow or shrink if the walls of airways and alveoli have a vapor pressure different from that of the inhaled air. Further, polar compounds may be adsorbed on or absorbed in the liquid water condensing on the particles. Microenvironments of the particle, such as pores or internal surfaces, may considerably delay equilibration. Changes in the chemical composition of the liquid film on a particle are particularly influenced by vapors with a saturation concentration comparable to that of water (17 μg cm−3 at 20°C). Such vapors are known in health care (e.g., menthol, camphor, eucalyptus), environmental science, indoor aerosols (e.g., formaldehyde, acrolein, phenol), and the workplace (lubrication oils from alkene-like materials) and fresh combustion emissions from traffic, power generation, or biomass burning (e.g., butadiene, alkenes, acetaldehyde).
Our model does not include concentration changes of compounds other than water. But the module for the change in the diameter of salt or drug particles in humid air (Appendix 5) can be adapted to other substances if the saturation vapor concentration, molecular weight, liquid density, thermodynamic data on the interaction with water, and diffusion coefficient of the vapor in air are known. Information is also needed on the boundary conditions at the walls of the airways and alveoli; for example, a simple boundary condition would be zero concentration at the airway walls for soluble substances. Then the evaporation of the liquid substance from the particle could be easily calculated. In practice, however, the boundary condition of zero concentration on the airway walls is not completely fulfilled, as transport through the epithelium and chemical/metabolic reactions must also be considered, leading to a more complicated model. The ICRP report on lung dynamics(23) presents an empirical model for particle deposition and retention and a (preliminary) model for vapor deposition. A revision of the models has not yet been published.
Taking the hygroscopic properties into account is the first step in considering chemical parameters for deposition modeling. Taking the gas-phase interactions between particles, vapors, and airway walls into account is likely to be an important task for the future to enable assessment of the health impact of the gas phase in complex combustion aerosols emitted, for example, from biomass burning processes or biofueled internal combustion engines.
Conclusions
The hygroscopic particle lung deposition model for the rat described here is a hypothetical model. So far, there are no experimental data available on the deposition of hygroscopic particles in rat airways that can be used to evaluate the model. However, the model is derived (1) from a model for nonhygroscopic particle deposition in rat airways,(28) (2) from a theory of the temperature and RH in human airways,(20) and (3) from a hygroscopic particle deposition model for human airways.(17) These three models have been confirmed by experimental data. To mimic the rat lungs, we only changed the lung structure and adjusted the flow conditions. Therefore, we consider that the present model provides a firm basis for estimating hygroscopic particle deposition in rat airways.
Differences between hygroscopic and nonhygroscopic deposition were mainly found for particles between 0.02 and 5 μm in rat airways and between 0.02 and 6 μm in human airways. The maximum differences between hygroscopic and nonhygroscopic deposition of salts varied by factors of 0.70 to 2.1 for zinc sulfate and 0.57 to 3.3 for sodium chloride, 0.76 to 1.4 for the drug histamine, and 0.65 to 1.9 for the drug atropine (Table 4). Overall, the factors in rat airways were about 20% less than the factors in human airways. Thus, the hygroscopicity of aerosol particles should always be considered in rat lung dosimetry.
The (unknown) flow conditions in rat airways had a negligible influence on the deposition of hygroscopic particles.
An interpolation method has been proposed to estimate the deposition of drug particles with known isosmotic concentration in rat airways.
Footnotes
Acknowledgments
The authors acknowledge the fruitful discussions with Dr. Shinji Takenaka. His help with the measurements on the osmolality of rat blood is highly appreciated. We thank Dr. A. Beatrice Murray for editing of the English text. This work was partly motivated by the work program of the Helmholtz Virtual Institute of Complex Molecular Systems in Environmental Health (HICE, ![]() ).
).
Author Disclosure Statement
The authors declare that no conflicts of interest exist.
Appendix 1. Impaction and Diffusion in the Human Nose
Cheng(37) reviewed the experimental data on deposition in the human nose and analytical approximations. Deposition in the nose by impaction and diffusion, DEnose, is approximated by
where dae is the aerodynamic particle diameter, Q is the inhalation or exhalation airflow rate, and Dp is the diffusion coefficient of the particle in air. This equation is valid for both inhalation and exhalation.
The corresponding equation for mouth deposition, DEmouth, is
Appendix 2. Heat and Water Vapor Transport in the Upper Human Respiratory Tract
Water vapor transport in a straight tube is described by the differential equation
where x, y, and z are the cartesian coordinates with the z-axis parallel to the axis of the tube, c is the water vapor concentration, vz (x,y) is the airflow velocity, and Dw is the diffusion constant for water molecules in air. For this equation, there is an analytical solution for a stable laminar airflow in a tube with circular cross section.(54,55) The velocity-weighted mean water vapor concentration c(L/Q) in a tube cross section at a length L from the tube entrance and a volume flow rate of Q is
where c0 is the water vapor concentration of the inhaled air and cwall the water vapor concentration at the tube wall.
Heat transport is described by a similar equation replacing c with T and Dw with DT=κ/(ρ a cp), where DT is the heat diffusivity of air, κ is the heat conductivity, ρ a is the density of the air, and cp is the heat capacity of the air. This solution for water vapor and heat transport is referred to in this article as the laminar transport condition (LTC).
The relative humidity (RH) is defined as the ratio of the local water vapor concentration c and the saturated water vapor concentration cw(T) at the same temperature.
The solutions for c, T, and RH depend on the parameter L/Q. This parameter can be used to transform the solution for a straight tube to a solution for the human respiratory tract as described by a lung structure model (Table 2)(20,30)
where Ci is a correction factor for a noncircular tube cross section. For each lung generation i, the solution in Equation A2.2 can be compared with experimental data from the literature (Fig. 1A). There is a large difference between the laminar solution and the experimental data sets, which is thought to result from the additional transport caused by nonlaminar airflow patterns in the upper human respiratory tract. Here nonlaminar airflow is simulated using a laminar boundary layer with thickness ΔD and a nonlaminar core flow with a diffusivity Da in addition to Dw or DT.
A wall profile for temperature and RH is introduced to account for an exhaled air temperature lower than the body temperature of 37°C, and an exhaled RH of the air of about 0.9. The differential equations for water vapor and heat transport are solved simultaneously using a numerical method.(20,30) An optimal approximation to the experimental data was obtained for an airflow of 250 cm3 sec−1, ΔD=0.08 D, where D is the tube diameter, Da=1.0 cm2 sec−1, wall temperatures of 30, 35, and 37°C corresponding to L/Q of 0, 0.15, and>0.3 sec cm−2, respectively, and a wall profile for RH of 0.7 and 0.995 corresponding to L/Q of 0 and>0.15 sec cm−2, respectively. This solution is referred to in this publication as the human transport condition HTC.
Appendix 3. Flow Conditions in the Airways Characterized by the Reynolds Number
The Reynolds number Re is defined as the ratio between the inertial and the viscous forces. It is often used in flow dynamics(52) and is defined by
where ρ is the density and μ the dynamic viscosity of the fluid,
A turbulent flow has Re larger than 10,000. Laminar airflows are expected for Re less than 1,000. However, changes in tube cross section, bends, and bifurcations cause flow eddies and other deviations from laminar flow that may persist for some time. This was visualized in casts from human airways.(56,57) Eddies are found for Re down to 200. Reynolds numbers larger than 200 are found in the trachea of the rat and in the first eight human lung generations for quiet breathing (Tables 1 and 2).
The distance L from the tube entrance to stabilize a plug flow was determined experimentally for straight tubes(58,59) with a difference of 10% from a stable laminar flow as
Appendix 4. Equilibrium of and Transport to a Single Aerosol Particle in Humid Air
A salt particle or droplet is in equilibrium if the water vapor concentration of the air ca is equal to the water vapor concentration at the particle surface cp. The concentration cp is equal to the saturated water concentration cw(T) at a temperature T with corrections for dissolved solutes in the droplet N (Law of Raoult)(52) and curvature of the particle surface K (Kelvin correction)(52):
where T is the absolute temperature, is is the dissociation constant of the salt or drug, ns and nw are the numbers of salt and water molecules in the particle, ms and mw are the masses of salt and water molecules in the particle, Ms and Mw are the molecular weights of salt and water, js is the number of water molecules bound in the salt crystal, σ w is the surface tension of a water surface, R is the general gas constant, ρ w is the density of water liquid, and dp is the droplet diameter.
A hygroscopic aerosol particle is in equilibrium with its surrounding air if its water vapor concentration and temperature are equal to the corresponding values of the air. The equilibrium size of a particle in humid air can be characterized by a growth factor gRH defined as the ratio of the particle diameter at a relative humidity RH to the dry particle diameter dp,dry.
where ρ,, ρs, and ρw are the densities of solution, dry salt, and water, respectively. The density of the solution ρ
l
is approximated by
For the aerodynamic diameter dae(52,60)
where C(d) is the slip correction, λ is the mean free path of the gas molecules, and d is the particle diameter dae or dp.
Then the aerodynamic growth factor gae,RH is
A salt or drug normally has a maximum solubility or saturation solubility in water. The RH corresponding to the saturation solubility is called the deliquescence RH.
The dissociation constant of a salt or drug can be calculated from its isosmotic concentration as listed in The Merck Index.(50) By definition in The Merck Index, an isosmotic concentration of an arbitrary substance has the same freezing point reduction of 0.57°C as a sodium chloride solution of 0.9 g in 100 mL of solution. It is expressed as 0.9% or 0.9 g in 100 cm3 of solution. If cisosm is the isosmotic concentration of a salt or drug, then the water volume is 100 – cisosm/ρs, where ρ
s
is the density of the salt or drug in g cm−3. Assuming that the RH is 0.995 for the isosmotic concentration, the dissociation constant is is, according to the Law of Raoult (Equation A4.2)
where ρ s is the density of the salt or drug.
Appendix 5. Transport to or from a Particle Surface in Humid Air
The growth of a single aerosol particle in humid air is determined by the transport of both water vapor I and heat Φ to the particle surface. Both transport fluxes are in a quasistationary equilibrium with each other. So
where H is the heat of condensation of water. This quasistationary equilibrium is reached in a time interval much smaller than the evaporation time of the droplet.(16)
The water vapor transport I to the particle surface is(16)
where Dw is the diffusion coefficient of water vapor in air, CW is a correction for the discontinuity of the gas, αw is the water vapor accommodation coefficient equal to 0.04,(16,61) ν is a gas dynamic parameter, and Δ is a parameter in the boundary layer theory of Fuchs equal to 2λ/3, where λ is the mean free path of the gas molecules.
A similar equation is valid for the heat transport Φ to the particle surface(10)
where DT=κ/(cp ρa) is the heat diffusivity of air, Ta and Tp are the temperatures of the air and the particle surface, and αT is the heat accommodation coefficient equal to 1.0.
The Equations A5.1 to A5.6 are solved numerically,(10,17) as they not only deal with changing parameters of the particle such as solute concentration, density, and size, but also with changing conditions for air temperature and water vapor concentration.
Appendix 6. Approximation of the Deposition of Drug Aerosol Particles
As shown in Ferron et al.,(53) the deposition in the human airways of an unknown arbitrary salt can be approximated from the deposition graphs of two other salts by interpolation if the growth factors of the salts are known. The deposition of a particle with an initial dry diameter dp of an arbitrary salt in a lung generation i is DEi,s:
where DEi,1 and DEi,2 are the deposition values of particles of the salts “1” and “2” with an initial dry diameter dp in lung generation i, g1 and g2 are their growth factors, and gs is the growth factor of the arbitrary salt.