
Abstract
Abstract
Background:
Predictable delivery of aerosol medication for a given patient and drug-device combination is crucial, both for therapeutic effect and to avoid toxicity. The gold standard for measuring pulmonary drug deposition (PDD) is gamma scintigraphy. However, these techniques expose patients to radiation, are complicated, and are relevant for only one patient and drug-device combination, making them less available. Alternatively, in vitro experiments have been used as a surrogate to estimate in vivo performance, but this is time-consuming and has few “in vitro to in vivo” correlations for therapeutics delivered by inhalation. An alternative method for determining inhaled mass and PDD is proposed by deriving and validating a mathematical model, for the individual breathing patterns of normal subjects and drug-device operating parameters. This model was evaluated for patients with cystic fibrosis (CF).
Methods:
This study is comprised of three stages: mathematical model derivation, in vitro testing, and in vivo validation. The model was derived from an idealized patient's respiration cycle and the steady-state operating characteristics of a drug-device combination. The model was tested under in vitro dynamic conditions that varied tidal volume, inspiration-to-expiration time, and breaths per minute. This approach was then extended to incorporate additional physiological parameters (dead space, aerodynamic particle size distribution) and validated against in vivo nuclear medicine data in predicting PDD in both normal subjects and those with CF.
Results:
The model shows strong agreement with in vitro testing. In vivo testing with normal subjects yielded good agreement, but less agreement for patients with chronic obstructive lung disease and bronchiectasis from CF.
Conclusions:
The mathematical model was successful in accommodating a wide range of breathing patterns and drug-device combinations. Furthermore, the model has demonstrated its effectiveness in predicting the amount of aerosol delivered to “normal” subjects. However, challenges remain in predicting deposition in obstructive lung disease.
Introduction
The aim of this study was to formulate a new approach, based on a mathematical model of in vitro nebulizer performance, and determine its feasibility in predicting the in vitro and in vivo performance of the nebulizers, PARI LC STAR® and PARI LC PLUS®, when used in CF treatment. The mathematical model was based on the breath-enhanced nebulizer where the patient's inspiratory flow is entrained through the device to augment aerosol output. The model was then coupled with a range of well-defined breathing patterns. Verification of the model was then completed in two stages. The first part compared the prediction of the model for inhaled mass to the in vitro mechanical model. The second part verified the accuracy of the mathematical model based on pulmonary deposition to in vivo imaging measurements based on gamma scintigraphic technique already described.(6)
Materials and Methods
In vitro experiments
Mathematical model
Initially, the in vitro model describing the inhaled mass was based on the aerosol collected on a filter at the “mouth” of a breath simulator, the combined breathing pattern of the individual patient, and the steady-state output from the nebulizer, not considering any aerosol that was inhaled into the anatomical dead space and subsequently exhaled before it could be deposited in the lungs. Actual lung deposition is dependent on both the inhaled mass and the aerosol particle size distribution.(5) Previously, Coates, et al.(3) established that the CF patient's tidal respiration can be modeled using two half sinusoidal waves(3): one describing the inspiratory and the other the expiratory portion of each breathing cycle. The patient's flow (Eqn. 1) encompasses two variables to account for variations in patient breathing cycles: tidal volume (VT), and breathing frequency (ω). Two different values of ω are used to represent the shorter inspiratory phase and the expiratory phase of each tidal breathing cycle, respectively:
where V′pt(t) is the patient's flow in L.min–1, V′pi(t) is the inspiratory flow in L.min–1, V′pe(t) is the expiratory flow in L.min–1, VT is the tidal volume in L, ωi is the inspiratory breathing frequency in rad.min–1, and ωe is the expiratory breathing frequency in rad.min–1.
The measurement accuracy of a breath-enhanced nebulizer's output during steady-state conditions can be verified using mass balance and mathematically modeled based on entrained flow.(1) The entrained flow is the patient's flow minus the nebulizer flow. Alternatively, we can say that the patient's flow is the summation of the nebulizer flow and the entrained flow, as shown below:
where V′N is the nebulizer flow (compressor flow) in L.min–1, V′ent is the entrained flow into the nebulizer in L.min–1, and V′pt is the patient's inspiratory flow in L.min–1.
The rate of steady-state output in relation to entrained flow can be defined by a quadratic function,(2,7) which is descriptive of a dynamic physiological mathematical model whose detailed derivation is provided in the Appendix. The expression that describes the behavior of a breath-enhanced nebulizer such as the PARI LC STAR or PARI LC PLUS is:
where Otot is the inhaled mass in milligrams per breath, VT is the patient's tidal volume in liters, V′N is the nebulizer flow in liters per minute, ω is the frequency of inspiration in rad.sec–1, time points (t2 and t1) show when the patient's inspiratory flow exceeds the nebulizer flow in seconds, and coefficients a, b, and c are obtained from nebulizer characterization curves.(2)
Experimental measurement method
Nebulizers
Two breath-enhanced nebulizers were studied: PARI LC PLUS and PARI LC STAR (PARI Pharma GmbH, Munich, Germany), with each device being tested in triplicate. The nebulizer PARI LC PLUS has had widespread application in the administration of tobramycin inhalation solution (TOBI®; Novartis Pharmaceuticals, East Hanover, NJ) within the CF population,(8,9) and the nebulizer PARI LC STAR is a more recent and efficient version that has been used in denufosol trials with this patient population.(10) Each nebulizer was driven by a PARI Proneb Ultra Compressor (PARI Respiratory Equipment, Midlothian, VA) and confirmed to be at the recommended flow of 4.1 L.min–1 (TSI flow-calibration instrument; TSI, Shoreview, MN). Compressors were used instead of the hospital dry gas source in order to mimic the home environment, with its reduced evaporative losses compared with dry hospital medical gases.(11) Three devices of each nebulizer class were selected and tested using a 4-mL fill volume of 0.625 mg.mL–1 albuterol solution. Albuterol was chosen because it has physical characteristics close to that of water or an aqueous drug solution and has a double bond that facilitates quantification by UV spectrophotometry.(12) Characterization of the devices was completed under steady-state conditions, and the performance of the devices was conducted under dynamic conditions that simulated the ideal patient's tidal breathing pattern.
Experimental setup
Steady-state conditions—Steady-state experiments were conducted to obtain device characterization curves (device output versus entrained flow, ranging from 0 to 35 L.min–1). For each experiment, the nebulizers were vertically clamped and the device output was determined after 4 min using a previously described technique(13) involving osmometry that takes into consideration the evaporative losses during nebulization that would change the drug concentration in the nebulizer.(14) A set duration was selected, as opposed to letting the device run until “end nebulization,” in order to calculate the rate of output without the influence of sputtering (where output becomes variable toward the end of nebulization).
When calculating the output of the nebulizer, osmolality was used as a proxy for the spectrophotometry quantification of albuterol residual in the nebulizer, as it was simpler and has been demonstrated to give the same results.(15) Previous studies using osmolality as a proxy have been established(11); therefore, the nebulizer output could be determined, based on the initial dose minus the mass of the drug left in the well of the nebulizer at the end of nebulization (residual volume multiplied by the initial concentration) multiplied by the ratio of final-to-initial osmolality, which takes the evaporative effects into account.(11) Subsequently, the rate of output is calculated as the total output divided by the runtime. Measurements based on osmolality were accepted if they were within 10% of the spectrophotometry results:
where Di is the initial dose in milligrams, Vr is the residual volume in milliliters, Ci is the initial drug concentration in milligrams per milliliter, osm is the osmolality in milliosmols, and trun is the runtime in minutes. The initial dose of albuterol was 4 mg at a concentration of 0.625 mg.mL–1.
Dynamic conditions—Evaluation of the nebulizer's performance was also performed under dynamic conditions that simulated an idealized patient respiration cycle with varying volumes, inspiratory time to total time (Ti/TTot), and breathing frequencies. The nebulizer was connected to a T-connector attached to an inspiratory filter and an expiratory filter with a unidirectional valve, as shown in Figure 1. The “mouth” of the aforementioned setup in Figure 1 was connected to the modified Harvard pump (Harvard Model 613 Volume-Controlled Large Animal Ventilator; Harvard Apparatus Canada, Saint-Laurent, QC, Canada) capable of generating half sine-wave patterns of breathing with added modification to allow a longer and adjustable expiratory time compared with inspiratory time. This modification sets inspiration to be the inward motion of the piston and expiration as the outward motion of the piston, whereas in the “out of the box” Harvard pump the opposite applies.
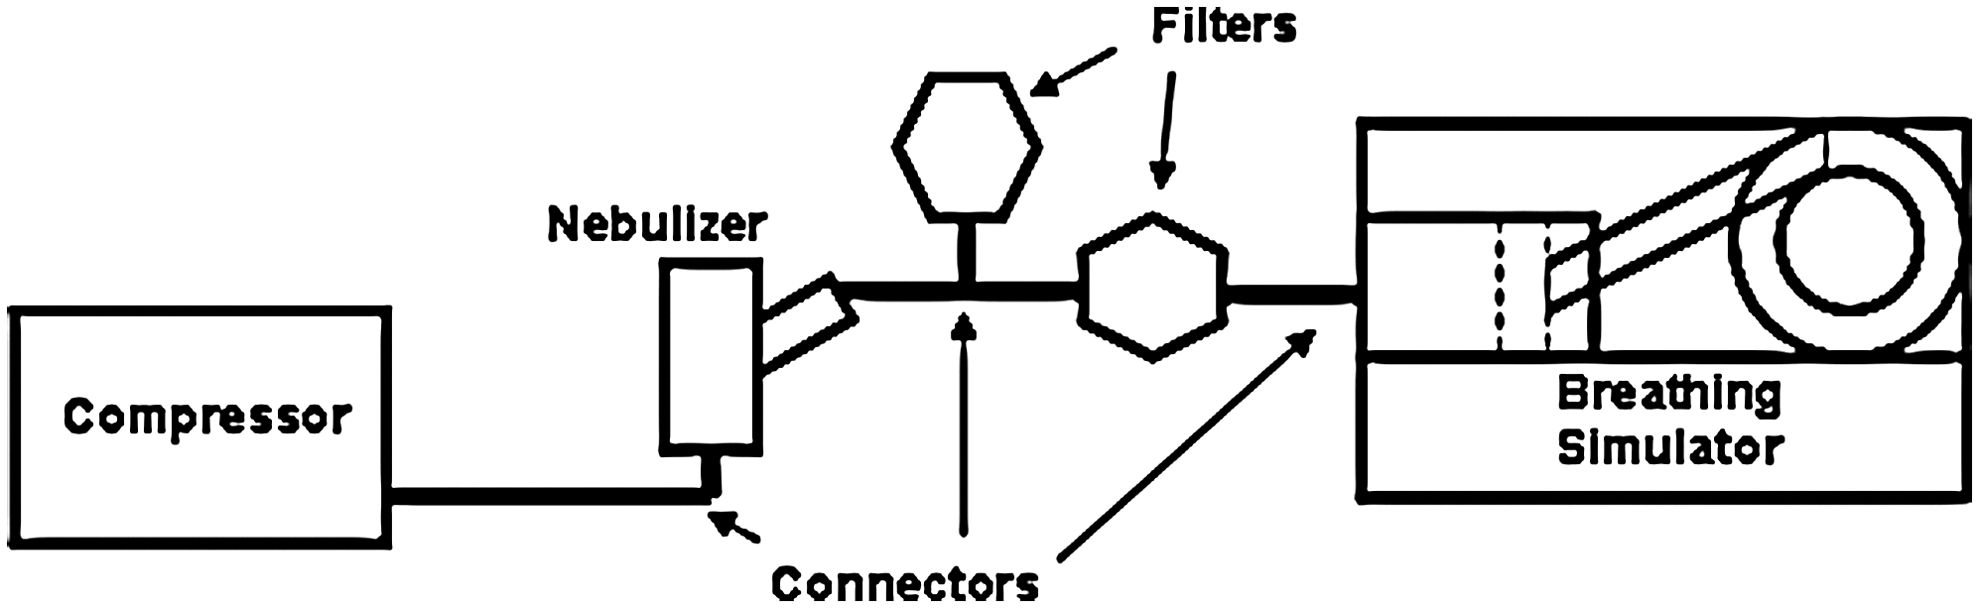
In vitro dynamic conditions setup.
After each 4-min run was performed, aerosol generated was trapped on the inspiratory filter, expiratory filter, and connector. The total drug output was determined to be the amount of drug left in the nebulizer plus the amount eluted and quantified from the filters and connections using UV spectroscopy at an absorbance wavelength of 228 nm. The data provided information about the total device output and inhaled mass. Accuracy was ensured by agreement of the amount captured plus that remaining in the nebulizer compared with the initial total amount in the nebulizer.
Particle size measurements—Particle size measurements were made using laser diffraction (LD) (Mastersizer X; Malvern Instruments, Ltd., Malvern, Worcestershire, UK) that operates according to the Lorenz-Mie Theory. Details and validation of this technique have been previously published.(16,17) The nebulizer was situated so that the generated aerosol perpendicularly intersected the laser beam of the LD system. In addition, the nebulizer mouthpiece was placed perpendicular to the laser beam(16) (∼20 mm from the laser and 24 mm from the sensor lens) to ensure that no vignetting(18) or aerosol deposition on the sensor occurred. Furthermore, care was taken to ensure that sufficient aerosol passed through the laser to achieve an obscuration factor of >0.05 at all flows, necessary for meaningful measurements with this technique.(16,17) Measurements were made after 2 min of nebulization, allowing nebulizing conditions to stabilize.
In vivo model
Pulmonary drug deposition (PDD) mathematical model
The estimation of PDD required enhancing the mathematical model by incorporating several factors [the respirable fraction (RF), patient's anatomic dead space, and plateau effect], which are described in detail below.
RF
The definition of the RF, as the ratio of mass of aerosol carried in particles of ≤5 μm diameter to the total mass of aerosol carried in particles of all sizes, has been shown to agree with in vivo measurements with this type of breath-enhanced nebulizer.(2,19) As the RF varies with respect to the entrained flow (V′ent) through the device, therefore, the RF was expressed as a function of V′ent. The equation for respirable output for a given entrained flow is:
An example of an RF characterization curve is shown in Figure 2.
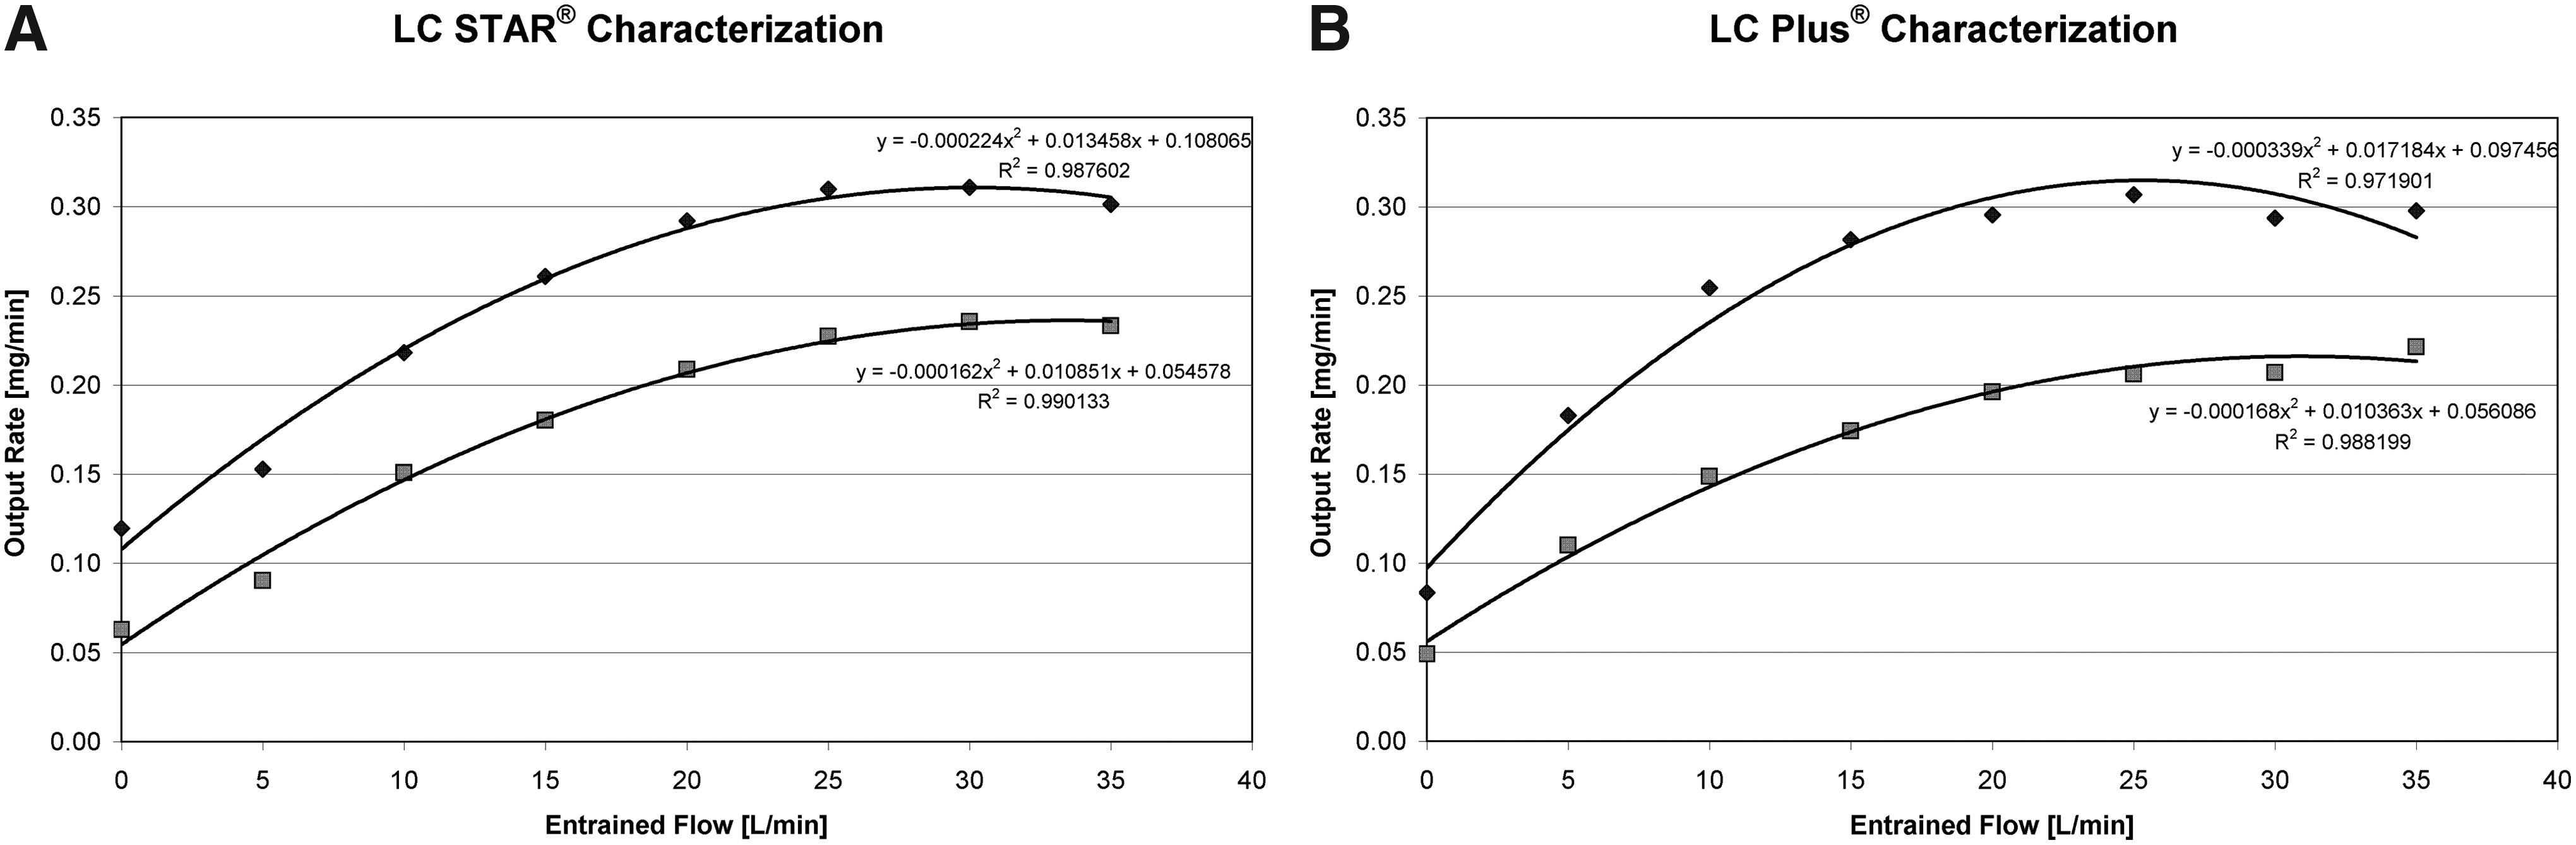
In vitro characterization curves for total inhaled mass (top line) and respirable fraction (bottom line) for the breath-enhanced nebulizers
Anatomic dead space
A normal person's dead space can be approximated as 2.2 mL of volume per kilogram of weight.(20) It is anticipated that aerosol inhaled near the end of inspiration will remain in the dead space and be exhaled with the start of expiration. Calculating the amount of aerosol remaining in the patient's dead space at end inspiration requires the time during the inspiratory phase when the dead space volume is being filled at the end of inspiration, and the rate of respirable aerosol output. The mathematical derivation is shown below:
After solving for time, the mass of aerosol in the dead space can be calculated and subtracted from the predicted amount.
Plateau effect
Initially, the nebulizer's output almost follows a linear relationship with entrained flow. At increasing flows, there is increased inertial impaction of increasingly smaller droplets on the baffles, and this process can be modeled using a quadratic equation (as previously described), until the output has reached maximum at a given entrained flow. For even greater entrained flows, the output drops off slowly and is better approximated by a mathematical function that asymptotes to a plateau.
Results
In vitro results
Steady-state performance
Figure 2 shows the relationship between O'tot and V′ent for the nebulizers, PARI LC STAR and PARI LC PLUS. The averaged characterization parameters of the quadratic fits used to model the device output rate are shown in Table 1. The quadratic fits had a high correlation (r>0.95) for steady-state performance data. In Table 2, the small coefficients of variation are indicative of performance consistency within breath-enhanced nebulizers of the same type.
Presented in the table are the coefficients of the quadratic equations (y=a+bx−cx2) for the rate of output and the square of the regression coefficient (r2), where x is the entrained flow through the devices and n is the number of devices characterized. The high correlation coefficients indicate how well the device performance can be described mathematically.
Dynamic conditions
The groups of PARI LC STAR and PARI LC PLUS nebulizers were each tested under dynamic in vitro conditions that had varying tidal volumes, Ti/TTot, and respiration rates. The standard breathing pattern had a tidal volume of 0.6 L, Ti/TTot of 0.4, and respiration rate of 15 breaths per minute (BPM). This pattern corresponds to a mean inspiratory flow (tidal volume divided by inspiratory time) of 22.5 L.min–1 or an entrained flow of approximately 17 L.min–1, which is well within the range of entrained flow evaluated during the steady-state measurements. The above parameters were varied independently to observe how the model accommodated varying breathing patterns. Tidal volume was varied by 0.2-L increments from 0.2 to 0.6 L. The ratio of inspiratory time to expiratory time (Ti/TTot) was tested at 0.4 and 0.5. Two different respiration rates were chosen (15 BPM and 30 BPM) to observe how the increased respiration rates affect the maximum flows into the device and the subsequent drug output to the patient.
Table 3 lists the Bland and Altman(21) difference ranges and 95% limits of agreement between the dynamic in vitro inhaled mass and the model's predicted inhaled mass using device-specific coefficients for both nebulizers, the PARI LC STAR and PARI LC PLUS. All values show tight 95% confidence intervals that included zero and biases that are close to zero, with the exception of the nebulizer PARI LC STAR experiments with varying Ti/TTot. Overall, the Bland and Altman plots (in Fig. 3) and values demonstrate the strong agreement between the model and in vitro data.

Strong agreement between the mathematical model and the inhaled mass collected using in vitro methods for the breath-enhanced nebulizer
Presented in this table are the Bland and Altman limits of agreement plot parameters between the drug collected on the inspiratory filter from in vitro experiments for the breath-enhanced LC STAR and LC PLUS for various parameters and the model's predicted output using the device-drug specific characterization coefficients.
In vivo results
The in vivo data were collected from four “normal” subjects and 12 CF patients using gamma scintigraphy studies described in detail previously.(3,19) The average breathing patterns were measured using a pneumotachograph attached to a nebulizer in a separate trial.(5) Inspiration was accurately modeled with a sinusoidal pattern based on the tidal volume and inspiratory time. The model was a bit less accurate for expiration, but this was not important because expiration plays no role in PDD. Physical characteristics of these subjects are listed in Table 4. The estimated dead space for all subjects was calculated based on the approximation of 2.2 mL/kg of body mass.(20) It is recognized that this may be an underestimation for those patients with extensive bronchiectasis due to CF.(22)
The in vivo data for the four normal subjects was collected using the nebulizers PARI LC STAR and PARI LC PLUS. The drug used in the nebulizer PARI LC STAR studies was physiologically normal saline (AddiPak; Hudson RCI, Durham, NC), with a concentration of 9 mg.mL–1, whereas for the nebulizer PARI LC PLUS studies the drug was tobramycin (60 mg.mL–1).(5) Figure 4 shows the agreement between the model and in vivo data for inhaled mass and PDD, respectively. Values varied around zero without an obvious trend, and this is evident in the data presented in Figure 3, based on either inhaled mass or PDD. This suggests that the model is able to predict the inhaled mass and PDD.
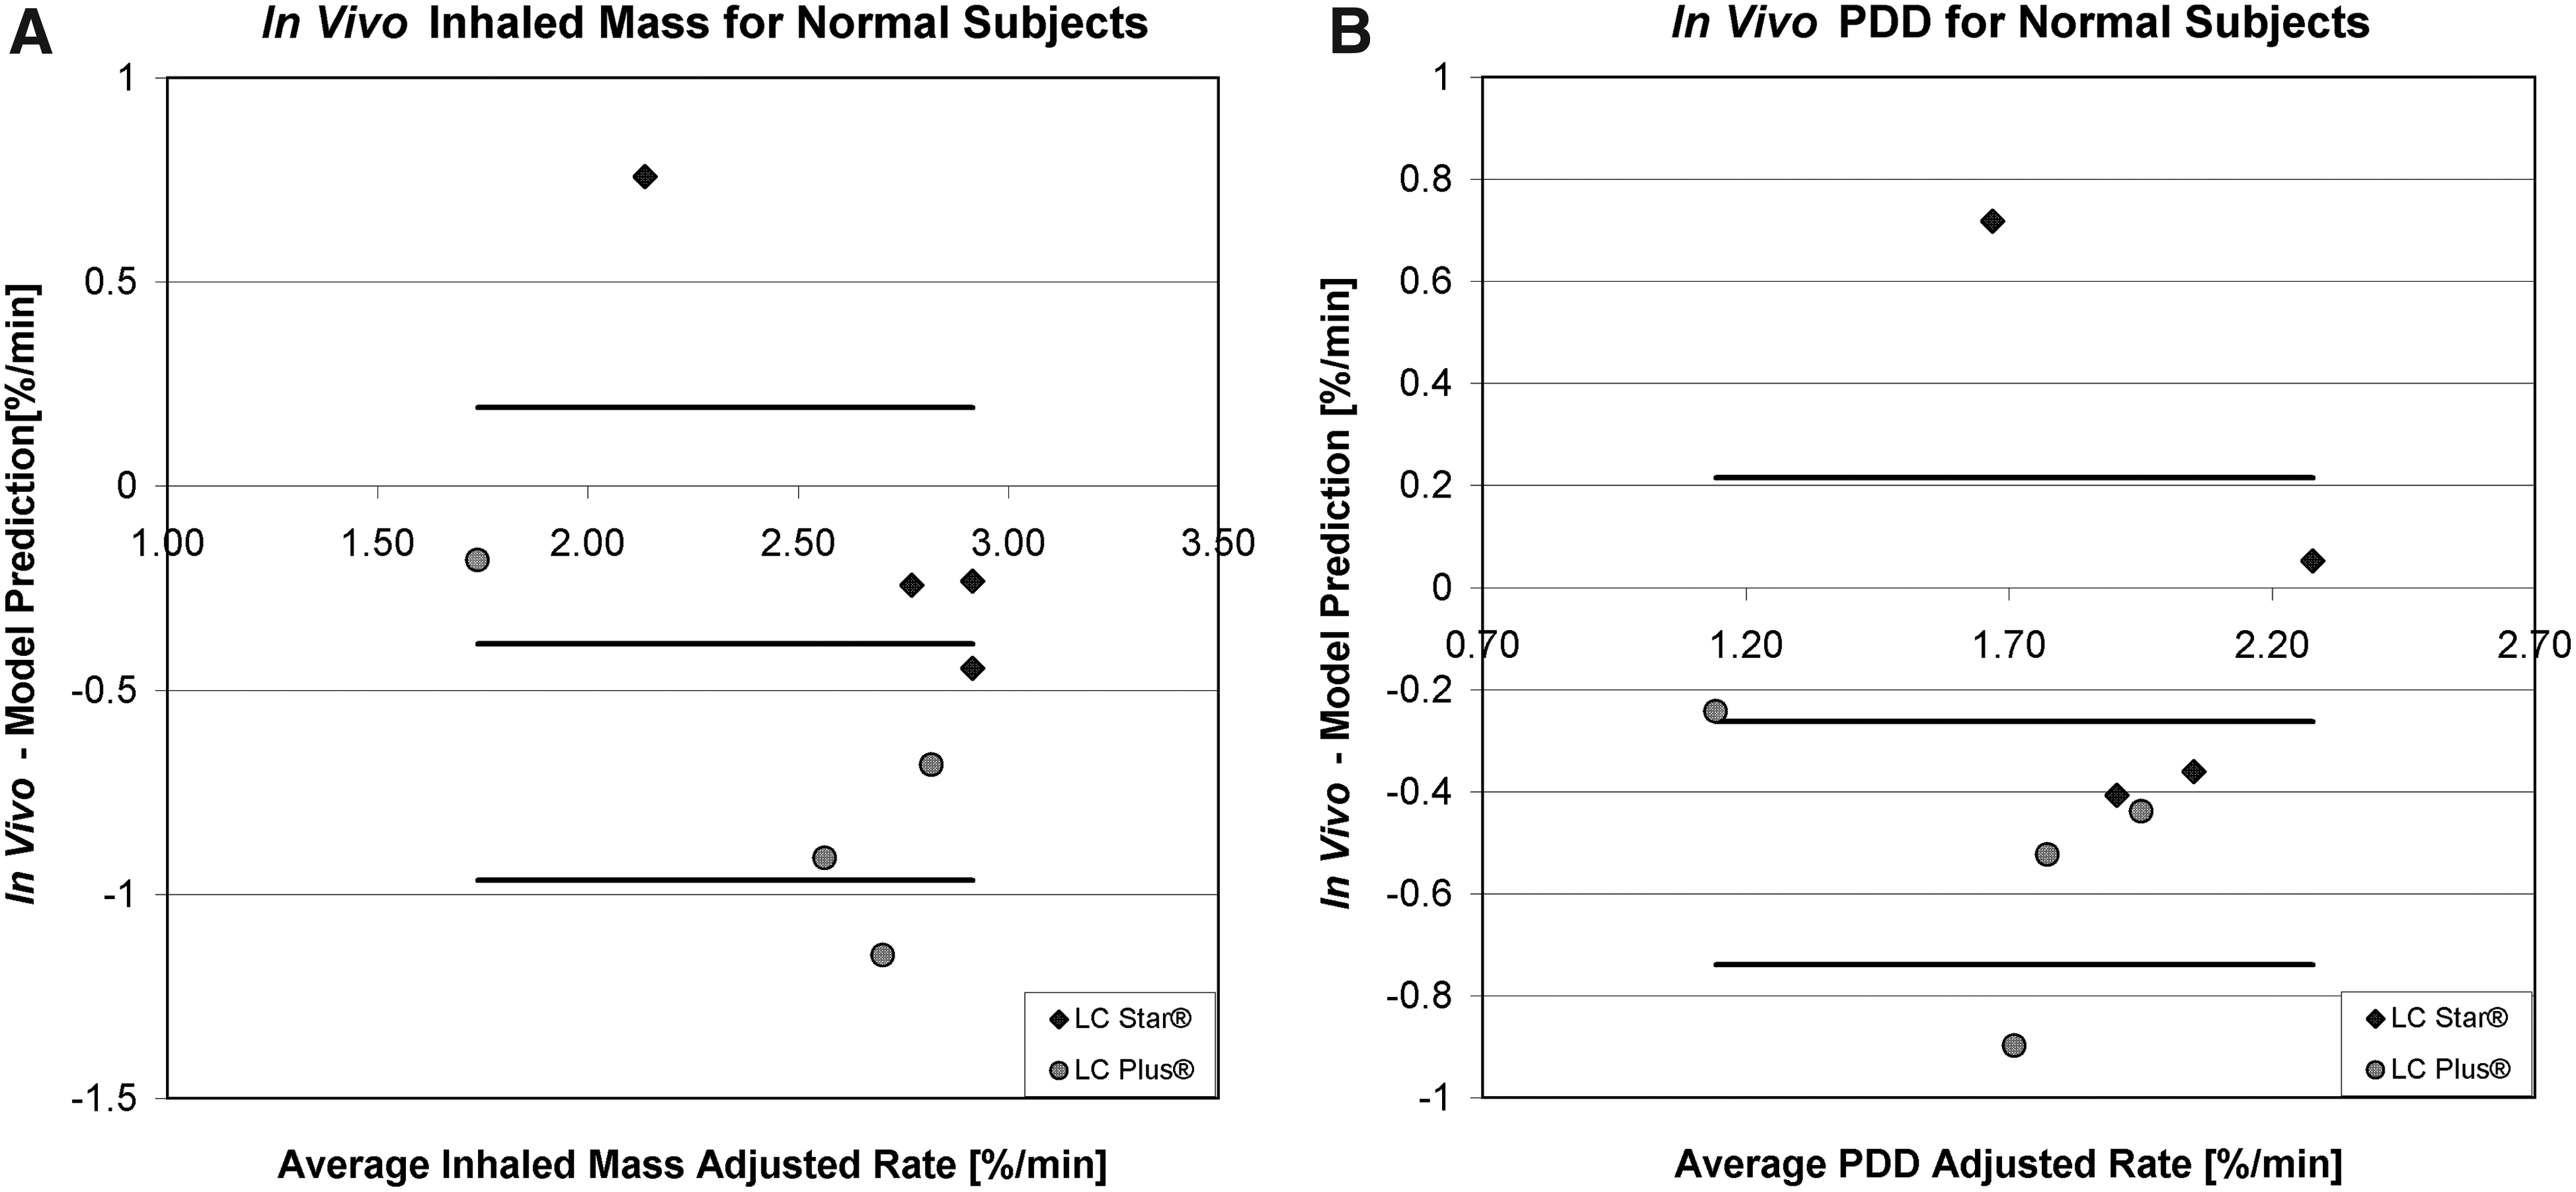
Bland and Altman limits of agreement plot of the difference for normal subjects using the LC STAR and LC PLUS between
The in vivo data for the 12 CF patients(23) were collected using only the nebulizer PARI LC PLUS with the drug tobramycin (60 mg.mL–1). In these studies, each subject was given a new nebulizer PARI LC PLUS. Using the CF patient's breathing pattern, the model was tested to estimate the inhaled mass and PDD. The Bland and Altman agreement plots in Figure 5 show that there is poor agreement between the model and in vivo data. This is demonstrated by the negative biases from the model's overprediction of inhaled mass and PDD, negative 95% confidence intervals, and distribution of data points that form a box.
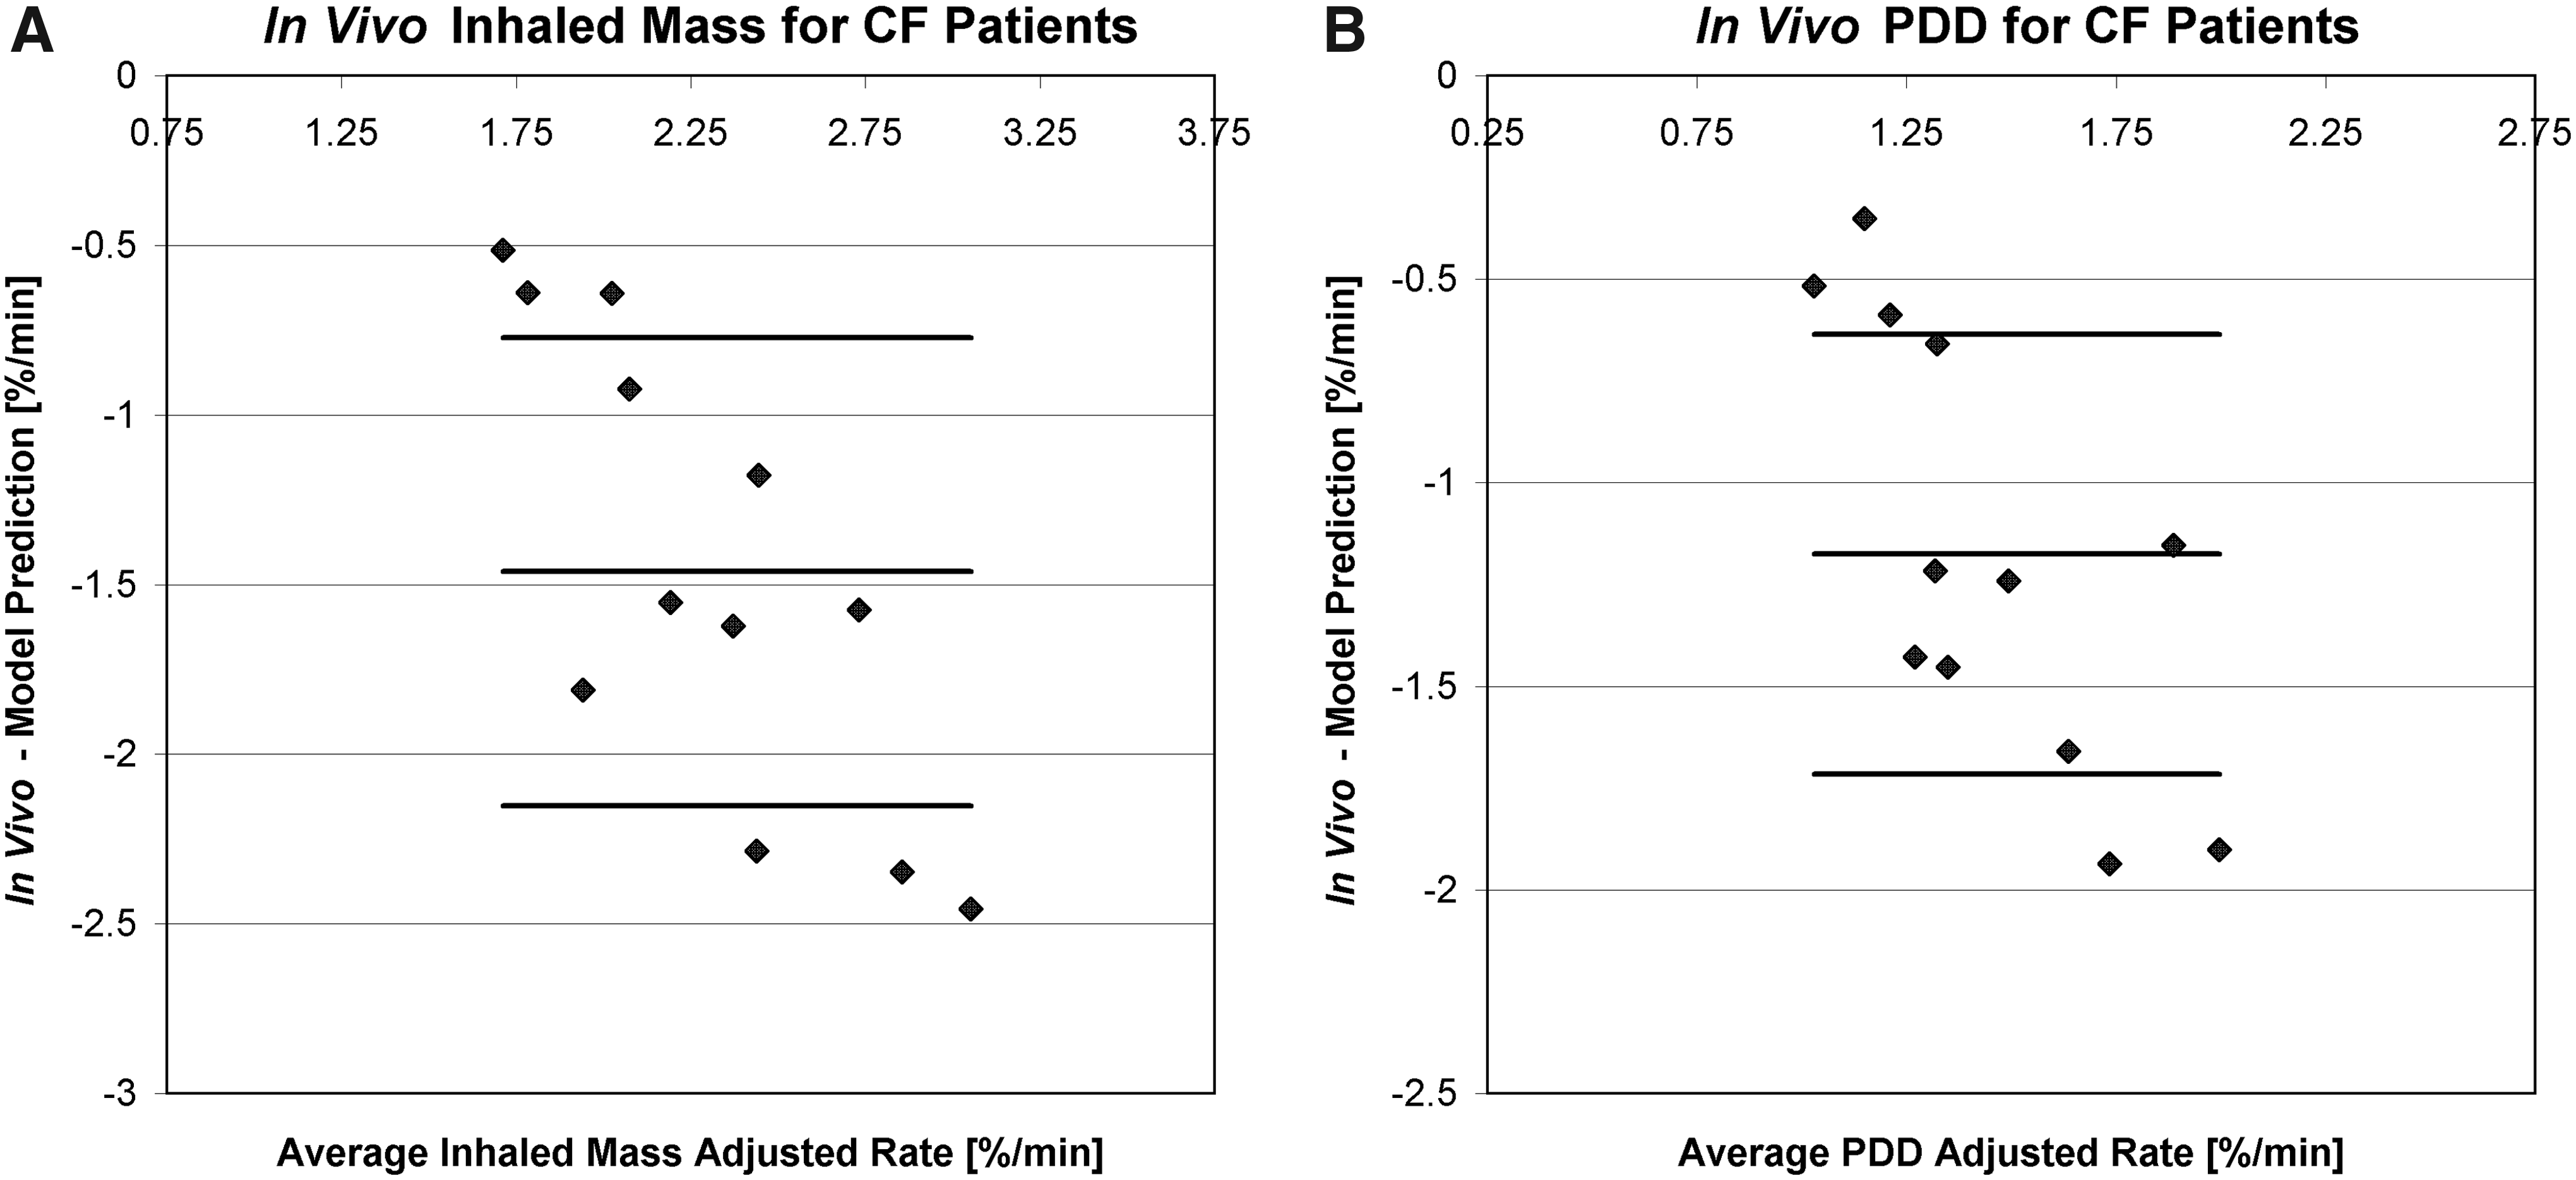
Bland and Altman limits of agreement plot of the difference for CF patients using the LC PLUS between
Practical examples
The mathematical model was used to explore the relationship between the inhaled mass and various respiratory parameters. Figure 6 shows the effect of changing individual respiration parameters on the model's predicted inhaled mass (i.e., changing tidal volume while keeping BPM and Ti/Ttot the same). Similarly, this can be applied to the PDD.
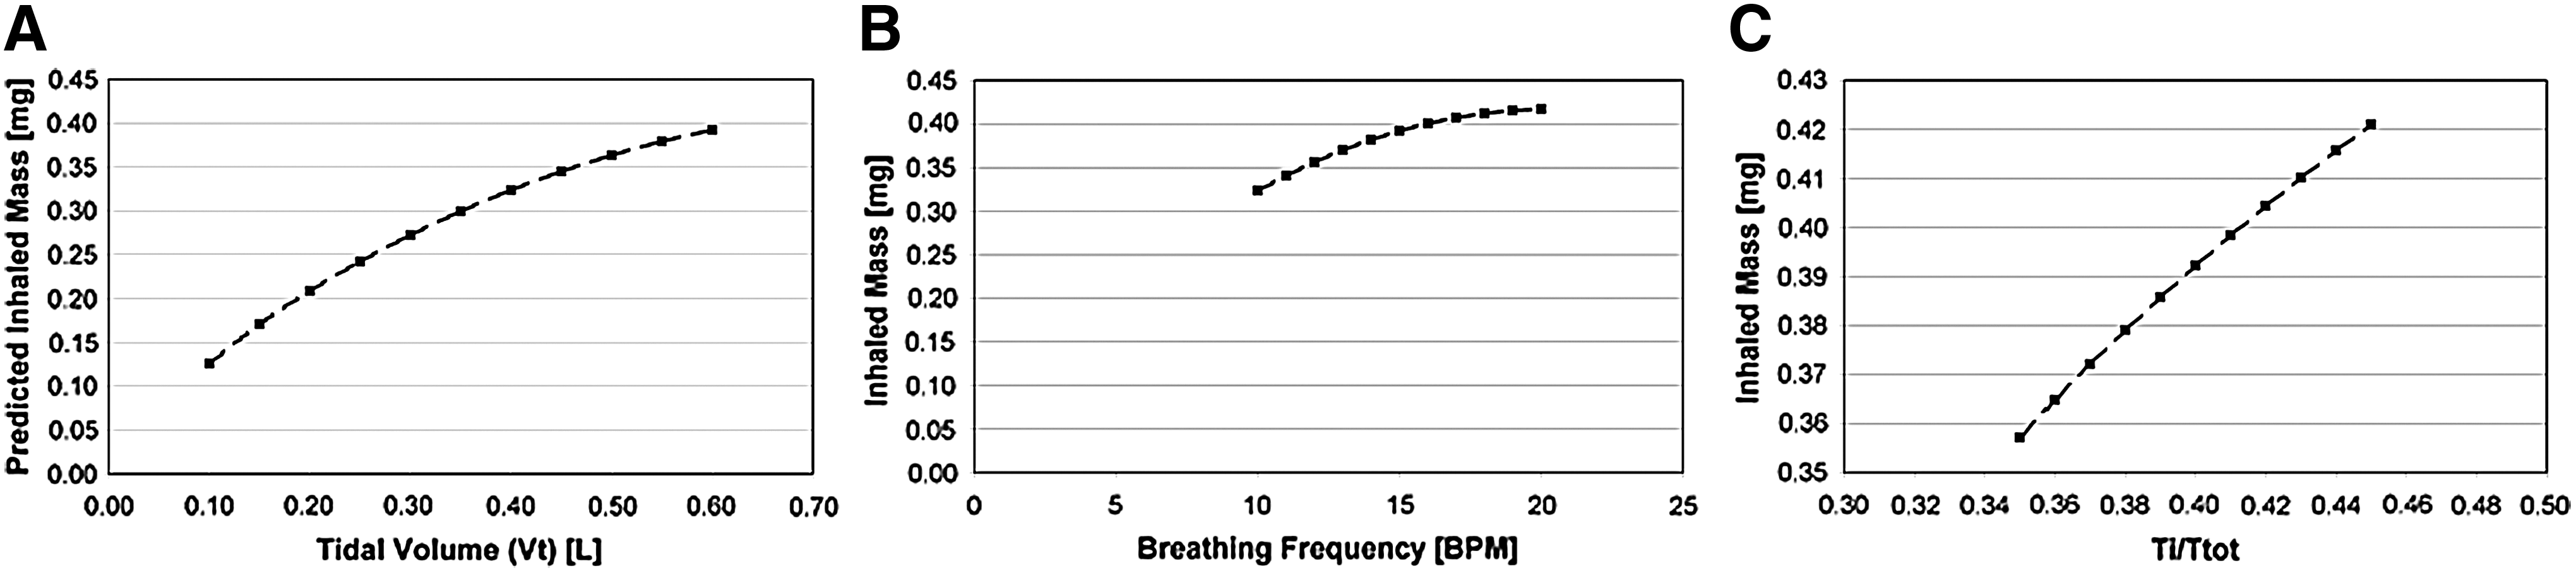
Mathematical model's predicted inhaled mass for a 4-min run using LC STAR with varying
Discussion
The goal of the study was to determine the feasibility of developing mathematical models in predicting the in vitro and in vivo performance of two types of breath-enhanced nebulizers (PARI LC STAR and PARI LC PLUS) when used in the treatment of CF. It is recognized that there are other mathematical algorithms that predict aerosol behavior(24) and nebulizer performance.(2,3,7,14,25,26) However, a mathematical model that integrated the performance of a nebulizer with the patient's breathing pattern as well as the effect of the anatomical dead space, while accounting for some of the current methodological limitations of previous mathematical algorithms, would be beneficial. One such example is the mathematical model developed by Finlay et al.,(27) which they compared with SPECT deposition studies in normal subjects and found reasonable agreement. However, one limitation of their model was that it was based on assumed patient breathing patterns, as opposed to incorporating the individualized breathing pattern into the model. A second limitation was that the purpose of their model was to assess hygroscopic growth of particles, and the interest was more a comparison of predicted peripheral-to-central deposition rather than the total amount of deposition to the lungs.
In general, device output prediction from the model was in good agreement with the in vitro performance of both device types and in vivo data for normal subjects. For example, in another deposition study,(19) with eight normal adults using the PARI LC PLUS and 4-mL fill volume of an aqueous solution of tobramycin, the mean rate of total body deposition was 2.6% of the charge per minute, which is located centrally in the range of predicted values from the present study, shown in Figure 4A, further supporting the accuracy of the model. One set of published deposition data for the PARI LC STAR was used as the comparator in this study,(23) and further comparison would not be appropriate. The other published deposition data for this device(28) have some significant problems with accuracy that have been identified,(23) so it is not possible to find independent data for comparison in normal subjects. However, in patients with CF, the model tended to overpredict the PDD. The data used to justify the model were from Coates et al., and these are the only published deposition data for the PARI LC PLUS.(23)
Possible explanations for the discrepancy are that the model currently uses three generalized approximations for all subjects: RF, dead-space approximation, and an idealized breathing pattern modeled as two half sine waves. First, the RF based on the ≤5-μm diameter cutoff will vary across subjects and may decrease for younger subjects or those having obstructed airways, characteristic of CF.(29) Having said this, the in vivo RF that was defined as the pulmonary deposition divided by the total body deposition during the radionuclear deposition studies was very similar to the in vitro RF using the definition used in this study.(23) Secondly, the dead space approximation of 2.2 mL/kg of body mass may not be valid for CF patients because of the presence of bronchiectasis, which is very much a part of the disease, increases the patient's anatomical dead space, and would result in greater amounts of aerosol being exhaled than predicted by the model. This hypothesis is supported by previous studies with CF patients,(5) in which it was found that for the same device the ratio of expiratory filter drug deposition to PDD for CF patients was higher than that of the normal subjects.
There are also some technical limitations of the study. First, this study evaluated the model using two nebulizer designs that were similar in function. Although we believe the model is applicable to other jet nebulizer designs, further testing of the model with other nebulizers is required. The in vitro experiments were restricted by the maximum tidal volume of the breathing simulator, which is 0.6 L. For pediatric patients who have smaller tidal volumes, this limitation does not pose a problem. However, for larger patients, who may have VT>0.6 L, there is still a lack of in vitro data to test the model. Furthermore, we restricted the definition of RF to a single value, which may be an oversimplification,(30,31) but to do otherwise would have greatly increased the complexity of the mathematics and likely was unnecessary given the agreement with the model's prediction for normal subjects. Although this was clearly inadequate for the patients with bronchiectasis, there are few in vivo data to develop a patient-specific definition of RF.
Conclusions
A mathematical model was developed to predict the inhaled mass and PDD and to provide another method for evaluating laboratory data for jet nebulizers in the context of likely clinical performance. In addition, these models were successfully derived to accommodate a wide range of patient breathing patterns and device-drug combinations. The model has achieved the goal of the study by showing strong agreement with the in vitro nebulizer performance across varying breathing parameters. Moreover, the model has demonstrated its effectiveness in predicting the amount of aerosol delivered to “normal” subjects, whose modeling parameters can be derived. However, the model is less accurate when applied to in vivo data of subjects with the presence of disease, in part, because these subjects may not have patterns of breathing that have been used in the model for normal subjects, and because anatomical variations due to disease may lead to inaccuracies in assumptions made with RF. This would suggest that physical models routinely used in laboratories to predict device performance may not be as accurate when predicting drug deposition in the presence of disease.
The next step of this study is to develop further the model to include other nebulizer designs involving air entrainment (e.g., breath-actuated devices), incorporate additional nebulizer parameters (e.g., aerosol-concentrating effects), and add more robust anatomical models that can account for anatomical variations due to disease, like the dead-space volume and RF.
Glossary
Footnotes
Acknowledgments
This work was supported by The Natural Sciences and Engineering Research Council of Canada (NSERC) through the NSERC-CGS scholarship awarded to Wallace Wee.
Author Disclosure Statement
The authors have no conflicts of interest in the research presented in this article.