
Abstract
Abstract
Background:
Previous studies have characterized the size increase of combination submicrometer particles composed of a drug and hygroscopic excipient when exposed to typical airway thermodynamic conditions. The objective of this study was to determine the deposition and size increase characteristics of excipient enhanced growth (EEG) aerosols throughout the tracheobronchial (TB) airways and to evaluate the potential for targeted delivery.
Methods:
Submicrometer particles composed of a poorly water-soluble drug (insulin) and hygroscopic excipient (sodium chloride) were considered at drug:excipient mass ratios of 50:50 and 25:75. A previously validated computational fluid dynamics model was used to predict aerosol size increase and deposition in characteristic geometries of the mouth–throat (MT), upper TB airways through the third bifurcation (B3), and remaining TB airways through B15. Additional validation experiments were also performed for albuterol sulfate:mannitol particles. Both growth of combination particles and deposition are reported throughout the conducting airways for characteristic slow and deep (SD) and quick and deep (QD) inhalations.
Results:
For all EEG cases considered, MT deposition was less than 1% of the drug dose, which is at least one order of magnitude lower than with state-of-the-art and conventional inhalers. Final aerosol sizes exiting the TB region and entering the alveolar airways were all greater than 3 μm. For SD inhalation, deposition fractions of 20% were achieved in the lower TB region of B8–B15, which is a factor of 20–30×higher than conventional delivery devices. With QD inhalation, maximum alveolar delivery of 90% was observed.
Conclusions:
Increasing the dose delivered to the lower TB region by a factor of 20–30×or achieving 90% delivery to the alveolar airways was considered effective aerosol targeting compared with conventional devices. The trend of higher flow rates resulting in better alveolar delivery of aerosols is unique to EEG and may be used to design highly efficient dry powder inhalers.
Introduction
Advances in inhaler technology that have improved lung delivery include the conversion of MDIs to hydrofluoroalkane (HFA) propellants, which resulted in slower plume velocities(12) and reduced MT deposition.(9,13) For example, the HFA MDI QVAR® (3M, St. Paul, MN) is reported to result in 26% MT deposition based on in vitro experiments in a replica model(14) and 29% MT deposition from in vivo data.(9) The Respimat® Soft Mist™ inhaler (Boehringer Ingelheim, Ingelheim, Germany) increases spray delivery time to 1.5 sec and further reduces plume velocity compared with MDIs.(15) The resulting mean MT depositional loss for the Respimat inhaler ranges from 37%(16) to 19%(17) based on in vivo experiments. Coupling hand-held mesh nebulizers with both breath-controlled technology and on-demand aerosol generation has also improved the lung delivery of inhaled medications. Nikander et al.(18) reported that by guiding a patient through either tidal or controlled inhalation at a rate of 20 L/min for 9 sec and generating the aerosol over a portion of this inhalation time, mean lung delivery of the nebulized aerosol was increased to a range of 63–73%, depending on the breathing pattern. Zeman et al.(19) implemented large (∼10 μm) particle aerosols at a controlled low flow inhalation rate of 4.8 L/min over 10 sec and achieved mean MT deposition as low as 26% with mean conducting airway delivery of 35%. Based on testing with in vitro replica models, capillary aerosol generation with aqueous formulations demonstrated MT deposition in the range of 18–24% depending on the aerosol generation time period.(20) Considering large porous particles (PulmoSphere™) coupled with a specially designed inhaler, the recent in vivo study of Geller et al.(21) reported mean lung dose of 34% with an MT depositional loss of approximately 44%. Thermal vaporization technology with the Staccato® device (Alexza, Mountain View, CA) was shown to produce MT depositional losses in a replica model of approximately 11% across a range of inhalation flow rates.(22) However, decreases in particle size down to approximately 1 μm as the inhalation flow rate is increased may result in part of the aerosol being exhaled.(23) Overall, it is observed that these next-generation inhaler technologies rely on a fixed particle size distribution that is not designed to change after the aerosol leaves the inhaler. For these fixed particle or droplet size technologies, the typical MT depositional loss appears to be approximately 30%, which limits maximum lung delivery to approximately 70% of the dose.
A method to overcome the limitations of fixed particle size distributions and improve the lung delivery of inhaled medications was recently proposed based on controlled condensation growth.(24–27) In this approach, initially submicrometer pharmaceutical aerosols are inhaled either orally or nasally. Due to the small particle size, extrathoracic deposition is expected to be negligible.(28–30) Aerosol size increase within the airways to ensure deposition is then fostered by either inhaling the aerosol with a stream of warm air saturated with water vapor, i.e., enhanced condensational growth (ECG), or inhaling combination particles composed of a drug and hygroscopic excipient, i.e., excipient enhanced growth (EEG). Considering EEG, the natural relative humidity (RH) in the airways, which is typically considered to be 99.5–100%, interacts with the hygroscopic excipient causing condensational growth and significant size increase. Longest and Hindle(27) developed correlations based on an experimentally validated lung model to predict the size increase of initially submicrometer combination drug and hygroscopic excipient particles in the airways and demonstrated diameter growth ratios of up to 4.6 at excipient mass loadings of 50% and below. Hindle and Longest(24) implemented in vitro experiments in a tubular geometry and demonstrated that it was possible to control the size growth ratio of droplets by altering the hygroscopic excipient, drug:excipient ratio, and drug. Longest and Hindle(31) implemented the same tubular geometry and developed a validated computational fluid dynamics (CFD) model of combination aerosol size increase in comparison with in vitro data. The CFD model results revealed gradual size increase of the combination particles over the time scale of an inhalation cycle and aerosol growth from submicrometer to conventional pharmaceutical aerosol size that is expected to deposit in the lower tracheobronchial (TB) and alveolar airways by impaction and sedimentation.
The performance of submicrometer combination EEG aerosol particles generated with a Respimat inhaler was recently considered in a characteristic model of the airways.(32) The geometry consisted of a characteristic MT and upper TB region through the third bifurcation (B3) and was enclosed in a chamber used to simulate the thermodynamic conditions of the lungs. Combination particles contained a drug [albuterol sulfate (AS)] and hygroscopic excipient [mannitol (MN), citric acid (CA), or sodium chloride (NaCl)] at a mass ratio of 50:50. Both in vitro results and CFD simulations were in close agreement and indicated that EEG delivery reduced MT deposition to approximately 1% and below for pharmaceutical aerosols. Based on CFD simulations with initial 900-nm combination particles, droplet sizes exiting the chamber geometry were approximately 3 μm and above. As with previous studies, the type of hygroscopic excipient as well as the inhalation waveform were found to influence the rate of aerosol size increase.
As reviewed, previous studies have characterized the size increase of combination EEG particles exposed to typical airway humidity conditions and demonstrated very low MT depositional losses with EEG delivery. However, growth and deposition of combination particles composed of a drug and hygroscopic excipient throughout the TB airways have not been considered. Size increase of respiratory aerosols adds an additional degree of complexity to dosing predictions, which can effectively be addressed with CFD simulations. Tian et al.(33) previously showed that with ECG delivery, near full lung retention of the aerosol could be achieved. However, local TB deposition and the potential for full lung retention of the aerosol need to be assessed for EEG delivery with submicrometer combination particles considering different inhalation waveforms. Previous studies indicated that both the excipient type and inhalation flow rate can be used to control the rate of droplet growth. However, it is currently not clear if these variables can be used to effectively control deposition in the airways and potentially target the region of deposition.
The objective of this study is to determine the deposition characteristics of combination drug and hygroscopic excipient particles throughout the TB airways and to evaluate the potential for targeted delivery. Submicrometer particles composed of a poorly water-soluble drug (insulin) and hygroscopic excipient (NaCl) are considered at drug:excipient mass ratios of 50:50 and 25:75. A previously validated CFD model is used to predict aerosol size increase and deposition in a characteristic model of the MT, upper TB airways through B3, and remaining TB airways through B15. A new validation of model predictions is also performed in comparison with in vitro data on growth and deposition for a characteristic airway geometry. Both growth of combination particles and localized deposition are reported throughout the conducting airways for characteristic adult inhalation profiles. Regional deposition is considered as a function of inhalation waveform and particle drug loading for the submicrometer EEG aerosol and compared with predictions for a conventional-sized aerosol (∼5 μm) generated using Respimat with an aqueous formulation in order to determine improved lung delivery and assess the potential for targeted deposition both to and within the TB airways.
Materials and Methods
MT-TB-SIP geometry
A physical model of the conducting airway geometry was considered, as shown in Figure 1. The geometry consists of the MT region, an asymmetrical model of the upper TB airways extending from the trachea to the third respiratory bifurcation (B3), and a stochastic individual path (SIP) model of the medium and small TB airways extending to the terminal bronchioles (B15). The trachea and the initial part of the main bronchi constitute bifurcation B1. The MT geometry includes the oral cavity, pharynx, and larynx. This MT model was originally developed by Xi and Longest(34) based on a cast of the oral cavity(35) combined with computed tomography (CT) images of the pharyngeal and laryngeal regions. The geometry was then simplified using elliptical cross sections, which maintained the flow area and hydraulic diameter of the original model. In the current study, the inlet flow enters the MT geometry through the aerosol inlet (Fig. 1), which is centrally located on the front of the mouth and has a diameter of 11 mm. The space between the aerosol inlet and surrounding MT walls was closed to flow.
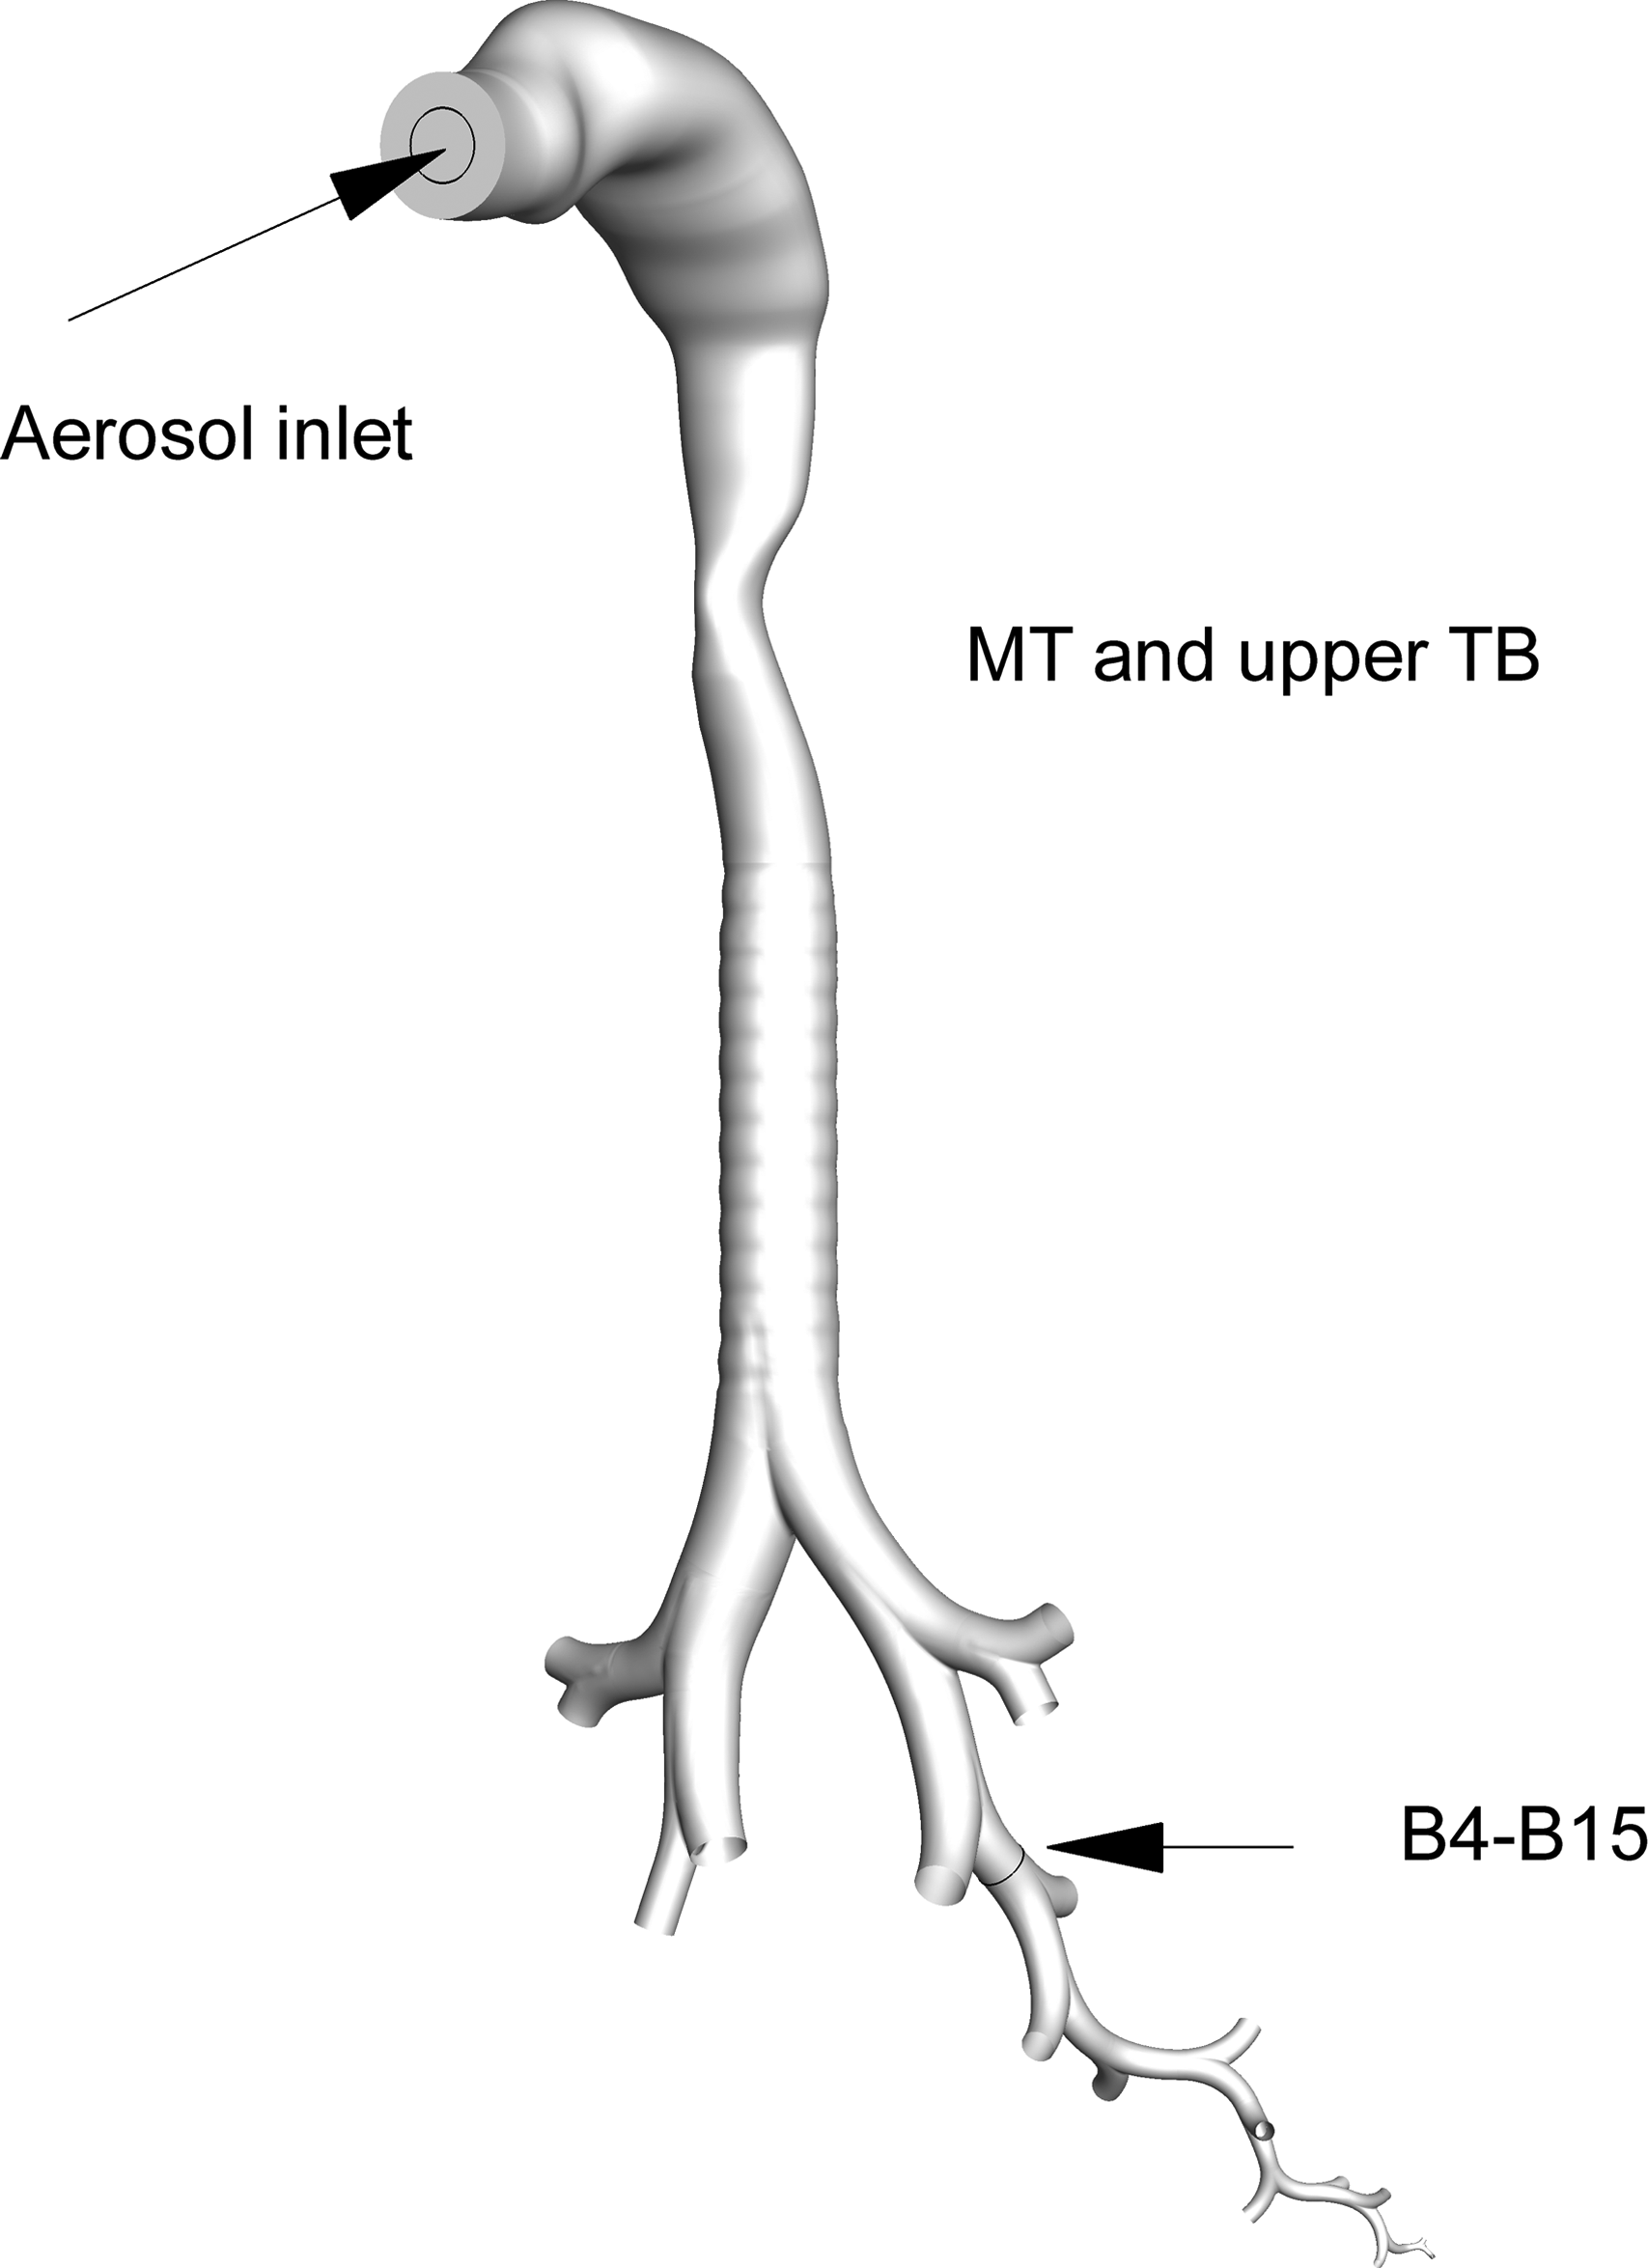
Surface geometry of the conducting airway model including the mouth–throat (MT) and tracheobronchial (TB) airways through the terminal bronchioles. The asymmetrical TB model was complete through the third bifurcation (B3; approximately the lobar bronchi) and then continued with one stochastic individual path (SIP) geometry entering the left lower lobe and ending with B15.
The upper TB airway model considered extends from the trachea to B3. This asymmetrical model was generated using the anatomical cast dimensions reported by Yeh and Schum(36) and scaled to a lung volume of 3.5 L, which is consistent with an adult male during inhalation.(37) The individual bifurcation units were based on the physiologically realistic bifurcation (PRB) parameters reported by Heistracher and Hofmann.(38) Surface properties of the bifurcations, such as carinal ridges and curvature radii of branches, were based on the measurement reported by Horsfield et al.(39) and Hammersley and Olson.(40) For each bifurcation in the upper TB model, parameters such as branch diameter, length, bifurcation angle, and gravity angle were taken from the scaled Yeh and Schum(36) data. It is noted that the Yeh and Schum(36) dataset includes dimensions for each of the five lung lobes. Based on these data, the upper TB model is asymmetrical and includes out-of-plane rotations of individual bifurcations. The asymmetrical model is considered to be sufficiently accurate to characterize aerosol growth and deposition in the upper airways, which was previously verified with comparisons with TB deposition data from anatomical casts.(33) Cartilaginous rings were included in the trachea of the TB model, and a D-shaped tracheal cross section was implemented. The cadaver measurements of Russo et al.(41) were used to include the effects of the cartilaginous rings on the tracheal geometry.
Beyond B3, a SIP model was considered extending to the end of the TB region (B15; terminal bronchioles) of the left lower lung lobe.(10,42) Bifurcations within the model were based on PRB units with the scaled airway dimensions reported by Yeh and Schum.(36) Use of the SIP model based on PRB units allows for the application of a hexahedral mesh, which improves solution accuracy, and an adequate number of computational cells to fully resolve the flow domain.(43,44) Based on available data, the bifurcations in the individual path model section (B4–B15) were symmetric and included a symmetric outflow assumption at each bifurcation level. At each bifurcation, continuation of the left or right branch was selected at random. Consecutive branches were rotated at 90° to approximate physiological conditions.(45) This SIP model is not intended to exactly mimic a specific connection of bronchi as with a patient-specific model. Instead, it is intended to provide an effective three-dimensional representation of transport and deposition in the medium and small TB airways. B15 was assumed to end with the terminal bronchioles, based on the existing anatomical data.(36)
Previous studies of TB deposition using the SIP modeling approach have implemented one SIP geometry per lung lobe for a total of five SIPs extending beyond B3 of the upper TB model.(10) This approach is based on the finding of Tian et al.(42) that one SIP geometry is sufficient to characterize regional deposition within each lung lobe. Longest et al.(46) then showed that regional deposition in the left lower lobe of a healthy lung model was an approximate average value of all five lobes, which could be used to characterize total TB deposition. This approach resulted in considerable time savings for simulating TB deposition and is implemented in the current study for evaluating EEG. Therefore, the current study evaluates deposition characteristics in the left lower lobe of the lung on a regional basis and then multiplies these deposition fractions (DFs) by a factor of 5 to determine regional values throughout the lung.
Experimental overview
An in vitro experiment of aerosol growth under EEG conditions was performed for further CFD model validation using the methods previously described by Longest et al.(32) The initially submicrometer aerosol was generated using a Respimat Soft Mist Inhaler (Boehringer Ingelheim)(47) using a formulation containing 0.4% w/v drug (AS) and 0.4% w/v hygroscopic excipient (MN) in an 80:20 v/v ethanol:water vehicle. In this manner, dried aerosol particles from the formulation consist of approximately 50% drug and 50% hygroscopic excipient by mass. A 730-mL drying tube at the outlet of the Respimat was required to generate a consistent submicrometer aerosol. The initial size distribution of the aerosol was determined using a MOUDI (MSP Corp., Shoreview, MN) followed by HPLC analysis of AS on each impactor stage. During the experiments, room air was pulled through the Respimat inhaler and drying tube using a downstream vacuum pump at approximately 30 L/min with ambient conditions of 21°C and 40% RH. The inhaler was actuated while the 30 L/min airstream was being pulled through the system.
For the aerosol growth studies, a replica of the MT and upper TB model extending to B3 was fabricated using rapid prototyping. The model was identical to the MT-TB geometry through B3 shown in Figure 1, but did not include cartilaginous rings in the trachea. Aerosol was introduced into the model using the aerosol inlet of the dual flow mouthpiece, which has an exit diameter of approximately 11 mm and was previously described in the study of Hindle and Longest.(25) The geometry was fabricated on a Viper SLA machine (3D Systems, Valencia, CA) out of clear Accura 60 plastic resin using a build layer thickness of 0.15 mm and a laser spot diameter of 0.25 mm. At the mid-trachea level, the lower part of the geometry was enclosed in a cylindrical chamber, which serves to apply a constant outlet pressure boundary condition and routes the aerosol to an Andersen cascade impactor (ACI; Graseby-Anderson Inc., Smyrna, GA) for size determination. The dimensions of the chamber were determined using CFD to provide an average particle residence time of 2 sec between the model inlet and entrainment into the impactor at a flow rate of 30 L/min, which is consistent with a typical inhalation period. During the experiments, the walls of the MT-TB model and chamber were prewetted, and the entire geometry and ACI were maintained at 37°C and 99% RH by placing them in an environmental cabinet (Espec, Hudsonville, MI). The mouthpiece inlet was attached to the MT and was also prewetted in the experiments. The initially submicrometer aerosol was generated as described above, using a Respimat Soft Mist Inhaler(47) and AS:MN formulation with the inhaler drawing ambient room air through the setup at approximately 30 L/min during actuation. The size distribution of the aerosol was assessed at the outlet of the model after exposure to simulated respiratory airway conditions using the ACI followed by HPLC analysis of AS on each impactor stage.
Aerosol deposition on the MT-TB model surfaces was also determined using HPLC analysis. Water was used as the drug wash solvent. Wash volumes were 10 mL for the MT and TB regions, respectively, and 25 mL for the chamber. Impaction stages were washed with 10 mL of water. Five single-dose actuations were delivered from the Respimat into the MT-TB model. The nominal metered volume of formulation was 13.5 μL per actuation, which produced a mean measured emitted dose of 233 μg of AS following five actuations. DFs were expressed as a percentage of the mean measured emitted drug dose from the Respimat. Five replicate experiments were performed for both the initial size determination and the MT-TB aerosol growth study. For both experiments, drug recovery was greater than 80% of the nominal emitted dose.
CFD simulations
The low-Reynolds-number (LRN) κ-ω model of Wilcox(20,47) was selected for simulating flow in the airways, because it has been shown to provide an accurate and numerically efficient solution for laminar, transitional, and turbulent flows. Furthermore, this model in combination with appropriate particle simulations was found to accurately predict transport and deposition of both ambient(48–50) and pharmaceutical aerosols(10,20,47,48,51,52) in upper and mid-level airway geometries. The coupled governing equations of heat and mass transport were considered to evaluate the variable temperature and RH fields in the MT-TB-SIP model. These transport equations were previously reported in Longest and Xi(53) and Longest et al.(51) The Lagrangian transport equations interconnected with user-defined functions were used to calculate droplet trajectories, condensation, evaporation, deposition, near wall anisotropic turbulence corrections,(53) near wall particle interpolation,(53) and Brownian motion in the complex three-dimensional temperature and humidity fields. The discrete phase transport model includes the Kelvin effect, excipient and drug hygroscopicity, and the effect of droplet temperature on surface vapor pressure. In simulating aerosol growth, the effect of the droplets on the continuous phase was neglected, resulting in a one-way coupled approach. One-way coupled simulations are expected to be accurate in this study due to the presence of wetted walls.(31)
To solve the governing equations, the CFD package Fluent 12 (ANSYS Inc., Canonsburg, PA) coupled with user-defined functions was used. All transport equations were discretized to be at least second-order accurate in space. For the convective terms, a third-order QUICK scheme was used to interpolate values from cell centers to nodes. The diffusion terms were discretized using central differences. A segregated implicit solver was used to evaluate the resulting linear system of equations. This solver uses the Gauss-Seidel method in conjunction with an algebraic multigrid approach. The SIMPLEC (steady flow) and PISO (transient flow) algorithms were used to evaluate pressure–velocity coupling. The outer iteration procedure was stopped when the global mass residual had been reduced from its original value by five orders of magnitude and when the residual-reduction rates for both mass and momentum were sufficiently small. To ensure that a converged solution had been reached, residual and reduction rate factors were decreased by an order of magnitude and the results were compared. The stricter convergence criteria produced a negligible effect on both velocity and particle deposition fields. To improve accuracy, all calculations were performed in double precision. The entire computational mesh of the MT and TB region through B15 was composed of approximately 2×10⁶ hexahedral elements and a very fine near wall grid. Wall adjacent CV sizes in the MT and TB regions ranged from 0.02 to 0.8 mm. Grid-converged results based on negligible change in the maximum velocity and concentration values (<1%) as well as negligible differences in the total DFs (<3%) were established for a mesh consisting of 2×10⁶ control volumes. For the MT-TB model through B3 and chamber geometry, the composite mesh consisted of approximately 1.5×10⁶ control volumes with near wall grid heights of less than 0.8 mm in the MT geometry and less than 1.2 mm in the chamber. Some tetrahedral control volumes were required to resolve the complex chamber geometry, whereas the airway models were composed of entirely hexahedral cells. In order to produce convergent aerosol deposition results, 9×10⁴ initially 900-nm combination particles were injected at the aerosol inlet for each case considered. Mass median aerodynamic diameter (MMAD) values of the polydisperse aerosol after growth were calculated based on the midpoint diameters of the ACI at 30 L/min.(54) Doubling the number of droplets considered had a negligible impact on both total and sectional deposition results.
As an approximation of in vivo and in vitro boundary conditions, the numerical model assumed a wall temperature of 37°C and 100% RH starting at the mouth inlet. More accurate wall boundary conditions including gradients of temperature increase with distance from the mouth are available in the literature. However, these estimates are often dependent on the ambient temperature, RH, and breathing conditions. As a result, the use of constant wall temperature and RH was viewed as a controllable, reproducible, and appropriate condition for this study.
For all simulations, inhaled air was assumed to be at 21°C, 40% RH, with 1% turbulence intensity. In the simulations, this ambient air together with the submicrometer aerosol entered the MT model through a circular inlet diameter of 11 mm (Fig. 1) with a blunt inlet profile. Previously developed slow and deep (SD) and quick and deep (QD) inhalation conditions were used to assess the effects of realistic transient inhalation waveforms on deposition and growth. Both waveforms had a total inhaled volume of 3 L. As illustrated in Figure 2, the SD waveform was characterized by a peak inspiratory flow rate (PIFR) of 61.4 L/min, a mean flow rate of 37 L/min, and a time fraction to PIFR of 1/4. The QD waveform was characterized by a PIFR of 122.2 L/min, a mean flow rate of 75 L/min, and a time fraction to PIFR of 1/6. With the transient simulations, the aerosol was initially introduced at t=0 and injected continually for 1 sec and 0.5 sec with the SD and QD inhalations, respectively.
Characteristic breath waveforms consistent with “slow and deep” (SD) and “quick and deep” (QD) inhalation instructions for medium resistance devices.
SIP models and DFs
To improve numerical efficiency and accuracy, each SIP geometry was divided into segments B4–B7 and B8–B15. Flow fields were interpolated between the upstream outlets and the inlets of each of these sections. Numerical testing indicated that deposition in the SIP models was nearly identical between the injection of interpolated particle profiles at each SIP inlet and profiles consistent with the inlet velocity field. As a result, particle profiles consistent with the inlet velocity field were implemented, which allowed for the inclusion of additional particles to ensure converged results. Based on this finding, 9×10⁴ particles were injected at the inlet of each SIP section with a number concentration profile consistent with the inlet velocity field. In this study, the injected particles had the MMAD of the polydisperse distribution exiting each of the upper TB outlets along with mass-averaged properties for droplet water and solids fraction, density, and hygroscopic properties.
Based on the results of Tian et al.,(42) transient simulations are required in the upper airways through approximately B3, whereas steady-state approximations at mean flow rates are acceptable in the SIP models. In this study, transient SD and QD simulations are conducted for MT and upper TB airways using the SD and QD waveforms. For the individual SIP models, steady-state simulations are then performed at the equivalent mean flow rates. In these steady-state simulations, the upper MT-TB model is included to generate approximate flow fields and particle conditions at the inlet to the SIP geometries. Deposition efficiencies determined with the transient simulations for the MT and upper TB model are then combined with the SIP values using appropriate equations to characterize deposition throughout the conducting airways. Tian et al.(42) showed that this approach was accurate to within 5% of fully transient simulations in both the upper and lower airways, but provided a significant savings in solution time. Equations for calculating deposition efficiency (based on drug mass entering each section of the airways) and DF (based on total drug mass entering the mouth inlet) were previously described by Tian et al.(42)
Cases evaluated
CFD simulations are first conducted for comparison and validation with the in vitro experiment using AS:MN combination particles from the Respimat inhaler at a steady inlet flow rate of 30 L/min. The remaining simulations are intended to evaluate EEG deposition throughout the conducting airways using different inhalation conditions and drug:excipient ratios. The hygroscopic excipient selected was NaCl, which based on the study of Longest and Hindle(27) has the highest hygroscopic parameter of the generally regarded as safe (GRAS) excipients considered so far. For comparison, MN and NaCl have hygroscopic parameters of 8.2 and 77.9, respectively, where the hygroscopic parameter is proportional to the growth potential and final attainable aerosol size.(27) The model drug considered was insulin (ρ≈1,000 kg/m3, M=5,808 kg/kmol), which is practically insoluble in water (without the addition of dilute acids) and therefore does not contribute to the hygroscopic nature of the droplet. The aerosol was assumed to initially consist of fully dried combination particles with a geometric diameter of 900 nm containing drug-to-hygroscopic excipient ratios of 50:50 or 25:75. These initially submicrometer particles can be formed from a variety of methods including capillary aerosol generation,(24) the Respimat inhaler with an ethanol:water vehicle,(32) or a DPI.(55,56) As described, inhalation conditions were either SD or QD, which are considered to be consistent with current instructions for inhaler use.
Results of the current study are compared with previous CFD simulations of inhaler performance using the SIP modeling approach(10,42,46) as well as ECG performance.(33) Comparison with existing model results is implemented because the extent of the TB airways is defined the same among these studies and is easy to describe. Furthermore, previous CFD simulations of inhaler performance using the SIP approach implemented transient inhalation profiles identical to those considered in this study. For comparison with standard MDIs and DPIs, the existing SIP study of Longest et al.(10) is considered. This study evaluated delivery for the Flovent® HFA MDI and Flovent Diskus® DPI (GlaxoSmithKline, Raleigh, NC), both delivering 250 μg of fluticasone propionate. For comparison with a state-of-the-art delivery device, the Respimat inhaler is considered with an aqueous solution vehicle to generate conventional-sized aerosols, as described in the previous studies of Longest and Hindle(47) and Longest et al.(46) The aerosol produced by the Respimat inhaler and implemented in the simulations of Longest et al.(46) had an MMAD of 5.3 μm and a fine-particle fraction (<5.8 μm) of 62.3%, and is referred to as the 5-μm Respimat aerosol in this study.
Results
Validation case study using the AS:MN formulation
Transport and deposition of the AS:MN aerosol with a mass ratio of 50:50 is illustrated in Figure 3 based on CFD simulations for comparison with the corresponding in vitro experiments. Consistent with the experiments, the aerosol inlet of the dual flow mouthpiece(25) was included in the simulation, and inlet air was at 21°C and 40% RH. To match the experimental conditions, wet-wall boundaries were assumed on the MT-TB model, chamber, and mouthpiece inlet. From the experiments, the initial (measured at the mouthpiece inlet) and final (measured at the chamber outlet) mean MMADs were 0.47 μm (SD=0.11) and 1.66 μm (SD=0.09), respectively. Geometric standard deviations (GSDs) of the initial and final aerosols were 3.33 and 1.82, respectively. The CFD simulations initialized monodisperse 0.47-μm combination particles at the dual-flow mouthpiece inlet and illustrate a gradual size increase of the aerosol over the 2-sec transit period through the geometry (Fig. 3). The final predicted MMAD from the CFD simulations was 1.68 μm, which is very close to the experimental result. The final CFD predicted GSD was 1.66; however, this value is not expected to agree with the experiments as the CFD simulations began with a monodisperse aerosol. Considering deposition, the in vitro results indicate 1% (SD=0.09) deposited drug mass in the MT-TB geometry (through B3), which is very similar to the CFD prediction of 0.9%. It is noted that larger final sizes of the aerosol can be achieved without increasing the MT deposition fraction by increasing the initial particle size to a value closer to 900 nm.(27)
Comparison of experimental and CFD-predicted growth characteristics of combination particles composed of albuterol sulfate (AS) and mannitol (MN) at a mass ratio of 50:50. The initial particle size in the experiments and CFD simulations was characterized by a MMAD of 0.47 μm.
Insulin case study: relative humidity
CFD predictions of RH are presented in Figure 4 along airway midplanes from the MT to B15 during mean accelerating flow. Conditions for SD (Fig. 4a and c) and QD (Fig. 4b and d) inhalation are compared. The RH of the inhaled ambient air (21°C and 40% RH) increases as heat and mass are transferred from the walls to the airstream by convection. In general, the RH increases rapidly and reaches approximately 90% by B3. In the lower TB airways, RH values are typically greater than 99.5% by approximately B8 for SD inhalation and B9 for QD inhalation. Conditions in the lowest 4–5 bifurcations are consistently at 100% RH. A closer look at RH values in the lower airways did not reveal RH values greater than 100%, whereas some supersaturation may occur in the upper airways for Lewis numbers less than 1.(32,57) In general, QD inhalation with ambient air is observed to reduce RH values at each bifurcation compared with SD inhalation until fully saturated conditions are reached beyond approximately B10.
Predicted RH conditions in the MT and upper TB regions for
Insulin case study: aerosol size increase
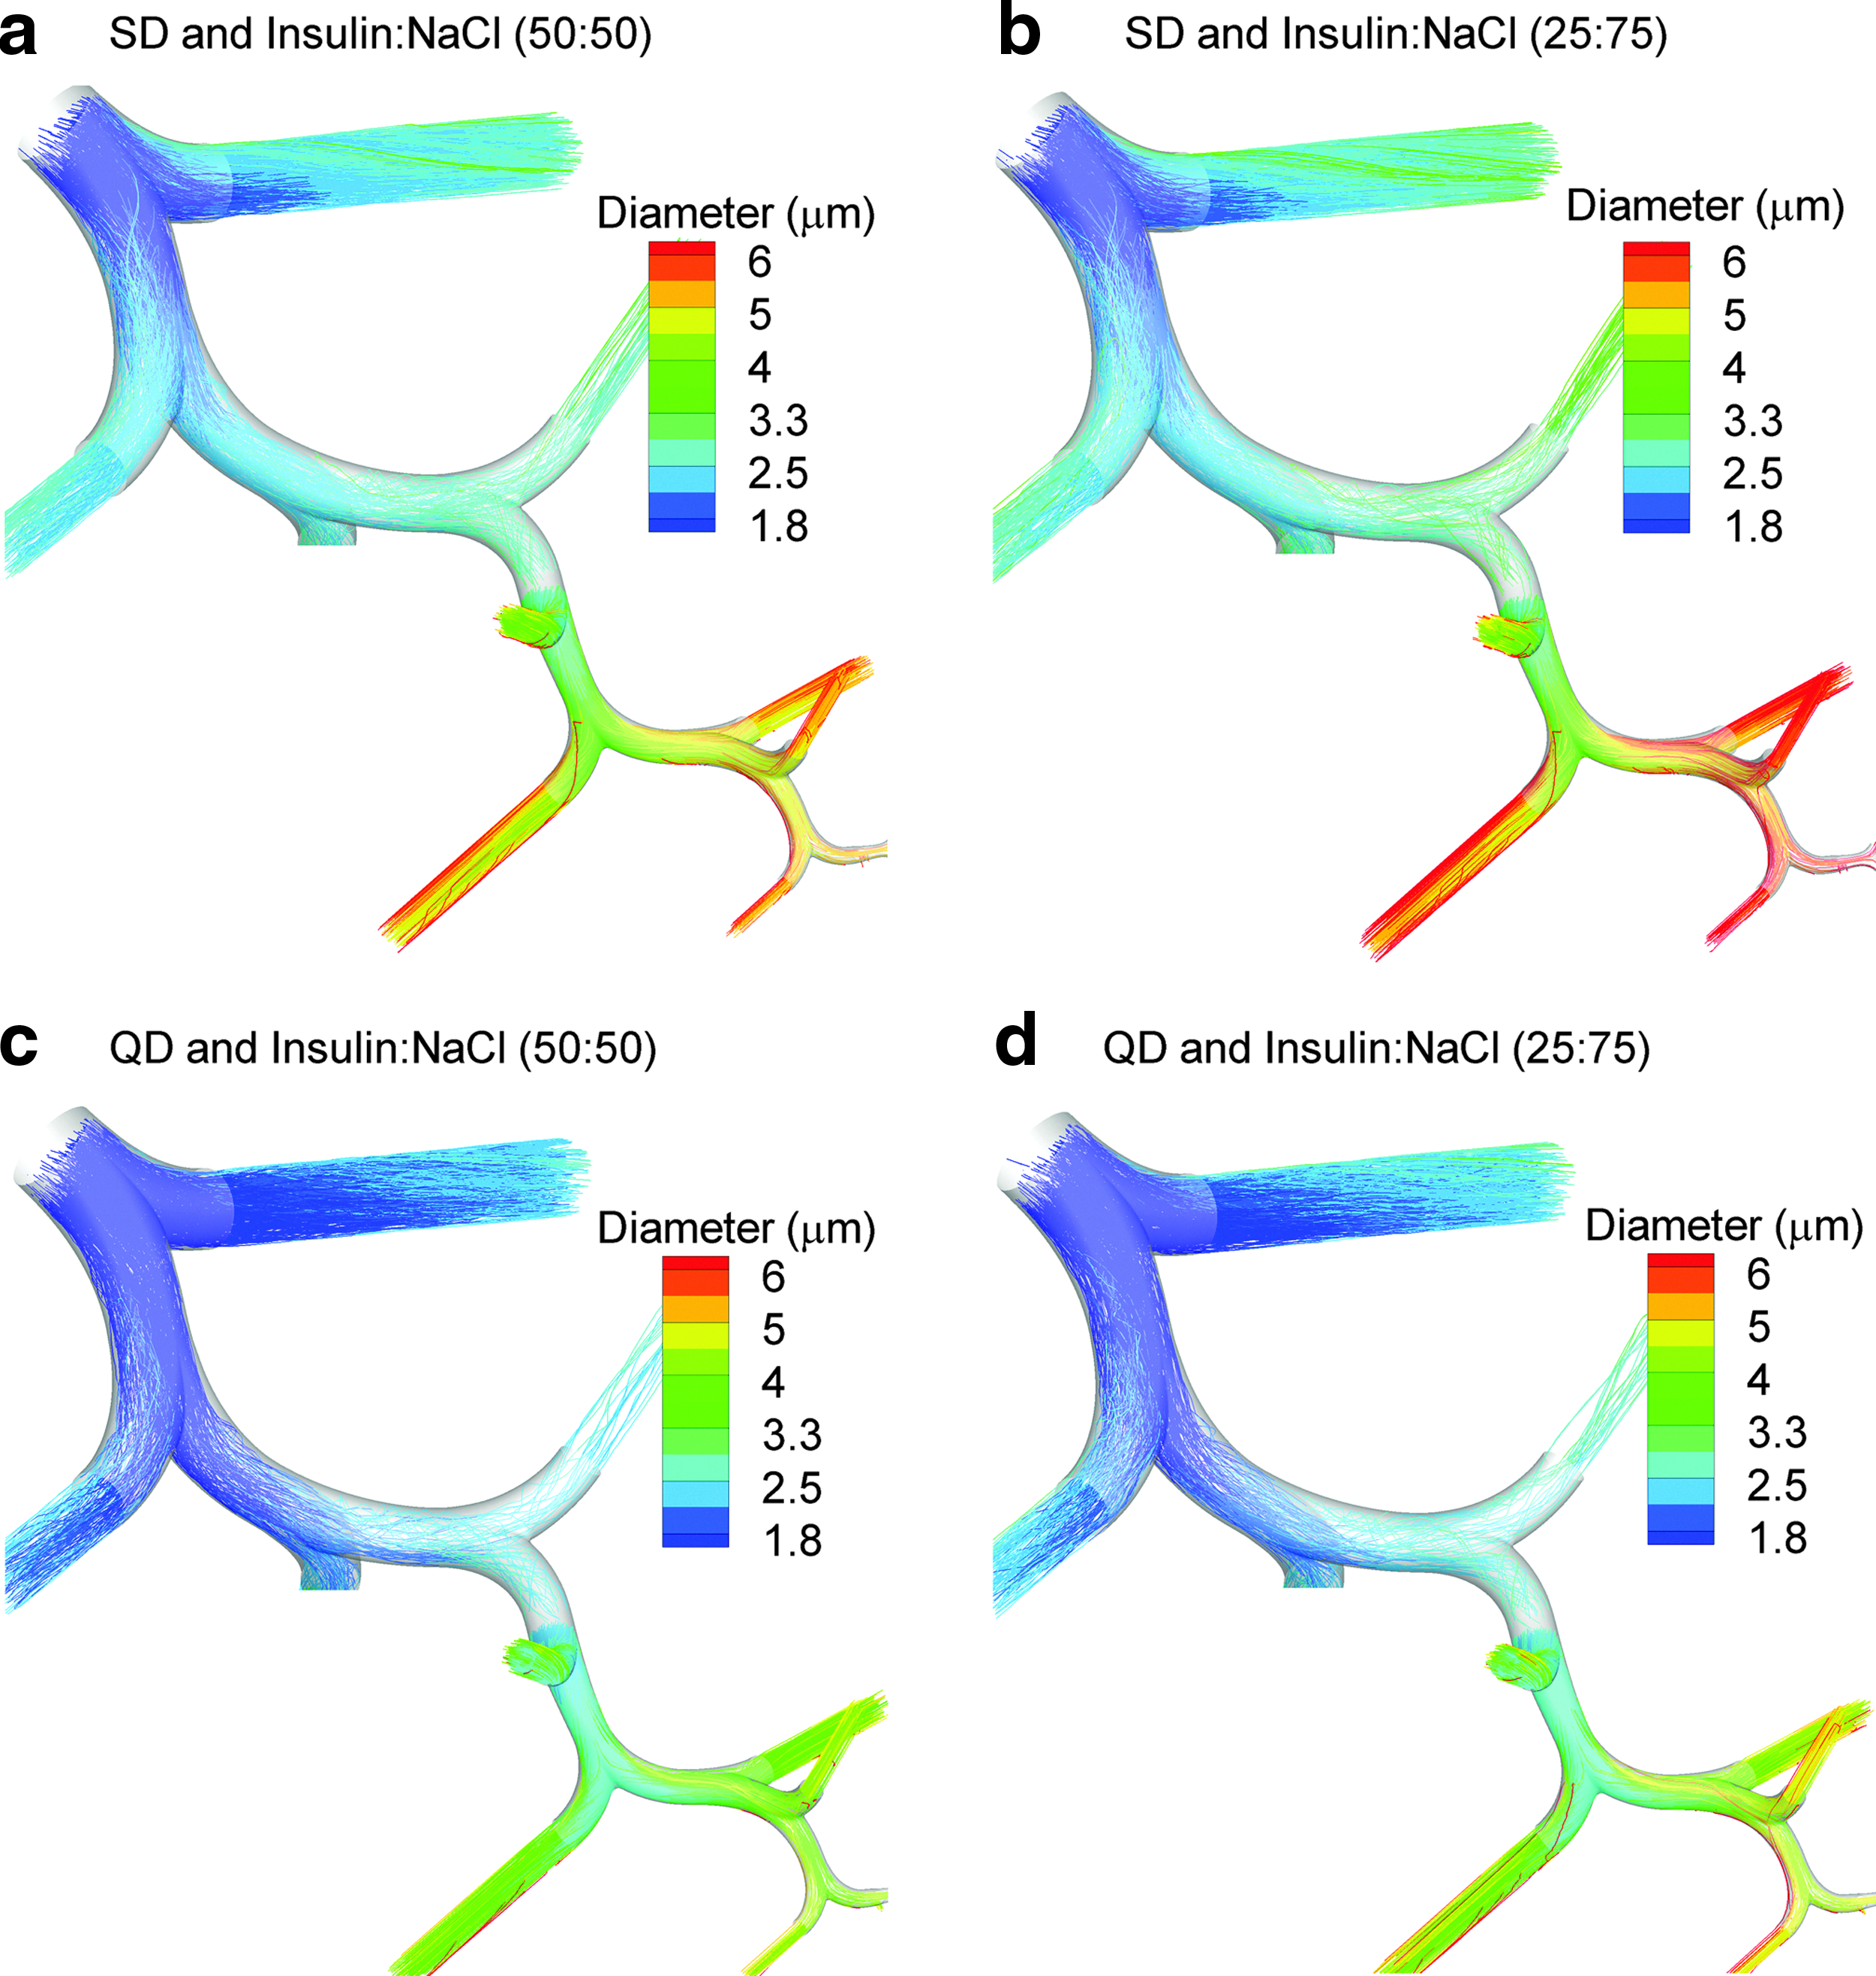
Trajectories of initial 900-nm combination particles composed of insulin:NaCl at different mass fractions in the MT and upper TB airways through B3 are illustrated in Figure 5. Rows of the figure compare different drug:excipient mass fractions (50:50 vs. 25:75), whereas columns compare different inhalation waveforms (SD vs. QD). For all cases, the aerosol is observed to remain submicrometer in the MT region, except for a few recirculating droplets, and generally remains below 1.5 μm during transport through the glottis. In the remainder of the model, the aerosol is observed to gradually increase in size to approximately 1.4–1.7 μm at the B3 exit. Increasing the hygroscopic excipient in the particle is observed to increase the aerosol growth. However, less time is available for growth with the QD inhalation waveform in the regions considered, so exiting final sizes are decreased compared with SD inhalation. The MMADs of the aerosol exiting the MT and B3 regions are reported in Table 1. Representative GSDs for the aerosol exiting B15 based on CFD predictions are in the range of 1.18–1.49. For example, SD inhalation with a 900-nm composite particle of insulin:NaCl at a mass ratio of 50:50 produces an aerosol exiting B15 with an MMAD of 5.72 μm and a GSD of 1.39.
Aerosol trajectories colored according to diameter in the MT and TB airways for combination particles of insulin:NaCl inhaled with SD and QD profiles:
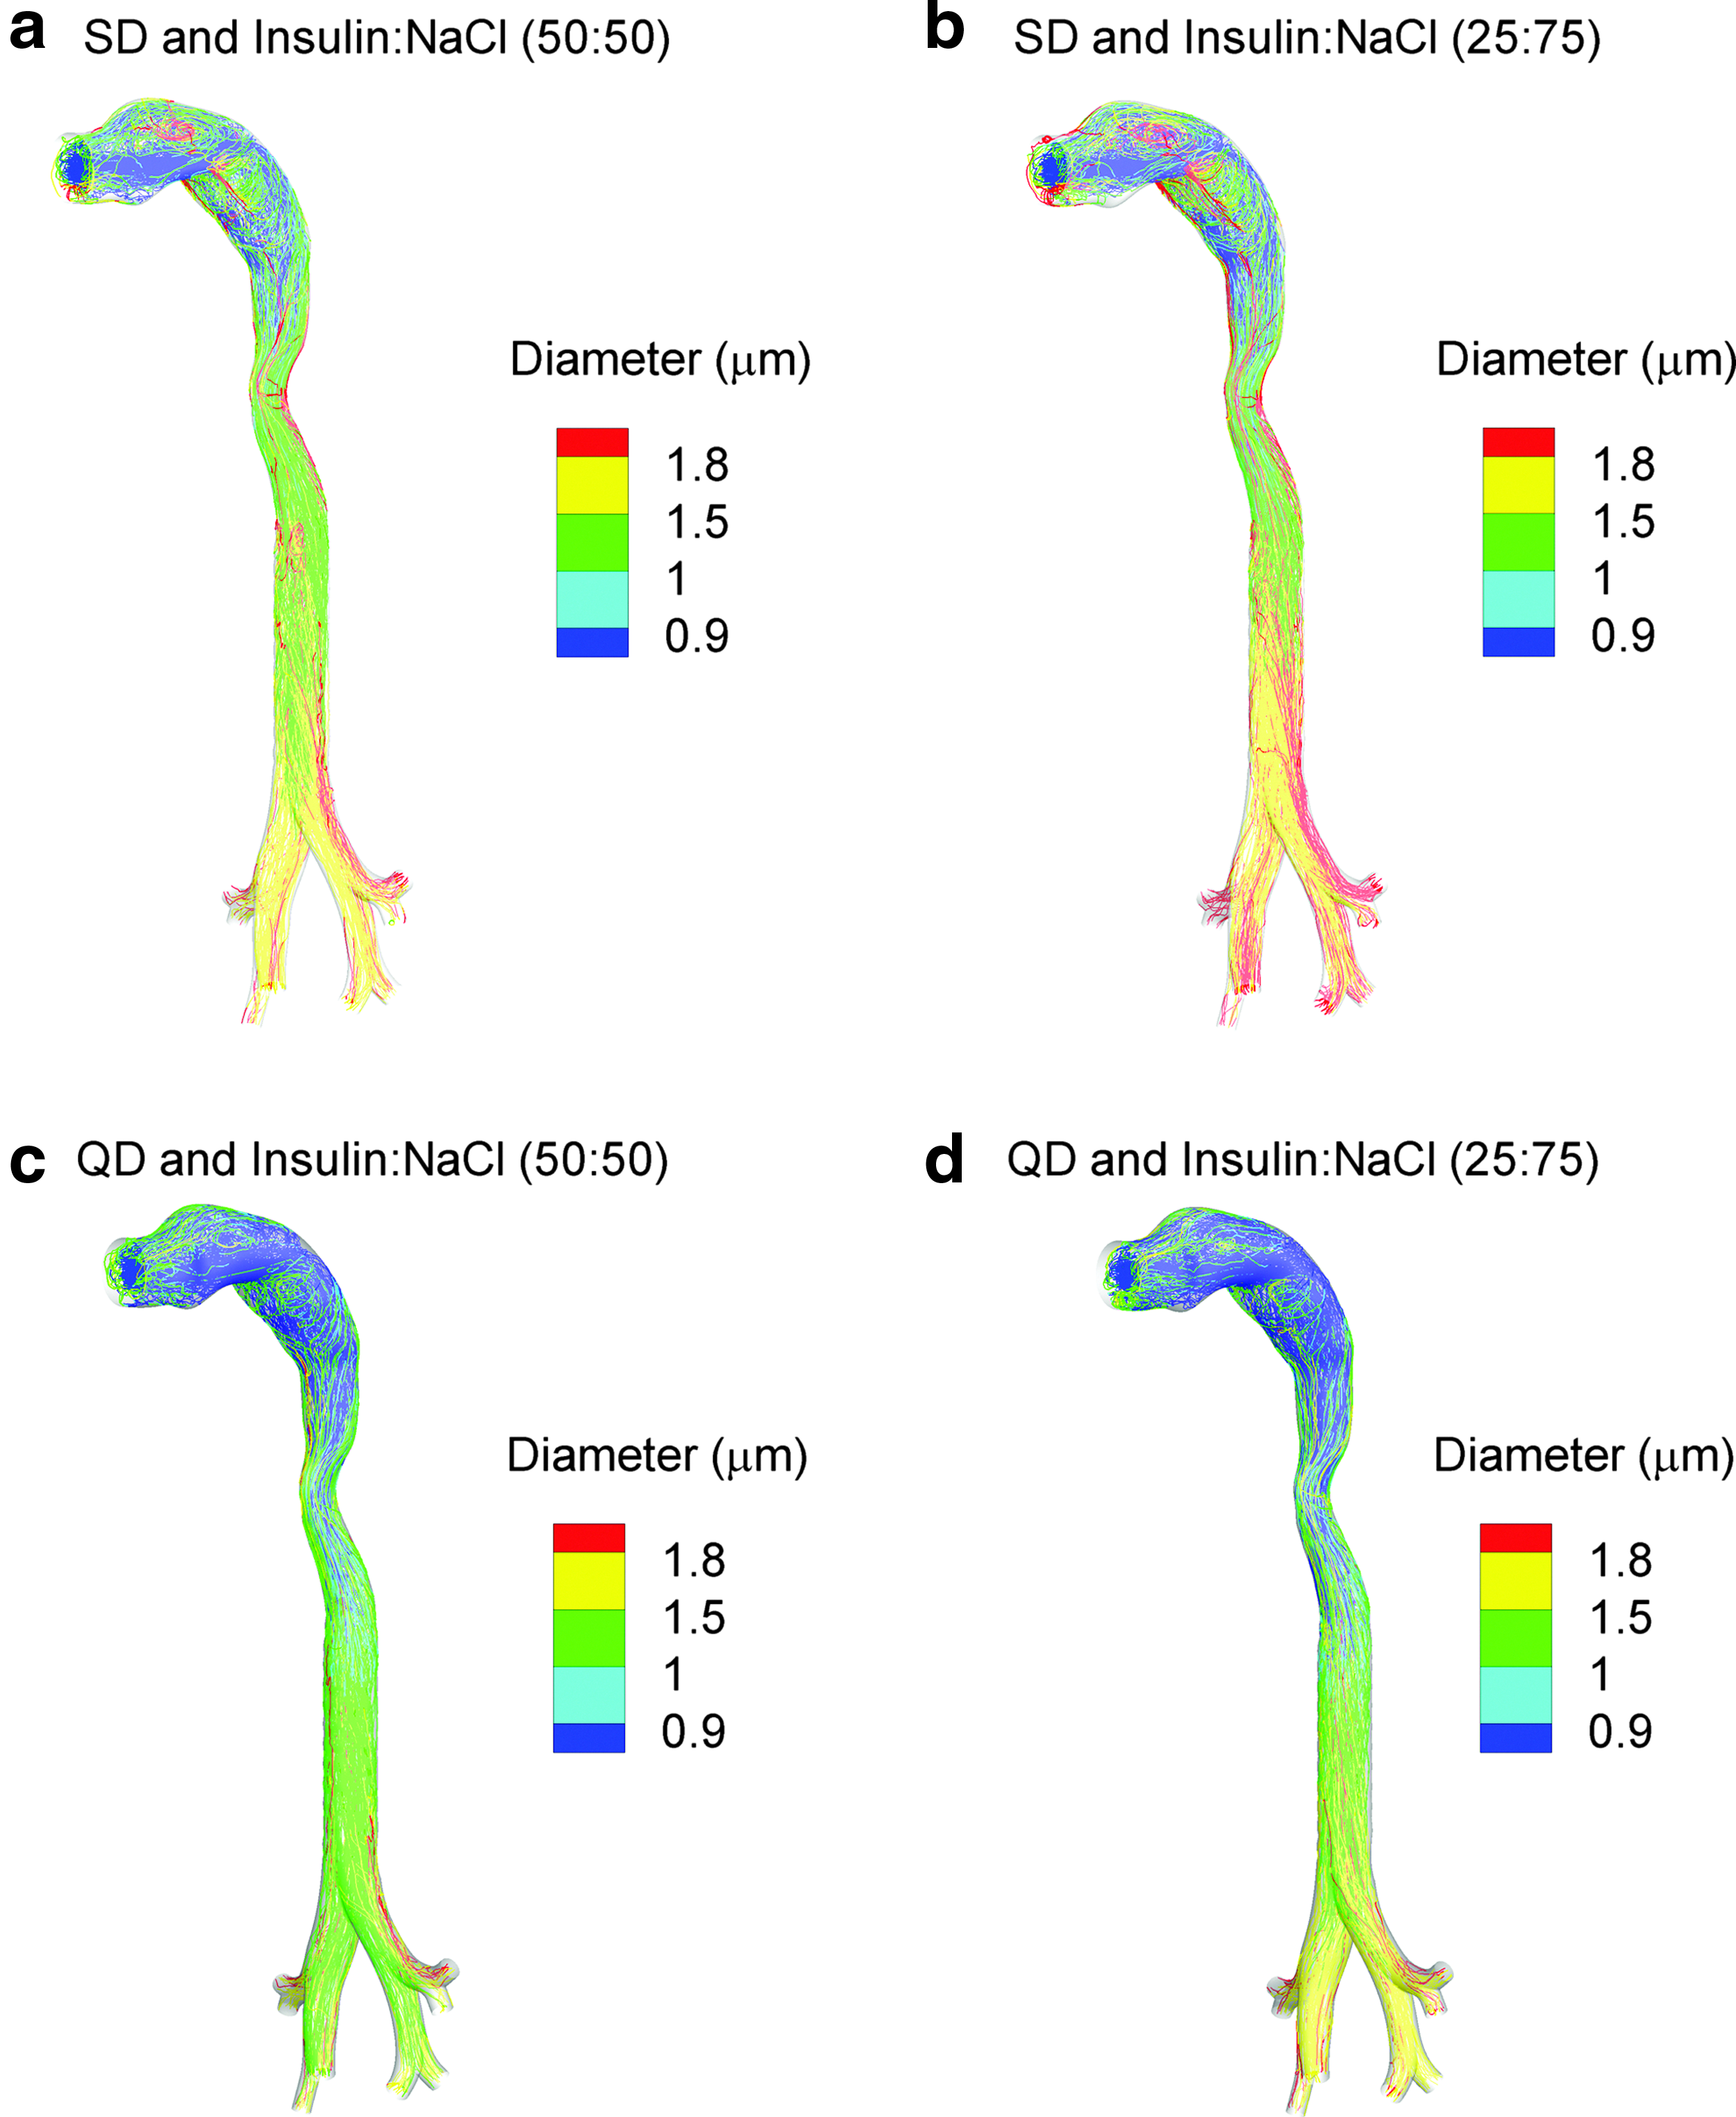
Trajectories of droplet size increase exiting B3 and continuing through B4–B15 of the left lower lobe are illustrated in Figure 6. As with Figure 5, effects of different inlet mass fractions are compared across rows and effects of different inhalation profiles are compared down columns. Continuous size increase is illustrated throughout the TB region. Table 1 reports values of MMAD at different exit points with a range of 4.6–6.5 μm at B15. As with the upper airways, aerosol size at a location is increased with larger mass fractions of the hygroscopic excipient and for SD inhalation. Considering exit MMADs at B15, increasing the hygroscopic excipient mass fraction from 50% to 75% results in a 1.15× increase in aerosol size. Increasing the inhalation rate from SD to QD conditions reduces final size by 1.25×. These relatively small changes in aerosol size may result in amplified changes in deposition.
Aerosol trajectories colored according to diameter in the TB airways from B4–B15 for combination particles of insulin:NaCl inhaled with SD and QD profiles:
Insulin case study: aerosol deposition
DFs and representative locations are illustrated in Figure 7 for B4–B15 extending into the left lower lobe under the same conditions considered in Figure 6 with initial 900-nm EEG combination particles. Deposition locations reveal a shift in pattern from characteristic impaction at the carinal ridges in the upper airways to impaction and sedimentation across the bifurcations in the lower airways. DFs are reported for characteristic regions of B4–B7 and B8–B15 and only represent left lower lobe deposition in Figure 7. In general, increasing the hygroscopic excipient in the particles from 50% to 75% results in an approximately 1.3–1.5×increase in deposition for each region. It is also observed that QD inhalation reduces TB deposition in each region considered by a factor of approximately 2×. As a result, inhalation conditions are observed to have a larger effect on deposition than the range of hygroscopic excipient mass fractions considered in this study. Furthermore, it is interesting that with EEG delivery, TB deposition is reduced with increasing flow rate. This is in contrast with most inhaler platforms where increasing flow rate increases TB deposition efficiency.(10) Regional deposition values reported in Figure 7 for the left lower lobe are translated to conditions across the entire lung (by multiplying with a factor of 5) and reported in Tables 2–5 along with comparisons to previous calculations for the 5-μm Respimat aerosol. As described, Longest et al.(46) previously showed that left lower lobe conditions could be used as a first-order approximation of total delivery across the airways.
Aerosol deposition locations and regional DFs in the TB airways from B4–B15 for combination particles of insulin:NaCl inhaled with SD and QD profiles:
DFs in the left lower lobe on an individual bifurcation basis are presented in Figure 8 for the 900-nm EEG aerosol. Interestingly, the effects of flow rate and excipient mass fraction are more pronounced in the lower TB airways, beginning with approximately B9. This is likely because turbulent dispersion plays a role in deposition in the upper TB airways and is less influenced by particle size compared with laminar flow in the lower airways. For a majority of the lower airways, differences in DF due to an increase in the hygroscopic excipient mass fraction appear to be approximately 1.3× higher. Similarly, SD inhalation appears to increase TB deposition by a factor of 2×on a bifurcation-averaged basis.
Comparison of SD vs. QD simulation results of DF for insulin:NaCl combination particles as a function of bifurcation number. Results are based on simulations for the left lower lobe only.
DFs within individual regions throughout the airways are reported in Figure 9 for SD inhalation with values provided in Tables 2 and 3. Comparisons are also made with previous CFD simulation results for a conventional aqueous formulation aerosolized to produce an approximately 5-μm aerosol using the Respimat inhaler, reported by Longest et al.(46) Beyond the MT, increasing the mass fraction of the hygroscopic excipient is again observed to increase regional TB DFs by a factor of 1.3 for SD inhalation. Compared with the aerosol generated using an aqueous Respimat formulation, MT DFs are reduced by an order of magnitude. EEG aerosol delivery also significantly increases the TB deposition in all regions compared with the 5-μm Respimat aerosol, except for B1–B3. Specifically, EEG delivery with 900-nm 25:75 insulin:NaCl particles delivers 3×the dose in the B8–B15 region and 2×the dose to the total TB airways compared with the 5-μm Respimat aerosol for SD inhalation. The highest TB DF for the EEG aerosol was observed to be 24.6%, with SD inhalation and a drug:excipient ratio of 25:75. Penetration fractions (PFs) are also reported in Tables 2 and 3, which represent the mass fraction of aerosol exiting each airway region during inhalation. For SD inhalation, the highest PF exiting B15 was 80% with the 900-nm EEG aerosol, which occurred with a drug:excipient ratio of 50:50. In comparison, the conventional 5-μm Respimat aerosol had a maximum PF exiting B15 of 52% during SD inhalation.
DFs for SD inhalation conditions in the MT and upper TB regions (left panel) and B4–B15 along with total TB (right panel). DFs in this figure represent conditions throughout the airways.
Comparisons between the 900-nm EEG aerosol and 5-μm Respimat aerosol are presented in Figure 10 for QD inhalation with values provided in Tables 4 and 5. In general, increasing the hygroscopic excipient for QD inhalation increases regional TB deposition by a factor of approximately 1.5×. Interestingly, TB deposition fractions with EEG decrease for all regions with QD inhalation compared with SD. This trend is also observed for the conventional 5-μm Respimat aerosol, but this is because with the aqueous formulation the MT DF increased from 34.6% (SD) to 55.1% (QD). It is noted that these 5-μm Respimat aerosol MT DFs include device deposition for consistency with the previous studies. The EEG aerosol total TB deposition with QD delivery exceeds that of the 5-μm Respimat aerosol, but is approximately one-half the value observed with SD inhalation. However, QD breathing appears ideal for delivering the EEG formulation aerosol to the alveolar airways. PFs for the EEG aerosols with QD inhalation and both hygroscopic excipient ratios are approximately 90%, which represents a 3×increase over 5-μm Respimat aerosol delivery.
DFs for QD inhalation conditions in the MT and upper TB regions (left panel) and B4–B15 along with total TB (right panel). DFs in this figure represent conditions throughout the airways.
For the variable ranges considered, inhalation rate appears to have a larger impact on regional TB deposition and PF than hygroscopic excipient mass fraction for the EEG aerosols. Differences in DF for SD and QD inhalation are further illustrated in Figure 11. A factor of 2×increase in regional deposition for SD inhalation compared with QD is clearly evident for both mass fractions in the regions of B4–B7, B8–B15, and total TB. Differences in MT deposition and delivery to B1–B3 as a function of inhalation conditions are smaller and represent much smaller doses (<1%) of drug. Therefore, the inhalation rate with the EEG aerosol is observed to have a minor effect on MT deposition, which is very different from other inhalation platforms, including the 5-μm Respimat aerosol. In contrast, inhalation flow rate can be used to effectively target EEG deposition within the TB airways and to the alveolar region.
Comparison of SD vs. QD simulation results of DF for
Discussion
Targeted aerosol deposition within the airways can refer to reducing MT deposition and ensuring aerosol retention in the lungs, increasing deposition within individual regions (TB or alveolar), or targeting a specific site. Deposition at specific sites in the airways has previously been reviewed by Kleinstreuer et al.(58) and can potentially be achieved by controlling the position of particle release either at the mouth inlet(59) or using an inhalation spray catheter.(60,61) Magnetic aerosols also provide a potential means to target deposition within specific sites of the airways.(62–64) Results of the current study indicate that the EEG approach can potentially be used to effectively target aerosol deposition to the entire lung or can be used to significantly increase deposition in the TB or alveolar airways. In the following discussion, the potential for targeted delivery with EEG is evaluated based on comparisons with previous results for a conventional aqueous Respimat formulation(46) and conventional MDI and DPI aerosols.(10) As described, comparisons are based on previous numerical results using the SIP modeling approach so that deposition in the TB and alveolar regions can be clearly and consistently defined. In contrast, the extent of these boundaries has not been effectively or consistently determined in two- and three-dimensional lung imaging studies of aerosol deposition in vivo.(65)
For all cases considered, MT deposition was near zero (<1% of drug) with EEG aerosol delivery. The initial submicrometer particles also increased to sizes that are associated with full lung deposition based on previous in vivo studies of pharmaceutical aerosols.(16,17,66) The reduction of MT deposition to less than 1% represents an order of magnitude improvement compared with existing inhalers. For example, using an identical geometry, the state-of-the-art Respimat inhaler with an aqueous formulation was observed to lose 34.6% and 55.1% of the drug in the MT (and the inhaler mouthpiece) for SD and QD inhalations, respectively.(46) Similarly, the conventional Flovent HFA MDI and Diskus DPI were reported to have MT depositions of 40.0% (including mouthpiece) and 69.8%, respectively, when used with correct inhalation profiles based on validated CFD simulations.(10) Considering the Staccato device,(22) MT aerosol deposition is consistently around 11% regardless of flow rate. However, this constant MT deposition is accomplished by a reduction in aerosol size as flow rate increases. Fixed particle sizes of approximately 1.5 μm and below are observed at flow rates above approximately 50 L/min, which may be too small to deposit in the airways and may be exhaled.(23) In contrast, the EEG formulation approach consistently provides less than 1% MT deposition delivered through a simple tubular mouthpiece over two characteristic waveforms with PIFRs ranging from 61.4 to 122.2 L/min and final aerosol sizes greater than 3 μm.
Considering targeted delivery to the lung airways, the EEG aerosol appears to provide a controlled method to deposit aerosols in both the TB and alveolar regions with minimal MT deposition. Spreading deposition across the upper and lower lung airways may be advantageous for treating lung infections and lung injury. With SD inhalation, the EEG approach deposits approximately 20% of the aerosol in the TB airways and 80% (based on PF) in the alveolar region. Changing the mass fraction of the hygroscopic excipient from 50% to 75% had a minor effect (∼1.3×) on altering this distribution. Both of these regional deposition values represent a significant increase compared with a conventional aqueous formulation aerosolized using the Respimat device (Tables 2 and 3 for SD inhalation) as well as compared with conventional MDI and DPI platforms. For example, the Diskus DPI was previously reported by Longest et al.(10) to have TB and alveolar DFs of approximately 4.2% and 26%, respectively, for ideal inhalation conditions based on CFD simulations with the SIP modeling approach.
In this study, the EEG aerosol was observed to target the TB region from the perspective that doses were largely increased compared with the 5-μm Respimat aerosol as well as conventional devices. The maximum TB dose achieved with EEG was 25% for SD inhalation with a hygroscopic excipient mass fraction of 75%. The highest TB dose achieved with the 5-μm Respimat aerosol was 13%, or approximately one-half the EEG dose. For comparison with conventional inhalers, Longest et al.(10) previously reported the TB doses for ideal usage of the Flovent HFA MDI and Diskus DPI were 8.1% and 4.2%, respectively. Therefore, the EEG approach is capable of increasing TB drug delivery by a factor of 2–6×compared with existing platforms for the range of excipient mass fractions and inhalation conditions that were considered. However, Tian et al.(33) reported TB dose as high as 50% for ECG delivery, still with negligible MT deposition. Furthermore, the EEG conditions that maximized TB deposition also produced high alveolar delivery. This may not be advantageous for drugs intended exclusively for the TB region. Delivering combination particles along with saturated RH may be required to maximize TB dose while minimizing alveolar exposure when necessary. However, combination TB and alveolar delivery may be important for topical pharmaceutical applications that are generally intended for the TB airways. For example, biopsy studies indicate characteristic asthma inflammation extending from the trachea to the alveoli.(67,68) Therefore, there may be an advantage to delivering anti-inflammatory medications to the TB and alveolar regions in the treatment of asthma.
Perhaps more significant than the increase in total TB deposition observed with EEG delivery compared with existing platforms is the distribution of deposition within the TB airways. There are a number of lung conditions and diseases where treatment of the lower TB region may be critical. For example, several studies have illustrated that the lower TB airways, with diameters less than approximately 2.4 mm, are most responsible for the functional airway ventilation changes observed with asthma.(69,70) Airways with diameters less than 2.4 mm correspond to B12 and below in the SIP model of the left lower lobe considered in this study. As a second example, idiopathic pulmonary fibrosis is described as starting in the peripheral airways and marching to the center of the lungs.(71–73) Ideal respiratory aerosol delivery to treat this disease would target drug deposition to the progressing front early in its development.(72) In this study, drug deposition within the TB airways was maximum for SD inhalation and the TB distribution was not largely influenced by the fraction of hygroscopic excipient. Maximum delivery to the region of B8–B15 (lower TB) was approximately 20%, which was a factor of 3–4×greater than with the 5-μm Respimat aerosol and similar to ECG delivery.(33) In contrast, conventional MDI and DPI inhalers deliver approximately 0.9% and 0.6% of the drug dose to the B8–B15 region of the entire airways based on the model predictions of Longest et al.(10) Therefore, the EEG formulation approach provides a method to increase the dose delivered to the lower TB region of the lung by a factor of 20–30×compared with conventional inhalers. Better treatment of this region, which is thought to be primarily responsible for functional airway impairment associated with asthma, may provide better drug efficacy, especially in cases where the disease is poorly controlled and nonresponsive with conventional inhalers.
Based on the results of this study, the EEG aerosol appears to be highly effective for alveolar delivery. Considering a particle size range of 4.6–6.5 μm entering the alveolar region (Table 1), the alveolar deposition correlations of Stahlhofen et al.(74) predict full lung deposition for typical breathing conditions associated with inhalers, as described by Tian et al.(33) Maximum alveolar delivery (based on PFs exiting the TB region) was 90% for QD inhalation and a hygroscopic excipient loading of 50%. This represented a 3×increase in drug dose compared with the 5-μm Respimat aerosol for the same inhalation conditions. EEG alveolar DFs are also significantly better than with a conventional MDI (DFalveolar=52%) and DPI (DFalveolar=26%) used with ideal inhalation based on the CFD results of Longest et al.(10) Furthermore, changes in hygroscopic excipient loading and inhalation rate were not observed to largely alter the alveolar DF based on a minimum observed value of 75%.
A potential advantage of the EEG approach for deep lung delivery is the inverse relationship that was observed between inhalation flow rate and TB deposition. In all cases considered for EEG, MT deposition was negligible (<1%). With EEG aerosol delivery, increasing the inhalation flow rate (by using the QD waveform) reduced RH values and the rate of aerosol size increase. As a result, the aerosol experienced less TB deposition due to impaction as flow rate was increased. However, sufficient aerosol size increase was still attained to assure full lung deposition with QD inhalation (Table 1). In contrast, higher flow rates with conventional fixed-size aerosols result in higher deposition efficiencies in the MT and TB regions and reduced delivery to the alveoli.(10) This observation may be beneficial for the development of new DPIs based on EEG for improved lower TB or alveolar delivery. With conventional DPIs, high flow rates are needed to deagglomerate the powder and form the aerosol. However, these high flow rates result in excessive MT deposition and increased drug deposition in the upper TB airways. With EEG, DPIs can be developed that implement high flow rates to deaggregate the powder and form a submicrometer aerosol. The high flow rate combined with the EEG approach will then promote reduced upper TB deposition and high delivery to the alveolar region. An EEG-based DPI platform will need to overcome the high cohesive and adhesive forces associated with submicrometer aerosols(75) and will need to protect the hygroscopic particles from moisture ingress. However, preliminary results indicate that submicrometer DPI delivery is possible and highly efficient.(55,56)
One potential limitation of the current CFD results is the assumption of one-way coupled heat and mass transfer. This approach assumes that the aerosol is sufficiently dilute such that size increase has a negligible impact on water vapor in the air, which is maintained by convective mass transfer from the walls. Previous studies by Finlay(76) and Finlay and Stapleton(77) have demonstrated that accounting for evaporated water mass in the continuous phase (two-way mass coupling) is important for modeling the evaporation of conventional-sized nebulized droplets. Similar results were found for evaporating nebulized droplets in the study of Longest et al.(78) and for ECG size increase as reported by Longest and Hindle.(79) However, based on a previous validation and characterization study of submicrometer aerosol hygroscopic growth in a tubular exposure geometry with wet wall conditions and a 2-sec exposure time,(31) effects of two-way coupling are expected to be negligible at typical pharmaceutical aerosol concentrations for final sizes below approximately 3 μm. In the current study, good agreement is observed between the validation experiment and one-way coupled predictions of final aerosol size, demonstrating that this assumption is reasonable for the upper TB and chamber geometry. In the lung, mass transfer from the walls is significantly greater than mass transfer from the surfaces of the in vitro chamber. This can be observed by considering that all terms in the convective wall mass flux expression(27) are similar between the two systems except for the characteristic dimensions. A characteristic diameter of the airways (∼1 mm) is significantly less than the characteristic dimension of the chamber (∼20 cm). Based on the convective mass flux equation, significantly more mass transport will occur in the lung airways supporting the one-way coupled assumption in the TB model. However, this assumption is limited by both the final aerosol size achieved and the number concentration of the aerosol. Longest and Hindle(27) previously developed correlations to predict the final size of combination EEG aerosols in the airways considering both one-way and two-way coupled conditions, which account for factors including initial aerosol size, number concentration, and a newly developed hygroscopic parameter. These correlations were applied to the current case of insulin:NaCl combination particles with a mass ratio of 25:75, an initial geometric diameter of 900 nm, and an aerosol concentration of 2.75×10⁵ particles/cm3, which is consistent with a submicrometer Respimat aerosol sampled at 30 L/min.(31) Comparing results of the correlations, it was determined that for a final aerosol size in the range of 5–6 μm in the lungs, the one-way coupled assumption produced a relative error of approximately 10%. This difference appears reasonable considering the order of magnitude increase in computational effort required to produce coupled transient simulations throughout the conducting airways.
Limitations of the current study in addition to one-way coupling are related to model assumptions and differences from aerosol administration in vivo. Walls of the airway model were assumed to be static; however, airway wall motion is expected to influence transport and will likely increase deposition of the aerosol in the lower TB airways.(80) The RH of the airway mucus surface was assumed to be 100%, which represents a maximum value in healthy individuals. This boundary condition may be reduced in disease states, which could reduce the final size achieved by the aerosol. A CFD model of aerosol transport and deposition in the alveolar airways is needed to improve estimates of pulmonary deposition and estimates of deposition location beyond the algebraic correlation that was used.
In comparison with in vivo conditions, a limitation of this study is the use of one airway geometry. Delvadia et al.(11) previously showed that deposition in the MT and upper TB airway model used in this study could describe mean deposition of pharmaceutical aerosols in vivo for adults. However, a range of airway geometries and waveforms was required to assess variability in delivery across a population.(11) A recent study by Clark and Hartman(81) questions the potential for targeting regional lung deposition considering the amount of variability observed across a population. However, aerosol size changes from the submicrometer range to the micrometer scale may be sufficient to overcome challenges associated with high intersubject variability in inhalation waveform and respiratory geometries. Airways considered in this study were healthy without significant constriction or disease and were assumed to have healthy mucus. Finally, inhalation was assumed to be consistent with typical SD and QD waveforms generated with standard instructions and devices with medium airflow resistance.
Conclusions
In conclusion, the use of combination submicrometer particles composed of a model insoluble drug and hygroscopic excipient (i.e., EEG delivery) was found to be highly effective for improving the delivery of aerosols to the lungs, increasing aerosol size, and controlling the region of deposition. For the inhalation flows and excipient mass fractions considered, MT deposition of the aerosol was negligible (<1%), which represents a reduction from state-of-the-art and conventional inhaler values by an order of magnitude or more. Final aerosol sizes exiting the TB region and entering the alveolar airways were all greater than 3 μm, which is sufficient to ensure full lung deposition of the aerosol. Increasing flow rate from SD to QD inhalation was observed to decrease TB deposition fractions by a factor of 2×, which represents the opposite trend of current fixed aerosol size delivery platforms. The amount of hygroscopic excipient in the initial submicrometer particle (50% vs. 75%) had a relatively minor 1.3–1.5×effect on TB deposition. For SD inhalation, DFs of 20% could be achieved in the lower TB region of B8–B15, which is a factor of 20–30×higher than conventional delivery devices. Deposition in this region may be used to more effectively treat conditions such as uncontrolled or nonresponsive asthma. With QD inhalation, maximum alveolar delivery fractions of 90% were observed. This maximum alveolar delivery with high flow rate is unique to the EEG platform and may form the basis for effective DPI devices for deep lung administration of topical and systemic medications. Future studies are needed to assess the EEG approach across a population to determine if intersubject variability in respiratory drug delivery and airway targeting can be reduced using this method.
Footnotes
Acknowledgments
This study was supported by Awards R21 HL104319 and R01 HL107333 from the National Heart, Lung, and Blood Institute. The content is solely the responsibility of the authors and does not necessarily represent the official views of the National Heart, Lung, and Blood Institute or the National Institutes of Health.
Author Disclosure Statement
No conflicts of interest exist.