




Abstract
Abstract
Background:
The manner in which fluid instillations into mouse nose and lung distribute through the airways is poorly understood. Many agents are delivered in this way for testing as therapeutics, or as challenges designed to establish infections or create systemic drug delivery effects. These agents are delivered into mouse airways with little knowledge of the manner in which doses move through the airways, how long they reside in each region, and where the instilled materials eventually reach.
Methods:
Synchrotron phase-contrast X-ray imaging (PCXI) was used to elucidate the primary controlling characteristics of mouse airway fluid dosing. High-speed image acquisition was used to track the movement of a range of bolus doses of an iodine-based contrast fluid through the nose (n=15) and lungs (n=10) of live anesthetized mice. For the lung studies, the mice were ventilated and paralyzed to control animal movement. Post-experiment image processing was used to visualize the fluid movement.
Results:
The maximum dose that could be retained in only the anterior nose was ∼7.5 μL (20 g mouse), and a range of dynamic dose behaviors was documented after delivery. In the lung, the use of mechanical ventilation in combination with a paralytic agent prevented confounding artifactual movement, improving visualization of fluid progression through the airways. In the lung, optimized image analysis using the high image capture rate revealed the presence of respiratory pauses that could not be visualized at slower acquisition rates. The variability in the outcome of identical dose deliveries in different animals indicates that uniform lung distribution cannot be expected to occur with tracheal fluid delivery.
Conclusions:
With adequate imaging rate and fluid dose parameters, this study shows the utility of synchrotron PCXI for determining the post-delivery behavior and fate of fluid doses such as those used in in vivo gene transfer or pharmaceutical studies.
Introduction
The success of airway gene transfer protocols depends on reliable fluid dosing, but despite using standardized delivery techniques we, along with other groups, report large variability in both electrophysiological gene transfer measurements and reporter gene histological assessments.2–4 Heterogeneous dose distributions that may occur in the physically complex nose and trachea could be one cause of this variability.
All standard imaging modalities (i.e., radiographs and ultrasound) poorly discriminate soft tissues from air-containing structures and cannot be used to visualize fluid dosing dynamics in the mouse nose and lung due to their limited spatial and temporal resolution. Similarly, although capable of providing three-dimensional information via tomographic approaches, small-animal μ-CT and μ-MRI cannot be used to track high-speed dynamic events such as fluid dosing at high spatial resolutions. The ultimate location of trans-nasally delivered solutions has been determined in three dimensions using positron emission tomography (PET), 5 but the acquisition speed and spatial resolution of nuclear medicine, single-photon emission computed tomography (SPECT), and PET are too low to permit imaging of the dynamics of the fluid delivery.
Synchrotron phase-contrast X-ray imaging (PCXI)6,7 can be used to monitor the fate of a fluid dose bolus with high temporal and spatial resolution in the period immediately after delivery. A synchrotron is a large machine that accelerates electrons to close to the speed of light. As the electrons are deflected through a magnetic field (e.g., at a bending magnet), they create extremely bright and coherent synchrotron light that is directed into experimental hutches. PCXI provides enhanced image contrast by using X-ray refraction in addition to conventional X-ray absorption and is capable of producing soft-tissue contrast even where the absorption differences are small, particularly in the lungs (see Fig. 1 on page 5033 in Lewis et al. 8 for a comparison between PCXI and standard absorption contrast). Propagation-based PCXI requires a spatially coherent X-ray source, a property that is readily achievable using a synchrotron. The boundaries between tissue and air are enhanced by the phase changes in the incident X-ray wave induced by their differences in X-ray refractive index.6,7 We have described the advantages of PCXI for airway surface imaging in small animals,9,10 for monitoring the post-deposition behavior of particulates on live mouse nasal and tracheal airways,11,12 and for non-invasively tracking how a fluid bolus—typical of that used in airway gene-therapy dosing—moves through the airways of live and intact small animals. 13
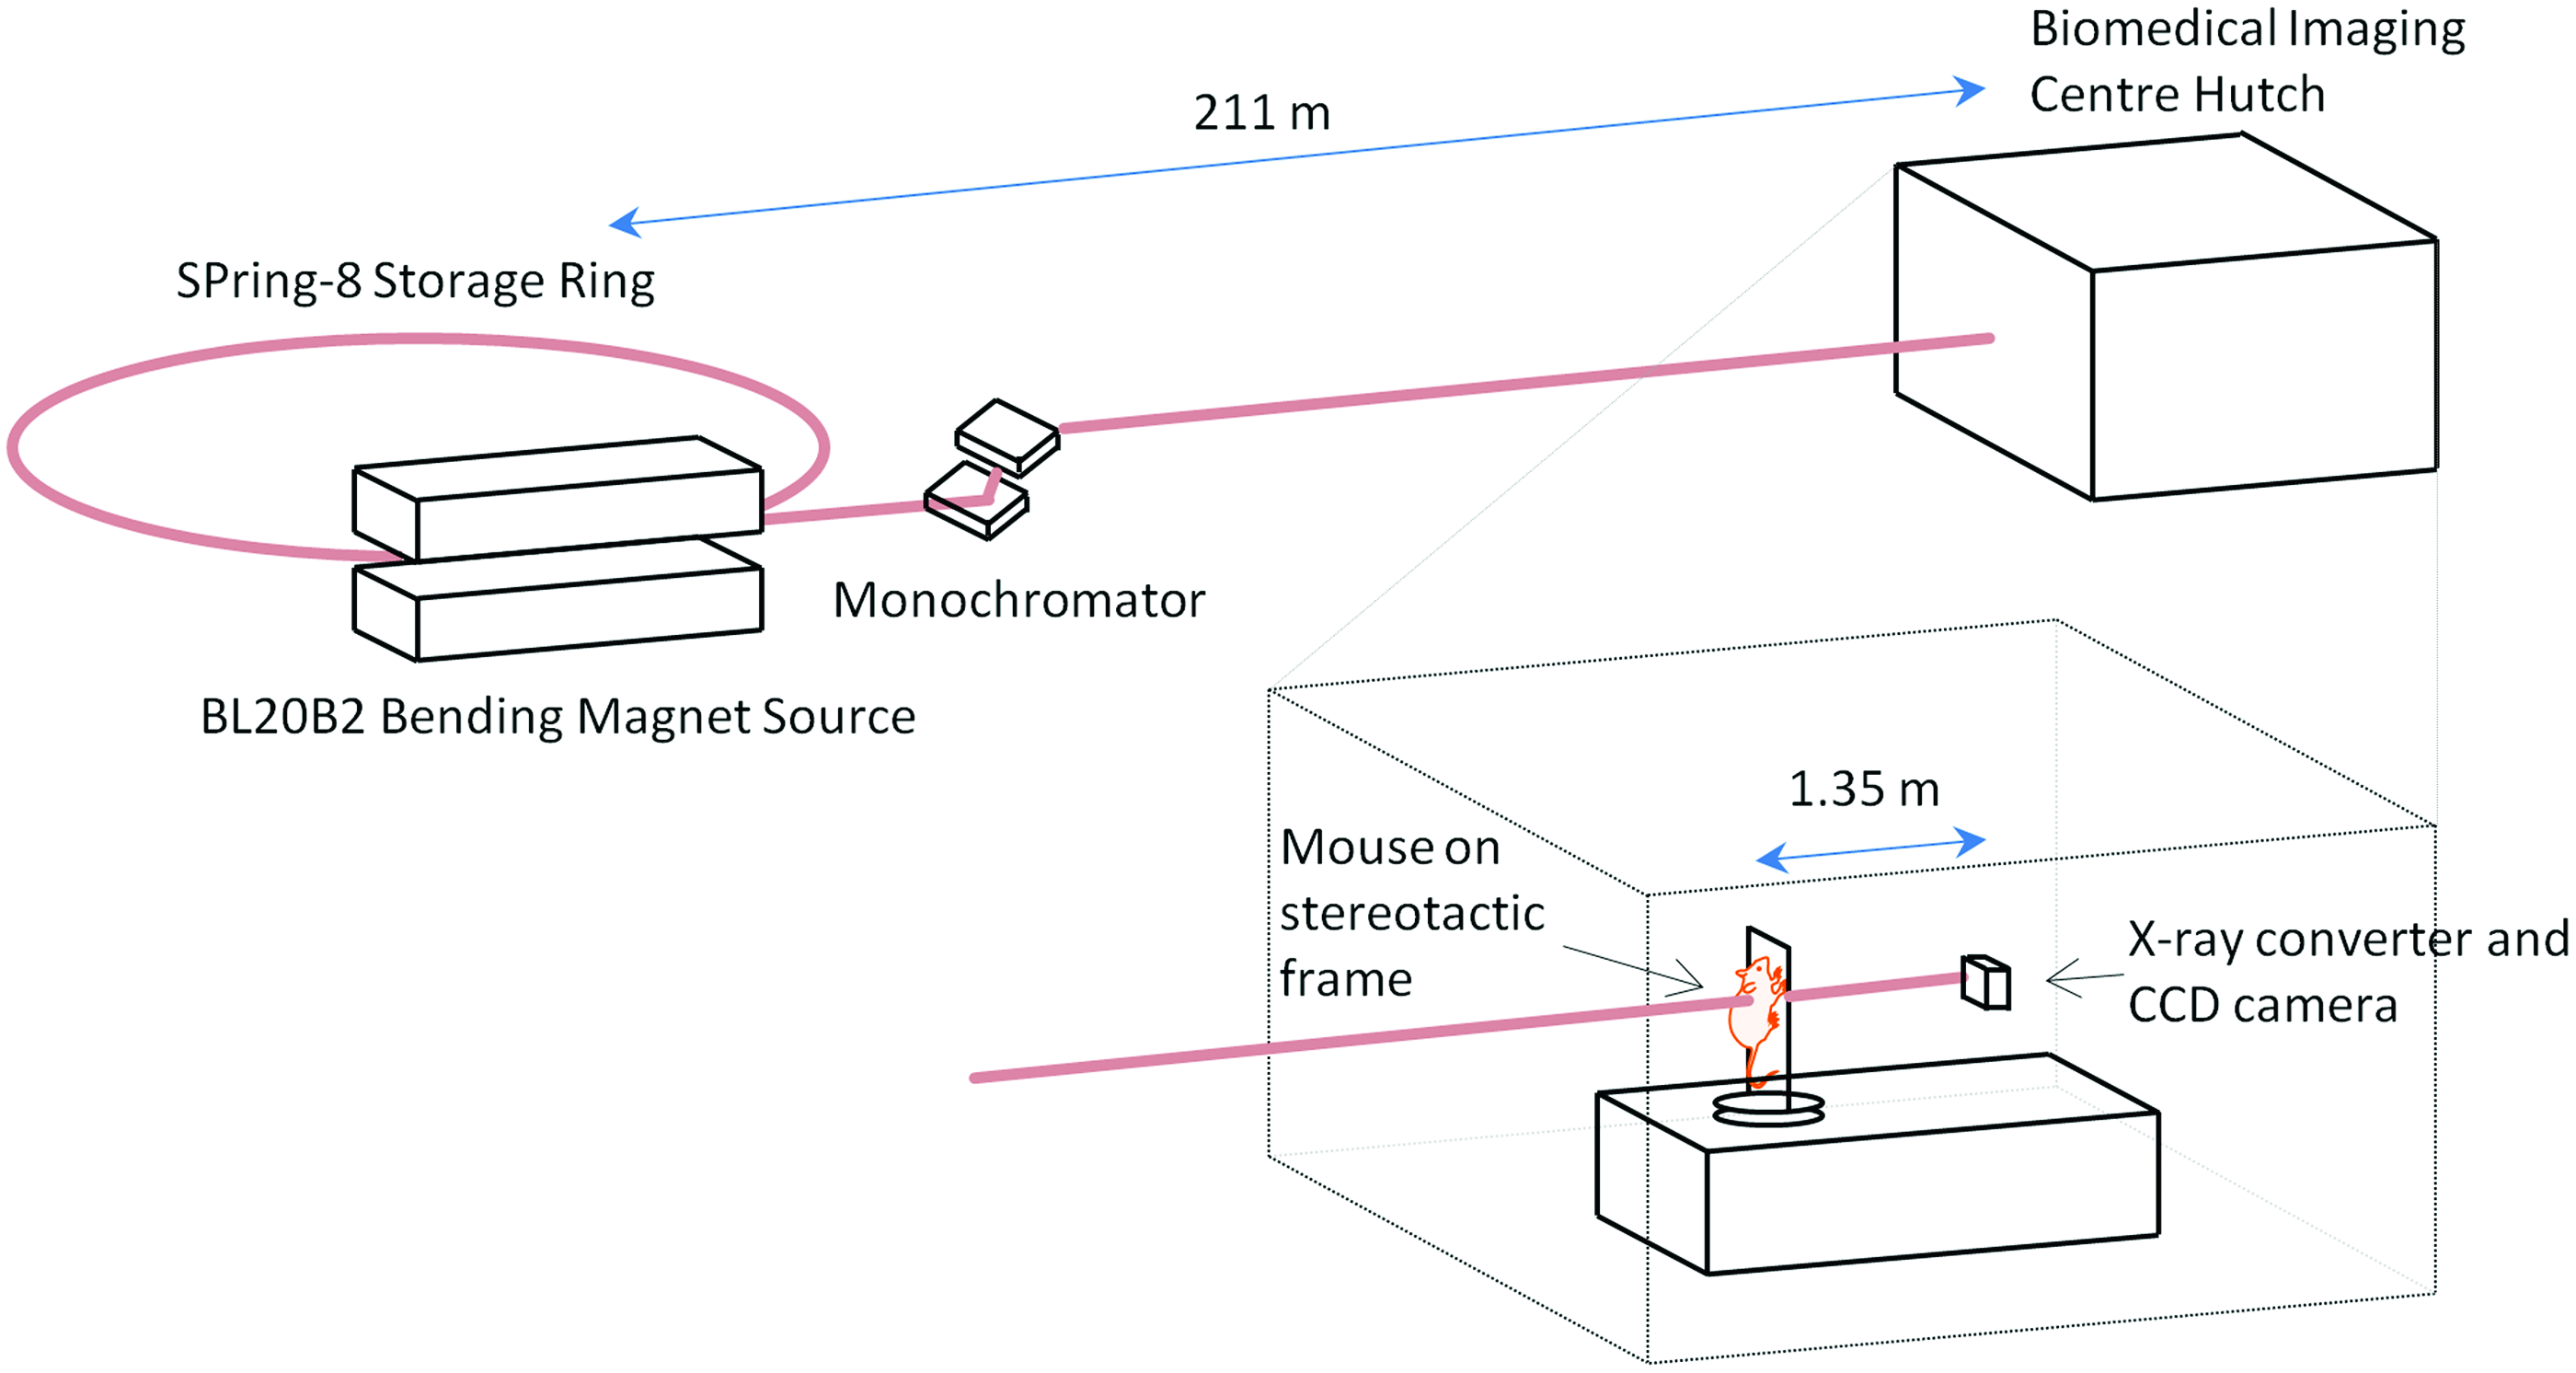
Synchrotron imaging setup. The in vivo airway synchrotron phase-contrast X-ray imaging setup. Mice are held vertically on an x-y-rotation stage in the imaging hutch, 211 m from the X-ray source. A propagation (sample to detector) distance of 135 cm was used. Color images available online at www.liebertpub.com/jamp
Our previous fluid dosing study 13 showed the immediate fate of fluids instilled into the nose and trachea of live anesthetized mice, demonstrating that the overall distribution of the dose, the effectiveness of the delivery method, and the persistence of the delivered dose can now be visualized. The limitations of that study included a small sample size, small delivered fluid volumes, and significant motion artifacts from animal movement during the lung studies. Importantly, the temporal resolution (1 Hz for nasal studies and 1.33 Hz for lung studies) was too low to accurately track the rapid fluid movement. The aim of the present study was to use improved image-capture techniques to permit more accurate monitoring of fluid dosing dynamics in the nose and lungs of live mice using two-dimensional PCXI. Specifically, we substantially increased the imaging frame rate, included larger fluid doses, and used a paralytic agent during the lung imaging studies to minimize unwanted body movements.
Materials and Methods
Experiments were performed on the BL20B2 bending magnet beamline at the SPring-8 synchrotron radiation facility in Japan. All experiments were approved by the Animal Ethics Committee of SPring-8, and of the Women's and Children's Health Network (Adelaide). Mice were anesthetized using 80 mg/kg intraperitoneal (i.p.) pentobarbital (Somnopentil, Pitman-Moore, Washington Crossing, NJ), with an additional 30 mg/kg i.p top-up 10 min later, just prior to imaging. Body temperature was maintained using an infrared heat lamp and monitored with a rectal thermometer. Mice were typically anesthetized for a maximum of 30 min and were humanely killed via overdose of pentobarbital after completion of each experiment.
Imaging setup
The imaging hutch was located in the SPring-8 Biomedical Imaging Centre, 211 meters from the source, 14 and the imaging layout was as described previously9,13 (see Fig. 1). Monochromatic 18 keV (λ=0.7Å) X-rays were selected using a Si(111) double-crystal monochromator to provide both maximum flux and iodine contrast. 15 A propagation (sample-to-detector) distance of 1.35 m was chosen to produce optimal phase contrast for airway imaging. X-rays were converted to visible light using a GADOX (P43, Gd2O2S:Tb) scintillator coupled to a 200 mm lens (BM5, Hamamatsu Photonics, Hamamatsu City, Japan), and images were captured using an EMCCD detector (C9100-02, Hamamatsu Photonics) and an 85 mm camera lens. The CCD detector had an array size of 1,000×1,000 pixels and an 8 μm native pixel size. This setup resulted in an effective isotropic pixel size of 18.8 μm and a field of view of 18.8 mm×18.8 mm. An exposure length of 100 msec was chosen to capture sufficient photons to fill the potential dynamic range (2 14 gray levels) of the detector, provide the maximal signal-to-noise ratio without detector saturation, and minimize blurring from animal movement.
Nasal studies
Animals were prepared as previously described. 13 In brief, 15 anesthetized female C57/Bl6 mice (∼20 g) were individually secured head-high to a polyethylene imaging board 16 with their incisors hooked over a wire loop and their limbs, shoulders, and torso taped to the board to minimize body movements. The imaging area (head) was brushed with a thin layer of glycerol to eliminate air in the fur layer and minimize fur interference in the PCXI images. The imaging board was connected to the hutch sample stage such that the mouse was held head-high and the X-ray beam passed dorso-ventrally through the nose. A PE10 polyethylene cannula (SteriHealth, Melbourne, Australia) was positioned using a micro-manipulator so its tip was 1–2 mm above the right nostril, to simulate our normal (hand-delivered) nasal gene vector delivery setup. 1 The cannula was connected to a syringe pump (UltraMicroPump III and Micro4 controller, World Precision Instruments, Sarasota, FL), remotely activated from outside the imaging hutch.
To produce lasting gene expression after a single dose event in our gene transfer studies, we use a 4 μL 0.1–1% (typically 0.3%) lysophosphatidylcholine (LPC) airway pretreatment before delivering a 20 μL LV gene vector dose (typically 107–109 transducing units/mL) to the mouse nose.1,2,17,18 Our previous study suggested that a 20 μL dose overwhelmed the holding capacity of the mouse nose, 13 so we sought to test the effect of an intermediate dose volume. For this reason, we chose 4 μL, 10 μL, and 20 μL as the surrogate fluid volumes to examine here (n=5 each). A 1:1 mix of the strongly X-ray–absorbing iodine-based contrast agent iomeprol (Iomeron 350, Bracco-Eisai, Tokyo, Japan 19 ) and water (to produce an isotonic solution) was used as the surrogate fluid for both LPC and the LV vector. In three mice, we tested the use of saline only as the surrogate fluid to demonstrate the effectiveness of using iomeprol for visualizing the fluid location. To ensure accurate dose initiation and delivery, the syringe and PE tubing were primed and tested prior to each experiment.
Images were captured at 6.67 Hz. After 15 sec (100 frames) of baseline image collection, the contrast mix was delivered in a single bolus at a constant rate of 0.4 μL/sec; thus, the 4 μL dose was delivered in 10 sec, the 10 μL dose in 25 sec, and the 20 μL dose in 50 sec. Mice “sniffed” the fluid into one nostril by their normal tidal volume inhalations. The cannula tip did not make contact with the mouse nose at any time. Image capture continued for 5 min, creating a dataset consisting of a total of 2,100 images per mouse.
Lung studies
A similar protocol was used for the lung imaging. Ten mice were anesthetized, then intubated with a 20 GA intravenous catheter (Insyte™, Becton Dickinson, Sandy, UT). 16 This endotracheal (ET) tube was inserted into the trachea to a depth of 22.5 mm from the nose tip, chosen to place the ET tube tip below the fifth cartilage ring (approximately halfway between the epiglottis and the carina, based on measurements made in dissected animals prior to the imaging studies). The catheter Luer hub was immediately cut off to enable the ET tube to be directly connected to the ventilator circuit and ensure respiratory dead space was minimized. The imaging area (chest and back) was brushed with a thin layer of glycerol to improve image quality. Mice were ventilated at 80 breaths/min with a tidal volume of 30 mL/kg (no pressure limit) and a positive end expiratory pressure of ∼3 cmH2O using a flexiVent small-animal ventilator (Scireq, Montreal, QC, Canada). The ventilatory profile was configured with a forced inspiration of 350 msec and a passive expiration of 400 msec. After connection to the ventilator, mice were paralyzed using pancuronium (Mioblock, 0.5 mg/kg i.p.) to minimize unwanted respiratory and skeletal muscle movements. Fluid doses were delivered via a heat-thinned PE10 polyethylene cannula placed inside the ET tube via an airtight slit in the silicone ventilator tubing and advanced so that its tip extended 5 mm below the end of the ET tube,13,16 a similar depth to that used in our mouse lung gene transfer studies. 1 The syringe pump was used to remotely deliver the bolus of contrast mixture via this smaller cannula.
Our lung gene transfer studies use doses of 15 to 30 μL, 1 so these are the two doses we tested (n=5 each). Our previous fluid dosing study suggested that rapid dose deliveries better target the conducting airways and minimize dose losses via retrograde movement around the delivery and ET tubes, 13 so the maximum infusion rate of the syringe pump (∼4.2 μL/sec) was used for both volumes.
Starting at the beginning of each breath, the ventilator triggered acquisition of five images at equally spaced intervals of 150 msec. This resulted in three frames during inspiration and two frames during the relatively motion-free period after passive expiration. After 15 sec of baseline collection (20 breaths, 100 images), a sample of the contrast mix was delivered. For the 15 μL and 30 μL volumes, the fluid was delivered as a single bolus over 3.6 sec and 7.2 sec, respectively (maximum infusion rate). Imaging continued for a further 5 min, creating a dataset consisting of a total of 2,100 images per mouse.
Post-experimental analyses
Post-processing was performed as previously described. 13 All images were flat-field and dark-field corrected, and image subtraction algorithms were used to locate regional changes in image brightness (Matlab 2009b, The MathWorks, Natick, MA).
For the nasal studies, each frame was subtracted from the best matched baseline image—determined by calculating the two-dimensional correlation coefficient between the current frame and each of the baseline frames—to locate regions where the image brightness had changed and so reveal fluid motion (i.e., background subtraction of the mouse anatomy). A constant threshold of 128 gray values (1/32 the dynamic range) was used to select only the large intensity changes, and a 3×3 median filter was applied to reduce noise. The presence and/or motion of the delivered fluid was highlighted by pseudo-coloring the original images. The regions where the image became darker (more contrast fluid) were colored with a red to yellow color scale, and those that became lighter were colored with a blue to purple color scale (see Fig. 2). The volume of contrast fluid (i.e., the amount of artificial color) present in the nose in each image frame was also determined semi-quantitatively by summing the pixels in a central vertical region of interest of dimensions 300×1,000 pixels from the background-subtracted images. This value was calculated for each image collected from every mouse and presented as an average over time for each fluid volume.
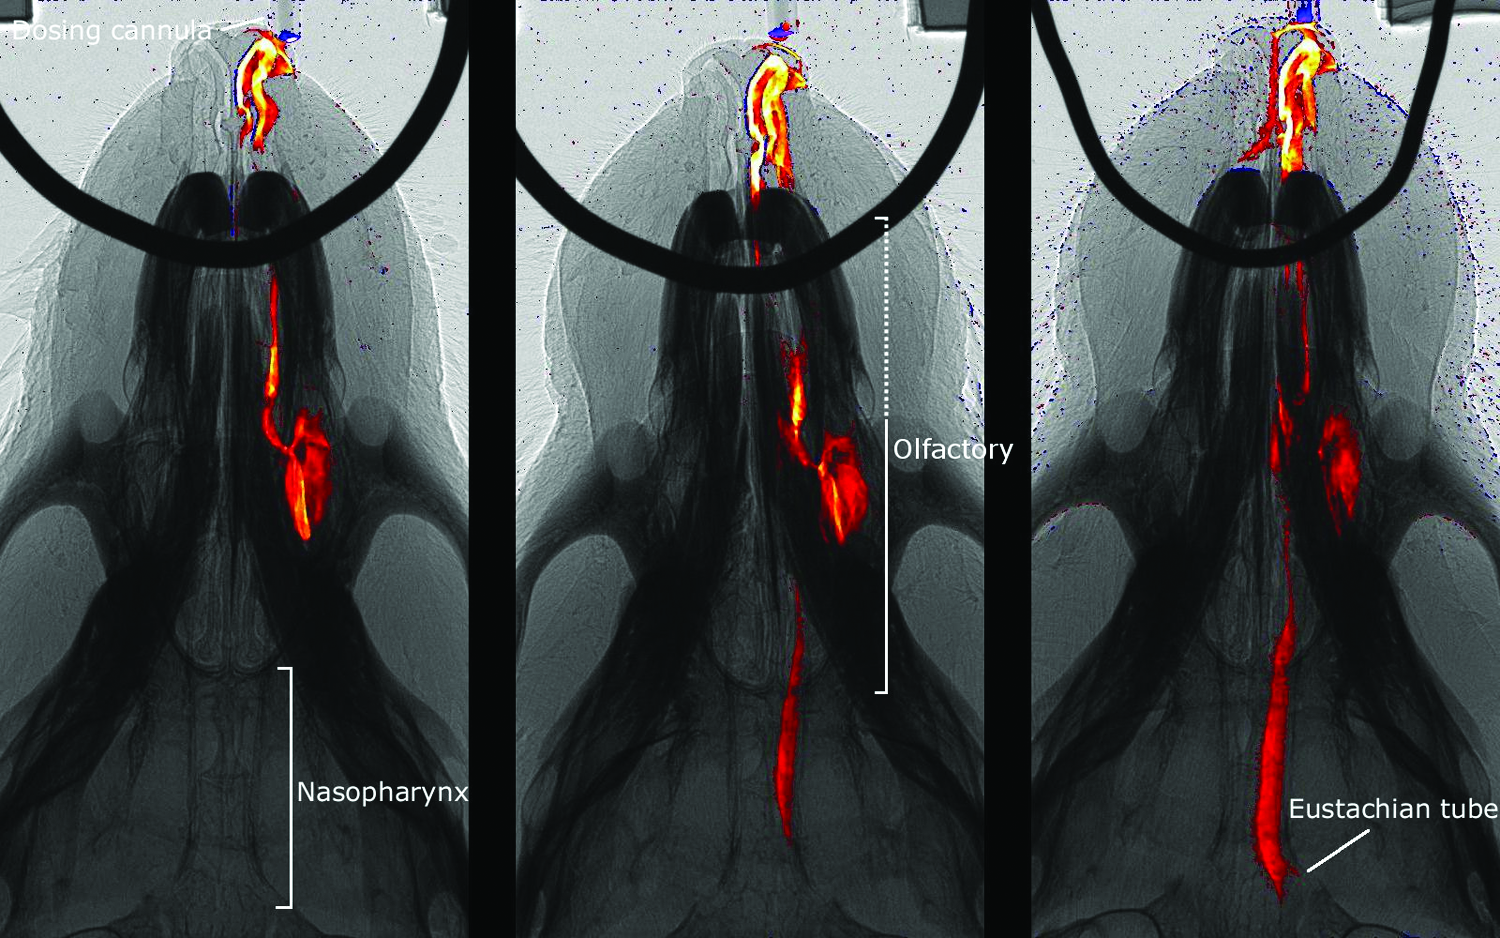
Nasal bolus dose delivery. Representative images from three separate mice show the dose distribution after delivery of fluid boluses into the nose. From left to right, the doses are 4 μL, 10 μL, and 20 μL. These frames were captured ∼17 sec after the initiation of each fluid delivery. The dotted region contains a mixture of respiratory and transitional ciliated epithelium. Color images available online at www.liebertpub.com/jamp
The lung studies were processed differently. For these images, the brightness difference between successive breaths (i.e., frame differencing) was calculated by subtracting each frame from the corresponding frame in the previous breath. This technique was used to compensate for the greater confounding movements produced by the continuous respiratory and cardiac motion. Each frame was converted to an RGB image, and the red, green, and blue channels were adjusted to show the regions where the brightness decreased (i.e., presence of contrast fluid) in green pseudo-color. This visualization method minimized the effects of body motion and eliminated the need to choose a different threshold for each animal that would complicate between-animal comparisons.
For high-quality motion detection, the background must remain still compared with the foreground objects (i.e., the contrast fluid) to be detected, so we made special efforts to minimize the movement of the mouse during imaging, hence the use of restraining boards, respiratory gating, and respiratory muscle paralysis as described above.
The amount of contrast fluid that entered the left and right lungs was calculated in a similar manner to the nasal study. Each image was divided into left and right halves using a vertical line that passed through the carina. The proportion of contrast fluid entering each lung was determined by calculating the sum of the pixels in the frame-difference images. Only frames 100 to 250 were analyzed (i.e., the fluid dosing period) to minimize the contributions of extraneous body movements.
Results
The small volumes of the 1:1 mixture of water and contrast fluid were well-tolerated by the anesthetized mice. All mice survived to the end of the imaging sequences. Occasional respiratory perturbations occurred with the large volume deliveries, but subjectively these appeared to occur at a similar incidence to that experienced during our gene transfer studies.
Nasal dose delivery
Soon after delivery initiation [see Fig. 2; Supplementary Video 1 shows the full delivery sequence (Supplementary Videos are available online at www.liebertpub.com/jamp)], two primary regions of distribution were typically visible: the anterior region (containing largely respiratory epithelium), and the more distal and lateral olfactory region. Increasing the delivered volume produced progressively greater “overflow” of dose from this portion of the olfactory region of the anterior nose into the central nasopharynx. The smallest (4 μL) dose filled one side of the anterior nose and then remained essentially unchanged for the duration of the imaging period, with no fluid moving into the nasopharynx. At the two higher doses (10 μL and 20 μL), fluid “overflowed” into the nasopharynx and so could reach more distal airways, the mouth, or the gut. This overflow dose subjected the nasopharynx to varying degrees of reciprocating fluid movement that periodically re-exposed the nasopharyngeal airway tissue to the dosed fluid.
The dynamics of contrast fluid delivery were tracked by measuring the total image intensity change of each frame, compared with baseline, as a surrogate measure of the fluid volume contained within the image frame. On average (see Fig. 3), there was consistent airway filling in the first 10 sec (during which ∼4 μL of fluid was delivered). For the 4 μL dose, there was a gradual small reduction after instillation ceased. For the 10 μL dose, the amount of contrast fluid continued to increase until ∼14 sec and was followed by a gradual reduction that occurred prior to delivery ceasing. At the highest dose (20 μL), the amount of fluid continued to increase until ∼19 sec (at which point ∼10 μL of fluid had been delivered). There was substantial variability in the amount of contrast fluid present thereafter.
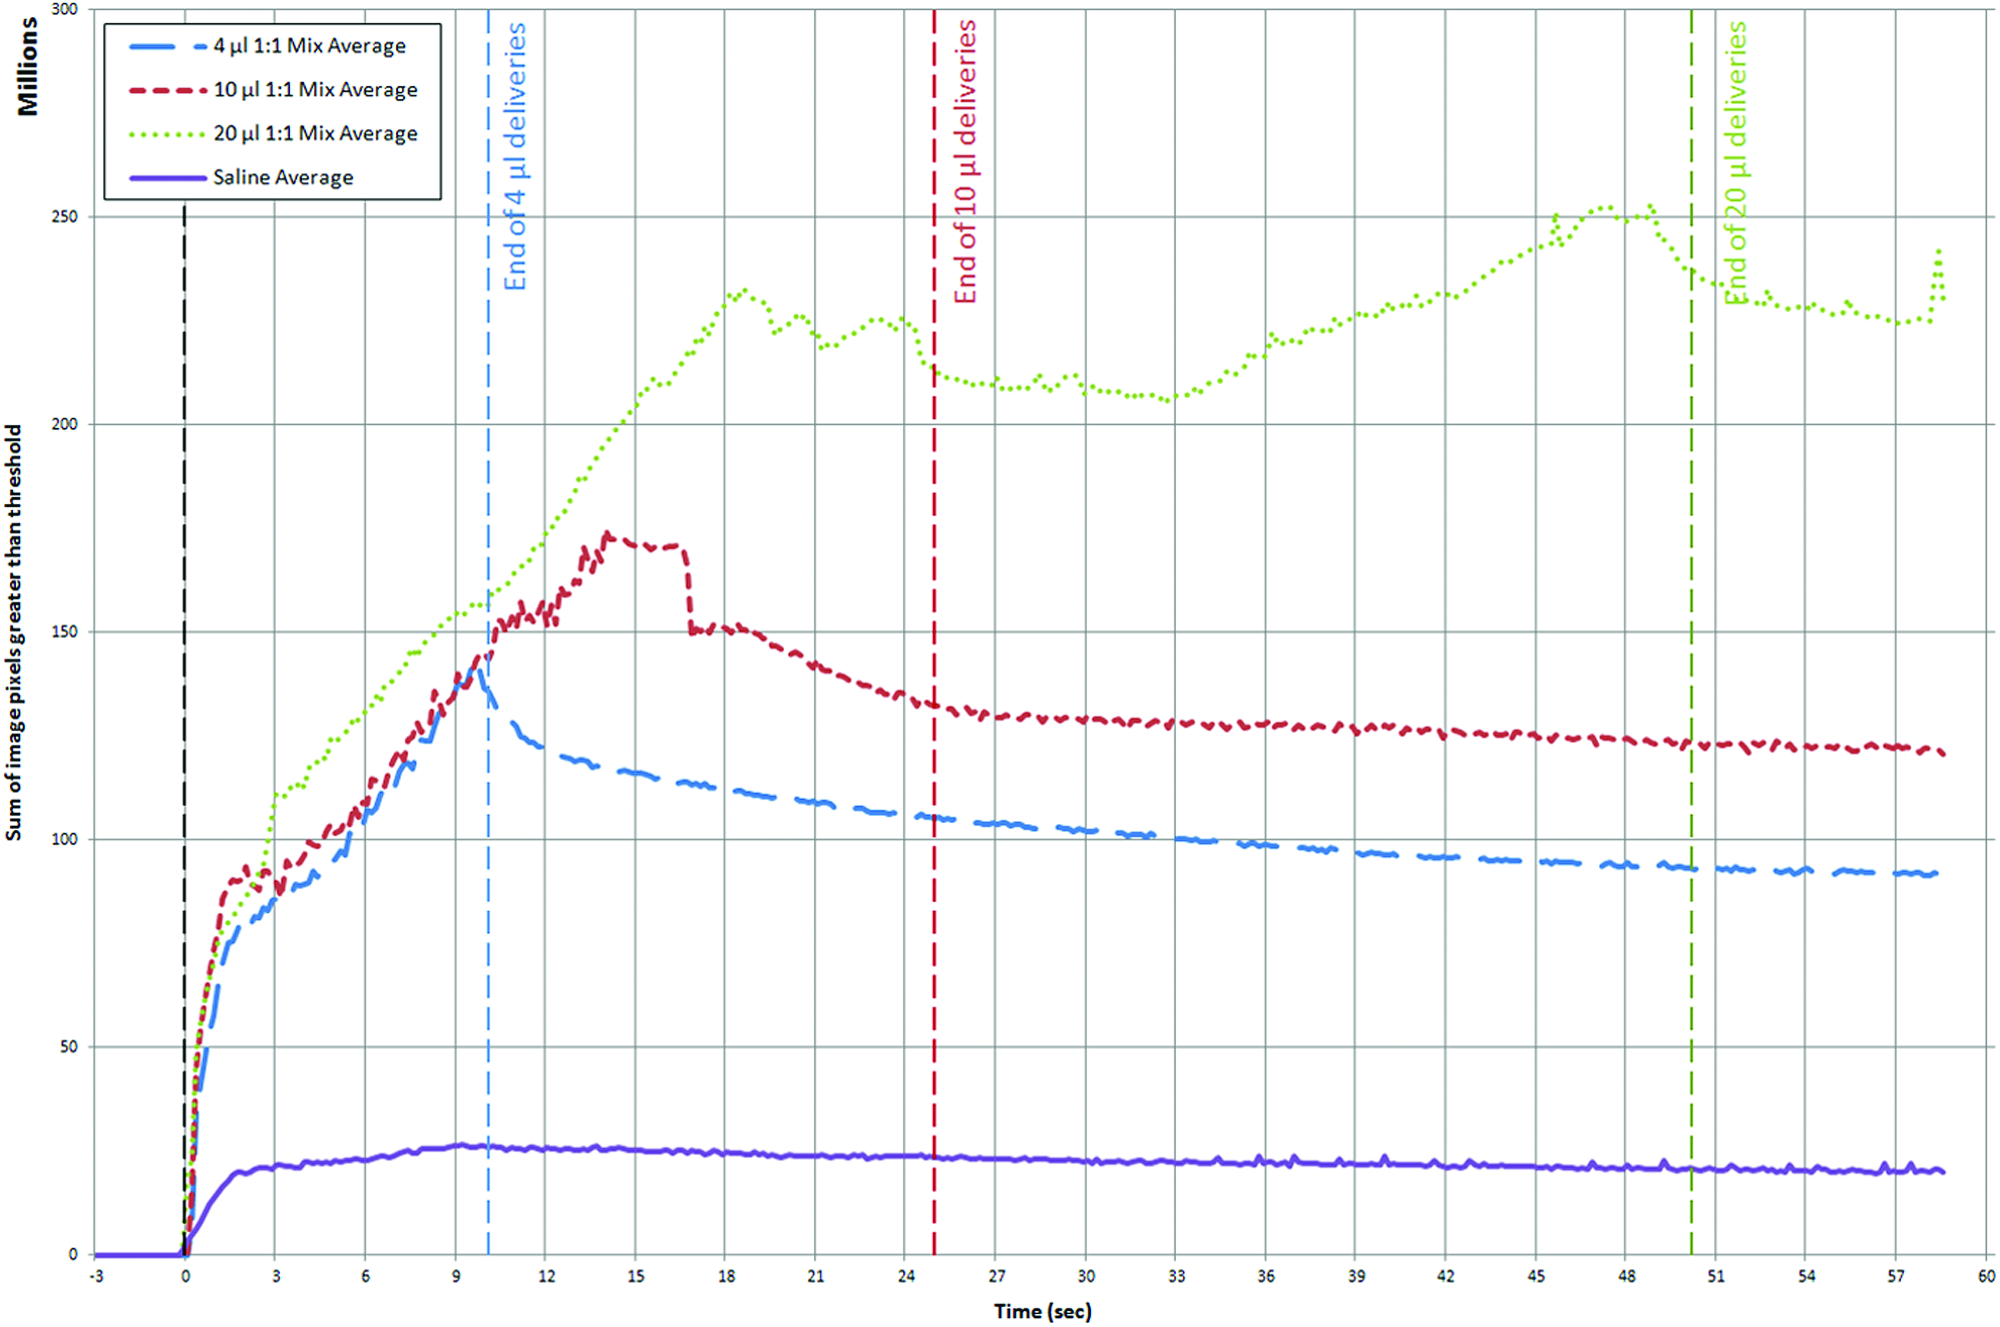
Average pixel intensity over time for each group. Vertical blue, red, and green dashed lines mark the end of the 4 μL, 10 μL, and 20 μL dose deliveries, respectively. Note that the initial constant increase represents filling of the anterior nose. The change in the slope of the lines (10 μL at 14 sec and 20 μL at 19 sec) reflects the fluid overflowing from the posterior nasopharynx and disappearing from the field of view (likely into the trachea). Note that the green, red, and blue plots are averages for each mouse in the 4 μL, 10 μL, and 20 μL 1:1 contrast mix groups, respectively, but the purple line is the average of the 4 μL, 10 μL, and 20 μL saline mice because there was no difference between these groups. Color images available online at www.liebertpub.com/jamp
These studies revealed a number of interesting findings. Firstly, when normal saline was used as the dosing agent, it could be detected, albeit poorly, and mimicked the gross distribution of the contrast agent mix in the upper (anterior and olfactory) nasal airway (data not shown). Regardless of the delivered volume, normal saline did not produce sufficient image contrast to consider it a useful substitute for the contrast mix in these studies. Secondly, in one mouse that received a 20 μL dose of contrast mix, the nasopharyngeal airflow ceased for ∼45 sec along with complete filling of the nasopharyngeal meatus with contrast fluid (see Supplementary Video 2) before restarting. Thirdly, in many mice exposed to larger doses (10 μL and 20 μL), overflow contrast fluid eventually produced irregular periods of reciprocating fluid movement that permitted some fluid to move back into the olfactory region (see Supplementary Video 1). This overflow effect also deposited fluid in the entrance to the eustachian tube in the lower nasopharynx.
Lung dose delivery
In this study, the progress of delivered fluid into the lung was monitored by the change in X-ray contrast between breaths and was represented by green artificial coloring in the airways (see Fig. 4 and Supplementary Video 2). The use of a paralytic agent during the lung imaging studies minimized unwanted body movements. Both fluid volumes appeared well-tolerated, regardless of their effect upon delivery. At the end of the imaging period, the ventilatory excursions were normal and all animals were alive; heart movements were verified during the postexperimental analyses.

Lung bolus dose delivery. Images from two separate mice show the delivery of fluid boluses into the lungs via a cannula within the ET tube. The left image shows a 15 μL delivery and the right a 30 μL delivery. Note that both images are taken in the passive expiratory phase, shown by the indicator in the top right corner of each image. These frames were captured 25 frames (i.e., five breaths) after the initiation of dosing. The movement of the fluid through the conducting airways toward the alveoli is clearly visible in both animals. This panel is taken from Supplementary Video 2 and, although not visible here, fluid movement is detectable for longer in the 30 μL delivery than in the 15 μL delivery. Color images available online at www.liebertpub.com/jamp
Movement through bronchi and small airways was heterogeneous when fluid delivery did not interfere with lung expansion. Although fluid initially progressed primarily into either the left or right mainstem bronchi, in some animals a simultaneous bilateral distribution occurred. In some cases, fluid moved into the postcaval lobe, 20 but rarely did it enter the superior lobe. 20 Typically, the dose divided immediately upon entering the upper airways before distributing further into the distal airways and alveolar regions. Only in two mice did the bulk of the fluid distribute—over four breaths in both mice—to the distal airways and periphery in a relatively homogeneous manner. Tracking of the pixel sum in the left and right sides of the image showed that there was no statistically significant difference (n.s., paired t test, n=10) between the amount of fluid entering the left and right lungs (see Fig. 5). In all but one animal, distribution was equally split between the two sides.
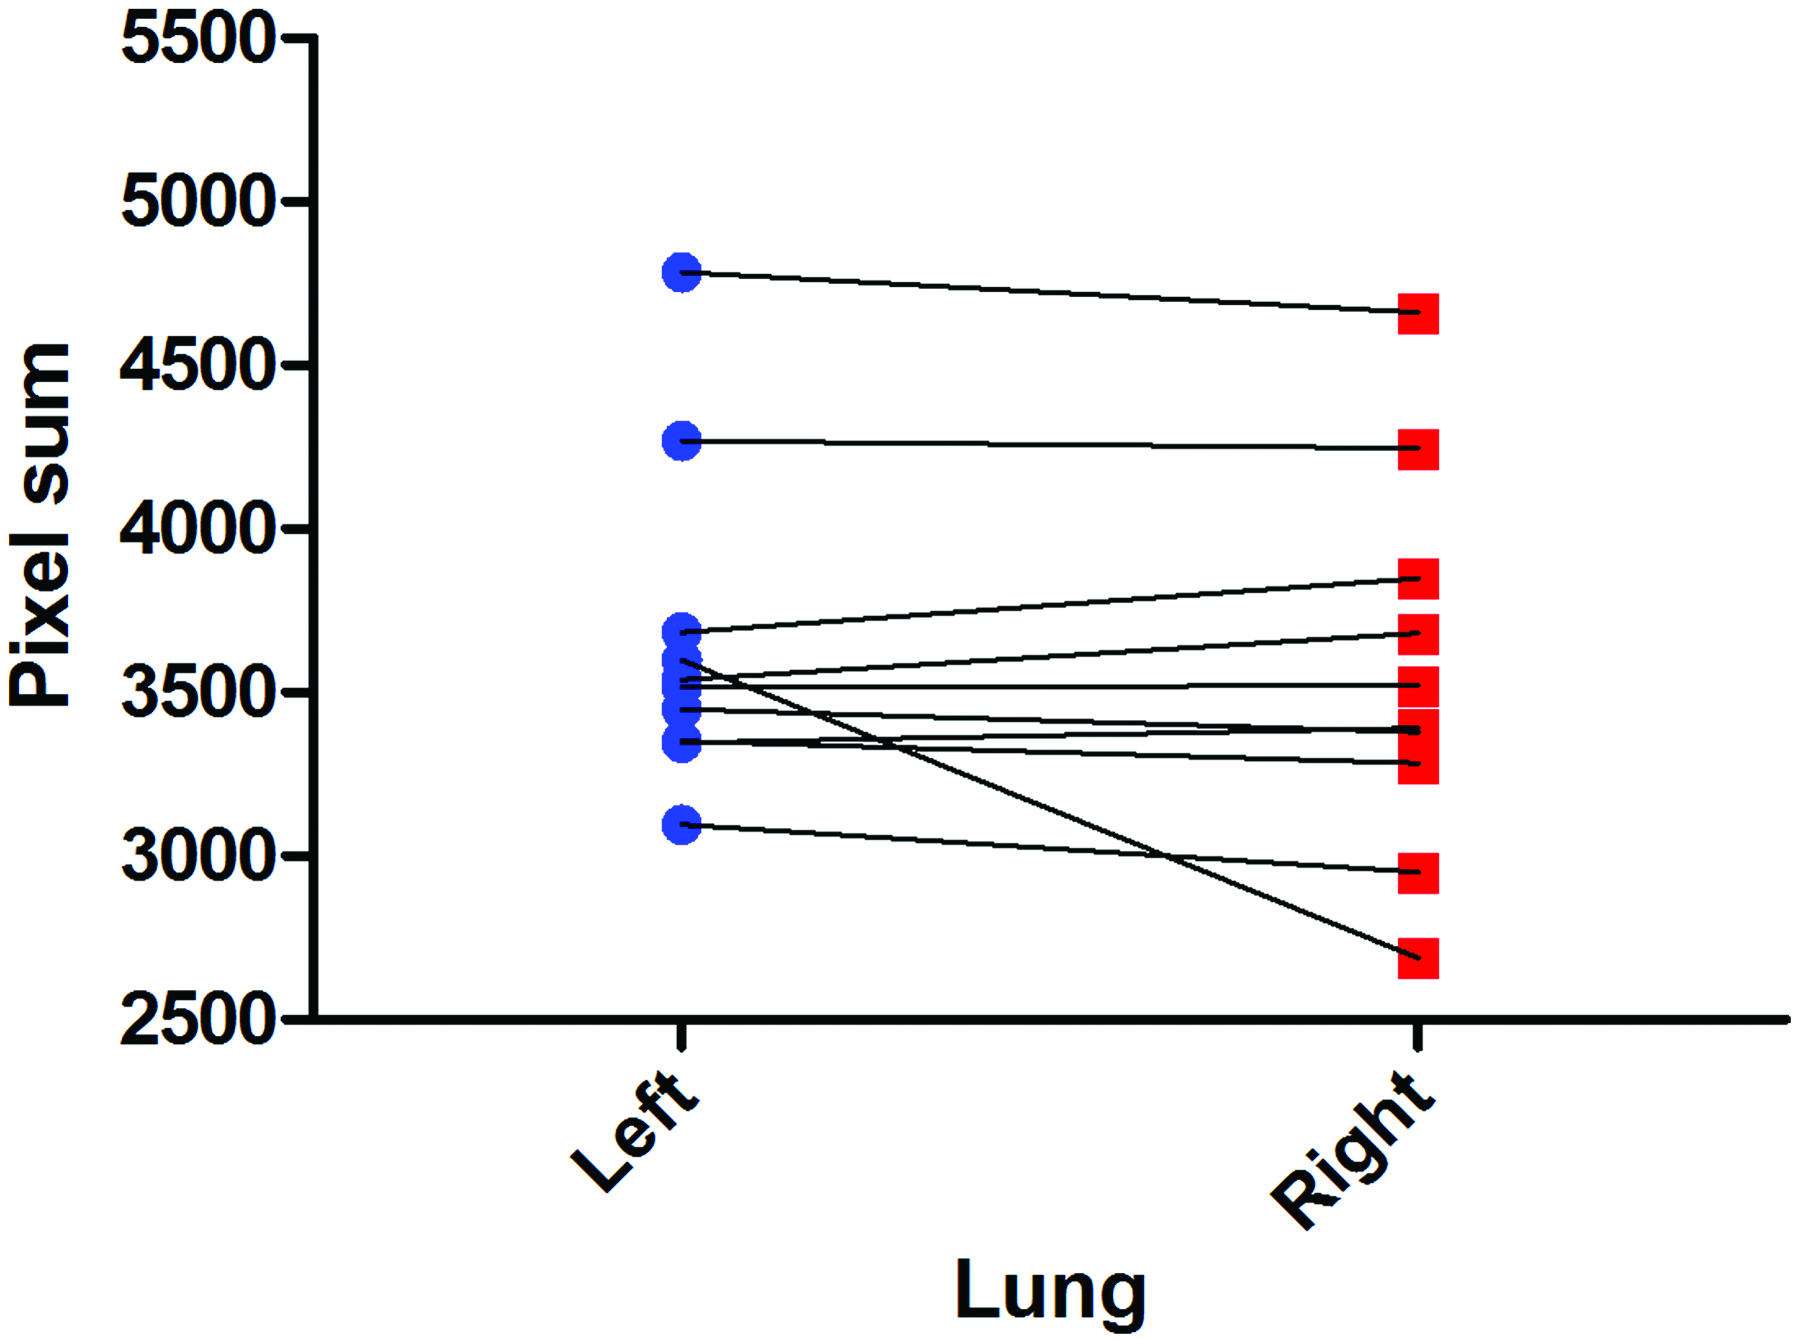
Proportion of fluid delivered to each lung. The mouse lung anatomy was simplified and assumed to consist of only left and right lung lobes that were divided along a vertical line passing through the carina. The amount of fluid entering each lung was semiquantitatively calculated based on the sum of the pixels from the frame-difference images, and was not statistically significantly different (n.s., paired t test, n=10). Only in one mouse did substantially more fluid enter the left lung than the right. Color images available online at www.liebertpub.com/jamp
Together these findings demonstrate that the distribution of fluid doses was not uniform, both in transit and when measured as a final distribution. In some cases, the fluid boli did not span the full width of the airways, appearing “drop-like” on the airway wall. Nevertheless, these partial boli moved progressively toward the periphery in concert with ventilatory flows. Depending on the anatomical orientation of the particular distal airway region, the fluid movement into that region could appear in a “starburst” pattern, clearly revealing the simultaneous distribution into several airway branches at once (see Fig. 6 and Supplementary Video 3). It was rare for substantial retrograde movement of the fluid dose to occur after it entered the mainstem bronchi.
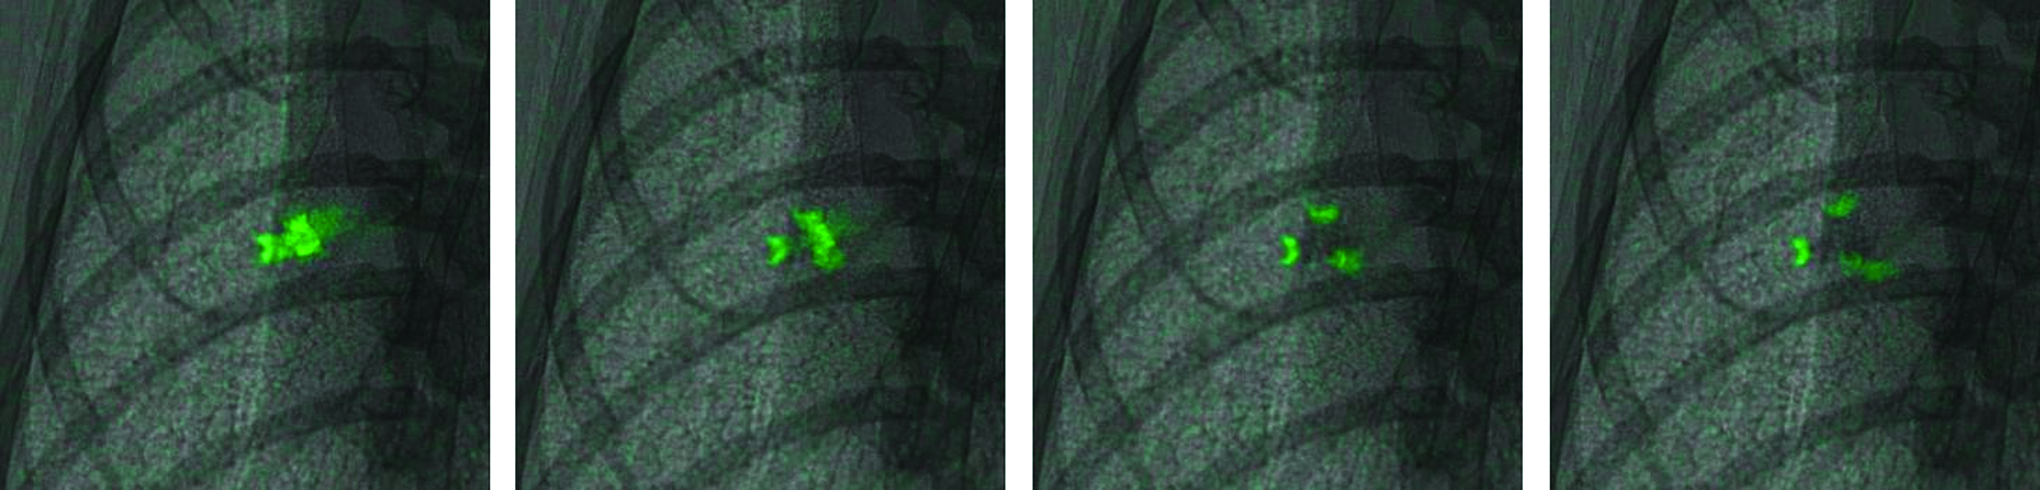
Fluid bolus splitting at an airway trifurcation. Four images from one mouse show a fluid bolus splitting into three separate boli at an airway trifurcation. Each image is ∼6.5×6.5 mm 2 and is located approximately in the middle of the left lung. Images are spaced 300 msec apart, and start ∼10 breaths (50 frames) after a 15 μL dose was delivered. This panel is taken from Supplementary Video 3. Color images available online at www.liebertpub.com/jamp
In some animals (three of 10 mice; 1×15 μL and 2×30 μL), fluid instillation resulted in a respiratory pause despite the ventilator continuing to operate, increasing the effective delivery time into the lung. In all cases, some of the fluid initially expelled from the delivery cannula back-filled between the ET tube and the inner tracheal walls and remained trapped there for the duration of the imaging. This fluid oscillated in the trachea around the ET tube with oscillations from the ventilator, and during respiratory pauses the oscillation was often apparent just distal to the ET tube. The oscillating fluid was often not artificially colored (appearing dark gray), because there was little fluid progression between breaths (and thus it was not colored green by the analysis algorithm). Despite the pause, the dose fluid slowly progressed down the trachea and normal ventilation appeared to resume when the oscillating fluid front reached the carina. Figure 7 shows the ventilator airway pressure spanning one of these events; airway pressure increased substantially and was sustained at a higher level during the pause, reducing immediately to slightly above the baseline pressure when normal ventilation resumed. In all animals, a peak in airway pressure observed at delivery of the dose was followed by a gradual reduction throughout the remainder of the study.
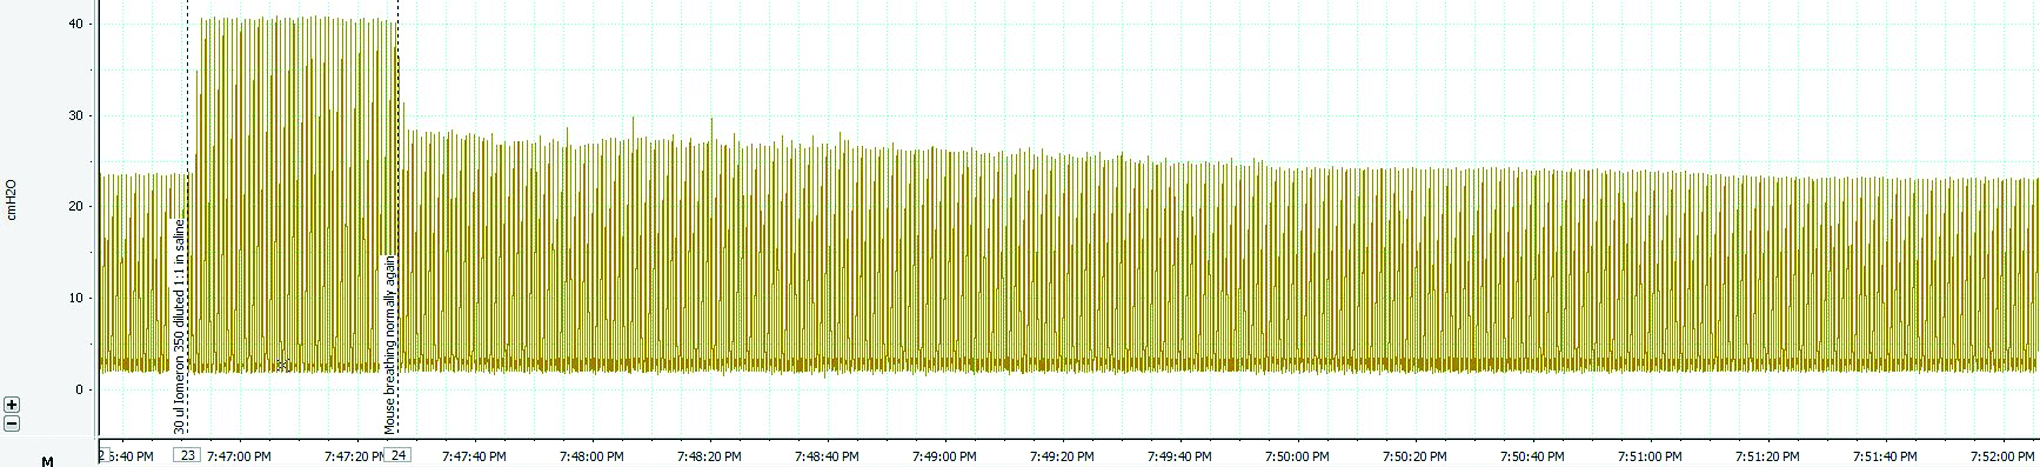
Airway pressure during lung dose delivery. The change in airway pressure during fluid delivery is measured by the ventilator pressure transducer. In this case, respiration paused immediately after fluid delivery despite ventilation continuing, with normal respiration returning ∼40 sec later. Color images available online at www.liebertpub.com/jamp
Discussion
The primary goal of this study was to document and understand the dynamics of fluid bolus dose delivery into the nose and trachea of live mice using synchrotron PCXI in a manner that would improve understanding of airway gene transfer dosing in mice. To our knowledge, these studies represent the first detailed analysis of real-time fluid dose delivery and distribution effects in the airways of intact mice, and we suggest these findings have wider application to the understanding of the variability and destinations of fluid doses delivered into mouse airways for many other types of respiratory research.
Our previous fluid dosing study 13 was limited by the slow image capture rate. In the nose, the capture rate was insufficient for visualizing the rapid fluid movements—for example, the filling of the nose (see Supplementary Video 1)—that occurred upon dosing. In the lung, the effectiveness of ventilation could not be visualized, because only a single image was taken immediately prior to each ventilator-driven inspiration (i.e., at the end of each breath). The primary effect was that, in the lung, the delivery dynamics within each breath, and their implications on dose distribution, could not be appreciated. In particular, the cessation of breathing that occurred in this current study in some mice immediately after fluid delivery may have also occurred in the previous study, but could not have been detected with that slower capture rate. In addition, the precision with which fluid movement could be tracked was improved in this study through the use of a paralytic agent; this minimized the occurrence of confounding respiratory and skeletal muscle movements.
Nasal airways
Our findings provide information pertinent to mice oriented vertically for nasal fluid dose delivery, as is common in a range of research settings. We have shown that specific regions of the nasal airways can be targeted by altering the dose volume. Furthermore, it is unlikely that the lung will be dosed if volumes less than ∼4 μL (in ∼20-g mice) are used. These dosing differences will be of value in targeting only the olfactory region for drug treatment studies. Although the use of larger volumes will access the nasopharyngeal airway, it is difficult to predict whether fluid movement would be localized to the wall on the treated side (Fig. 2, right), or reach all of the nasopharynx via the reciprocating movement of the dose that often eventuates (e.g., as occurred after the frame shown in Fig. 2, right; see Supplementary Video 1). The presence of reciprocating dose fluid after larger volumes also increases the likelihood of retrograde fluid delivery into the contralateral anterior nasal airways, and this effect may prevent use of the undosed nasal airway as a within-animal control site. Alternatively, the reciprocating fluid will tend to coat the circumference of the nasal lumen, which may be of benefit in circumstances where treatment of the entire nasopharynx lumen is desired.
As the contrast fluid entered the nasal airway, the magnitude of the difference in pixel intensity from baseline increased in proportion to the amount of contrast agent present. Figure 3 showed that we could provide a degree of quantification of the dynamic movement of the fluid through the nasal airways. That analysis revealed that the “holding capacity” of the portion of the mouse nose shown in these images is between 4 and 10 μL (∼7.5 μL based on Fig. 3). The implication for our nasal airway gene transfer studies is that 4 μL pre-treatment doses will be limited to the anterior nose, whereas 20 μL gene vector doses will reach both the nose and more distal regions, such as the lung or gut, as proposed in our previous study. 13
Lung airways
Despite using identical dose delivery conditions for each mouse, there was large variability in the manner in which the fluid distributed through the airways, as well as its ultimate destination in the lung. For most deliveries, the fluid initially went to either the left or right bronchi, although in some (n=2) a simultaneous bilateral delivery occurred. In all cases, the ET tube was set to a standard depth, well above the carina; however, the placement of the tip (i.e., orientation and angle) may have influenced this outcome. The preferential dosing of one side of the lung could be an effect of the ventilator and ET tube, or alternatively, it could be a normal physiological response to fluid dosing that has not previously been visualized. Importantly, this finding suggests that expectations of uniform dosing cannot be predicted from a bolus delivery into the upper trachea. Despite the observed variability in dosing, there was no statistically significant difference between the proportion of fluid measured entering the left and right lungs. This finding agrees with previously published data. 21 The presence of “drop-like” as well as full-lumen fluid advancement down the bronchi further reveals the variability that is present after otherwise uniform dosing procedures are performed. These findings help explain the patchiness of lung gene transfer we have experienced, 1 both within and between animals.
This technique also has the ability to highlight structural features within the lung. For example, the airway trifurcations that are a characteristic of the branching in mouse lung were revealed dynamically as the fluid doses split to the daughter airways (Fig. 6 and Supplementary Video 3).
In all animals, some fluid was trapped behind and around the projection of the ET tube in the trachea, with the distal edge of the fluid oscillating with ventilation. The presence of the ET tube and the viscosity of the dosing fluid may have influenced the retention or progression of fluid into the lung, presumably via surface-tension effects. We speculate that the splitting of the fluid front by the carina permitted the trapped fluid to be dispersed into the mainstem bronchi, allowing normal lung movement to resume. The return of airway pressure to near baseline (Fig. 7) could serve as an indicator of movement of a trapped tracheal dose into the main bronchi to distribute into the distal lung. The gradual reduction in airway pressure noted in all animals after fluid dosing is consistent with gradual dispersion and absorption of the delivered dose observed in the image sequences.
Compared with PET, SPECT, or planar gamma camera imaging, the spatial and temporal resolution of this PCXI technique is far superior, and these results could not have been obtained using any other technique. The high flux produced by the synchrotron (allowing high temporal resolution), combined with the ability to perform phase-contrast imaging (resulting in excellent anatomical detail and fluid localization), makes this technique unique in its ability to capture dynamic images of fluid dosing. We believe that this research tool has the ability to answer many questions related to fluid dosing, pulmonary drug delivery, and, it is hoped in the future, aerosol delivery to the airways of various animal models. However, in its current form and at the resolution used, it is unlikely to have application in humans, primarily due to the radiation level present (the amount of radiation delivered increases to the 4th power of the resolution 22 ). Nevertheless, some synchrotron facilities have begun to implement human clinical programs for other types of analyses, including mammographic imaging 23 and synchrotron stereotactic radiation therapy for cancer treatment. 24 The use of high-energy monochromatic synchrotron X-rays also enables phase effects to be detected without any absorption using a technique such as diffraction enhanced imaging. 25 This means it is theoretically possible to obtain X-ray phase images with zero absorbed dose. Clinical X-ray systems that use this mechanism are currently under development. With continuing advances in technology, human applications of synchrotron radiation are expected to evolve toward advanced, dose-acceptable imaging for use in the clinic.
This study has several limitations. The primary limitation is the requirement of using a synchrotron—of which there are ∼40 worldwide—to gather these image sequences with high temporal and spatial resolution. The need to deliver ionizing radiation also affects the type of studies that can be performed; low delivered radiation doses are essential if animals are allowed to recover after an imaging experiment. Nonetheless, we propose that these findings are unique and especially informative for respiratory researchers using mouse models. The requirement for a synchrotron also makes it logistically very difficult to perform this type of study using a reporter gene vector fluid dose (rather than a surrogate contrast fluid dose), which would allow the dose distribution to be correlated with resulting gene expression. The Biosafety level 2 conditions required for delivering our HIV-1–based LV vector are difficult or impossible to achieve in a synchrotron imaging hutch.
The iodine-based contrast agent is not a normal dose agent for airways and may alter the physiological response; however, we demonstrated that saline alone cannot be detected with sufficient sensitivity to be of value in monitoring dose distributions after delivery. In this study, we did not perform a detailed calibration to determine the relationship between X-ray absorption and the amount of contrast agent present in the airways. As a result, we cannot precisely quantify the amount of fluid present in the airways. However, in future studies, such calibrations should enable accurate fluid volume quantification to be performed. Although more important for long-term studies, the presence of the ET tube in the trachea after dosing is different from normal practice (it is typically removed after dosing), but was necessary to maintain ventilation in these paralyzed animals. The use of a paralytic meant that the mice could not cough or take large breaths when their airways were filled with dose fluid, so this may have altered the manner in which fluid distributed. The upright posture may also alter the fluid distribution; however, this is the same technique we use for our actual gene vector deliveries into the nose and lung. Finally, in the lung analyses where there is little change in fluid position between matching time points in sequential breaths, the fluid movement within a breath is not well highlighted, resulting in the oscillation of fluid around the ET tube not being well visualized. Conversely, small lung-edge movements during breaths, particularly adjacent to the heart, result in those edges being colored green even though they do not originate from fluid movements. Despite these limitations, the movement of the green-colored airway fluids remains easy to visualize.
In summary, we have shown the value of high acquisition rate PCXI in discovering the nature of fluid flow into the mouse respiratory system. Our findings suggest that assumptions of even distributions in the nose or lung are unfounded; analyses should be mindful of the lack of distribution uniformity of agents delivered in fluid form.
Supplementary files
The supplementary files contain movie sequences showing the fluid motion in the mouse nose and lung, and are the source of the images shown in the figures. Images were captured at 6.67 Hz and include 3 sec of baseline before fluid delivery. All videos are Quicktime MP4 files, were encoded using the H.264 codec, and can be played using the free VLC Media Player (available at http://www.videolan.org/vlc/).
Supplementary Video 1: Nasal dose-response to instilled contrast fluid
Typical responses to 4-μL (left), 10-μL (center), and 20-μL (right) fluid (1:1 iomeprol and water mixture) doses to the nose of three different mice are shown. The retention of fluid in the upper portion of the nose and the overflow of additional fluid into the nasopharynx are apparent. Doses were delivered at the same rate and last for 10, 25, and 50 sec, respectively. The pseudo-coloring of each frame-image results was produced by a background-subtraction algorithm referenced to the first (predelivery) image. Compared with the reference frame, the red/yellow shows areas with increased contrast present, and the purple/blue color shows regions where contrast has been lost. Some movement of the mice is visible over time, as shown by the purple/blue colored areas of movement of the hair, skin, head, and jaws.
Supplementary Video 2: Lung dose-response to instilled contrast fluid
Green highlighting shows the typical responses to 15 μL (left) and 30 μL (right) of contrast fluid dosed into the lungs of two different mice. Fluid was delivered as a single bolus over 3.6 sec and 7.2 sec, respectively (maximum infusion rate). The indicator in the top right corner of each image shows the temporal position of the captured frame. When fluid is first expelled, it moves retrograde along the cannula and the ET tube (during expiration) and then enters the trachea and conducting airways (during inspiration). In the mouse on the right (30 μL), fluid is retained in the trachea for ∼20 breaths and resulted in a temporary halt in lung inflating despite ventilation continuing. Subsequently, fluid is then expelled into the conducting airways and inflation begins again.
Supplementary Video 3: Fluid bolus splitting at an airway trifurcation
Green highlighting shows the progression of a 15 μL fluid dose into the lungs of one mouse. Fluid was delivered as a single bolus over 3.6 sec (maximum infusion rate). In this mouse, a fluid bolus is visible moving down the left main bronchus before splitting into three separate boli at an airway trifurcation.
Footnotes
Acknowledgments
Studies were supported by the NH&MRC Australia, with additional support from philanthropic donors via the CURE4CF Foundation ( ). The synchrotron radiation experiments were performed on the BL20B2 beamline at SPring-8, with the approval of the Japan Synchrotron Radiation Institute (JASRI) under proposal number 2011A1306. Prof. Naoto Yagi and Dr. Kentaro Uesugi provided expert synchrotron imaging, X-ray, and control advice and assistance at the SPring-8 synchrotron. All authors were supported by the International Synchrotron Access Program (ISAP) managed by the Australian Synchrotron. The ISAP is an initiative of the Australian Government being conducted as part of the National Collaborative Research Infrastructure Strategy.
Author Disclosure Statement
No conflicts of interest exist.
References
Supplementary Material
Please find the following supplemental material available below.
For Open Access articles published under a Creative Commons License, all supplemental material carries the same license as the article it is associated with.
For non-Open Access articles published, all supplemental material carries a non-exclusive license, and permission requests for re-use of supplemental material or any part of supplemental material shall be sent directly to the copyright owner as specified in the copyright notice associated with the article.
