
Abstract
Abstract
Background:
In the adenosine 5′-monophosphate (AMP) bronchial challenge test, AMP is usually administered according to dosing protocols for methacholine. We investigated whether the 2-min tidal breathing challenge test for methacholine is applicable to AMP. Parameters known to affect nebulizer output were studied. Our aim was to determine whether control of additional parameters is needed for currently standardized protocols.
Methods:
The study was performed with the Sidestream nebulizer from the APS Pro Aerosol Provocation System (CareFusion Respiratory). The effects of AMP concentration, jet pressure, and suction flow rate on nebulizer output rate and aerosol droplet size distribution were determined.
Results:
The volume median diameter for water increased from 5.10 μm to 8.49 μm when the jet pressure was reduced to obtain the prescribed output rate of 0.13 mL/min. The output rate was increased when a suction flow rate was used to remove the aerosol. Increasing the AMP concentration resulted in smaller droplets and a lower output rate when a suction flow was applied.
Conclusions:
The effects of AMP concentration on nebulizer performance may result in changes in the administered dose and site of deposition of AMP at dose escalation. All of the investigated parameters influence nebulizer performance, hence the outcome of a bronchial challenge test. Therefore, these parameters should not only be specified in challenge testing, but be actively controlled as well.
Introduction
AMP is often administered following the dosing protocols described for methacholine, such as the 2-min tidal breathing method.(13,14) Both the European Respiratory Society (ERS) and American Thoracic Society (ATS) adopted the 2-min tidal breathing method as one of the preferred methods for methacholine challenge testing in their official guidelines of 1993 and 1999, respectively.(15,16) In 2003, the ERS Task Force on Indirect Airway Challenges published their report, which included adenosine (AMP) as a challenge agent. The report stated that dosing protocols with doubling concentrations (such as the 2-min tidal breathing method) are recommended for AMP.(17) Both the 1993 and 1999 guidelines for methacholine aim to standardize the parameters that are of critical importance to the test results. With such standardization, the consistency of test results is aimed to be independent of the location of testing. For the 2-min tidal breathing method, the prescribed parameters are droplet size [mass median aerodynamic diameter (MMAD), 1.0–3.6 μm (ATS) or 1–4 μm (ERS)], output rate (0.13 mL/min), and nebulization time (2 min). Especially the ATS statement offers detailed practical guidelines and suggestions for methacholine challenge testing.(16) Factors that may affect the test results are described, and the authors stress the importance of accuracy in order to obtain valid test results.
Remarkably, it has never been thoroughly investigated whether such dosing protocols are indeed suitable for AMP. Therefore, the aim of our study is to evaluate the applicability of the 2-min tidal breathing method for AMP, according to the ATS guideline for methacholine. We investigated whether it is possible to use the guideline as a universal dosing protocol, regardless of the compound, or whether separate protocols should be developed for the specific compounds used in bronchial challenge testing.
In addition, the variables that are known to affect nebulizer output were investigated. As many critical parameters in this test are not only inherent to the specific stimulus that was investigated (AMP), but also to challenging by nebulization in general, findings of this study may apply to other compounds, e.g., methacholine, and to other dosing protocols, e.g., the five-breath dosimeter method, as well. Our aim was to determine if better control of prescribed and essential parameters is necessary for currently standardized protocols.
Materials and Methods
Nebulizers and AMP
The APS Pro Aerosol Provocation System manufactured by CareFusion Respiratory (Yorba Linda, CA) was used with the MedicAid Sidestream nebulizer that is supplied with this system. For comparison purposes, a second Sidestream nebulizer was obtained from Romedic BV (Meerssen, The Netherlands). The sodium salt of AMP (product no. A1752) was purchased from Sigma-Aldrich (Zwijndrecht, The Netherlands), which is the product the ERS advises to use in AMP challenge testing.(17) Sodium chloride (Ph. Eur.), used for the preparation of 0.9% saline, was purchased from BUFA/Spruyt Hillen (IJsselstein, the Netherlands).
Characterization of the AMP solutions
Aqueous AMP solutions of 1.25, 2.5, 5, 10, 20, 40, 80, 160, and 320 mg/mL were prepared. Concentrations of the AMP solutions were determined by UV spectroscopy at 254 nm (UNICAM UV 500; ThermoSpectronic, Cambridge, UK), and the relative viscosities of the solutions compared with water were measured using a Ubbelohde viscometer. The refractive indices were obtained with a Refractometer RL (Varimex, Warsaw, Poland). All measurements were performed in triplicate. The refractive index of the solutions as a function of the AMP concentration was found to be linear in concentrations between 1 and 300 mg/mL (R2=0.9996, 18 data points).
Experimental setup
The test setup used in the laboratory experiments consisted of the nebulizer, a filter, and the socket of the APS Pro system that holds the nebulizer and filter. The nebulizer was connected to a compressed air supply system (mains). Jet pressure was adjusted with a digital pressure gauge (DigiGauge, Rototherm, Port Talbot, UK). A timer-controlled solenoid valve was included to adjust nebulization times to exactly 2 min. A suction flow was created using a vacuum pump that was connected to the socket. Suction flow rate was set using a calibrated venturi meter and flow controller.
Measurement of the nebulizer output rate
The nebulizer output rate (in milliliters per minute) without suction was determined for the AMP solutions as described in the ATS guideline(16) (jet pressure 1.5 bar). The guideline mentions that the English Wright nebulizer (Roxon Medi-Tech, Montreal, PQ, Canada) is generally used for this method, but that the use of other brands of nebulizers with similar characteristics is acceptable as well. The English Wright nebulizer has never been available in many countries, and nowadays it is not manufactured anymore. Therefore, we conducted our experiments with the Sidestream nebulizer that is supplied with the Aerosol Provocation System, a system that has been developed specifically for (methacholine) challenge testing and that is widely used in this respect. Three milliliters of room temperature solution was nebulized for exactly 2 min. The output rate was calculated from the pre- and postnebulization weight of the nebulizer.
Subsequently, the nebulizer was connected to the vacuum pump to remove the aerosol from the nebulizer at a stationary suction flow rate of 30 L/min, and the measurement of the output rate was repeated. The suction flow rate of 30 L/min was chosen as the representative average flow rate through a nebulizer based on the range of peak inhalation flow rates of adult healthy volunteers (25–48 L/min) and asthma patients (23–90 L/min) as measured during normal breathing.(18) All measurements, unless stated otherwise, were performed in triplicate. All measured data for the nebulizer output rate based on weight were corrected for the differences in density of the AMP solutions to obtain the output rate in milliliters per minute.
Measurement of the aerosol droplet size distribution
The droplet size distribution of the generated aerosol of water was measured intermittently for 2 min of nebulization with a HELOS BR laser diffraction apparatus (Sympatec, Clausthal-Zellerfeld, Germany) using an inhaler adapter similar to INHALER 2000 (Sympatec)(19) and a 100-mm (R3) lens (measuring size range, 0.5–175 μm). A stationary suction flow rate of 30 L/min was applied to direct the aerosol from the nebulizer through the laser beam. During each 2 min of nebulization, four measurements were conducted. The measurements lasted 10 sec, and the first measurement was synchronized with the start of the nebulization process. Interval times between the measurements were set to 20 sec to cover the entire nebulization time of 2 min. This measurement scheme was duplicated for each solution, yielding mean values of eight measurements per drug concentration. Calculations were based on the Mie theory, using a value of 1.333 for the refractive index and a value of 0 for the imaginary part of this index.
The aerosol droplet size distributions of the AMP solutions were measured following the same procedure. For the calculations, measured values were used for the refractive index of the AMP solutions and a value of 0 for the imaginary part of this index.
Measurement of the effects of jet pressure on nebulizer output rate and aerosol droplet size distribution
Jet pressure was adjusted to 0.5, 1.0, and 1.5 bar to determine its effects on the output rate (for 0.9% saline and water) and the aerosol droplet size distribution (for water). Measurements were performed according to the methods described above. Water and saline were used for the measurements, not the AMP solutions, to allow us to allocate the effects to jet pressure, and eliminate the possibility of effects caused by changes in AMP concentration.
Measurement of evaporative water losses
Evaporative water losses were determined indirectly by measuring the difference in AMP concentration before and after nebulization. AMP concentrations were measured by refractive index analysis of the solutions.
Data analysis
The volume median diameter (VMD) was derived from the cumulative volume distribution curve as a function of the laser diffraction diameter. Data for the VMD (in micrometers) and output rate (in milliliters per minute) are presented as means (±standard deviation). Unpaired Student's t tests (two-sided) were performed for statistical analysis. Probability values (p) of <0.05 were considered statistically significant.
Results
Characterization of the nebulizers
The APS Sidestream was found to be a modified version of the standard (control) Sidestream. In Figure 1, the difference in design between both cups is shown. The original design of the Sidestream has an open vent in the central outlet tube, whereas the APS Sidestream is closed. This results in a shift in droplet size distribution toward larger droplets. When operated with water at a jet pressure of 1.5 bar, ambient conditions (relative humidity, 39%; temperature, 20.5°C), and a suction flow rate of 30 L/min, the VMD is 5.10 μm for the APS Sidestream and 3.15 μm for the standard Sidestream. As the water droplets are perfectly spherical and have unit density, the VMD equals the MMAD.(20)
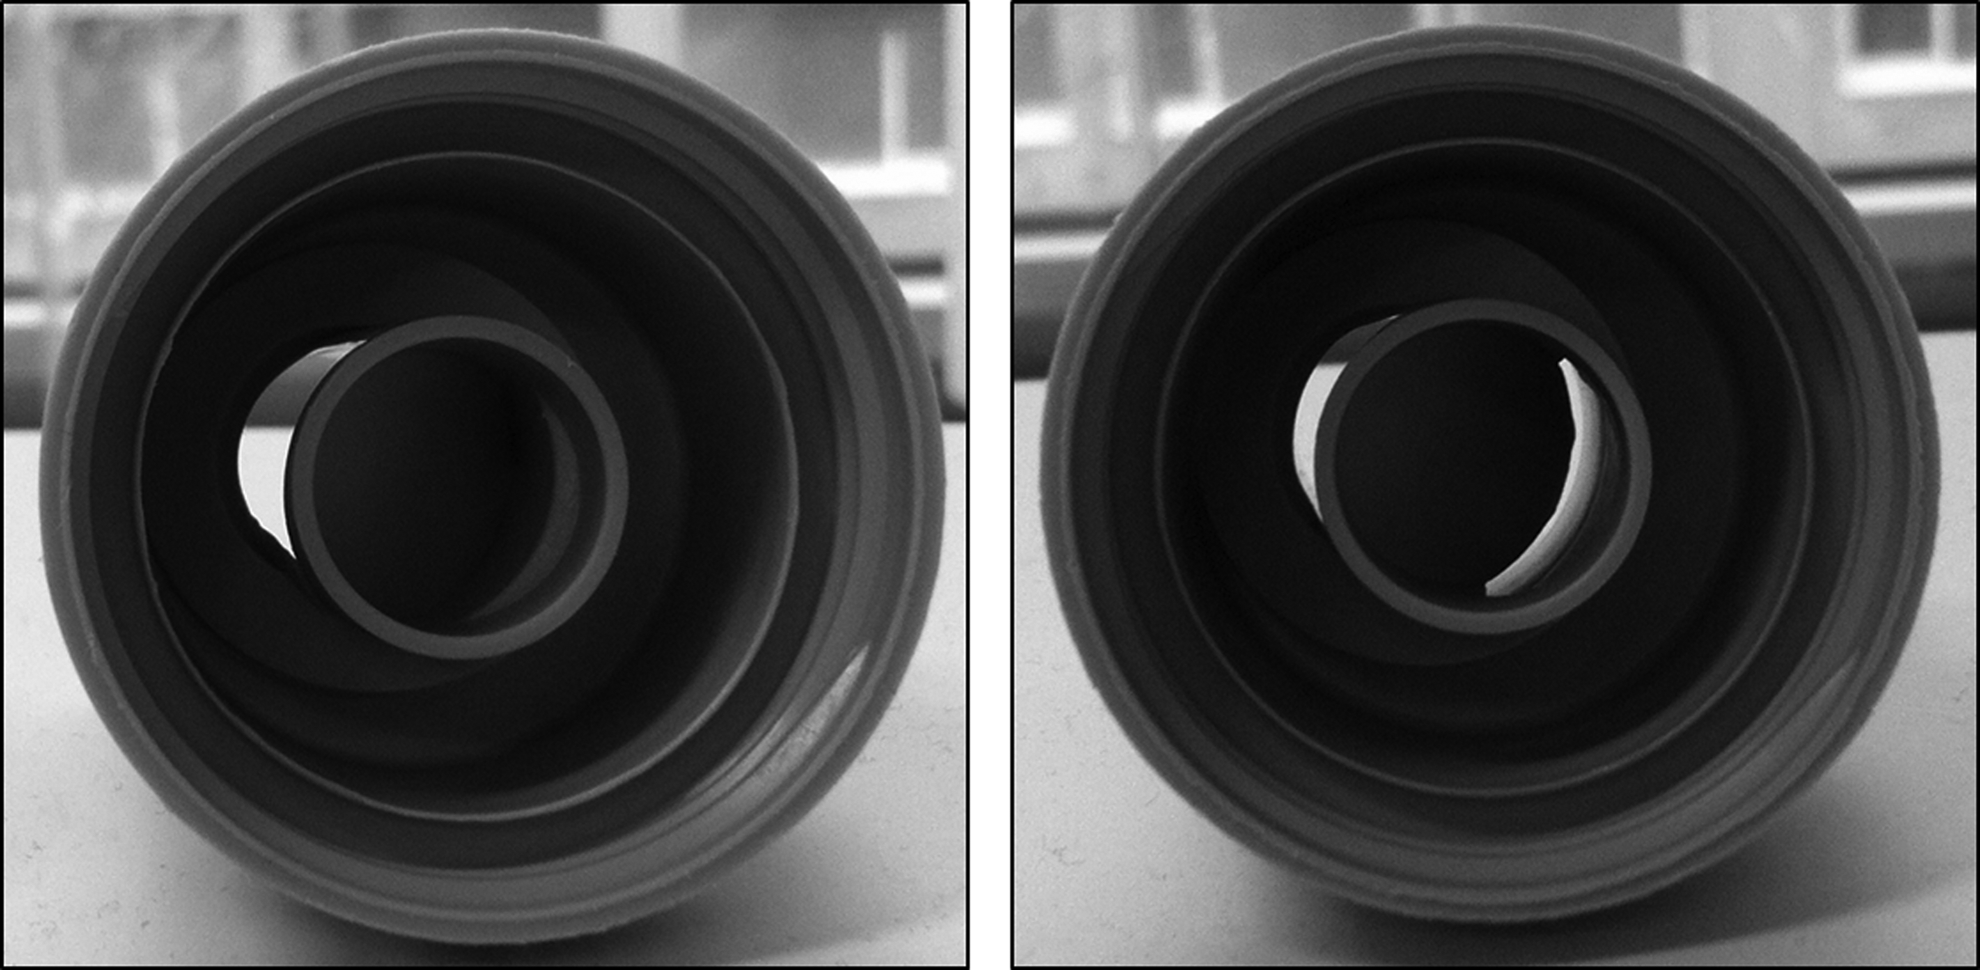
Difference in design of the APS Sidestream (left) compared with the control Sidestream (right).
Influence of jet pressure on the nebulizer output
The effect of varying the jet pressure on the output rate of the APS Sidestream is presented in Table 1. Measurements were performed with both 0.9% saline and water to verify that these liquids show comparable nebulization behavior. When the ATS procedure is followed, a jet pressure of about 0.5 bar results in the required output rate of 0.13 mL/min. When a stationary suction flow rate of 30 L/min is applied to remove the aerosol from the nebulizer, the output rate increases significantly to about 0.19 L/min (p<0.001).
ATS, determined according to the procedure in the ATS guideline; 30 L/min, determined using a stationary suction flow rate of 30 L/min.
n=3 (mean±SD).
The effect of jet pressure on the aerosol droplet size distribution for water is shown in Figure 2. A significant increase in droplet size was observed when the jet pressure was reduced from 1.5 to 0.5 bar (p<0.001). At 0.5 bar, the VMD (X50 in the chart) was 8.49 μm, whereas it was 5.10 μm at 1.5 bar.
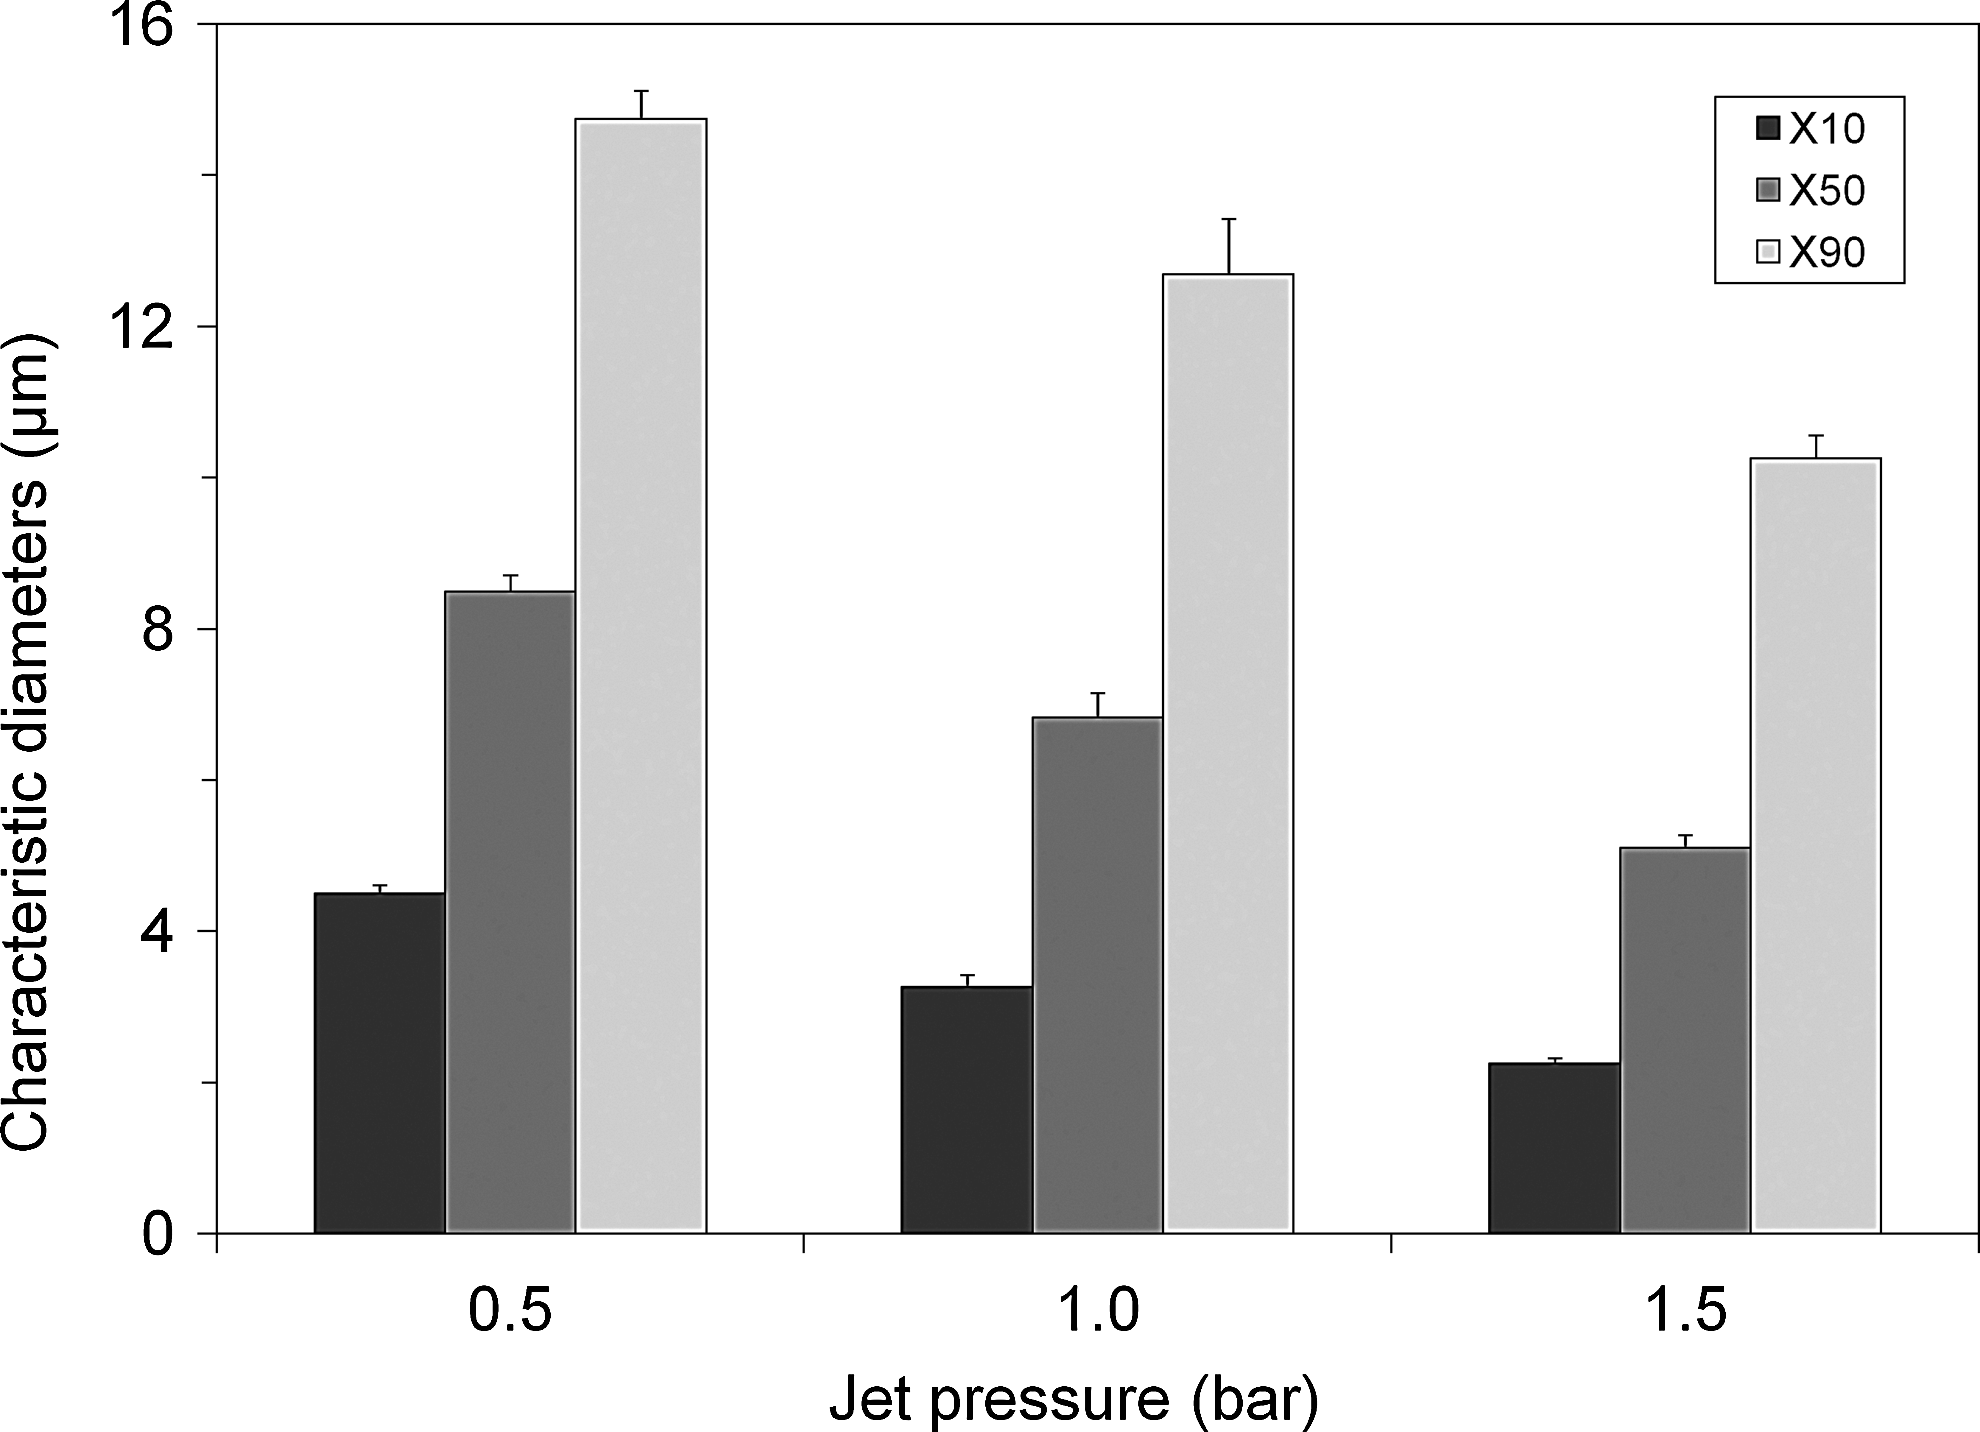
Influence of the jet pressure on the droplet size distribution for water from the APS Sidestream, using a stationary suction flow rate of 30 L/min (n=8, mean±SD). The characteristic diameters X10, X50, and X90 represent the 10%, 50%, and 90% values from the cumulative volume undersize curve. The X50 value equals the VMD.
Influence of AMP concentration on the nebulizer output
The effects of AMP concentration on the nebulizer output rate and VMD are summarized in Table 2. In this table, the 0 mg/mL AMP value is for water. No effect of AMP concentration on the output rate was found when determined according to the ATS procedure (no suction). However, the output rate increased when a suction flow was applied. This increase appeared to be concentration-dependent. Up to 5 mg/mL AMP, the output rate was comparable to the output rate of water (and 0.9% saline). The output rate of the medium-concentration solutions (10–160 mg/mL) was significantly lower (7–12%) compared with water (p<0.05). The output rate of the highest AMP concentration of 320 mg/mL was 20% lower compared with water (p<0.001), which was also significantly lower compared with the other AMP solutions (p<0.01).
ATS, determined according to the procedure in the ATS guideline; 30 L/min, determined using a stationary suction flow rate of 30 L/min; VMD, volume median diameter; RVwater, relative viscosity compared with water.
Jet pressure was 1.5 bar, n=3 (mean±SD).
Concentrations are by approximation for clarity.
n=2; mean and individual data are shown.
Table 2 furthermore shows the effect of AMP concentration on the VMD. Up to 10 mg/mL, the VMD was comparable to that for water. A distinct shift to finer droplets was observed for concentrations of 20 mg/mL and higher (p<0.001). This shift coincided with the increase in viscosity, as shown in the fifth column of Table 2. In Figure 3, the entire aerosol droplet size distributions are shown (data of 1.25, 2.5, and 5 mg/mL are omitted for clarity).

Influence of the AMP concentration (0–320 mg/mL) on the droplet size distribution from the APS Sidestream, operated at 1.5 bar jet pressure using a stationary suction flow rate of 30 L/min (n=8, mean±SD). C, AMP concentration; VMD, volume median diameter.
Evaporative water losses
AMP concentrations before and after nebulization were measured for the solutions used to determine the effect of AMP concentration on the droplet size distribution. The remaining solutions from duplicate experiments were combined in the same vial per concentration, so only one measurement could be performed. Therefore, the results shown in Table 3 are only qualitative. An increase in AMP concentration of 4–8% was observed over the entire concentration range. No correlation between the concentration and the extent of evaporation was found.
Data were determined using a stationary suction flow of 30 L/min. Jet pressure was 1.5 bar, and nebulization time was 2 min. Data shown are single experiments and only qualitative.
Discussion
In this study, we investigated whether the 2-min tidal breathing protocol is suitable for AMP bronchial challenge testing using the APS Sidestream nebulizer. According to the manufacturer's specifications, this nebulizer has an output rate of 0.24 mL/min, when operated at a jet pressure of 1.5 bar (jet flow 7 L/min). When it is operated without suction flow, as described in the ATS guideline, the output rate at 1.5 bar jet pressure corresponds with the specifications. Decreasing the jet pressure to 0.5 bar decreases the output rate toward the value of 0.13 mL/min. This was the value obtained with the Wright nebulizer and has become the “gold standard,” as specified in the most recent ATS guidelines. However, when a suction flow rate of 30 L/min is applied, an increase to 0.19 mL/min is obtained (Table 1). These differences in output rate indicate how sensitive the system is to jet pressure and suction flow rate. In a challenge test, the suction flow is applied by the patient. We chose a suction flow rate of 30 L/min as the representative average flow rate through a nebulizer, as explained in Materials and Methods. We did not investigate the effect of varying the suction flow rate on the nebulizer output, although the patient's inspiratory flow rate can be controlled at a lower flow rate using an electronically controlled inhalation system. It has been shown that such controlled slow and deep inhalations may lead to a higher total lung deposition.(21) However, a previous study at our department showed that a lower suction flow rate resulted in an increased droplet size distribution.(20) Moreover, the effects of jet pressure on droplet size appeared to be more pronounced at lower suction flow rates.(20) Therefore, the consequences of changing the suction flow rate may not be straightforward, and the value of extensively studying the influence of the suction flow rate on nebulizer output in a laboratory setting may be limited. We performed these measurements to test the robustness of the challenge test, and not to quantify all of the effects.
The manufacturer of the Sidestream nebulizer claims that it produces aerosol droplets with an MMAD of 3.2 μm. However, the results from our study showed that the design modification of the APS Sidestream led to an increase in the VMD from 3.15 to 5.10 μm (for water) at 1.5 bar jet pressure and a suction flow rate of 30 L/min compared with the standard Sidestream. Our study is not the first to report this deviation from the specifications. In another study with the APS Pro system, an MMAD of 5.1 μm was found as well, although the authors did not discuss this difference.(22) A third study reported an MMAD of 3.2 μm.(23) As no information is given on how this value was obtained, it could be that this was taken from the manufacturer's specifications. Another explanation would be that both types of Sidestreams are randomly used for the APS Pro system. Either way, our results show that the special APS nebulizer cup cannot be replaced by the standard Sidestream without consequences.
The ATS guideline defines MMADs for the aerosol within the range of 1.0–3.6 μm. Decreasing the jet pressure, as would be necessary to meet the requirements for the output rate, increases the droplet size, as shown in Figure 2. Additional effects of AMP concentration and suction flow on the nebulizer's output rate (Table 2) and aerosol size distribution (Fig. 3) make it virtually impossible to meet both requirements regarding output rate and MMAD simultaneously over the whole AMP concentration range.
The effect of various parameters on the output rate and aerosol size distribution of jet nebulizers is well known from literature. It has been shown that a reduction of the jet flow results in a lower output rate, but also in the release of larger droplets.(20,24,25) Furthermore, the effects of the physicochemical characteristics of the solution have been the subject of research. Viscosity(26) and surface tension(26–28) were found to be relevant to output rate and aerosol size distribution, although no clear overall correlations between surface tension and these output parameters could be established.(26) Therefore, this characteristic was not investigated in this study. The solution's characteristics depend on the concentration of the solute,(29) which explains the differences in nebulizer performance at different AMP concentrations. The viscosity of the AMP solutions increases drastically, and we found a reduction of both droplet size and output rate at increasing AMP concentration (Table 2). These results are in line with the results previously described by Le Brun et al. for tobramycin.(29) Furthermore, it is important to realize that evaporated water is part of the output. Evaporative water losses result in an overestimation of the administered dose.(30) The changes in concentration presented in Table 3 show that evaporation occurs, resulting in an increase of the concentration of the remaining solution. The relative change is of the same order of magnitude across the entire concentration range. However, the absolute difference in concentration increases with increasing concentration, and so does the deviation of the truly administered dose from the anticipated dose.
Many of the parameters that were shown to affect nebulizer performance can be fairly well controlled or at least quantified during a bronchial challenge test. A highly relevant parameter that is most difficult to control is the patient's breathing behavior. We found that the output rate of the APS Sidestream increases when a suction flow is applied. This indicates that the patient's inhalation has an effect on the administered dose. The AMP concentration influences the output rate when a suction flow is applied. Although this implies that the administered dose is not consistent over the concentration range, this variation may be of minor importance compared with the variation in droplet size at increasing AMP concentrations. A reduction of the droplet size from 5 to 3 μm may significantly increase the (peripheral) lung deposition.(31)
The deviation in aerosol size distribution from the manufacturer's specifications, the differences found at different AMP concentrations, and the differences found when a suction flow is applied may have significant effects on the administered dose and site of deposition of AMP in a bronchial challenge test. Smaller aerosol droplets may result in a higher and/or more peripheral lung deposition,(31) whereas variations in output rate may lead to significant deviations from the anticipated administered dose. The difference in response to two subsequent doses is, therefore, not merely caused by the duplication of the concentration. The response to AMP is expressed as the PC20, the concentration of AMP causing a 20% decrease in forced expiratory volume in 1 sec (FEV1), which is calculated by linear interpolation.(17) However, our results show that such calculations are not correct, because more than one parameter changes at dose escalation.
In conclusion, we have demonstrated that the effects of the high AMP concentrations on nebulizer performance are so large that a straightforward dose comparison between the lower and higher concentrations is impossible. These effects are inherent to nebulization of the compound, so administering AMP according to the five-breath dosimeter method would not be different from the 2-min tidal breathing method. It appears that a nebulizer might not be the right device to administer AMP/adenosine for bronchial challenge testing in escalating concentrations.
Furthermore, our findings clearly show that all of the investigated parameters—concentration, viscosity, jet pressure, suction flow rate, and evaporation—influence the output of the nebulizer and, therefore, the outcome of a bronchial challenge test. We found that essential information on the influence of these parameters, especially the jet pressure (or flow), on nebulizer performance is lacking in the guideline. The recommendation to adjust the jet flow to obtain the desired output rate (of 0.13 mL/min) may lead to dramatic shifts in the droplet size distribution, as shown in this study for the APS Pro system.
We recommend that instead of dictating fixed values for the output rate and nebulization time, new guidelines should elaborate on adjusting the important parameters to obtain comparable outcomes. Jet pressure should be tuned to obtain the desired droplet size distribution, taking into account the effect of the concentration of the solution. Nebulization time should be adjusted according to the nebulizer's output rate to get the desired delivered dose. The patient should be instructed carefully on how to breathe, or nebulization time should be adjusted according to the patient's breathing behavior.
Another interesting, albeit more expensive, approach would be to use an electronically controlled inhalation system that regulates the inspiration volume and air flow in order to minimize the influence of the patient as much as possible.
Finally, we are currently investigating whether nebulization of AMP can successfully be replaced by dry powder adenosine.
Footnotes
Acknowledgments
We would like to thank M. Farenhorst from the Lung Function Laboratory of the University Medical Centre Groningen for the use of the APS Pro system and his technical assistance.
Author Disclosure Statement
The authors declare that no conflicting financial interests exist.