
Abstract
Abstract
Background:
Determination of the lung outline and regional lung air volume is of value in analysis of three-dimensional (3D) distribution of aerosol deposition from radionuclide imaging. This study describes a technique for using computed tomography (CT) scans for this purpose.
Methods:
Low-resolution CT scans of the thorax were obtained during tidal breathing in 11 healthy control male subjects on two occasions. The 3D outline of the lung was determined by image processing using minimal user interaction. A 3D map of air volume was derived and total lung air volume calculated. The regional distribution of air volume from center to periphery of the lung was analyzed using a radial transform and the outer-to-inner ratio of air volume determined.
Results:
The average total air volume in the lung was 1,900±126 mL (1 SEM), which is in general agreement with the expected value for adult male subjects in the supine position. The fractional air volume concentration increased from the center toward the periphery of the lung. Outer-to-inner (O/I) ratios were higher for the left lung [11.5±1.8 (1 SD)] than for the right [10.1±0.8 (1 SD)] (p<0.001). When normalized for the region sizes, these ratios were 1.37±0.16 and 1.20±0.04, respectively. The coefficient of variation of repeated measurement of the normalized O/I ratio was 5.9%.
Conclusions:
A technique for outlining the lungs from CT images and obtaining an image of the distribution of air volume is described. The normal range of various parameters describing the regional distribution of air volume is presented, together with a measure of intrasubject repeatability. This technique and data will be of value in analyzing 3D radionuclide images of aerosol deposition.
Introduction
D
Regional distribution of aerosol is ideally summarized by describing the relative deposition in peripheral and conducting airways. However, as it is not possible to identify the exact location of the two groups of airways in the images, the deposition pattern is usually estimated by dividing the lung into inner and outer volumes of interest that correspond approximately to the locations of the central and peripheral airways, respectively. An outer-to-inner (O/I) ratio can then be calculated from the relative amounts of deposition in the respective volumes. Note that the relative deposition is often described in the literature as the central-to-peripheral (C/P) ratio, which is simply the reciprocal of the O/I ratio.(6) The terms “outer” and “inner” are used in this article, as this terminology is recommended in the new guidelines from the International Society of Aerosols in Medicine on standardization of techniques for using radionuclide imaging for aerosol deposition assessment of orally inhaled products.(7)
The values of O/I ratio obtained in practice depend quite significantly on the size of the areas chosen. This dependency can be considerably reduced by normalizing the O/I ratio to lung volume. This has been demonstrated in both planar(8) and SPECT imaging.(9) Lung volume can be estimated using radionuclide transmission scanning or ventilation imaging, but both methods have disadvantages. Delineation of the lungs on transmission is imprecise due to the poorer resolution of the images, and ventilation does not reflect lung volume in poorly ventilated areas. The ability to use X-ray computed tomography (CT) for this purpose overcomes these limitations. CT is excellently suited for visualization and accurate measurement of air volume in the airway tree, and is being increasingly used for this purpose.(10) It provides maps of the linear attenuation coefficient of X-rays at an average energy of 70 kV. At this energy, the attenuation coefficients of low-atomic-number tissues, such as soft tissue and blood, are closely proportional to density.(11) This means that CT images of the lung reflect the local tissue density. By assuming a value for the average density of the soft tissue and blood in the lung, images of the regional distribution of air volume can be derived. With multidetector high-resolution CT, the whole lung field can be imaged in less than 10 sec, enabling images to be obtained while subjects hold their breath. The disadvantages of CT are its relatively high radiation dose and its accessibility. However, dose may be reduced using low-dose protocols (often referred to as low-resolution CT),(12) and the use of CT in conjunction with both gamma camera tomography (SPECT) and PET is becoming increasingly commonplace.
In this study, lung volume images have been acquired using low-resolution (and therefore low-dose) CT during tidal breathing in 11 healthy male subjects in the supine position. From these images, mean values of O/I ratios of lung volume were obtained, together with measures of intersubject variability. Each subject was imaged on two separate occasions, enabling the intrasubject reproducibility of the measurements to be assessed.
Materials and Methods
Subjects
The subjects described in this article were recruited for a project to validate computer predictions of aerosol deposition by comparison with experimental measurements using medical imaging.(13) Eleven healthy, never-smoker, male subjects, between 20 and 45 years old, were studied. Subjects had no evidence of respiratory disease and lung function tests within the normal range. This included being free from the common cold and rhinitis for at least 4 weeks before entry into the study. The study was approved by the local ethics committee and the Administration of Radioactive Substances Advisory Committee, and patients gave written consent to participate in it. The nature of the study was explained to the subjects, and each one signed a consent form. Measurements were made of height, weight, forced expiratory volume in 1 sec (FEV1), and functional residual capacity (FRC).
Acquisition of the CT scans
The CT scans were acquired as part of a combined SPECT-CT protocol on a GE Infinia dual head gamma camera with the Hawkeye 4 CT attachment (GE Medical Systems, Milwaukee, WI). However, in this study, only the acquisition and the results of the CT scans are considered. The participants were placed supine on the couch with the whole lung field included in the field of view. The CT scan consisted of 90 slices with an interslice separation of 4.42 mm. It used a peak voltage of 120 kVp and a current of 1.0 mA. Note that although the peak voltage applied to the X-ray tube is 120 kV, the average energy of the X-rays produced is less than this, usually around 70 kV. The image took approximately 4 min to acquire, and therefore provided a CT image of the thorax at mean tidal breathing. The effective dose received by the subjects from the CT procedure was 0.8 mSv. The CT images have a resolution of the order of 1 mm in the transaxial planes, but it is limited in the axial (superior–inferior) direction by the interslice separation of 4.42 mm. The resolution in all dimensions is blurred, as the image is obtained as an average over the tidal breathing cycle.
Segmentation of the lung space
The CT images were transferred to a workstation running the Portable Imaging Computer Software (PICS) processing system.(14) The analysis was carried out using a fully 3D approach, and therefore the first step was to convert the data to 4.42-mm cubic voxels. The increase in voxel size does result in a loss of resolution, but the effect of this is reduced because the CT images are blurred due to being acquired over the tidal breathing cycle. Also the cubic voxels match exactly the SPECT voxel size that the CT images will be used to interpret. It was next necessary to delineate the outer boundary of the lung envelope. CT images are calibrated in Hounsfield units (HU), which express the X-ray attenuation coefficient values relative to that of water. They range from about −1,000 for air to 0 for water. Bone and some soft tissues have positive HU values, due to having a relative density greater than 1, and in the case of bone, also increased atomic number. For the low-atomic-number elements in the lung, the HU values are approximately proportional to density. This means that lung voxels have significantly different HU values from soft tissue, and so it is straightforward in principle to separate them out from their surroundings. However, in practice, the algorithms to delineate the lung envelope are not straightforward. Some centers have devised complex algorithms with claims to be fully automatic.(15,16) However, these have not been applied to tidal breathing images such as those used in this study. Therefore, a semiautomatic approach has been applied to our data, which uses techniques reported by the other centers.
The manual intervention in the process consisted in defining the positions of the hila of the right and left lungs and a seed point in the trachea. The hilum was taken as the point of the first bifurcation of the main bronchus, which was readily visible from a coronal view for the right lung or a transaxial view for the left. The only other manual intervention required for a few scans was to define the point in the left–right direction separating the right and left lungs (xm). In some subjects, the right and left lungs come very close together and are not separated by the volume-growing algorithm described below. In these cases, manual definition of the point of separation enables the algorithm to distinguish between the lungs. The division of lung and soft tissue was generally based on a threshold of −350 HU, i.e., midway between a typical lung voxel at −700 HU and tissue at 0 HU. The density of peripheral lung tissue in the supine position has been shown to be around 0.30,(17) for which the CT number will be −700 HU. Studies in radionuclide imaging have demonstrated that the threshold correctly determining an object outline is approximately midway between the average voxel value at the edge of the object and that in the surroundings.(18) However, for the first step in the algorithm, a different threshold was necessary, for the reason described below.
From the seed point in the trachea, a volume-growing algorithm based on a threshold of −700 HU was applied. All voxels found with values below this threshold were included in a binary image of the trachea and main bronchi. This lower threshold value was used, as the trachea comes very close to the right lung in most subjects, and use of the usual higher threshold (−350 HU) allowed the volume-growing algorithm to leak into the right lung. The search was stopped at the right and left hila. The volume obtained was an underestimate of the true outline of the trachea and main bronchi, due to the use of the lower threshold value. It was therefore dilated by 1 voxel to give a better estimate of the true segmentation,
The whole airway tree,
Basic thresholding leaves some voxels that are clearly within the lung envelope, but outside the volumes defined above.(16) This is particularly the case with voxels containing the larger blood vessels near the hilum. To define a volume containing the complete lung envelope, a process of volume dilation followed by erosion by the same amount was used. The process of dilation adds to the volume of interest (VOI) a layer of voxels around each original voxel in the VOI. It therefore expands the volume at the periphery and also fills in gaps in the center of the volume. The process of erosion removes voxels that are not fully surrounded by other voxels. It therefore removes isolated voxels or voxels at the edge of a VOI, while generally leaving internal voxels unaffected. Therefore, the process of dilation followed by erosion leaves the lung periphery unaffected while filling in internal gaps—once the internal gaps are filled by dilation, they can no longer be removed by erosion. A dilation/erosion of 13 mm (3 voxels) was used for the right lung and 18 mm (4 voxels) for the left lung. These were found to give outlines in the region of the hilum that were consistent with visual estimates of the lung envelope. Finally, a process of erosion followed dilation each by 1 voxel (4.42 mm) and was used to remove spurious isolated points that appeared in most cases. Typical segmentation of the right lung from the CT image in a transverse slice is illustrated in Figure 1.
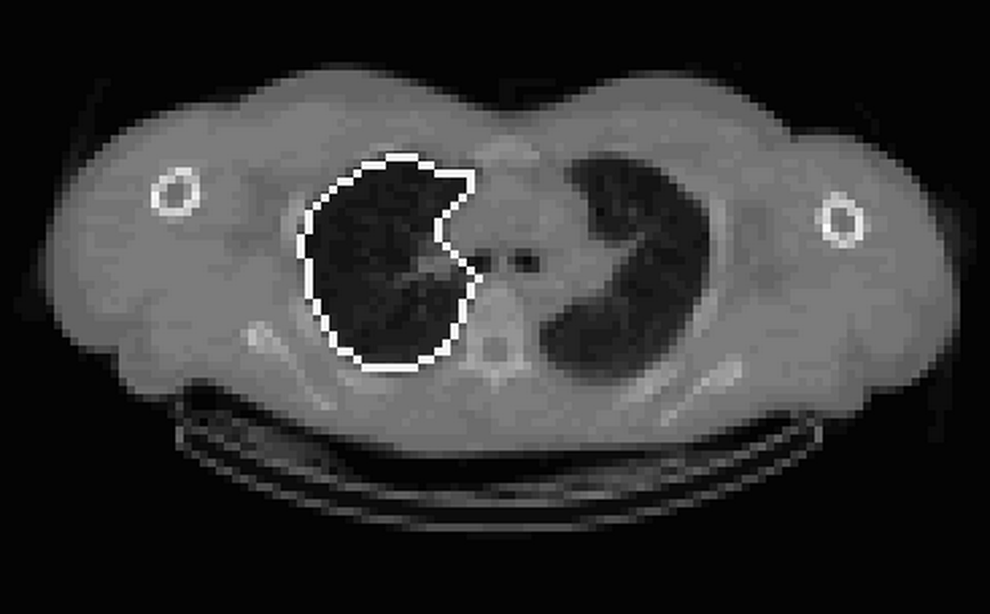
An example of the final segmentation of the right lung in the region of the right hilum. The outline remains close to the lung edge around the lung periphery and includes the vessels present in the area of the hilum.
Formation of the lung volume image
X-ray CT images consist of a map of attenuation coefficients for photons produced by the X-ray tube. For the energy used in CT, the attenuation coefficient for the soft tissue voxels in the lung can be assumed to be proportional to density. Therefore, the density of the voxel, ρv, can be calculated using the following equation:
where Iair, Itissue, and Ivox are the image intensity values for air, tissue, and the voxel under consideration, respectively. The fractional air volume concentration of each voxel (FAVC) can then be calculated as:
where ρt is the average density of the tissue and blood in the lung, which is taken as 1.05.(19) The air volume in the voxel is then FAVC.v where v is the voxel volume. Two-dimensional (2D) sections through a typical 3D image of air volume derived from CT are shown in Figure 2.

Example 2D transverse, coronal, and sagittal sections from a 3D air volume image obtained from a CT scan.
Calculation of lung air volume
The lung volume is calculated by summing the air volume in all the voxels in the lung envelope.(20) This simple summation will result in a small underestimate of volume due to the partial volume effect (PVE). This occurs due to the finite resolution of the images, which causes voxels on the boundary to have increased density, and hence falsely low estimates of air volume. However, this is compensated by voxels just outside the lung having reduced density, and therefore some apparent air content. To correct for this effect, the lung envelope was dilated by 1 voxel (4.42 mm) and the summation of lung air volume performed within this dilated volume. Both right and left lung air volumes were calculated.
Shell analysis of volume
A radial transform of the air volume image was carried out to describe the variation of air volume from center to periphery of the lungs. This used the hilum as the center of the transform. The lung volume was divided into 10 concentric shells.(21) An example coronal image showing the appearance of the 10 shells is shown in Figure 3. For each subject, the total air volume per shell, Vi, and mean fractional air volume concentration per shell, FAVCi, were calculated. The measured value of air volume and concentration in the outer shell, shell 10, will be reduced due to the PVE. To correct for this, the air volume concentration in shell 10, FAVC10, is assumed to be the same as that in shell 9, FAVC9, and the air volume in shell 10, V10, revised accordingly. The mean and standard deviation FAVC per shell across all subjects was calculated, and the intrasubject reproducibility was assessed. These data were summarized as a 3D O/I ratio defined by

A 2D coronal section through a segmented lung volume illustrating the division of the volume into concentric shells. Different shells are shown in different shades of gray with a dark central shell centered on the hilum and the shells being displayed with increasing brightness as they move more peripherally.
The expression of the regional distribution as an O/I ratio is used rather than its more common reciprocal, the C/P ratio, because it was recommended by the recently published guidelines on the standardization of techniques for the assessment of aerosol deposition from imaging.(7)
It has been clearly shown that quantification of the O/I ratio of aerosol deposition is improved if it normalized to the corresponding volume ratio.(9) Part of this normalization is the intersubject variation of the space volumes of the different regions. To investigate the importance of this, the O/I of air volume is normalized to the corresponding O/I of space volume.
Analysis of repeatability
Any systematic differences in repeat measurements of lung volume parameters were tested using a paired t test. Random differences were assessed from the standard error of the estimate of linear regression between the two sets of measurements, expressed as a percentage of the mean. Differences between measures of variability have been compared with the F test.
Results
The results of shell analysis of the air volume data are shown in Figure 4. This illustrates the variation of mean total air volume and mean FAVC for both the right and left lungs. The graph of percentage air volume in each shell increases with shell number, principally due to the shell volume being approximately proportional to the square of the shell radius. The fractional concentration of air (FAVC) is shown to vary systematically with shell number. FAVC in shell 1 assumes an intermediate value for both lungs. As the origin of the radial transform is at the hilum, which is taken as the center of the airway where the main bronchus bifurcates, some of the voxels of shell 1 will contain air, whereas others will contain the airway wall surrounding the bronchus. These balance out to give an air volume concentration of around 0.5. The air volume concentration then decreases with shell number due to the presence of major blood vessels in shells 2 and 3. The fraction of air then increases with shell number, reaching a fairly constant mean value of about 0.68 in the outer four shells. The concentration is slightly higher for the right lung (0.69) than for the left (0.67).

The mean value of the O/I ratio of air volume for the left lung of 11.5±1.8 (1 SD) [coefficient of variation (COV) 15.9%] was significantly higher than for the right [10.1±0.8 (1 SD); COV 7.5%] (p<0.001). The COV of intersubject variability was significantly higher for the left lung than the right (p<0.01). The overall COV of intersubject variability for both lungs relative to their individual means was 13.5%. The COV of repeated measurements, i.e., the intrasubject variability, was 9.6%.
When normalized for the space VOI sizes, these ratios were 1.37±0.16 (COV 11.8%) and 1.20±0.04 (COV 3.1%), respectively. The overall COV of intersubject variability was 8.9%, which was significantly reduced from the value obtained without normalization (p<0.01). The intrasubject reproducibility of repeated measurements of the normalized ratio was 5.9%. This is significantly lower than the non-normalized value (p<0.05). The reproducibility results for the normalized O/I ratios are illustrated in Figure 5.

Reproducibility of measuring 3D normalized O/I ratios of air volume in control subjects for the right (◆) and left (■) lungs.
The mean total lung air volume for these male normal control subjects imaged in the supine position was 1,900±126 mL. The mean FRC in control subjects in the supine position using helium dilution has been determined as 2,230 mL.(22) Given the differences in technique for estimating lung volume, it is considered that the values derived from CT were in reasonably good agreement with this mean value from the literature.
Discussion
This study has described a technique for using low-resolution, and therefore low-dose, CT to provide quantitative images of lung air volume at approximately midtidal breathing. These depict the fractional lung air volume per unit space volume, and they enable, among other things, the total air volume of the lungs to be determined. The mean value obtained was in reasonably good agreement with values of FRC obtained by helium dilution in a similar group of healthy male controls. These air volume images also depict the regional distribution of air volume concentration. In this study, shell analysis has been used to describe the variation of FAVC from the center of the lung, taken as the hilum, to the periphery. This information is of potential value in quantifying 3D data on regional aerosol deposition distribution by normalizing the data to lung air volume. This is recommended in the new standard guidelines for measuring aerosol deposition using SPECT(7) and PET.(23)
As recommended in these guidelines, the regional air volume distribution has been summarized as the O/I ratio using the outer half of the shells to represent the outer volume and the inner half of the shells to be the inner volume. The mean values of this ratio in healthy controls were found to be 11.5 and 10.1 for the left and right lungs, respectively. The absolute values of this ratio primarily relate to the difference in size of the outer and inner VOIs, which is approximately 8:1. More meaningful values are obtained following normalization to the VOI size, 1.37 and 1.20, respectively. These express the ratio of FAVCs in the two volumes. The higher value for the left lung results from the relatively higher proportion of major vessels in the reduced space volume of the lung envelope on the left side, due to the presence of the heart.
The value of using normalization to air volume in quantifying regional distribution of aerosol deposition has been previously demonstrated in a computer simulation study.(9) Computer-simulated SPECT images of the same theoretical distribution of aerosol were produced in several different subjects. It was found that there was intersubject variation in O/I ratios of aerosol deposition, and that this was significantly reduced when the ratios were normalized to lung air volume. This variation has two parts: first, the different relative sizes of the VOIs; and second, the underlying intersubject variability in air volume distribution. Using the techniques described herein, it is possible to investigate the influence of both these components separately.
This study has enabled the intersubject variability of air volume O/I to be determined. There was considerably higher variability for the left lung than for the right with overall COV of the non-normalized ratio being 14.8%. After normalization for VOI size, the variability reduced significantly to 10.3%. This represents the underlying intersubject variability of air volume distribution. Assuming that the two components of variability add in quadrature, the variability caused by VOI size variation was 10.7%, i.e., approximately half the total variation. When aerosol deposition images are normalized to lung air volume images using the same VOIs, both these sources of variation are corrected. In the simulation study referred to above, the random error in measuring the O/I ratio after normalization was 3.2%. This provides an estimate of the residual error due to other factors such as those deriving from the imaging itself. The significantly higher intersubject variation in O/I ratio for the left lung compared with the right was not expected. This is presumably again due to the influence of the heart on the left lung; the increased density in the inner shells due to the presence of the heart will vary, depending on its size.
In this study, intrasubject reproducibility was also measured. Without normalization, the COV of repeat measurement of the O/I ratio was 9.5%. On normalization, this reduced significantly to 5.9%, again demonstrating that about half the variation was due to the definition of different sized VOIs on the two occasions. The error following normalization is a measure of the real variation of air volume distribution from day to day, although a component of this will be experimental error. Intrasubject variation of this magnitude is not surprising given the flexible nature of the lung and its contents. The air volume distribution in the lung will obviously influence aerosol deposition, and so its variation will also introduce errors in measuring aerosol O/I ratios. Measuring the air volume distribution as soon as possible after aerosol inhalation will help to correct for this factor when normalization is used.
The above discussion demonstrates conclusively the value of normalizing 3D images of aerosol deposition to air volume. The finding that the O/I ratio of lung air volume was different for the left and right lungs shows that the normalization should be carried out separately for each lung. One practical complication that arises from applying O/I ratios obtained from the relatively high-resolution CT images to the low-resolution SPECT images is the PVE. This article shows that this effect only influences the air volume concentration of the outer shell in the CT images and describes a simple method of correction. The poorer resolution in the SPECT images means that this is a much larger effect, and to produce accurate measures of O/I ratio that are consistent with the air volume O/I obtained from CT means that PVE ideally needs to be corrected. As this may not always be practical, the guidelines have not made this correction mandatory. However, they recommend that published results of O/I ratios need to be accompanied by a full description of the method used, including whether or not the PVE was corrected. If PVE is not corrected, the measured values of O/I will be underestimated by a factor that depends on the distribution of aerosol. O/I ratios for aerosols distributed uniformly throughout the lung will be underestimated by about 30%, whereas those with enhanced deposition centrally will be underestimated typically by about 15%.(9)
The applicability of this technology depends on availability of software. To help with this, a MATLAB (The MathWorks Inc., Natick, MA) program for segmenting the lungs and defining shells, based on the lung outline and the hilum position, is available from the corresponding author.
Other methods of normalizing aerosol deposition measurements have been used in both 2D and 3D imaging. Some gamma cameras are fitted with radionuclide transmission sources that can be used to provide maps of density distribution in the thorax. These can be used to outline the lungs and to create images of lung air volume. However, they have considerably poorer resolution than X-ray CT images and also have much larger statistical errors. Normalization may also be carried out using functional images of either ventilation or perfusion. Normalization to a functional image has the disadvantage that it may not be valid in diseases of the lung with abnormal function. One suggested advantage of using a gamma camera SPECT image for normalization, of either transmission or lung function, is that the resolution will be similar to the aerosol SPECT image. This reasoning assumes that the PVE will cause underestimations in the O/I of both the aerosol image and that of the normalizing image, resulting in correction for the effect. However, as the degree of influence of the PVE varies with aerosol deposition pattern, this assumption is not completely valid. Overall normalization to lung air volume seems a more robust method and, as CT provides the best imaging of lung air volume distribution available, it has been recommended in the guidelines as the method of choice.
The methodology described in this article is not fully automated, and therefore is subject to intraobserver variability. However, algorithms are now commercially available, e.g., from VIDA Diagnostics (Coralville, IA), that are capable of fully automatic segmentation of the lung and determination of lung volume. It will be interesting to see whether this software is capable of being used with low-dose images, such as those described in this article. A key aspect of the segmentation and the subsequent analysis is the definition of the position of hilum and how much of the area around the hilum is included in the lung envelope. In this article, we have used the first bifurcation of the main bronchus to define the hilum and have used a technique involving dilation and erosion to fill in the areas in the lung envelope with high density, including those around the hilum. This definition of the hilum is the same as that used in the guidelines for imaging measurements of aerosol deposition, but this is not a generally accepted standard. It would be useful for the lung imaging community to standardize the definitions of the hilum and lung envelope, so that results of different software will be comparable.
The current technique used relatively low-resolution CT images obtained during tidal breathing. These have the advantage that they align perfectly with the SPECT images, which are also acquired over the tidal breathing cycle. They can therefore be applied directly for anatomical interpretation of the aerosol distribution obtained from SPECT. However, the image resolution is inferior to that of high-resolution CT, and there are also artefacts arising from the movement, particularly near the base of the lungs. There is an increasing trend to attach high-resolution CT rather than low-resolution CT to gamma cameras and use breath-hold images. These have improved resolution, but will generally give an image that is different from the midtidal position required to align perfectly with SPECT. To use these images for interpreting SPECT, they need to be elastically registered to the SPECT images in size and position. This situation could be improved in the future by the use of motion correction techniques gated to the respiratory cycle in the SPECT and CT acquisitions.
Air volume images derived from CT scans may also be used in normalization of regional aerosol parameters in 2D planar imaging. The 3D air volume image is converted to a 2D image by forward projection in which the air volume in all voxels contributing to a pixel in the 2D image are summed.(6) Details of this process will be the subject of a future publication.
The current study has been carried out in control subjects. The principle of normalizing parameters of regional aerosol deposition to lung volume clearly applies to subjects with diseased lungs as well. Further work to apply this technology to subjects with asthma and COPD is under way.
In conclusion, methods for delineating the lung outline from CT images of the thorax and for obtaining an image of regional lung air volume have been described. These have been applied to low-resolution CT scans obtained in control subjects at mean supine tidal volume. The regional variation of FAVC from center to periphery of the lung has been studied using shell analysis, and the O/I ratios of air volume calculated. Average measurements of O/I ratio have been presented together with the intersubject variability and the intrasubject variability of repeated measurements. The application of the technique to normalize measurements of regional distribution of inhaled aerosol is described.
Footnotes
Acknowledgments
John Fleming, Joy Conway, and Michael Bennett would all like to acknowledge the support of the Respiratory Biomedical Research Unit in Southampton funded by the UK National Institute of Health Research.
Author Disclosure Statement
This work was part of a study (EudraCT no. 2007-003563-43) that was sponsored by Air Liquide SA, France. The authors have no other personal conflicts of interest.