




Abstract
Abstract
Background:
The variability of particle deposition in infant and child nasal airways is significant due to the airway geometry and breathing rate. Estimation of particle deposition in the nasal airway of this age group is necessary, especially for inhalation drug delivery application. Previous studies on nasal aerosol deposition were focused mostly on adult. A few empirical equations were also developed to calculate nasal deposition in different age groups of children. However, those studies have their limitations. The aim of this study is to find a simple way to calculate the nasal aerosol deposition in all age groups.
Methods:
An in vitro test of micrometer particle deposition in nasal airways for three different ages of infants and children is conducted. An adult nasal replica is also studied as a comparison. Monodisperse oleic acid aerosols ranging in size between 2 and 28 μm are delivered into the replica at the rest condition. This size range covers the deposition efficiency up to around 100%. This study also compares results from our previous deposition tests with a 5-year-old replica.
Results:
Nasal deposition of micrometer aerosols in small children and infants is higher than that in adults under equivalent breathing conditions, e.g., sitting awake in this study. Combining the data set of infants, children, and adults, we found the deposition in the nasal airway strongly depends on the particle size and pressure drop. The particle deposition can be calculated based on a single empirical equation in all age groups. The intersubject variability within the same age group was not addressed in this study.
Conclusions:
An empirical equation for all age groups is developed. From this equation, particle deposition efficiency in the nasal airway can best be estimated with input data of particle size and pressure drop of the airway.
Introduction
U
A few in vivo studies investigated particle depositions in the nasal airways of children aged 5–15 years old.(7,8) Their results indicated that nasal particle deposition was lower in children than in adults under resting and light exercise conditions. The nasal deposition depends on particle size, ventilation rate, and nasal resistance. However, these two studies only considered particles of a narrow size range (1–2.8 μm). Besides, nasal deposition in relation to nasal geometry was not studied.
To avoid the use of human subjects, a nasal replica is a good alternative for investigating nasal aerosol deposition. Because of the technical limitations in making nasal replicas, only a few studies focused on children prior to 2000.(9,10) The recent advances in three-dimensional (3D) printing techniques have made preparing nasal replicas much easier and less costly. Since then, more in vitro studies have focused on nasal deposition in infants and children.(1,11–16) Among these studies, most were from the research group at the University of Alberta, which has tested the age range from newborn infants to school-age children with ultrafine and micrometer-sized aerosols under both constant and tidal breathing conditions. Empirical equations obtained by analyzing many experimental data indicated that the deposition efficiency was a function of Stokes number (Stk) and Reynolds number (Re). For micrometer-sized aerosols, the deposition efficiency (η) in the child's nasal replica was correlated as a function of η=Stk1.23Re1.28 with a specific definition of characteristic diameter (dc) in the calculation of Stk and Re. The deposition efficiency in infants can be expressed as a function of Stk1.094Re2.812. Different definitions of the dc may result in different deposition efficiency curves. In our recent study of a 5-year-old nasal replica, disagreement was found when compared with the empirical equation of Golshahi et al.,(13) with our deposition efficiency being 50% higher.(16) In that study, a new characteristic diameter dc that was different from that of Golshahi et al.(13) was used to compute Stk, which was further used to correlate the deposition data. The new dc, which was first proposed by Garcia et al.,(6) included the pressure drop in its definition and has been shown to better correlate nasal deposition of different ages. However, our previous study only considered one replica. The current study is a continuation of Zhou et al.,(16) and more tests in nasal replicas of different-aged children are being conducted. We characterize aerosol deposition of micrometer-sized particles in three more replicas that include a 10-day-old newborn, 7-month-old infant, and 3-year-old child. Deposition results measured in the three subjects will be compared with our previous studies with an adult replica, as well as studies from other research groups.
Experimental Methods
Nasal replicas
Four anatomically realistic nasal airway replicas were constructed based on computed tomography (CT) data from Arkansas Children Hospital, the use of which has been approved by the UAMS Institutional Review Board of the University of Arkansas for Medical Sciences. The CT scan tracings contained 128 coronal cross sections 1.5 mm apart from the nostril to the upper trachea. These tracings were segmented in Mimics (Materialise, Inc., Ann Arbor, MI) according to the contrast between the osseous structures and intranasal air in order to convert the raw image data into a 3D model, a set of cross-sectional contours that define the nasal airway. The internal nasal geometry was constructed based on these contours. The physical replicas were made using a rapid-prototyping machine (Dimension 1200es, Eden Prairie, MN) with an acrylonitrile butadiene styrene material as shown in Figure 1. The 5-year-old replica shown in the figure had already been used in our previous study. The parameters of the replicas are listed in Table 1. The parameters of an adult replica,(17) which was used for comparison, are also listed in the table. These replicas contain complete nasal airway regions from the nostril to the larynx, similar to the replicas studied by Golshahi et al.(13)
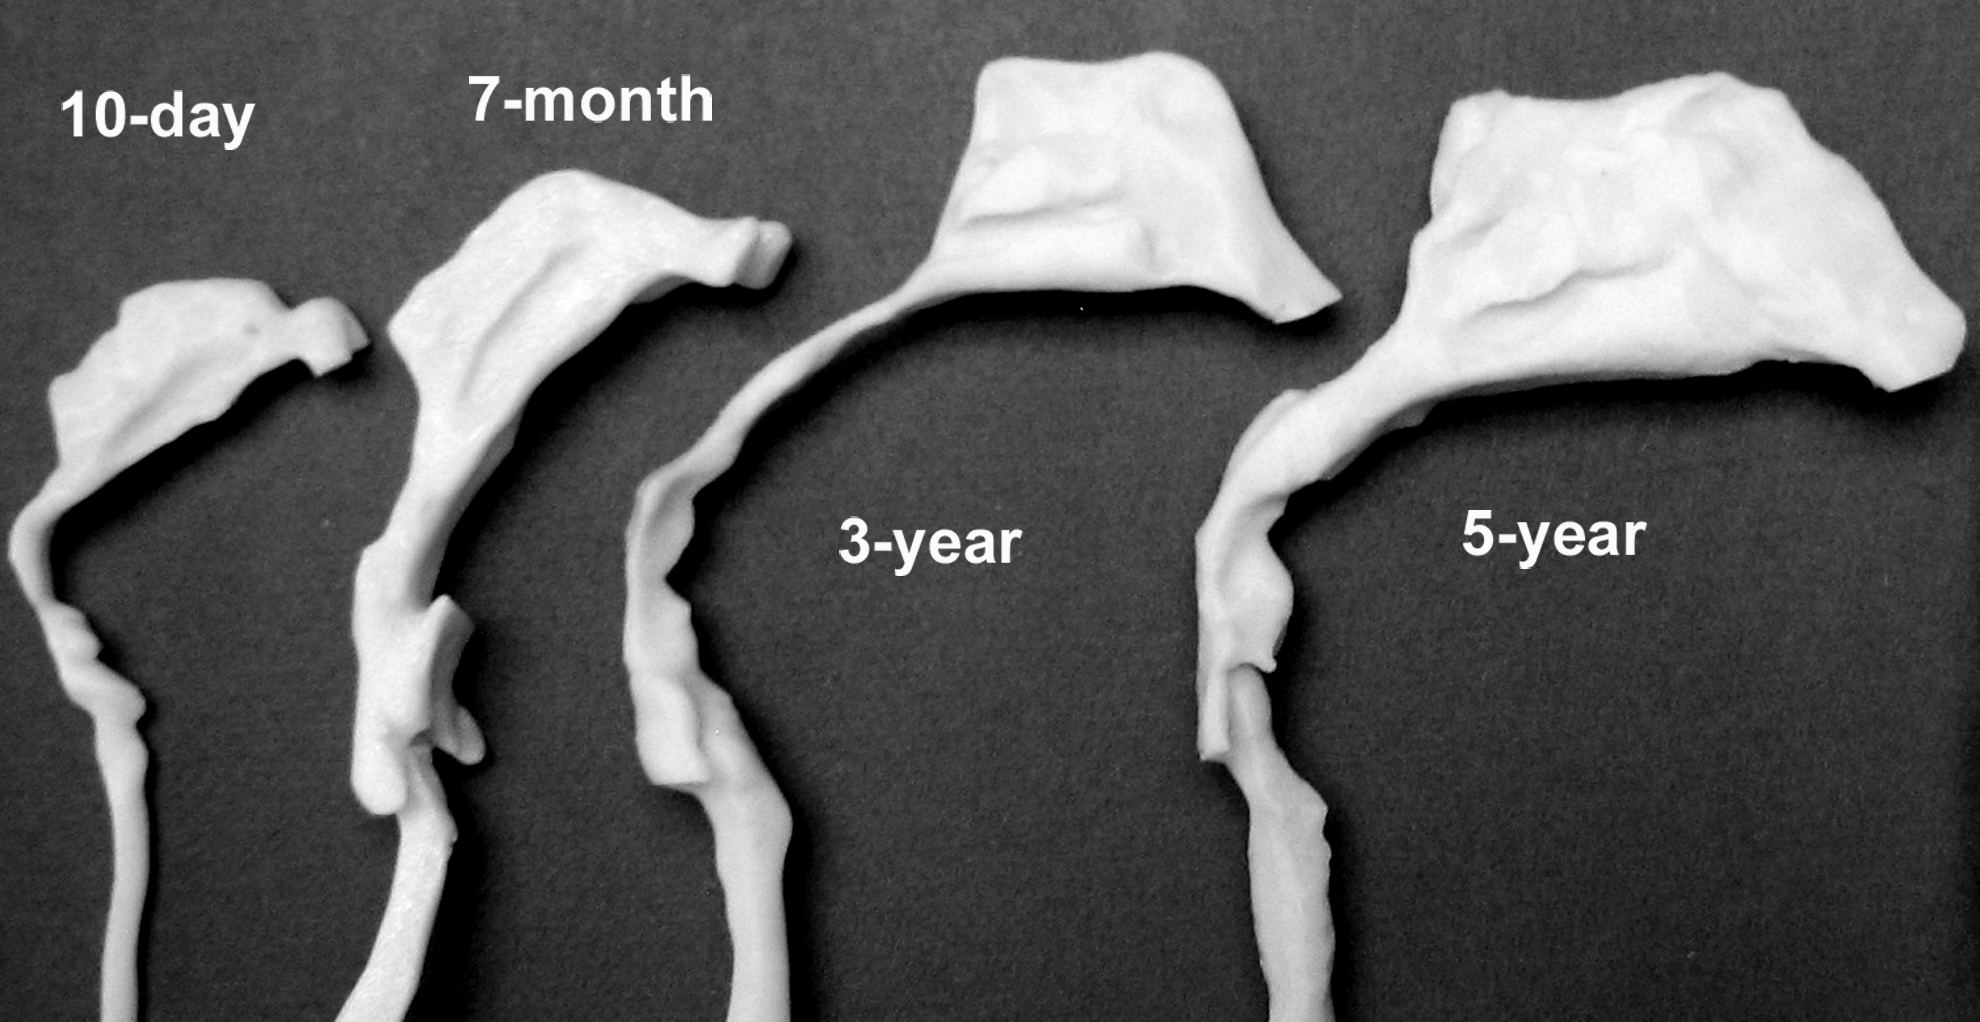
Four nasal airways from infants to children.
V, volume of the replica; As, airway surface area; Lnose, length of nasal cavity to the end of septum; Lt, length from end of septum to upper trachea; Amin, minimum cross-section area; Q, flow rate.
Pressure drop and flow rate measurement
The pressure drop versus the flow rate was measured by connecting a VELOCICALC (Model 8360-M, TSI Inc., St. Paul, MN) at the outlet of the replica, as shown in Figure 2. Because the size of the replica outlet is different for each replica, adapters were used to accommodate the transition between the replica and VELOCICALC. The pressure drop measured by the VELOCICALC was total pressure drop (ΔpT) including that from the adapter (Δp1). The pressure drop of the replica (ΔpR) was obtained by subtracting Δp1 from ΔpT (ΔpT – Δp1). The measurement of the flow rate in this study was also at the downstream of the replica, which was equal to the flow rate of the inlet for incompressible flows as in this study.
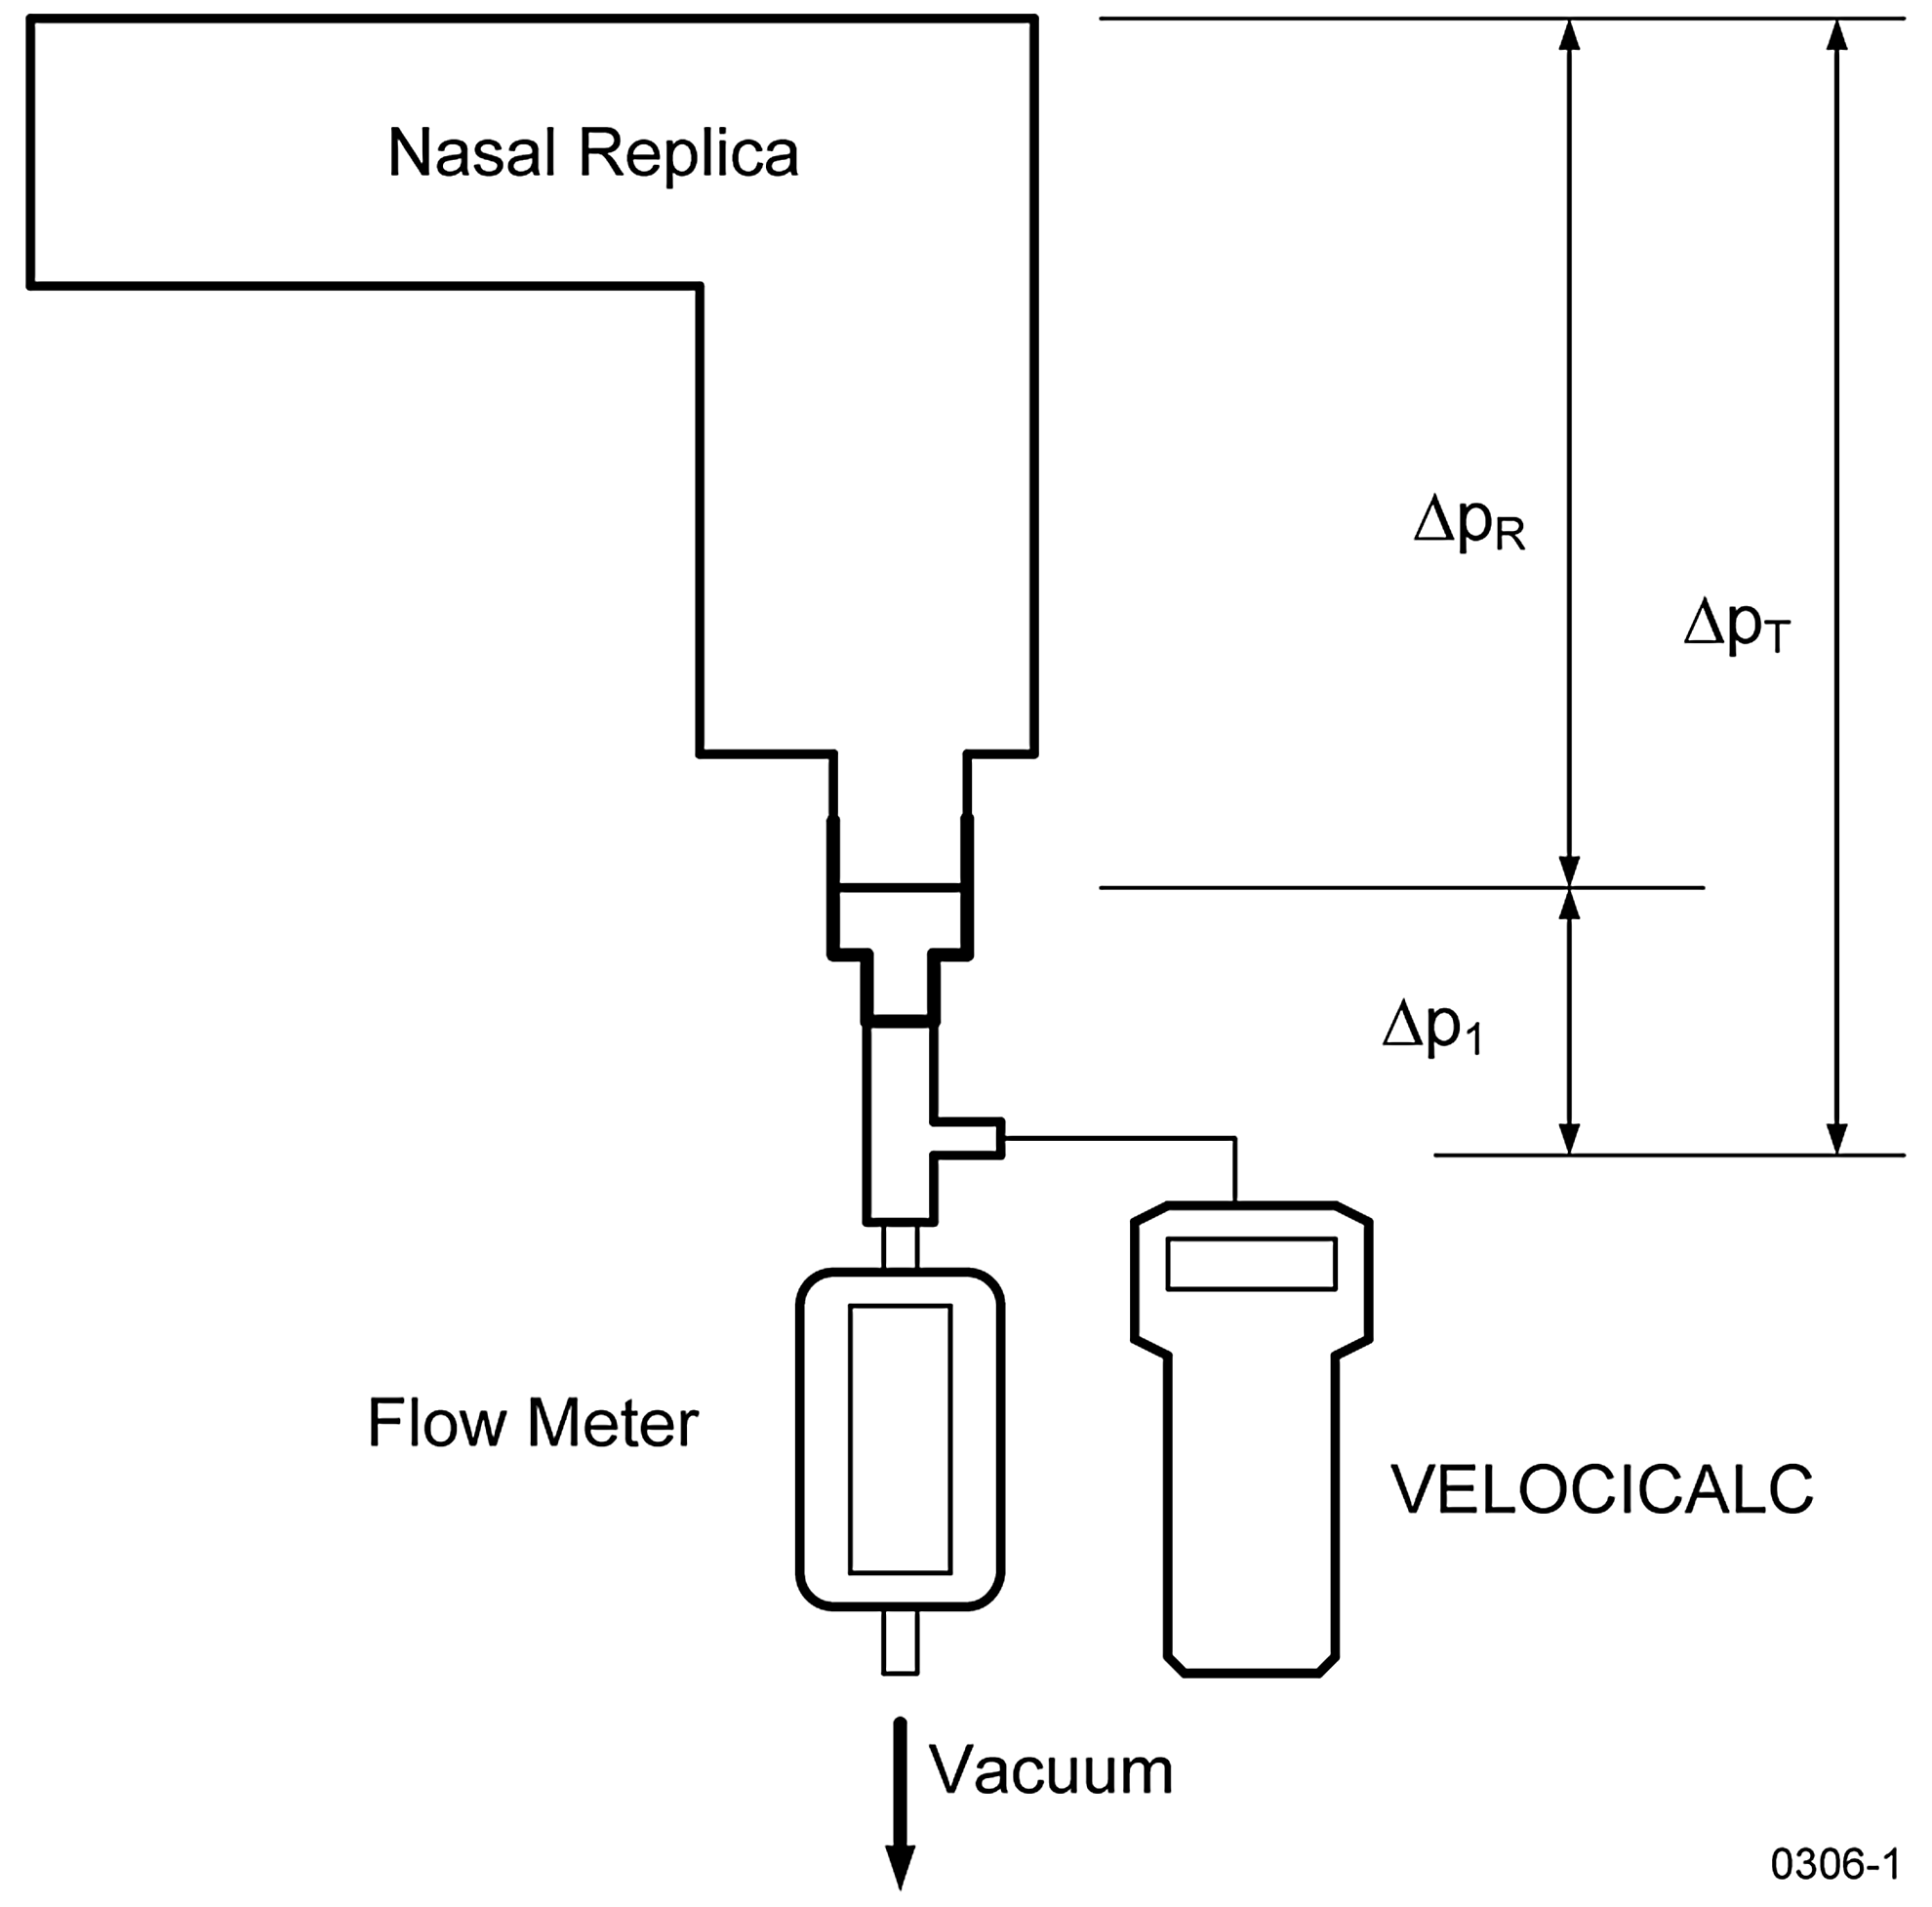
Schematic diagram of pressure drop setup.
Aerosol generation and size measurement
A vibrating orifice monodisperse aerosol generator (Model 3050, TSI Inc.) generated the monodisperse sodium fluorescein–tagged oleic acid aerosols ranging from 2 to 28 μm in size for this study. A pressurized tank was used in the liquid feeding system to provide a steady, continuous liquid solution to the generator.(18) This modified system can generate particles for several hours. An aerodynamic particle sizer (TSI, Inc.) was used to monitor and adjust the aerosol size distribution. Only aerosols with a geometric standard deviation of <1.2 were considered as monodispersed. Figure 3 shows the experimental setup for the aerosol deposition testing. Monodisperse aerosols were generated and neutralized by a Kr-85 source before entering the chamber. For each model geometry, three identical replicas of the same age were placed at the end of the chamber so that the average deposition results can be obtained. Each replica was connected with a 25-mm cellulose filter (Tisch Environmental, Village of Cleves, OH) to collect aerosols that escape deposition. The sample flow rates are also listed in Table 1 for each replica with a breathing condition of sitting awake.(19) Golshahi et al.(13) compared unsteady with steady breathing patterns and found negligible differences between these two. As a result, constant flow rates were adopted in this study. Zhou et al.(20) have tested the aerosol uniformity of the sampling points in the chamber with no significant differences. An adult nasal replica made with a different procedure(17) was used for comparison purposes.
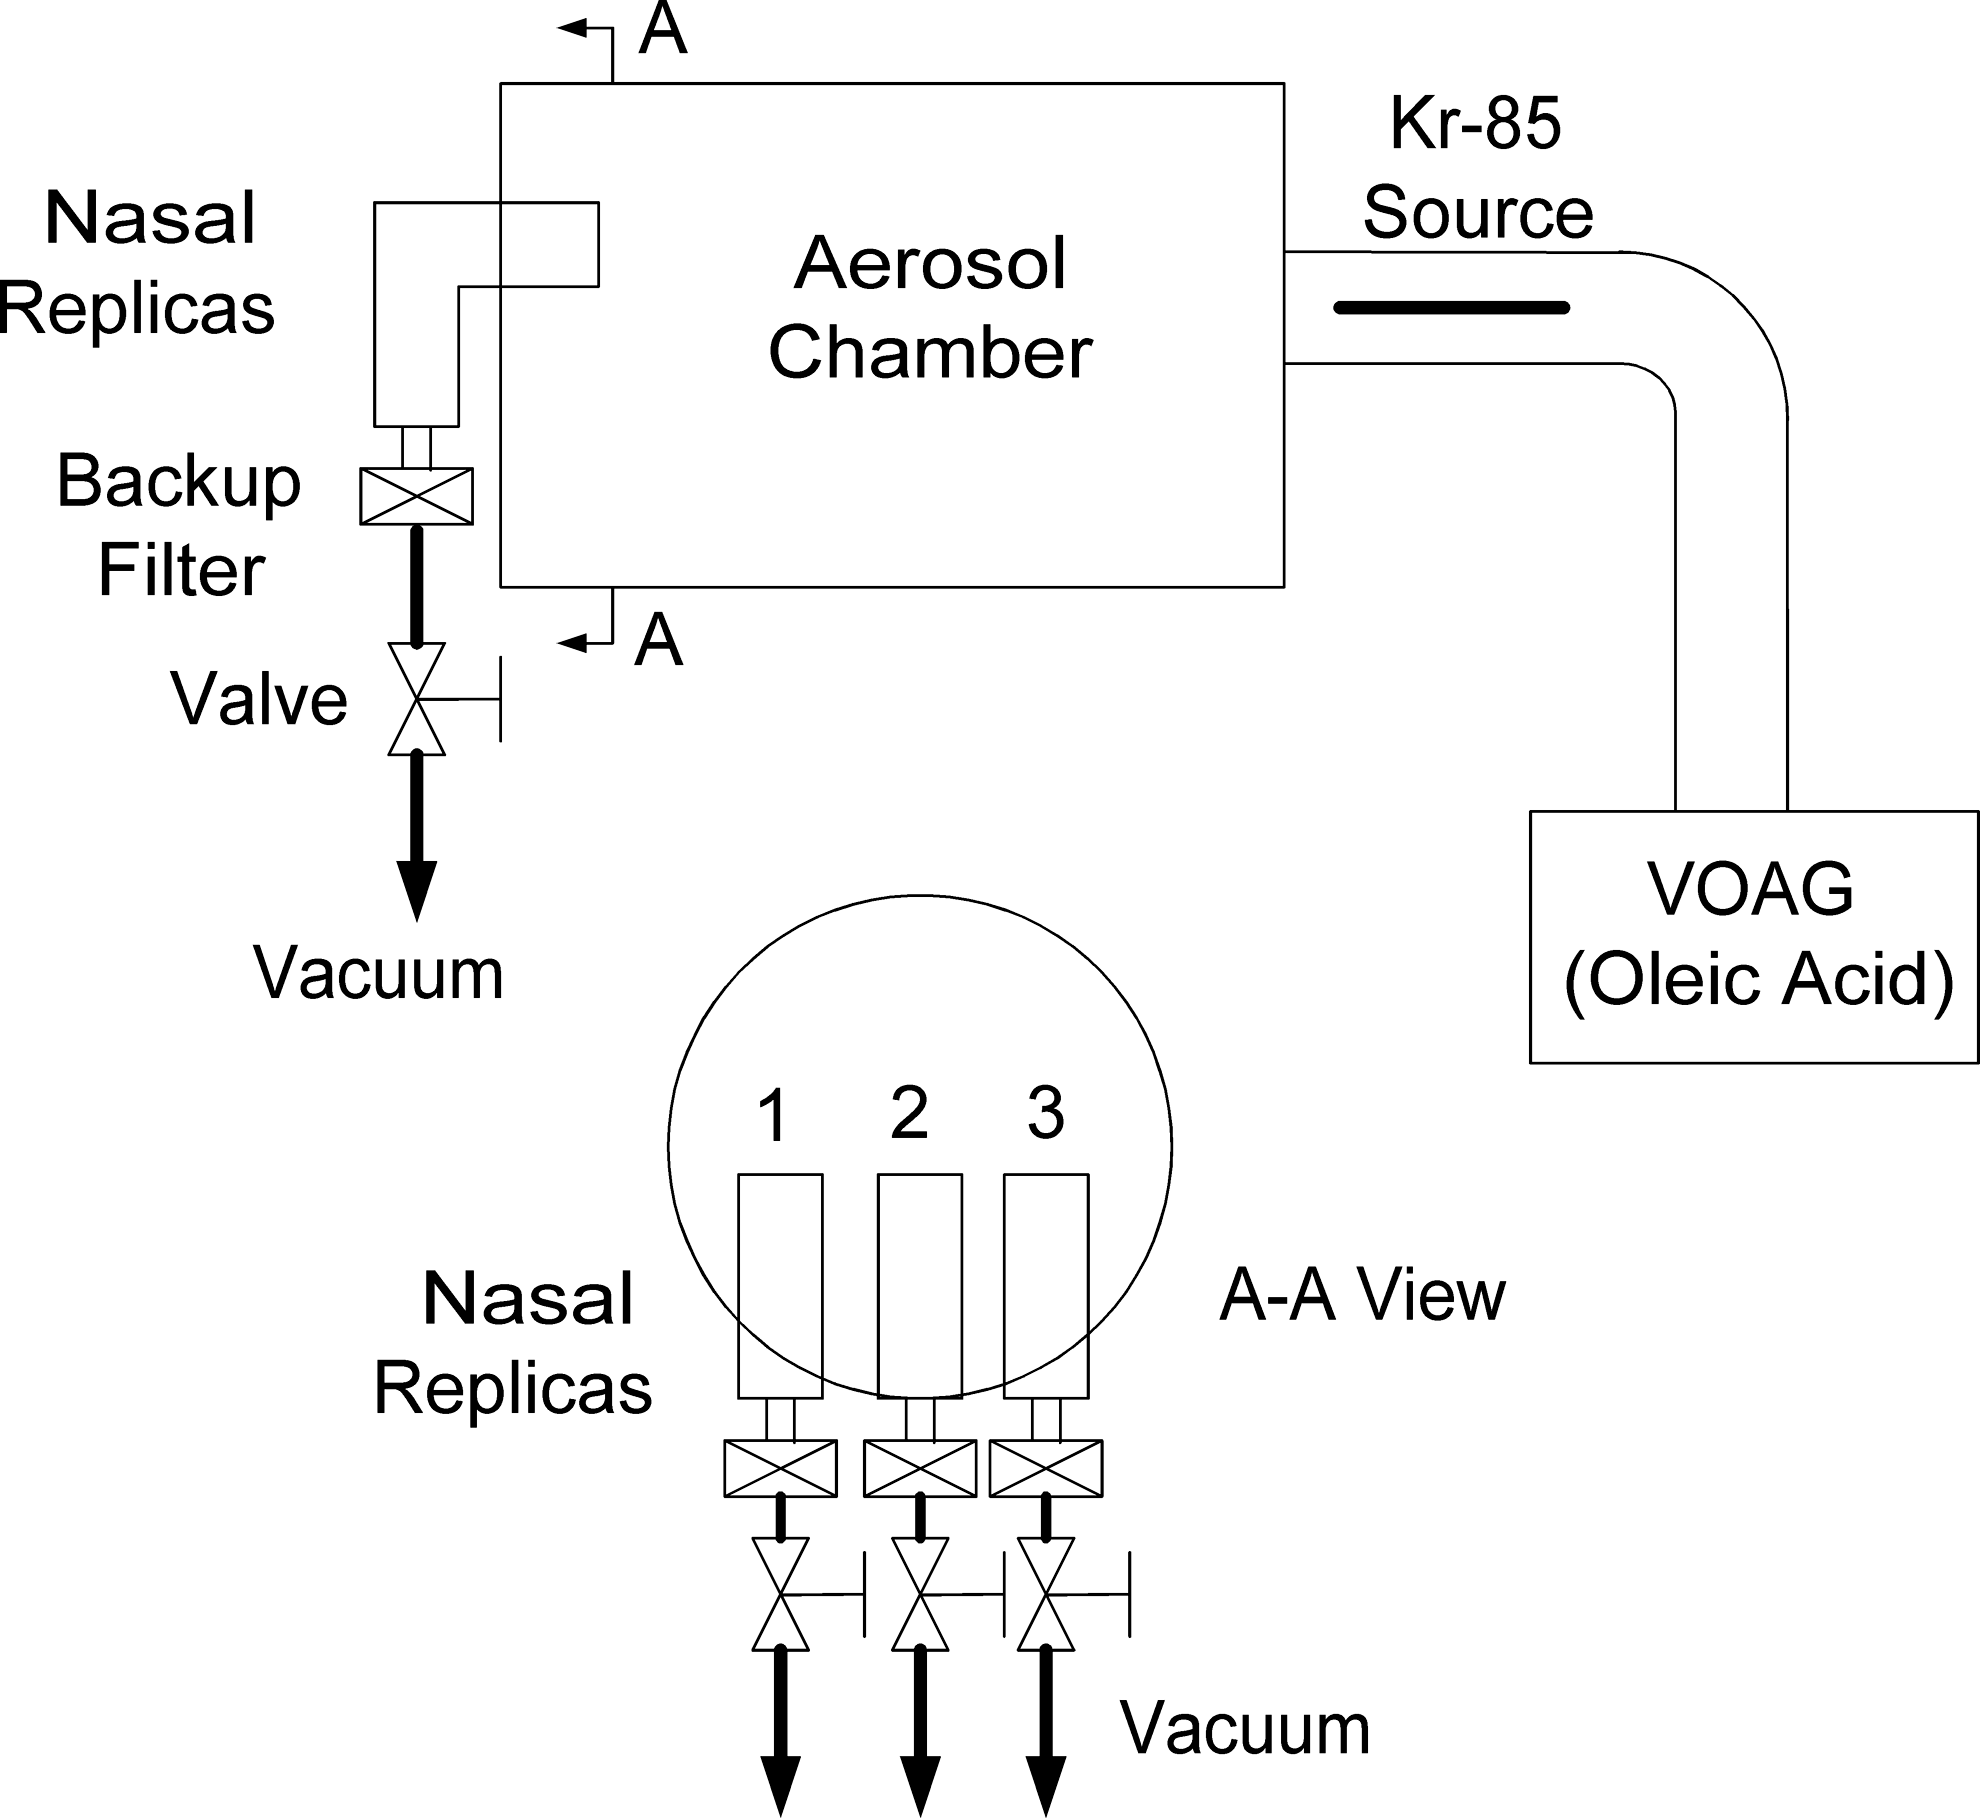
Schematic diagram of in vitro aerosol deposition setup.
To minimize the effect of particle bounce on particle collection, a grease coating was applied on the surface of the replica by filling up and draining out with silicon oil (Dow Corning 550 Fluid, Dow Corning Inc., Midland, MI). Detailed procedures on surface coating can be found in Zhou et al.(16)
Sample and statistic analysis
After each test, replicas were rinsed with a solution of 50% isopropyl and 50% distilled water to wash out oleic acid particles that deposited in the replica. All filters were also placed in the same solution for 24 hr. The relative concentrations of fluorescent tracers in the solutions were measured with a fluorometer (Model 450, Sequoia-Turner Corp., Mountain View, CA). One drop (35–40 μL) of 1 M NaOH was added into each glass tube, which contained around 6 mL of sample to stabilize the fluorescence. The deposition efficiency of each replica unit was obtained by dividing the relative concentration of the fluorescent tracer in a unit by relative concentration of the fluorescent tracer of the total units and filter.(16) Each data point was an average value of the triplicate tests, and all error bars were standard deviations of the triplicates.
To quantitatively assess the performance of a correlation equation, the coefficient of determination (r2) was used. The reference equation was converted to a linear equation. All experimental data were also calculated with the same conversion. The general r2 equation was applied as follows:
The Yi is the observed value, the fi is the modeled value, and n is the number of data points.
Results and Discussion
Particle deposition of the nasal replicas
The total deposition in each nasal replica is shown in Figure 4 at corresponding flow rates as listed in Table 1. The deposition data obtained from our previous study for the 5-year-old child replica,(16) and for an adult nasal replica developed by Guilmette and Gagliano,(17) were also included. The flow rates for all deposition data in Figure 4 were selected at equivalent breathing conditions of sitting awake according to the information from the literature.(19,21,22) Figure 4 showed higher deposition efficiency in the 3-year-old replica than many others. The lowest deposition efficiency was found in the 7-month-old replica. It is not the general case if the same breathing condition was applied. Literature suggested higher nasal deposition in children than in adults at a given flow rate.(5,7,8) When we go back to Figure 1, looking at the shapes of these replicas, the 3-year-old one has a long and narrow pharynx. Before the larynx, the airway has an about 90° bend. For the 7-month replica, however, there was almost no bend (∼180°) from pharynx to larynx region. Figure 5 shows the cross-sectional area (Fig. 5a) and hydraulic diameter (Fig. 5b) as a function of the distance from the nostrils. It is clear to see that the 3-year replica has a low hydraulic diameter for a long distance. Low hydraulic diameter combined with a 90° bend may explain why the 3-year replica appeared to have the highest deposition efficiency and the 7-month went to the lowest level for the same breathing condition.

Deposition efficiency in nasal replicas as a function of particle size.
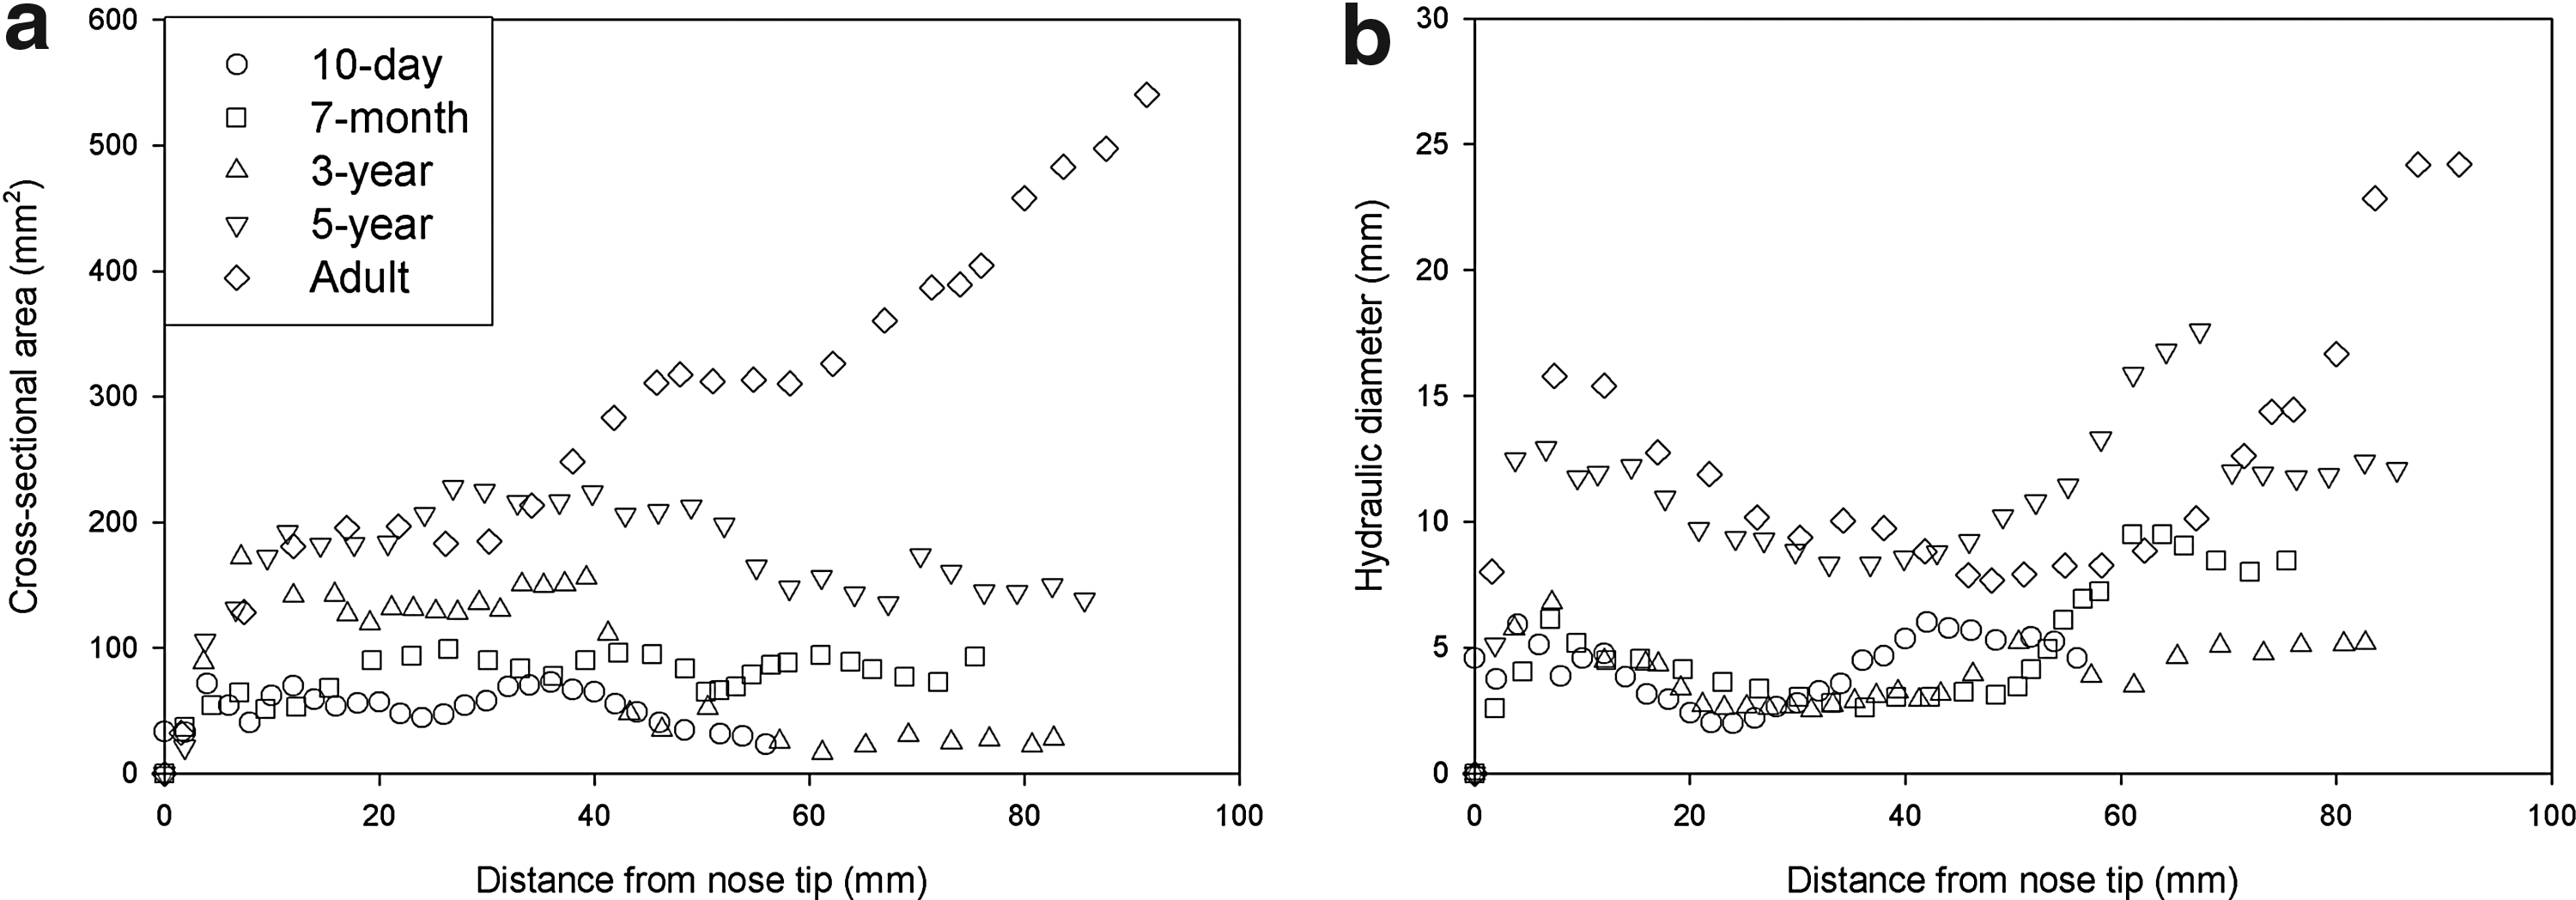
Comparison of nasal cross-sectional area
Particle deposition efficiency versus impaction parameter (da2Q)
Many studies showed nasal deposition as a function of impaction parameter.(1,5,12,13,16) The data set might go to one curve if only one replica was considered at different flow rates. However, if several replicas were considered together, the impaction parameter might not be a good parameter to make all data to be a single curve. Figure 6 shows our result as a function of impaction parameter. The data from our previous 5-year nasal study and from an idealized infant geometry(1) are also included in the figure. Although a large degree of variability was found as expected, the deposition data of idealized geometry was located within our results. Large scatters were also found in other studies with different geometry. This figure also shows that, at a given flow rate and particle size, the nasal deposition for small children and infants is higher than that of adults.

Deposition efficiency of the nasal replicas as a function of impaction parameter, and compared with the deposition data of an idealized replica from Javaheri et al.(1)
Particle deposition efficiency versus Stk and Re
Storey-Bishoff et al.(12) and Golshahi et al.(13) suggested a combination of Stk and Re as the parameter of deposition in the nasal airways for children and infants. They concluded two separate combinations for children and infants. Recently, Javaheri et al.(1) developed an idealized infant model and suggested another set of Stk and Re combinations. In our previous study,(16) we already discussed the differences of our 5-year-old experimental results and their empirical equation for children. In the current study, we obtained more deposition data for different replicas including infants. A comparison was made with their children and infant deposition empirical equations as shown in Figure 7. Please note that Golshahi et al.(13) used the characteristic diameter (dc) of [V/(Lt+Ln)]½ for calculation of the Stk and Re. However, a hydraulic diameter (dh) was used in the study of Javaheri et al.(1) in the Stk and Re. For a direct comparison with their results, we used exactly the same dc as that in Golshahi et al.(13) (Fig. 7a) and Javaeri et al.(1) (Fig. 7b), respectively. Therefore, the values of Stk and Re in Figure 7a and b are totally different. Large scatters were also found in Figure 7 for both children and infants. Most of our deposition efficiencies are higher than their empirical equations. This indicates that the combination of Stk and Re may not be a good parameter to explain the nasal deposition for children and infants.

In our previous study,(16) a new characteristic diameter of airway dc was tested, which included the airway pressure drop in its definition. This new parameter was found to effectively reduce the scatter of deposition data of the 5-year-old model. In this study, the same definition was used to analyze the deposition data in nasal replicas of different ages. Theoretically, for turbulent flow, the pressure drop in a circular pipe can be expressed(23) as
where L is the length of the pipe, ρ is the density of air, μ is the viscosity of air, d is the diameter of the pipe, and Q is the flow rate. Equation 2 can be modified to the nasal replica if the standard air property applied(6) is
where Rnose is the nasal resistance. Figure 8 shows the pressure drop as a function of flow rate for replicas used in this study. Fitted curves with Equation 3 are also shown in the figure. The Rnose in Figure 8 should be converted into an SI unit. From Rnose and Lnose (listed in Table 1), the dc of each replica can be calculated as listed in Table 2. Equation 3 is used to calculate the dc. Detailed information was discussed in our previous study.(16)

Measured pressure drop and fitting curves as a function of flow rate.
In the study of Garcia et al.,(6) an empirical equation was developed based on the deposition data from replicas of four healthy adults. However, the Stk they used was simplified (da2Q/dc3, where da is aerodynamic diameter); it is not the real dimensionless Stk. Their empirical equation can be converted to the dimensionless Stk (=da2U/18μdc) with a characteristic length of dc(16) to
where η is the deposition efficiency. Our data were plotted using parameters of Garcia et al.(6) as shown in Figure 9. Although Equation 4 looks close to the experimental data, an r2 value of 0.43 was obtained. For a better fit for all of the experimental data, a new equation was generated with an r2 of 0.924, as seen below:

Deposition efficiency as a function of Stk developed by Garcia et al.(6)
This equation can cover nasal particle deposition efficiency for all age groups ranging from newborn infant to adult.
The Stk we used in this study is associated with the pressure drop of the replicas. The Rnose has to be calculated to obtain the Stk in Equation 5. Considering that it is always desirable to use simple parameters to estimate the deposition efficiency, the combination of particle size and pressure drop was also tested in correlating nasal depositions of micrometer particles in infants and children. Figure 10 plots the deposition efficiency as a function of two modified impaction parameters (IPs) (da2Δp versus da2Δp2/3). Two fitting equations are obtained:
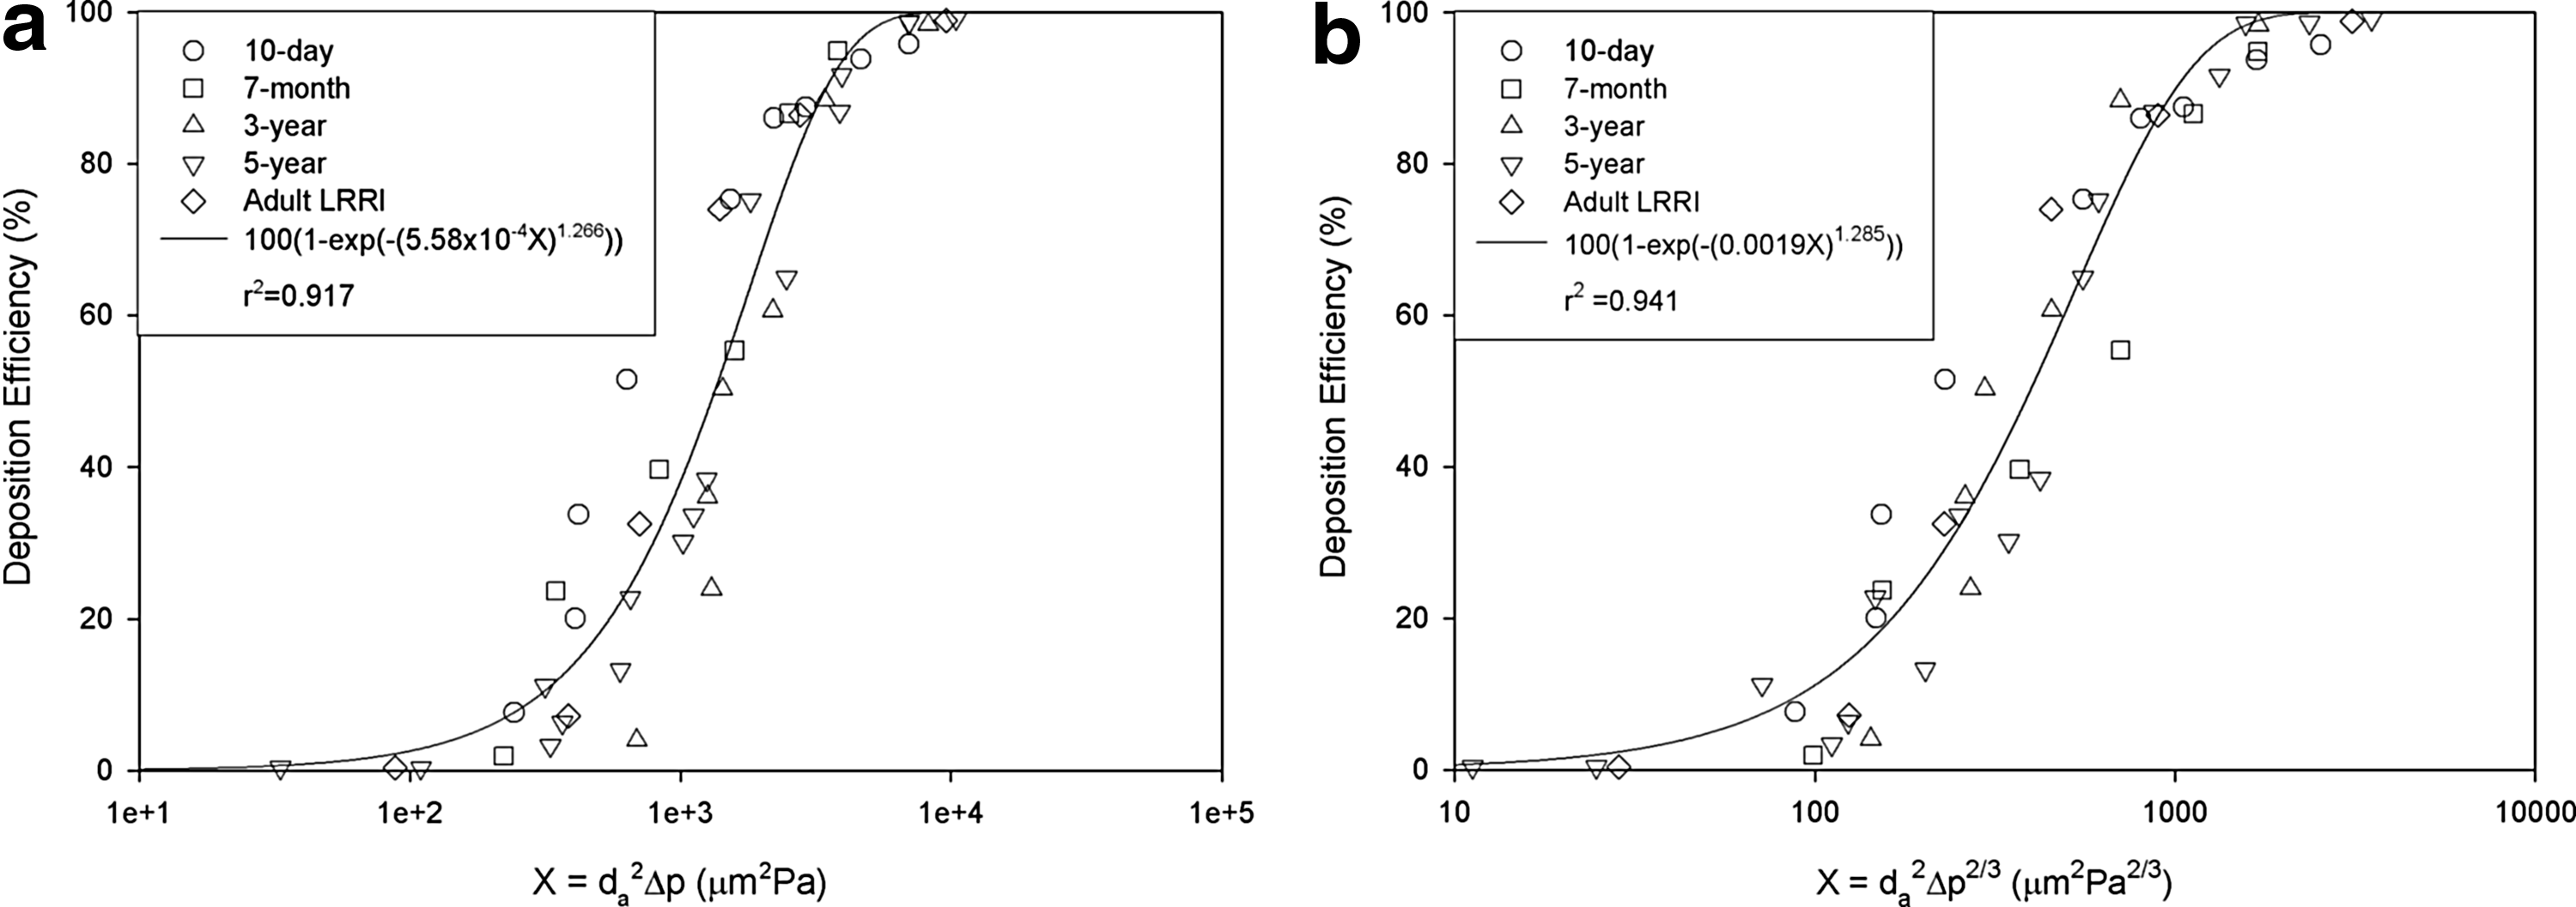
Deposition efficiency as a function of da2Pa
Two observations are noteworthy, which are discussed further below.
Compared with the large scatter in Figure 6 plotted with the conventional IP, da2Q, inclusion of Δp significantly improves the data collapse with both modified IPs; this indicates that Δp is a more relevant parameter than Q in accounting for the age effect. This is expected in that the conventional IP, da2Q, considered only two factors, whereas there are at least three factors involved (particle size, flow, and geometry). In principle, pressure drop is a collective quantification of the flow-geometry interactions within the nasal airway. Transport and deposition of inertial particles are predominantly affected by local flow details, which are a direct result of flow-geometry interactions. It is noted that the conventional IP, da2Q, was initially for a single replica cast or a cohort of casts of the same age groups, where geometrical effects might be insignificant, and it served its purpose well in correlating deposition data with different particle sizes and flow rates. However, when subjects of different ages or ethnicities are considered, a parameter (or a combination of parameters) is needed that could capture the interplays among the airflow, geometry, and particles. We use Stk to account for the particle dynamics entrained in the airflow (flow–particle interaction). In this sense, pressure drop appears to be a good candidate to account for the geometry-flow interaction. Moreover, the flow–pressure relation is usually nonlinear. Based on the above discussion, the IP da2Δp2/3 is also recommended for inertial deposition studies in other airways with either a single model or multiple models from same/different groups.
Secondly, better data collapse is observed with da2Δp2/3 (r2=0.941) than with da2Δp (r2=0.917), indicating that less dependence of Δp better captures the depositing mechanisms. This observation is consistent with the finding of Garcia et al.,(6) who reported that da2Δp2/3 better correlated the deposition data for adults and almost eliminated the interindividual variability among four adult subjects. Results of this study extend the applicability of the parameter (da2Δp2/3) to different age groups (subjects considered herein include infants, children, and adults). This finding is clinically advantageous because, if proved valid, nasal deposition of inertial particles can be estimated from particle size and transnasal pressure drop, which can be measured easily via rhinomanometry. However, more validation studies are needed, considering the small sample size in this study.
Pressure losses are easily obtained from in vitro experiments. From a clinical point of view, the pressure difference of nasal cavity can be obtained with posterior rhinomanometry and forced oscillation techniques.(24,25) Nasal airway volume and cross-sectional area can be also measured in vivo using acoustic rhinometry.(25) The specific instrument must be used for in vivo experiments.
A major limitation of this study is the number of nasal replicas. Each replica herein has been used to represent one age group, which neglects the intersubject variability. Considering that there exists considerable variability in nasal physiology among different subjects of one age group, or even during a breathing cycle for one subject, a large number of replicas need to be included in future studies. Even though a single correlation applicable to all age groups or to all subjects of one age group is highly desirable, such a correlation has to be awaited until more nasal morphology and deposition data become available for subjects of a large spectrum of ages and subjects.
Conclusion
This study investigated aerosol deposition in several nasal replicas that included infants, children, and adults. It is found that the deposition efficiency is strongly related to pressure drop. The method to calculate the characteristic diameter, in which the pressure drop was included, can apply to all ages. Current findings will be useful in future application to drug delivery using nasal spray, especially for infants and children. An appropriate number of subjects will be used in future investigations.
Footnotes
Acknowledgments
The authors are grateful to Yushi Liu of Lovelace Respiratory Research Institute (LRRI) for assistance in data analysis, and Ellen Blake of LRRI for editing.
Author Disclosure Statement
The authors declare that no conflicting financial interests exist.