




Abstract
Abstract
Background:
Aerosol drug delivery to infants is a strong function of their behavior. Infants can be active during medication administration, changing head position or breathing mode. The objective was to evaluate the influence of the head direction and breathing mode on the hood drug delivery in a 7-month-old girl airway model by using an approach that couples imaging with computational fluid dynamics (CFD). Three head directions, i.e., face up, face side, and sitting (face front), and two breathing modes, i.e., oronasal and nasal breathing, were studied.
Methods:
The face-airway model was developed from computed tomography scans of a 7-month-old girl. Respiratory airflows and particle transport were simulated with the low Reynolds number κ-ω turbulence model and Lagrangian tracking approach. Three pharmaceutical aerosol sizes (1, 2.5, and 5 μm) via hood nebulization were considered under quiet breathing conditions (5 L/min).
Results:
Both head direction and breathing mode can noticeably affect aerosol inhalability and lung delivery efficiency. A maximum of 20% difference in inhalability is observed among the three head positions. Facial-ocular depositions are predominantly influenced by head position, but not breathing mode. The facial-ocular deposition rate with the face-up position is about threefold that with the sitting position for 5-μm particles. Nasal breathing gives about 17.8% lower lung deposition and about 65% higher facial-ocular deposition than the oronasal breathing.
Conclusion:
The face-side position has less facial-ocular deposition than the face-up position, while still achieving similar lung delivery efficiency. Because aerosols deposited around the eyes may cause irritation to the eyes, the face-side position appears to be a better option than the face-up position for comfort and safety reasons.
Introduction
D
A limited number of clinical and numerical studies have considered inhalation therapy in infants using a nebulization hood or tent. Gorenberg et al.(3) proposed that nebulizer hood aerosol therapy is better tolerated in infants and has equivalent outcome as a mask. Amirav et al.(2,4) compared the lung deposition efficiency of a face mask versus a hood in infants aged 0.5–5 months and found comparable clinical efficacy between these two methods. Moreover, less variability and better acceptance with hood treatment were observed among the infants. Infants' discomfort score was significantly lower for hood versus mask nebulization, and hood treatment could be less time-consuming for caregivers due to its easy operation.(5) Similar results were also reported by Bar-Yishay et al.(6) in their pilot study that compared lung function response to bronchodilator nebulization via hood and mask. Numerical modeling and simulation of hood treatment include reports by Amirav et al.(7) and Shakked et al.,(8,9) who studied related issues such as the carrier airflow, lung delivery efficiency, and eye depositions. Such quantitative evaluations of different scenarios have the potential to improve current practices of hood treatment and to develop new inhalation therapy protocols for infant patients.
Although most previous studies focus on factors such as device interfaces and aerosol properties, the delivery efficiency is most dependent on patient behavior. Infants can be active during medication administration, changing their head positions and breathing modes. Even when they are asleep, different body positions could be adopted ranging from facing up to nearly facing down. There is clear evidence that the orientation of the orifice exerts large effects on aerosol inhalability (or aspiratory efficiency).(10–12) Therefore, head positions or directions are expected to lead to perceivable variations of the therapeutic efficacy in infant patients. Besides, infants are obligate nasal breathers as they prefer breathing through their nose rather than their mouth. Most infants, however, are able to breathe through their mouth if their nose is blocked. The switch between nose breathing to mouth breathing is also expected to cause variations in lung drug delivery efficiency, aerosol inhalability, and depositions on the face or eyes.
The objective of this study is to quantify the influences of the head direction and breathing mode on aerosol inhalability, facial-ocular deposition, and lung delivery efficiency in a 7-month-old infant model using an approach that couples imaging with computational fluid dynamics (CFD). A computed tomography (CT) image-based face–nose–mouth–throat airway model will be developed for this purpose that includes the anatomically accurate upper airway, the facial expression with an open mouth, and the ambient domain in front of the face. Effects from three factors will be examined: (1) head directions that include face up, face side, and face front (sitting), (2) breathing modes with nasal and oronasal breathing, and (3) particle size ranging from 1 μm to 5 μm.
Materials and Methods
Construction of the infant face-airway model
To construct the infant face–nose–mouth–throat airway model, CT scans of a 7-month-old girl (weight 9.3 kg and height 71 cm) were used in this study. The CT scans were provided by the Arkansas Children Hospital and have been approved by the UAMS Institutional Review Board. The CT data contained 128 coronal cross sections that were spaced 1.0 mm apart and spanned from the head to the upper trachea. The nose–throat airway geometry of this subject has been reported in Xi et al.(13) The mouth and face model geometries were developed as follows. First, the CT scans were segmented in Mimics (Materialise, Ann Arbor, MI) to convert into a set of cross-sectional contours that define both the mouth and face. Based on these contours, the surface geometries of the mouth and the face were constructed in Gambit 2.4 (Ansys, Inc., Canonsburg, PA) and were connected with the existing nose–throat geometry (Fig. 1a). The resulting face-airway geometry model is highly complex and accurate to the original scan images. From Figure 1a, the nasal airway consists of the nasal vestibule and valve region, turbinate region, nasopharynx, pharynx, and larynx. The turbinate region can be further divided into medial passage, superior meatus, middle meatus, and inferior meatus as illustrated in Slice 1-1’. To simulate the ambient air surrounding the infant, a half sphere enclosing the infant model was built with a distance of about 15 cm away from the sphere boundary to the infant face (Fig. 1a).

CT image-based face–nose–mouth–throat model of a 7-month-old girl:
The model geometry was then imported into ANSYS ICEM 12 (Ansys, Inc.) for meshing. In view of the high complexity of the model geometry, an unstructured tetrahedral mesh was created (Fig. 1b). To resolve the different characteristic sizes of ambient and airway domains, multistate computational mesh was generated, with fine mesh in the ambient domain, finer mesh in the airway, and even finer body-fitted mesh in the near-wall region (Fig. 1b and c). The final mesh consists of approximately 3.85 million unstructured cells.
Boundary conditions
Steady inhalation was assumed with zero ambient pressure at the sphere boundary (inlet) and vacuum pressure at the tracheal outlet. The outlet pressure was chosen to match the quiet breathing condition (5 L/min) that is typical of a 7-month-old infant.(14) Micrometer particles were released from the sphere boundary with zero initial velocity. Releasing a constant concentration of particles in close vicinity of the infant face was a reasonable approximation of the particles migrated from the nebulized hood, and this approximation would save tremendous computational time. With a concurrent inertial and sedimentation depositing mechanism, these particles would either be inhaled into the airway, deposit on the infant face, or escape from the computational domain and eventually settle to the ground due to gravity. The airway surface was assumed smooth and rigid with no-slip (uwall=0) and perfect absorption conditions. In the body, the extrathoracic airway is covered with a thin layer of mucus, which captures particles at initial contact and clears them to the throat or nasal vestibule by mucocilliary movement within a time period of 10–15 min. Mass diffusion and metabolism of deposited particles may occur within the mucus layer and may change the zero-concentration conditions at the wall. However, due to the slow speed of the mucocilliary movement compared with the intranasal airflow and relatively low deposition rates, the no-slip and perfect absorption conditions are reasonable approximations in this study.
Fluid and particle transport models
The flow conditions considered in this study are assumed to be isothermal and incompressible. The mean inlet Reynolds number at the trachea varies from 368 to 3,302. The maximum Reynolds number based on the hydraulic diameter of the glottal aperture is approximately 8,037. Multiregime flow dynamics can coexist in the nasal airway due to its unique physiology. To resolve the possible laminar–transitional–turbulent flow conditions, the low Reynolds number (LRN) κ-ω model was selected based on its ability to accurately predict pressure drop, velocity profiles, and shear stress for transitional and turbulent flows. Moreover, the LRN κ-ω model was shown to provide an accurate solution for laminar flow as the turbulent viscosity approaches zero.(15)
The transport and deposition of the submicrometer particles are simulated with a well-tested discrete Lagrangian tracking model. The aerosols evaluated in this study had a tracheal Stokes number (Stc=ρpdp2U/18μDh) with a range of 1.68×10⁻⁸ to 1.0×10⁻³ and were assumed to be dilute and to not influence the continuous-phase, i.e., one-way coupled particle motion. In our previous studies, the user-defined functions–enhanced Lagrangian model with near-wall interpolation algorithm(16,17) has been shown to provide close agreement with experimental deposition data in upper respiratory airways for both submicrometer(17) and micrometer particles.(18)
Numerical method and grid sensitivity analysis
To solve the governing mass and momentum conservation equations in each of the cases considered, the CFD package ANSYS Fluent 6.3 was used. A specific set of user-defined functions was also applied for implementation of the anisotropic turbulence effect and near-wall velocity interpolation. All transport equations were discretized to be at least second-order accurate in space. A segregated implicit solver was used to evaluate the resulting linear system of equations. Convergence of the flow-field solution was assumed when the global mass residual was reduced from its original value by five orders of magnitude and when the residual reduction rates for both mass and momentum were sufficiently small.
To accurately capture the turbulent-particle interactions, it is necessary to model the turbulence down to a near-wall y+ value of 1. A grid sensitivity analysis was conducted by testing the effects of different mesh densities with approximately 1.2 million, 2.5 million, 3.85 million, and 5.0 million control volumes while keeping the near-wall cell height constant at 0.05 mm. As the changes in both total and subregional depositions were less than 1% when increasing mesh size from 3.85 million to 5 million, the final grid for reporting flow field and deposition conditions consisted of approximately 3.85 million cells with a thin five-layer pentahedral grid in the near-wall region. The height of the first near-wall cell equals 0.05 mm, resulting in wall y+ values of approximately 1 for the inhalation flow rate considered in this study. The number of particles being tracked was 100,000, and increasing the number of tracked particles did not alter the deposition fractions.
Aerosol inhalability and deposition factors
In this study, the lung delivery efficiency is defined as the fraction of particles exiting via the trachea outlet to the particles that are administered 15 cm away from the infant's face. Particles that escape the filtration of the extrathoracic airway are assumed to deposit in the lungs without expiration loss. The face deposition is the ratio of the particles depositing on the infant's face to the particles administered to the infant. The definition of the aerosol inhalability or aspiration efficiency follows that used by Su and Vincent(10) and is defined as the ratio of the inhaled aerosol concentration at the airway inlet (Cin) over the ambient aerosol concentration distant from the airway inlet. In this study, the ambient concentration is assumed not to be affected by the respiration at a distance of 15 cm away from the face of the infant. A general functional form of aerosol inhalability (AI) is:
where vs is the particle settling velocity, Stc is the Stokes number representing inertial effects, Rc represents gradational effects, and α represents the orientation effect. The parameters ρ0 and d are the density and density of the particle, μ is the air viscosity, U0 is the inhalation velocity, and l is the characteristic length of the airway inlet.
Results
Particle transport model testing
To ensure that the aerosol inhalability and depositions were correctly modeled, the computational fluid-particle dynamics model used in this study was validated against benchmark experimental data of aerosol inhalability (aspiratory efficiency) in a spherical sampler by Su and Vincent.(10,11) The sampler had a sphere diameter of 6 cm and sampling inlet diameter of 0.6 cm, which was put in a 1 m×1 m×1 m air chamber. The parameter Rc is defined as the ratio of particle settling velocity over the mean sampling velocity: Rc=d2ρ*g/18μU. Here d is the particle size, ρ* is the particle density, μ is the viscosity of air, and U is the mean sampling velocity across the sampling inlet. Two sampling scenarios, upward facing and downward facing, were considered (Fig. 2). The airflow streamlines and particle trajectories are displayed in the left panels of Figure 2, whereas the CFD-predicted and measured inhalability (aspiration efficiency) are compared in the right panels. Close agreements were noted for both sampling directions considered, indicating that the current numerical model was adequate in capturing the particle dynamics.

Good agreement between predicted and experimental aspiration efficiency (inhalability) of Su and Vincent(10) in
From Figure 2, it was observed that sampling direction exerted a significant impact on the aerosol aspiration efficiency. For a given Rc, aspiration efficiency was much higher for the upward-facing sampler than the downward-facing one, with at least 30% difference for Rc=0.01 and 65% difference for Rc=0.025. Furthermore, particle inhalability was shown to be highly sensitive to Rc, which was inversely proportional to the sampling velocity, U. This sensitivity was even more pronounced in the downward-facing sampler. Applying the knowledge hereof to the hood nebulization in infants, non-negligible changes in aerosol inhalability are expected when the infants change their head positions or breathing mode (related to sampling velocity). Besides, particle size was also an important parameter that could influence the aerosol inhalability through the particle settling velocity, vs=d2ρ*g/18μ, or Rc= vs/U, and should be considered in this study.
Flow streamlines
The effect of breathing mode on respiration airflow and aerosol dynamics is visualized in Figure 3 in terms of streamlines and instantaneous snapshots of particle positions under oronasal and nasal breathing conditions. Both cases assume a sitting (face-front) position. For a given inhalation rate (5 L/min), the oronasal breathing has a lower pressure drop (1.5 cm H2O) relative to that of the nasal breathing (2.2 cm H2O). The nasal-oral flow partition is 35% versus 65% in Figure 3a, indicating a majority of airflow switching from the nasal route to the mouth. The airflow velocity entering the airway is much higher with nasal breathing (Fig. 3a), which is expected to cause higher drug loss in the nasal passages due to elevated particle inertial impaction.
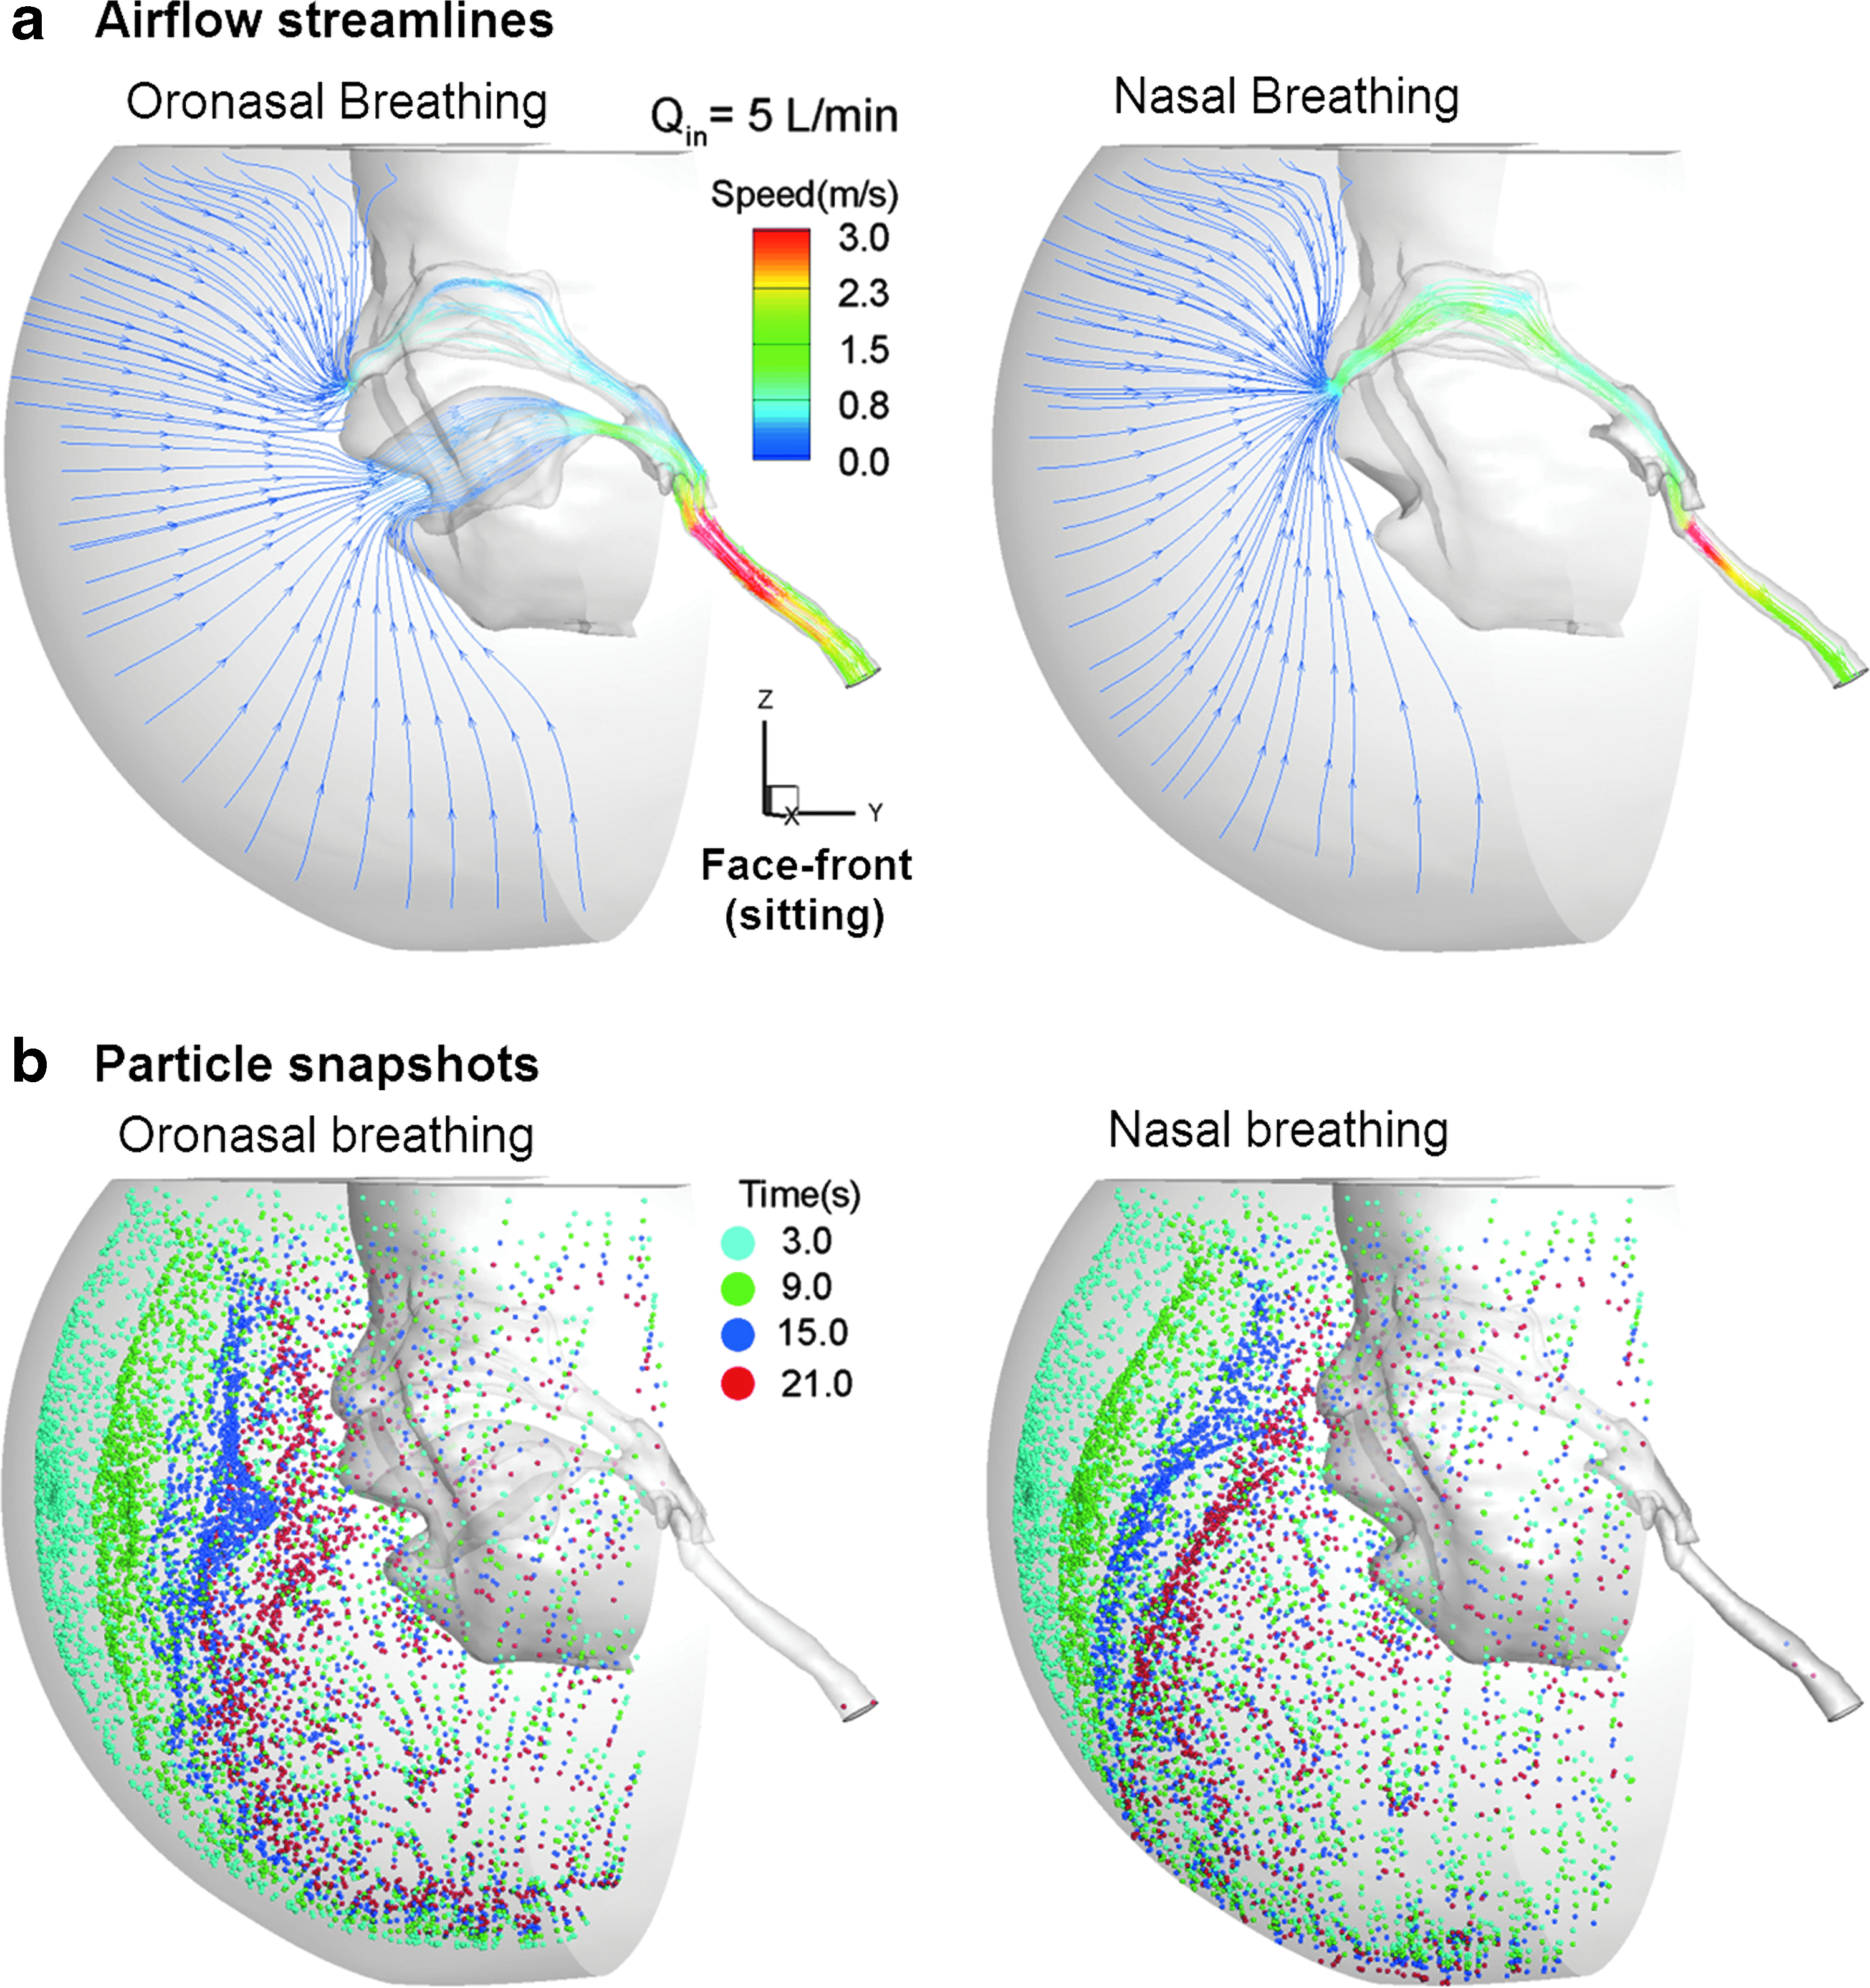
Comparison between oronasal and nasal breathing modes in terms of airflow streamlines
Figure 3b compares the dynamic transport of particles toward the airway with snapshots of particle positions at prescribed instants between the oronasal and nasal breathing modes. Under the quiet breathing condition (5 L/min) considered herein, it takes more than 20 sec for the particles to move 15 cm toward the nose or mouth. Considering that particles move faster as they approach the airway inlets, it takes an even longer time for therapeutic particles to travel the same distance from the far field. Therefore, sufficient time should be allowed for effective nebulized hood treatment. Current practices usually take about 10–15 min.(6) Another interesting difference of particle dynamics between the two breathing modes is the particle profiles before the airway entries (see t=15 sec and t=21 sec in Fig. 3b). For the oronasal breathing, the aerosol front is observed to be oriented toward the mouth, whereas it is oriented toward the nostrils for nasal breathing. This observation is reasonable as the particles are entrained by the carrier airflow, which accelerates as it comes closer to the airway inlets.
Aerosol inhalability
Figure 4a and b show the inhalability of pharmaceutical aerosols with three head directions for oronasal and nasal breathing modes, respectively. As expected, oronasal breathing gives about 10% higher aerosol inhalability than nasal breathing. For small particles (1 μm) that closely follow the carrier flow, head direction has a negligible effect on aerosol inhalabilities. However, for larger sized particles (2.5 and 5 μm) whose settling velocities quickly increase, the effect of head direction also increases. Take nasal breathing as an example: the face-up versus face-side scenarios have about 10% difference for 2.5-μm particles and about 20% for 5-μm particles (Fig. 4b).
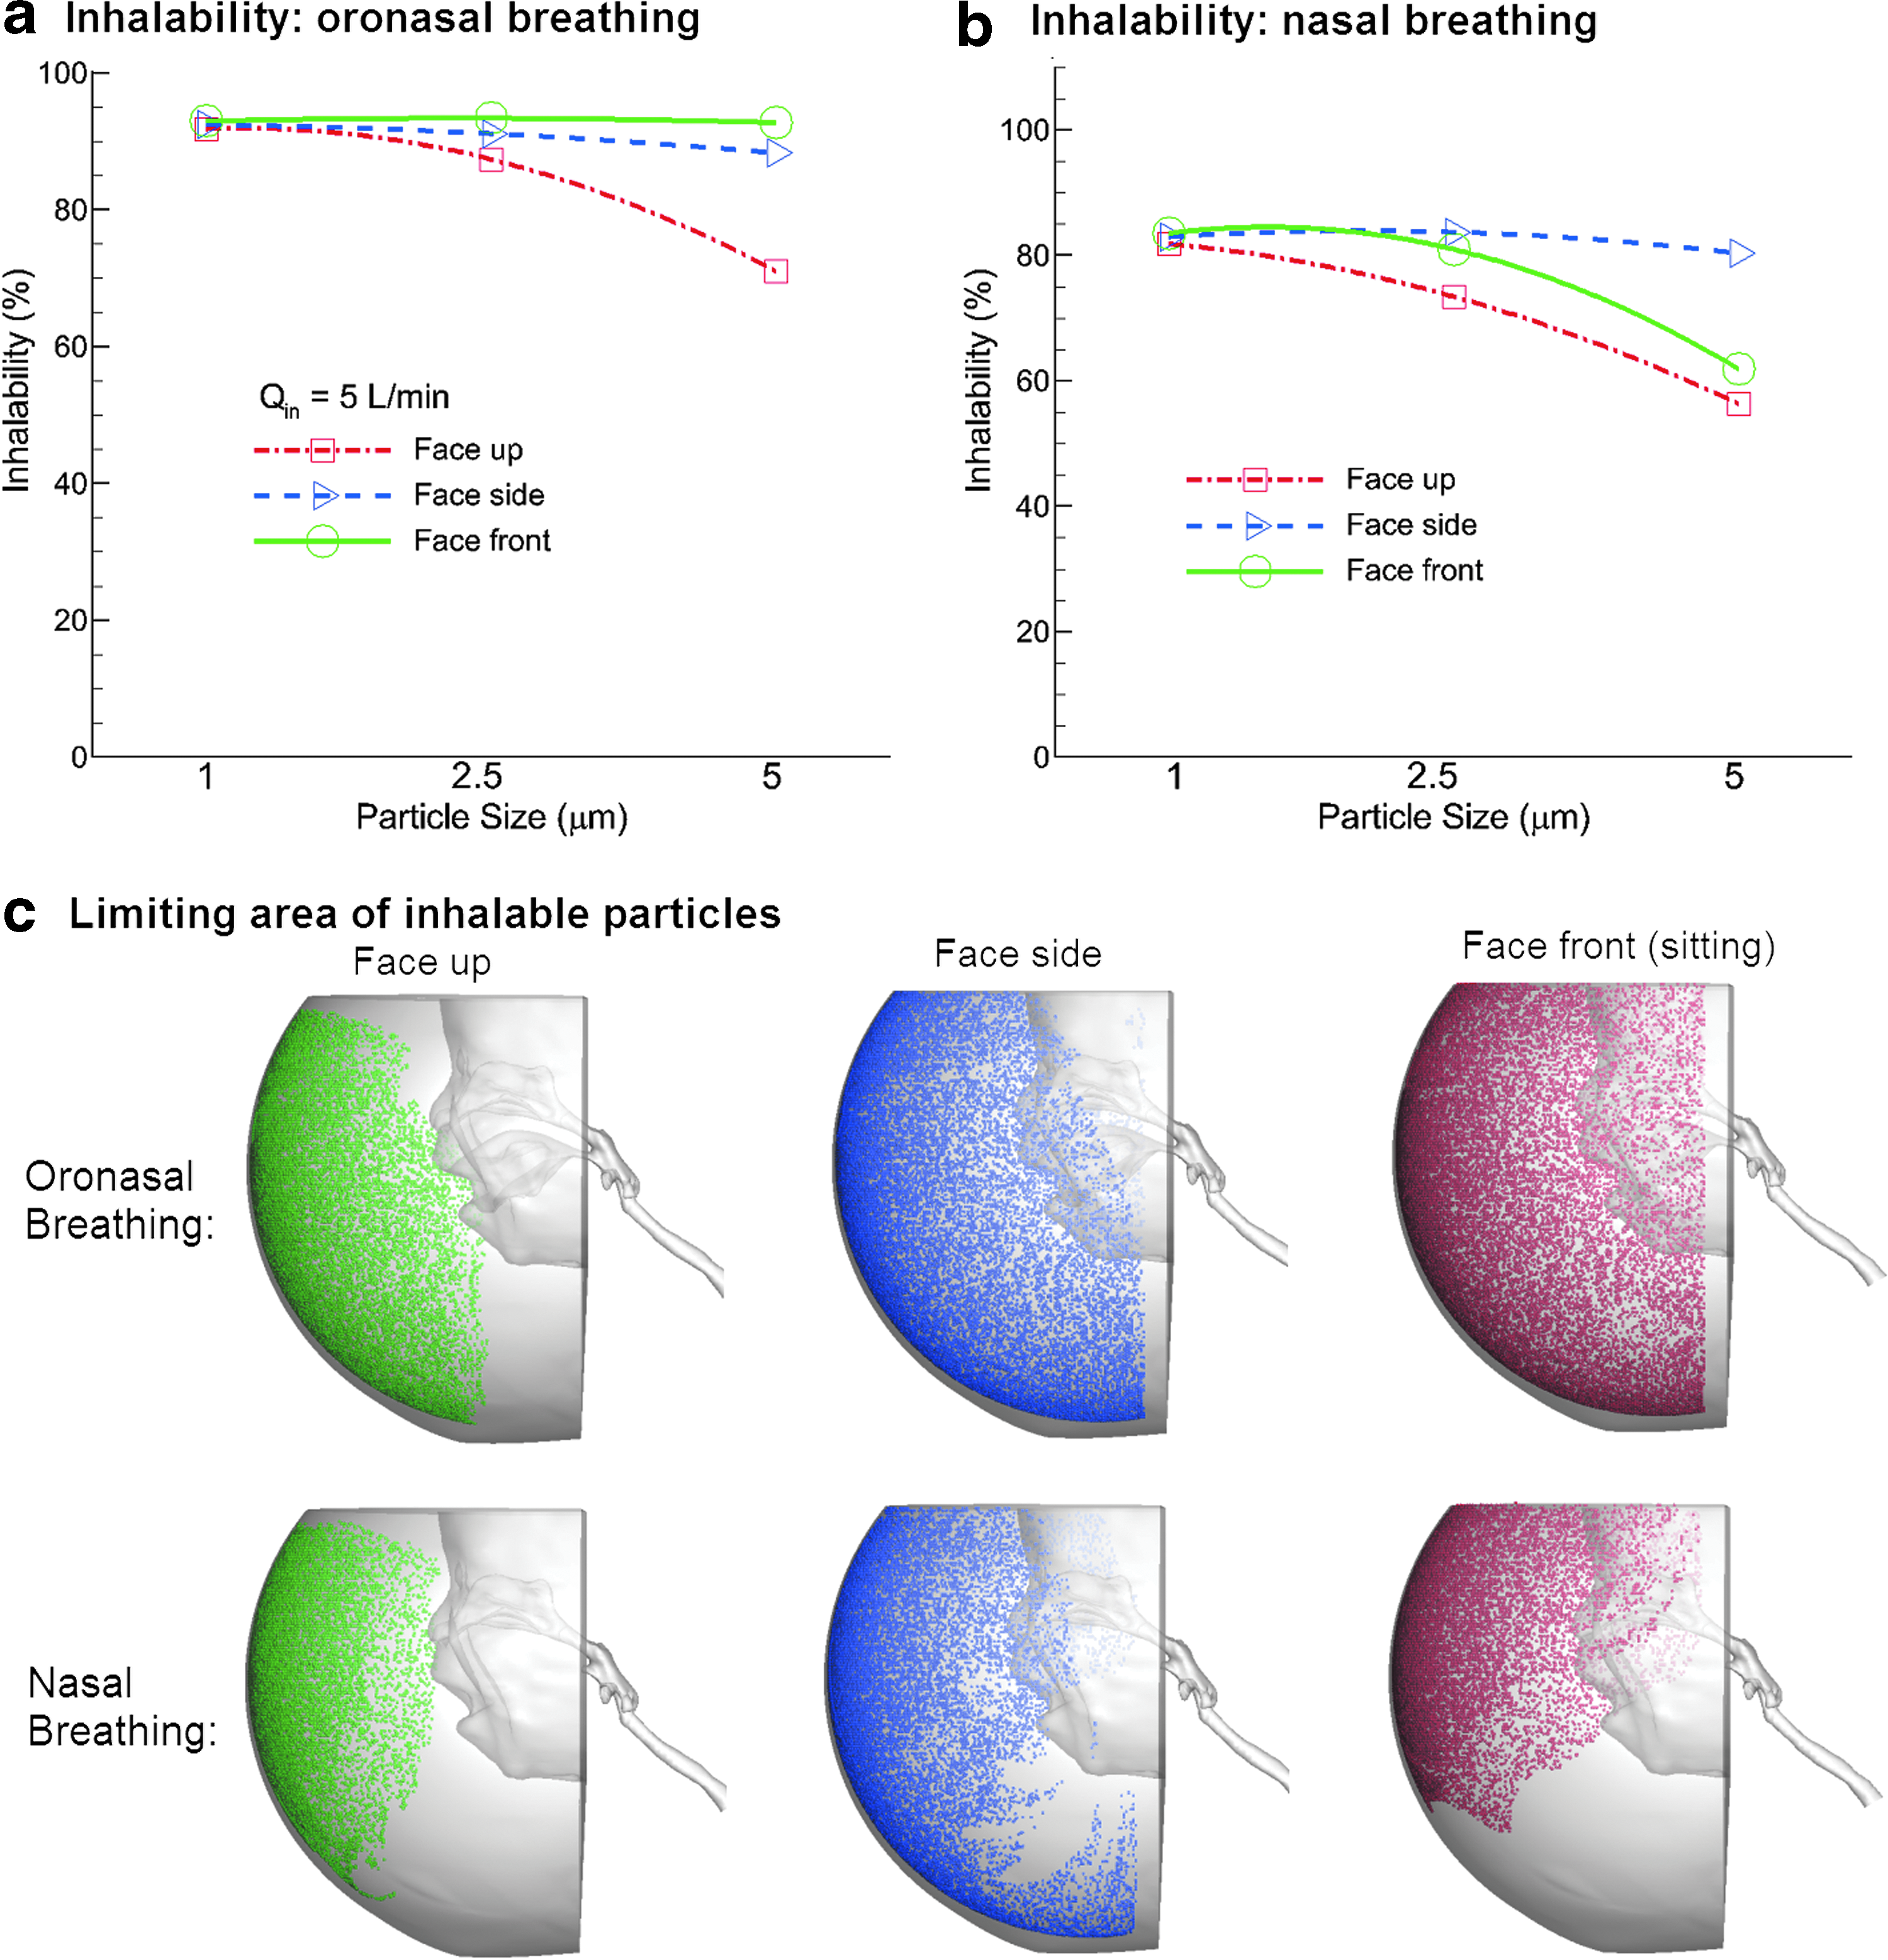
Inhalability of pharmaceutical aerosols in the 7-month-old infant model at an inhalation flow rate of 5 L/min with three head directions for
Figure 4c shows the limiting area of inhalable particles for 5-μm aerosols and 5 L/min inhalation flow rate. Beyond this limiting area, medication particles cannot enter the infant airway and are wasted. On the other hand, medications released within this area have a better chance to be inhaled and reach the lungs. As the nasal breathing case represents the more conservative estimation of the limiting areas of these two, it should be used as the base case in the treatment planning with nebulizer hood.
Lung delivery efficiency
In this study, the lung delivery efficiency is defined as the fraction of particles exiting via the trachea outlet to the particles that are administered to the infant. Medication aerosol particles inhaled into the airway must escape the upper airway filtration before entering the lungs. For the protocols considered in this study, an average of 22.5% lung delivery efficiency was achieved with oronasal breathing and 18.5% with nasal breathing (Fig. 5), which agreed fairly well with the in vitro measurement (18±2%) reported by Shakked et al.(8) In this case, nasal breathing gives about 17.8% lower lung deposition compared with the oronasal breathing. The head direction effect is insignificant for small particles (1 μm) but increases for larger sized particles. A maximum of 5% difference was observed between face-up and sitting positions for 5-μm particles. Comparable lung delivery efficiencies were predicted between face-side and sitting positions.

Lung deposition fraction versus particle size in the 7-month-old infant model with three head positions for
Face (or facial-ocular) deposition
Using a hood device may inevitably deliver unwanted medications to the face or eyes of the infant, which may irritate the eyes or cause other adverse side effects. Figure 6a shows the facial distributions of aerosol distribution for different head directions and breathing modes under quiet breathing conditions (Q=5 L/min). The particle size reported in this figure is 2.5 μm. Dramatic differences of the face deposition were predicted among the three head directions considered. In contrast, negligible differences were noted between the two breathing modes (Fig. 6a). As expected, the face-up position gave rise to the most widespread deposition on the infant's face, whereas the face-side position had depositions only on half of the facial area. It is, however, less expected that there was much less face deposition with the sitting (face-front) position, and that the particles were confined in a limited area between the upper lip and nostrils (Fig. 6a).

Face deposition distributions
Face deposition fractions versus particle size are illustrated in Figure 6b and c for an inhalation flow rate of 5 L/min. For a given head direction, nasal breathing produces 65% higher facial-ocular deposition on average than oronasal breathing (Fig. 6c versus b), presumably due to the higher airflow speed in the vicinity of the nose. Interestingly, the response of the facial-ocular deposition to particle size is strikingly different between the face-up and sitting positions, and increases with particle size for the face-up position, but decreases for the sitting position. This is perfectly reasonable when considering the face as the receiving surface for the gravity-induced settling particles. The face-up position has the maximum possible receiving area for these settling particles. The larger the particle sizes, the faster the particles will deposit. In contrast, the sitting position has nearly zero effective receiving area. Facial-ocular deposition occurs only when the settling particles are dragged toward the face by the inhaled airflow. As a result, the sitting position produces the minimum face deposition with no discernible deposition in the eye zone.
Subregional deposition in the extrathoracic airway
Particle distributions within the extrathoracic airway were found to be sensitive to breathing mode and head direction, as shown in Figure 7, which reports the subregional deposition rates at different airway anatomies. In this figure, the inhalation flow rate is 5 L/min, the particle size is 5 μm, and the subregions considered include nasal vestibule and valve, turbinate region, nasopharynx, pharynx, and larynx. Considering the effects of the breathing mode, oronasal breathing leads to much higher depositions in the pharynx and larynx compared with the nasal breathing mode (30% versus 12% on average). In contrast, nasal breathing gives higher turbinate deposition than the oronasal breathing (8% versus 3% on average). The effect of head direction on subregional deposition is also substantial, but its pattern appears rather erratic (Fig. 7a versus b).
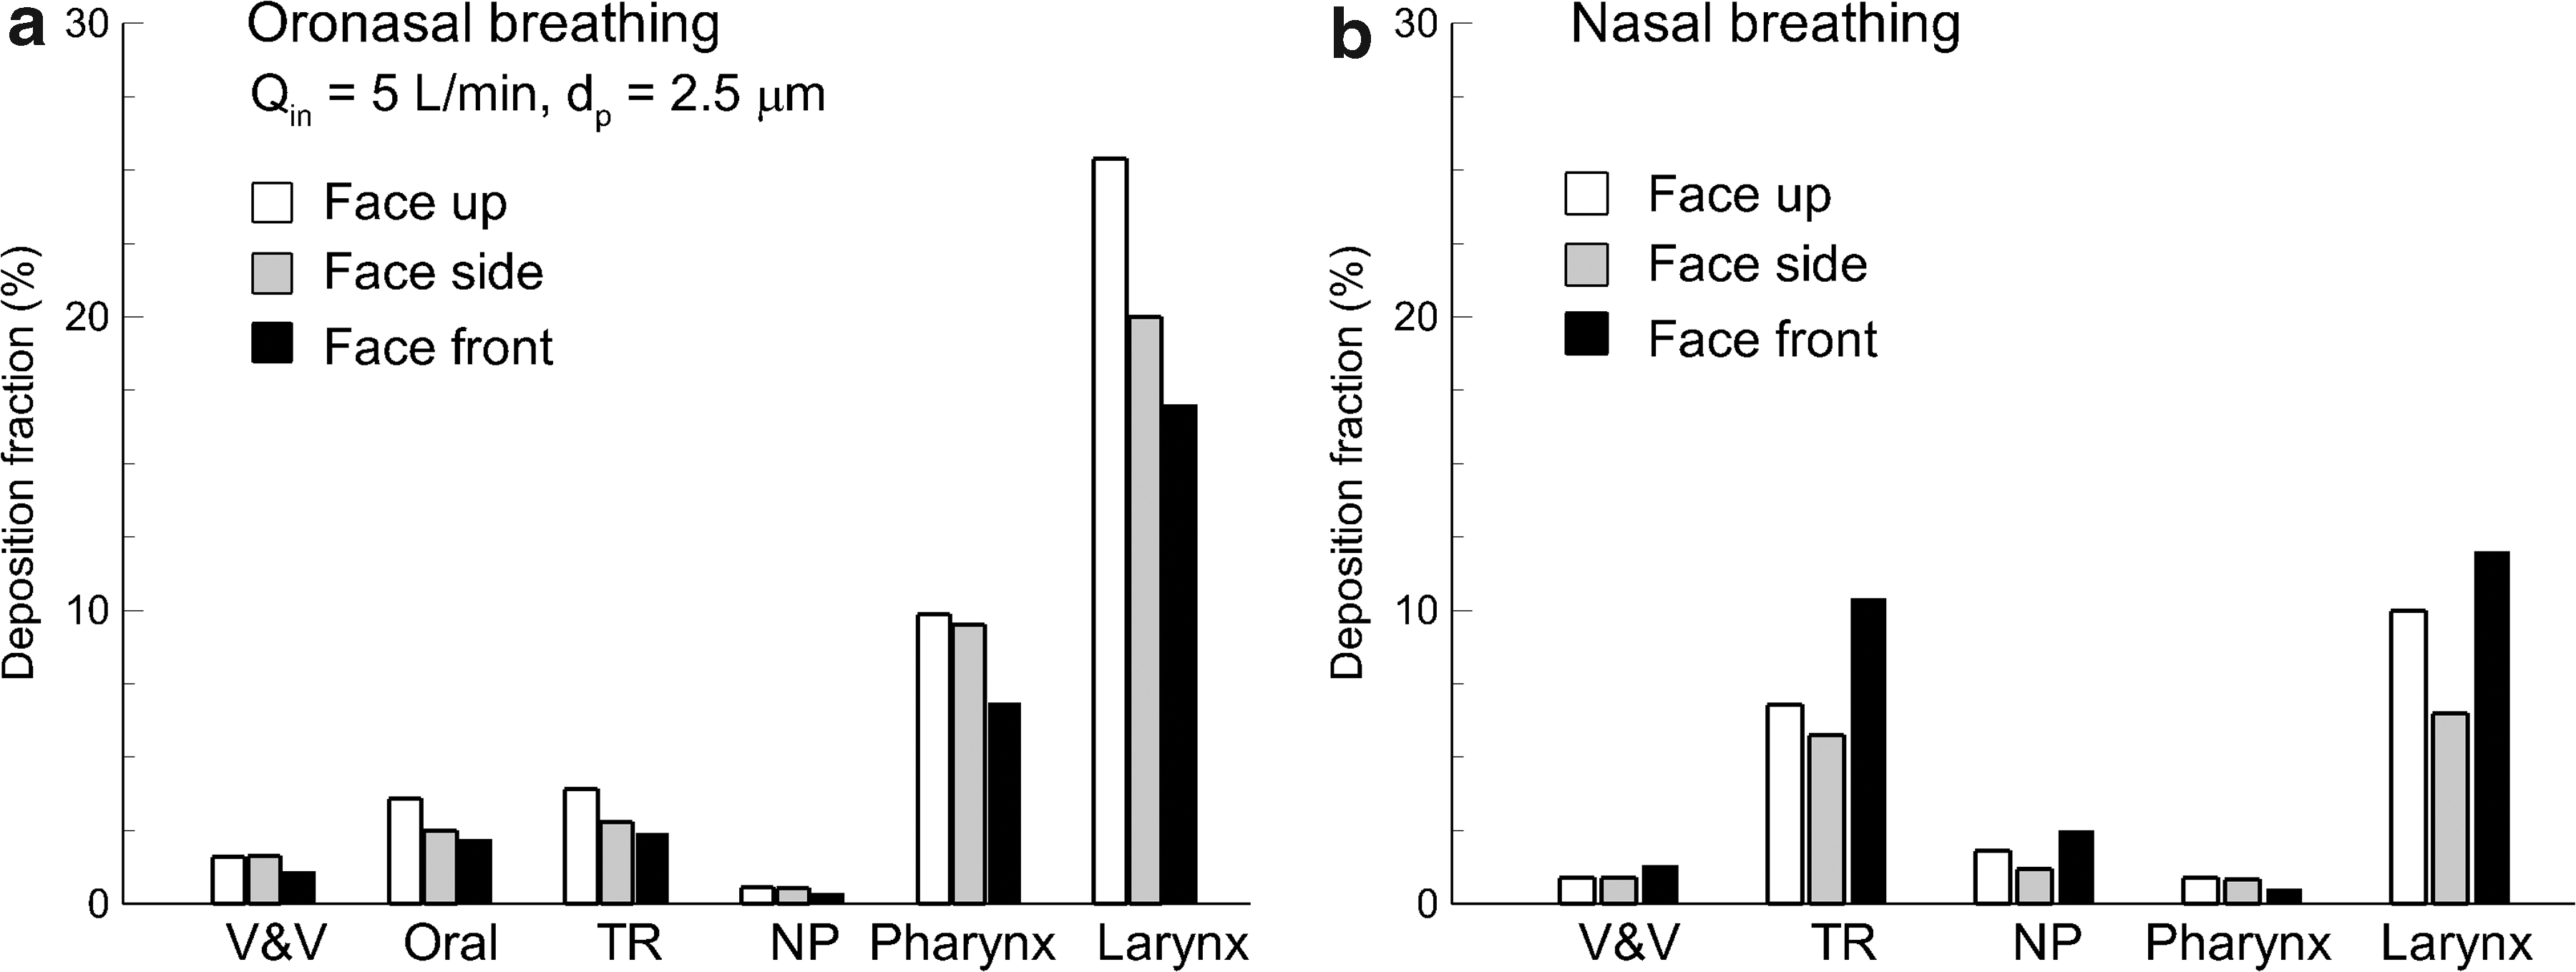
Subregional deposition for different head directions and breathing modes under quiet breathing conditions (Q=5 L/min):
Discussion
Knowing the respiration flow details is crucial to understanding the inhalability, facial-ocular deposition, upper airway deposition, and lung delivery efficiency of administered aerosolized medications. Whether a particle can be inhaled into the infant's airway is determined by a dynamic rivalry between the gravity-related sedimentation and the drag force exerted by the inhalation flow toward the nose or mouth. The closer a particle is to the nose or mouth, the larger drag force it will experience. Once inhaled, particles will either be filtered out by the extrathoracic airway that has complex anatomical structures, or enter the lungs and reach the site of action. Particles that travel toward the face, but do not make it into the airway, will possibly deposit on the face, causing irritations and other adverse side effects to the skin or eyes. Furthermore, the quantitatively accurate prediction of the performance of such an aerosolized lung delivery system entails capturing the behaviors of the carrier flow and pharmaceutical particles, as well as their dynamic interactions. In addition, small anatomical details can significantly alter the respiratory airflow and aerosol coupling behavior, necessitating a high degree of accuracy of face and airway geometries. One major advantage of studying this system using the coupled imaging-CFD approach, as in this study, is the capacity to examine different realistic scenarios while avoiding confounding factors in clinical applications.
One implication from the results of this study is to provide guidance on the best practices of using the nebulizer hood therapy. Face deposition of hood administered medications is inevitable but should be minimized. It may irritate the eyes and skin of the infants, and thus cause crying or other involuntary protests, which either remarkably affect the therapy outcome or completely interrupt the therapy process. Inhaled anti-inflammatory medications such as corticosteroids are commonly used to treat respiratory lesions related to nasal mucosa, sinuses, bronchi, and lungs. It has been clinically shown that a long-duration exposure of an infant's face to the corticosteroids can cause itchiness, dryness, dermatitis, or other adverse cutaneous reactions.(19) More seriously, corticosteroid accumulation at the infant's eye zone may cause cataracts, glaucoma, or retinopathy, or worsen these conditions if they are already present.(20,21) Results of this study have clearly demonstrated that the head position has a predominant effect on the facial-ocular deposition. The face-up position gives much higher particle accumulation on the face or eye zone than the other two positions, whereas the upright sitting (face-front) position gives the least accumulation. On the other hand, the head-direction effect on the lung delivery efficiency is not that significant (18.5–22.5%). Although hood nebulization treatment is mainly intended for sleeping infants, who lie on either their back or side, the face-side position appears to be better for the comfort and safety compared with the face-up position.
One interesting observation is that 1-μm aerosol removes the influence of the face position and provides similar lung delivery efficiency. This observation is reasonable in that inhaled airflows are largely independent of the head position because of the air's low density and insensitivity to gravity. Particles of 1 μm that are entrained in inhaled airflows will faithfully follow the stream traces due to their negligible inertia and diffusivity. In other words, they act more like airflows than large particles. As a result, insignificant differences were observed among the three head positions in all parameters of interest of this study (i.e., inhalability, face deposition, and lung delivery). In contrast, large particles deviate from abrupt stream curvatures due to amplified inertial and gravitational effects, leading to different face and lung depositions.(22) The larger the particle is, the more deviation and larger difference there will be. This result, however, should not be interpreted as 1-μm aerosol being the recommendation, as a substantial fraction of such particles inhaled into the lungs could be exhaled out and wasted.
In this study, the infant model has a much larger mouth opening compared with subjects assuming normal breathing activities. With this model and prescribed pressures at nostrils and tracheal outlet, the oral-nasal flow partition ratio is predicted to be 65% versus 35%. This flow ratio is much larger than the spontaneous oronasal breathing in normal infants, which has been reported to be 30% versus 70% during sleep.(23) The flow resistance is similarly lower in this study, leading to lower deposition in the upper airways and subsequently higher lung delivery efficiency. It is also evident from Figure 1a that this infant was in a crying mode. Much lower actual lung delivery is expected than that predicted in this study. Therefore, the oronasal breathing case in this study represents the upper limit of lung dosage that can be achieved via a nebulizer hood.
Factors that limit the physical realism of the current study include the assumptions of steady flows, inhalation only, and a rigid airway surface. Both tidal breathing and exhalation could affect particle motions in the vicinity of the face and alter the facial depositions. The movement of the airway surface during a breathing cycle also exerts an ineligible effect on respiratory flows and particle dynamics. Moreover, the infant model was developed based on CT scans of one single subject and did not account for intersubject variability or age effect. Steady inhalations were adopted in this study to avoid the prohibitive computational expense required for tidal breathings. Exhalations were excluded for the same reason. Based on a mesh size of 3.8 million and 100,000 particles, one steady simulation in this study took about 20 hr in an Intel 2.27-GHz workstation. By contrast, one transient breathing cycle with 50 time steps would take about 1,000 hr. For aerosols released 15 cm away from the infant's face, at least 21 sec are required for the particles to come close to the face under quiet breathing conditions, as shown in Figure 3b. This translates into 26 breathing cycles (26,000 computational hours) based on a minute respiratory frequency of 25 and an inhalation:exhalation ratio of 1:2.(13) Further numerical analyses and complimentary in vivo studies are needed to better evaluate the effects of tidal flows, compliable walls, and intrasubject variability to improve predictions of the drug dosage delivered to infants via hood nebulization. Specific findings of this study include the following:
1. Head direction has a strong effect on the facial-ocular deposition distributions, whereas breathing mode does not. Facial-ocular deposition rate is highest with the face-up position and is lowest with the upright sitting position. 2. Nasal breathing generally gives twofold higher face deposition (∼15%) compared with that of oronasal breathing (∼8%) under equivalent breathing conditions. 3. Both the head direction and breathing mode noticeably affect the inhalability and lung delivery efficiency. An average of 22.5% lung delivery efficiency was predicted with oronasal breathing and 18.5% with nasal breathing, which agreed fairly well with reported in vitro measurement (18±2%). 4. Compared with the supine (face-up) position, the face-side position has less facial-ocular deposition but comparable lung delivery efficiencies, and appears to be a better option for comfort and compliance reasons.
Footnotes
Acknowledgments
Gregory Oldham, Casey Lang, and Chad Blohm are gratefully acknowledged for helpful discussions and for reviewing the manuscript.
Author Disclosure Statement
The authors declare they have no conflicts of interest.