




Abstract
Abstract
Background:
To provide a validation dataset for aerosol deposition modeling, a clinical trial was performed in which the inhalation parameters and the inhaled aerosol were controlled or characterized.
Methods:
Eleven, healthy, never-smokers, male participants completed the study. Each participant performed two inhalations of 99mTc-labeled aerosol from a vibrating mesh nebulizer, which differed by a single controlled parameter (aerosol particle size: “small” or “large”; inhalation: “deep” or “shallow”; carrier gas: air or a helium–oxygen mix). The deposition measurements were made by planar imaging, and single photon emission computed tomography–computed tomography (SPECT-CT).
Results:
The difference between the mean activity measured by two-dimensional imaging and that delivered from the nebulizer was 2.7%, which was not statistically significant. The total activity deposited was significantly lower in the left lung than in the right lung (p<0.0001) with a mean ratio (left/right) of 0.87±0.1 standard deviation (SD). However, when normalized to lung air volume, the left lung deposition was significantly higher (p=0.0085) with a mean ratio of 1.08±0.12 SD. A comparison of the three-dimensional central-to-peripheral (nC/P3D) ratio showed that it was significantly higher for the left lung (p<0.0001) with a mean ratio (left/right) of 1.36±0.20 SD. The effect of particle size was statistically significant on the nC/P3D ratio (p=0.0014), extrathoracic deposition (p=0.0037), and 24-hr clearance (p<0.0001), contrary to the inhalation parameters, which showed no effect.
Conclusions:
This article presents the results of an analysis of the in vivo deposition data, obtained in a clinical study designed to provide data for model validation. This study has demonstrated the value of SPECT imaging over planar, the influence of particle size on regional distribution within the lung, and differences in deposition between the left and right lungs.
Introduction
T
Recently, we have published preliminary comparisons of individual experimental data with existing models.(4) Indeed, we describe the experiments as individualized, because each inhalation experiment on each subject is complete in and of itself in that the physical mechanisms and models could be investigated solely based on that experiment. Furthermore, other articles analyzing the computed tomography (CT) scans have appeared considering morphological characteristics and volume measurements.(5,6) Presented herein are the analyses of the two inhalation experiments for each of the 11 healthy, male volunteers in terms of imaging techniques, dose accountability, 24-hr clearance, comparison of right versus left lung deposition, and influence of the controlled parameters (particle size, depth of breathing, carrier gas) on aerosol deposition. That is, we recognize that these well controlled and characterized experiments could be harvested for information in and of themselves without respect to modeling. However, it should be recognized that what we have called the individual nature of each inhalation experiment complicates the statistical analysis. For example, we present datasets that consist of 22 observations, where two were obtained for each subject, but at least one of the other experimental parameters was also changed such that no two experiments are identical. Thus, the reader should remain aware that two observations were made on each subject, so the data are not independent in that sense. For the analysis of variance performed, the controlled parameters were considered to be the explanatory variables.
Materials and Methods
A brief description of the clinical study and the analysis methods appear in this section.
Clinical study
The clinical study was performed at the Departments of Nuclear Medicine and Radiology of University Hospital Southampton NHS Foundation Trust Southampton, UK. Approval for the clinical study was obtained from the local research ethics committee and the UK Administration of Radioactive Substances Advisory Committee (ARSAC). Eleven healthy, male participants completed the study, the first five making up a “pilot” study and the remaining six the “main” study. The inclusion criteria were: male volunteers, aged between 18 and 65 years, never-smokers, and lung function tests within the normal range (forced expiratory volume in 1 sec, forced vital capacity, flow volume curves, salbutamol reversibility, carbon monoxide transfer factor, and measurement of lung volumes).
Participants inhaled isotonic saline aerosols seeded with a suspension of 99mTc-labeled particles of human serum albumin (Nanocoll®, GE Healthcare, Buckinghamshire, UK), administered by an AKITA2® device (Activaero GmbH, Gemünden, Germany) connected to a vibrating mesh aerosol generator that uses TouchSpray® Technology (PARI Pharma, Starnbeg, Germany). The AKITA2 device allows control of the ventilatory regime and aerosol characteristics. The AKITA2 APIXNEB was used for air, and a special version of the device calibrated for a helium–oxygen mixture (medicinal 78% He/22% O2, Air Liquide Deutschland GmbH, Düsseldorf, Germany) was used when helium–oxygen was the carrier gas. After inhalation, 3D-SPECT images were acquired with LRCT scans to account for attenuation. The acquisition was done with a GE Infinia dual-head gamma camera with Hawkeye 4 CT attachment (GE Medical Systems, Milwaukee, WI). The initial deposition of aerosol was captured by a 60-sec anterior/posterior planar image of the oropharynx, followed by a further 60-sec anterior/posterior acquisition of the lungs and stomach. Then a SPECT acquisition (10-min duration) was completed, and followed by an LRCT image of the thorax at mean tidal breathing, which provided 90 slices with an interslice separation of 4.42 mm. A second planar anterior/posterior lung image was then acquired, a mean of 36 min after the first one. This enabled an estimate of the rate of lung clearance, which could be used to correct activities derived from the SPECT image for this factor. Planar imaging of the nebulizer, the exhalation filter, and the standard (small accurately measured source of known activity used to check the sensitivity of the gamma camera) was also performed afterwards. The following day, a planar anterior/posterior image of the lungs was acquired to calculate the 24-hr clearance, which is a measure of deposition in the conducting airways.
Each subject performed two inhalations at a 1-week interval, totaling 22 3D-SPECT/CT experiments for all participants. For every subject, the two experiments differed by a single controlled parameter: particle size (small or large), depth of breathing (deep or shallow), or carrier gas (air or helium–oxygen mixture). One exception was a pilot experiment with large particles, shallow breathing, and air, where the two experiments consisted of inhalation in the erect and then in the supine position. The characterization of particle size and breathing pattern is given in Table 1. Detailed descriptions of the study can be found in previous articles.(2,3)
FRC, functional residual capacity; GSD, geometric standard deviation; VMD, volume median diameter; NA, not available.
The table shows the VMD, GSD, breathing patterns, and subject data.
The inspiratory flow rate was controlled by the AKITA device and set constant to 18 L/min. However, the time for exhalation and breath hold were not controlled, as breaths were triggered by the subject; thus, minute ventilation of 9 L/min is only an estimate. Measurements of breath-hold and exhalation timing were done with an Embletta sleep diagnostic kit (Emblas, Denver, CO) and are included in the study database.(2)
Analysis
The distribution of activity in the different sections of the airway was determined from analysis of the planar images.(2) In brief, lung regions of interest (ROIs) were obtained from the CT images, and the activities in the lungs were calculated from the geometric mean counts in the ROIs on anterior and posterior images after correction for radioactive decay, background, mucociliary clearance, and attenuation. The activities in the trachea/main bronchi, the oropharynx, the stomach, the exhalation filter, and the amount remaining in the nebulizer after inhalation were also obtained from planar imaging. Activity in the stomach was added to that in the oropharynx to give an estimate of extrathoracic (ET) deposition. The amount of activity placed into the nebulizer was measured on an isotope calibrator. Dose accountability was performed by calculating the amount of activity leaving the nebulizer and comparing it with that obtained by summing the activity in the body and exhalation filter from the imaging measurements.
The 3D spatial distribution of aerosol deposited in the airways was assessed using several parameters. The process began by dividing the right and left lung ROIs, determined from the LRCT images, into 10 concentric shells or annuli from center to periphery, using the hilum as the center of the transform.(5) The hilum was taken as the first bifurcation of the main bronchus as suggested in the new guidelines for SPECT measurement of aerosol deposition.(7) The shell data were corrected for partial volume,(8) and the 3D central-to-peripheral ratio (C/P3D) was calculated by dividing the activity in the inner five 3D shells by that in the outer five:
where Si is the count in shell i on the SPECT image.
As the C/P ratio has been shown to depend on lung shape,(8) the value was normalized to the 3D C/P ratio of an air volume image derived from the LRCT.(5) The 3D C/P ratio normalized to lung volume, nC/P3D, is defined by:
Other estimations of deposition in the conducting airways were made using the analysis of the SPECT data. Deposition by airway generation was calculated using a conceptual model of the spatial arrangement of the lung airway generations within each shell to obtain a mapping to transform shell deposition into generational deposition.(1)
Conducting airways deposition was calculated from the SPECT images in two ways: (i) based on the standard International Commission on Radiological Protection (ICRP) definition of the conducting airways represented by generations 2–15 [conducting airways deposition fraction (CADF)], and (ii) as defined by Weibel(9) (wdf), who considered that a fraction of generations 16–19 were part of the conducting airways,
where Gj is the deposition in generation j.
The bronchial airways deposition fraction (BADF), defined by generations 2–8, was also calculated.
Deposition in the conducting airways was also derived from the 24-hr image. The activity in this image was analyzed as described above, and after all the corrections had been applied, the activity in each lung was compared with that in the image obtained immediately after inhalation. Clearance was calculated as the percentage loss of activity from the lung at 24 hr relative to the amount in the original image. This is considered to be an estimate of the deposition in the conducting airways.(10)
The rate of clearance is determined from the change in count on the anterior images taken before and after the SPECT study, which is assumed to be linear. The mean reduction in counts due to clearance during the SPECT imaging was estimated at the mid time of the SPECT image acquisition. The mean time for this relative to the mid time of inhalation was 16 min. The mean clearance over this period was 2.5% for the right lung and 3.7% for the left lung. Although small, the clearance should be noted, because to do so will reduce differences, as the systematic difference between planar and SPECT measurements was −11.9% before correction versus −8.4% after correction.
Statistical analysis
Parametric statistics were achieved using Excel (Microsoft, Redmond, WA) and SAS v9.2 (SAS Institute Inc., Cary, NC). A p value of less than 0.05 was considered a significant difference. Random difference between two variables was obtained after linear regression either as the standard error of the estimate or the coefficient of variation.
Results
Analysis of SPECT-CT accuracy
Comparison between 3D-SPECT and planar imaging
The total aerosol deposition in the right and left lungs determined from planar [two-dimensional (2D)] and SPECT (3D) imaging for all the participants is compared in Figure 1. The planar values were systematically higher than the SPECT by 8.4%. The random difference between these two measurements as determined by the coefficient of variation was 7.6%. These statistics were calculated after correction for mucociliary clearance of the radioaerosol from the lungs.
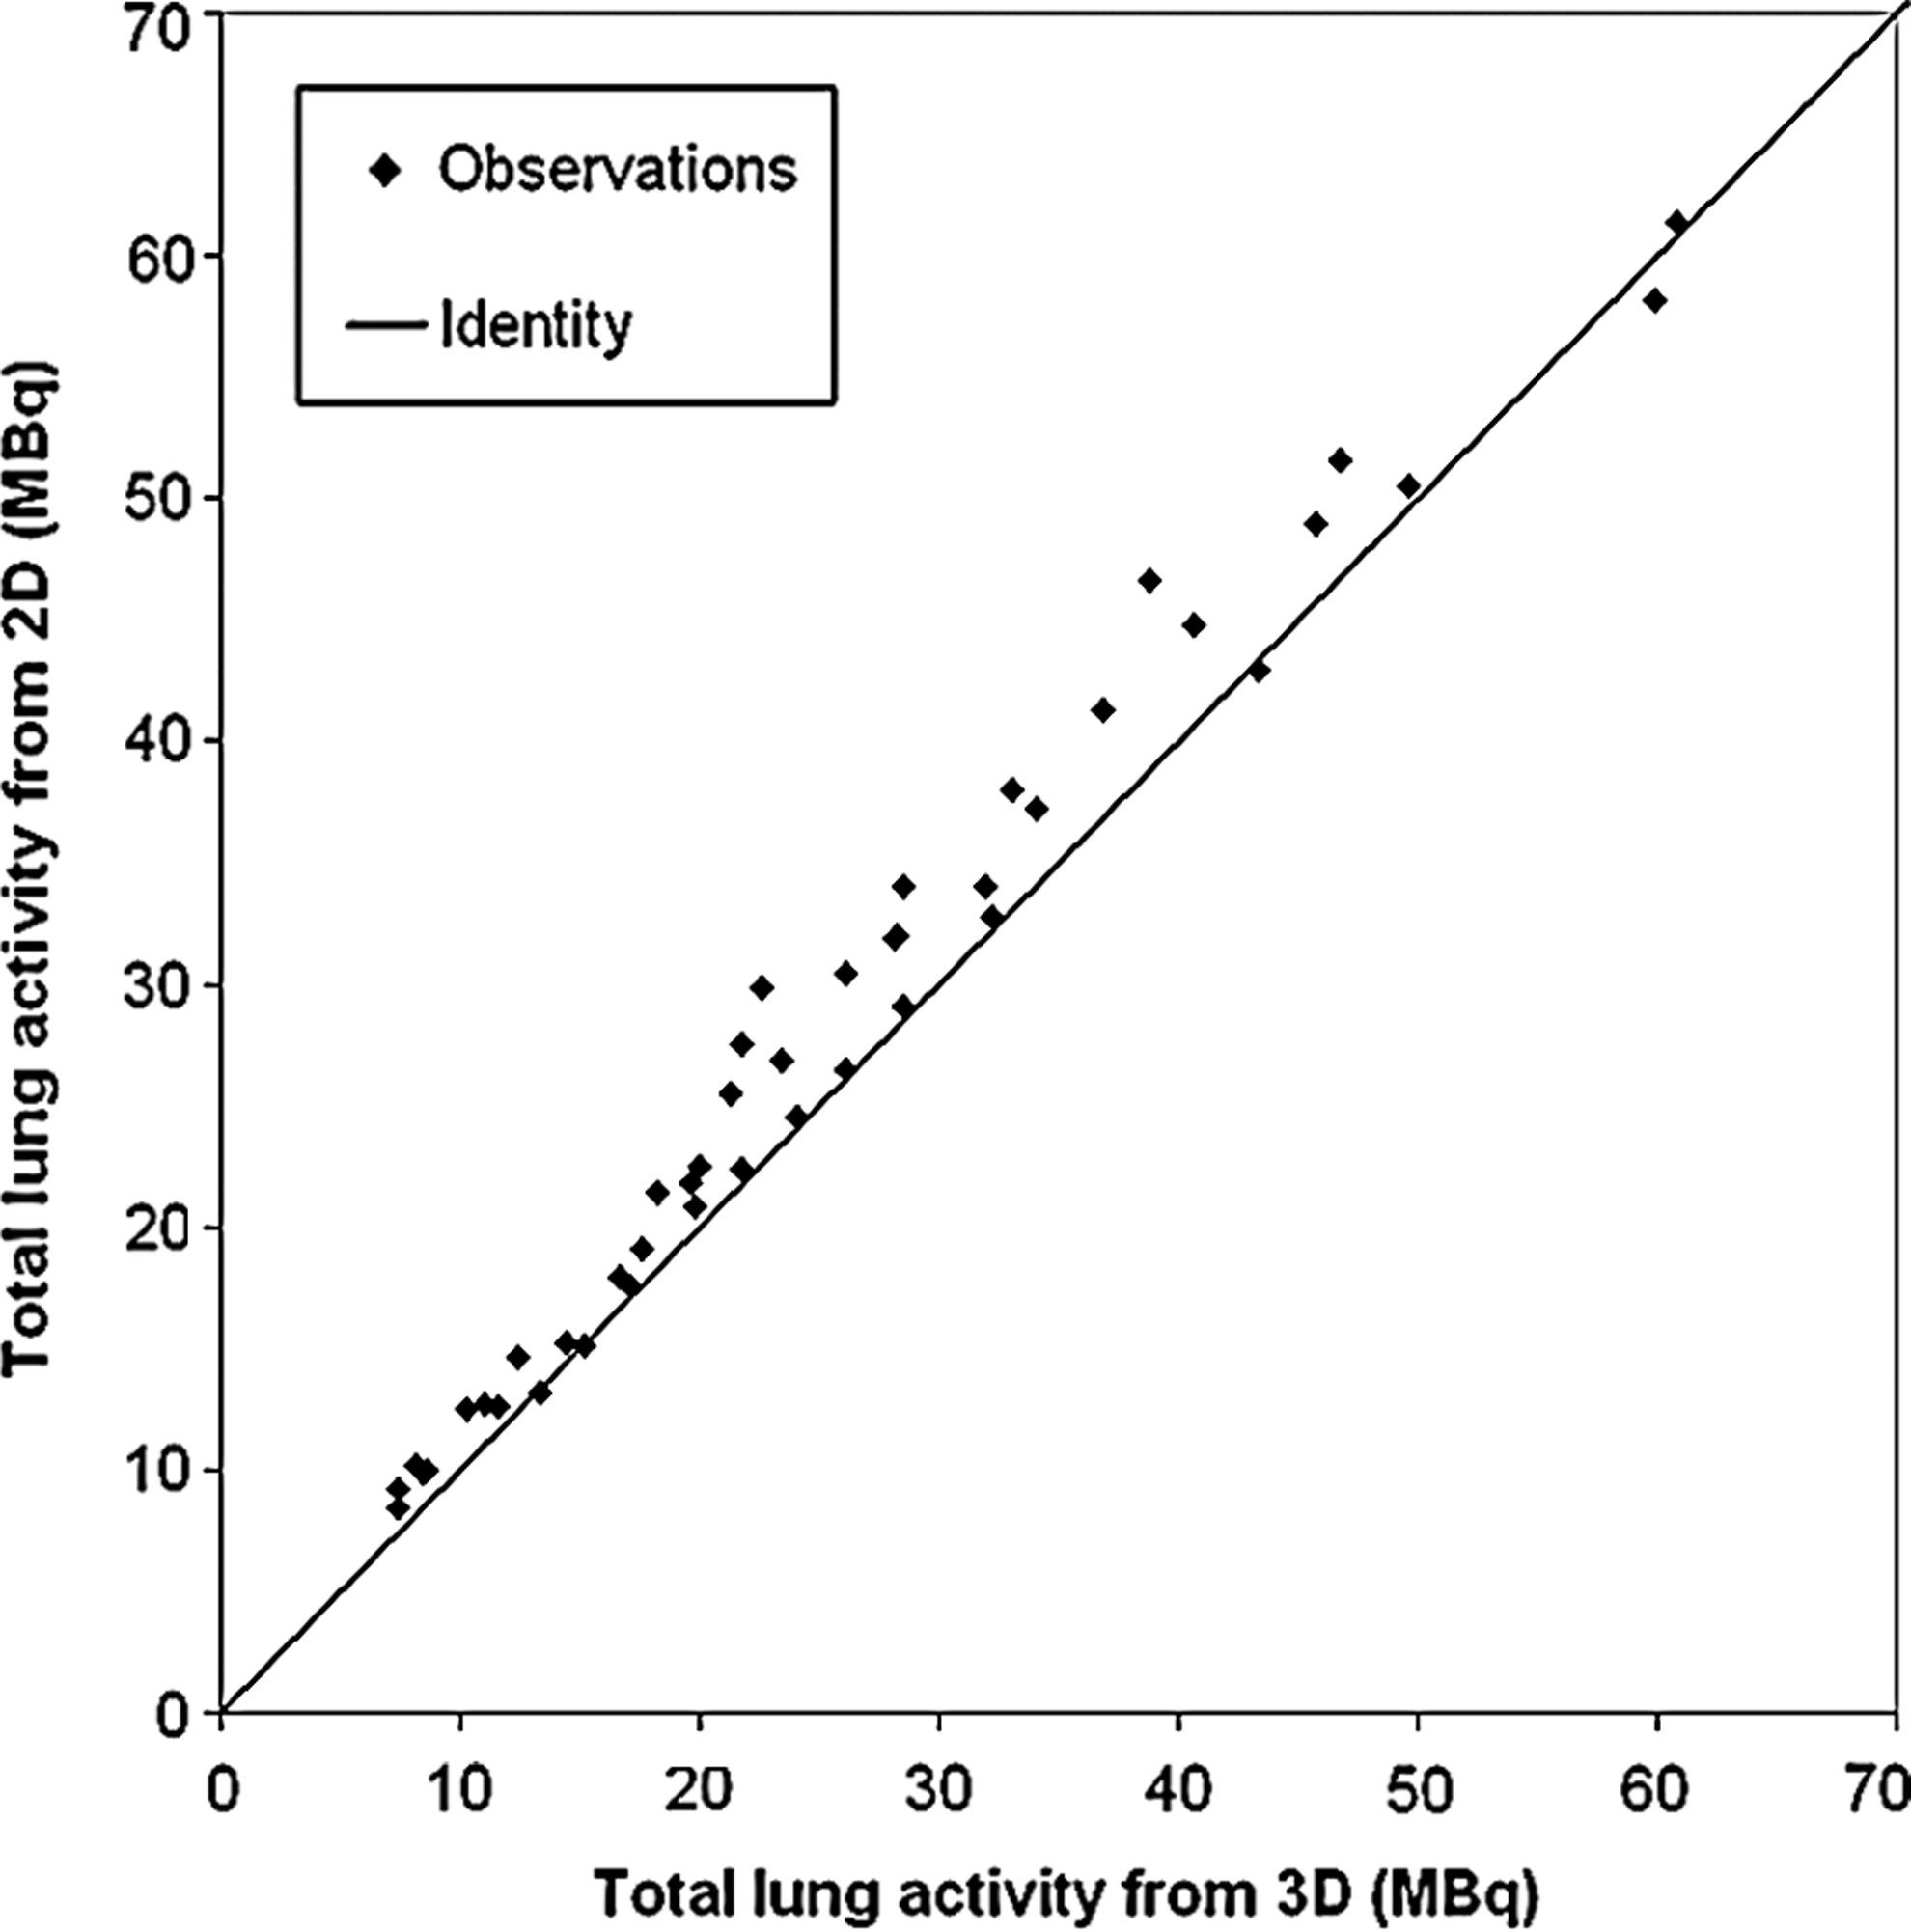
Total deposition in each lung determined from planar (2D) and SPECT (3D) imaging, corrected for mucociliary clearance. The line is the identity line.
Dose accountability for planar imaging
Figure 2 shows the total activity leaving the nebulizer assessed from (i) the difference in activity put into the nebulizer and that left after inhalation and (ii) the sum of the activity accounted for in the body and exhalation filter as determined from planar imaging. The mean total activity leaving the nebulizer was 86.5±29.3 standard deviation (SD) MBq (n=22). The second measurement obtained by summing the activity in the body and exhalation filter gave a mean value of 84.3±30.9 SD MBq (n=22). Statistical analysis (Student's t test) gave a p value of 0.0961, which indicates that there was no significant systematic difference between the two measurements. The random difference as measured by the coefficient of variation was 6.9%.
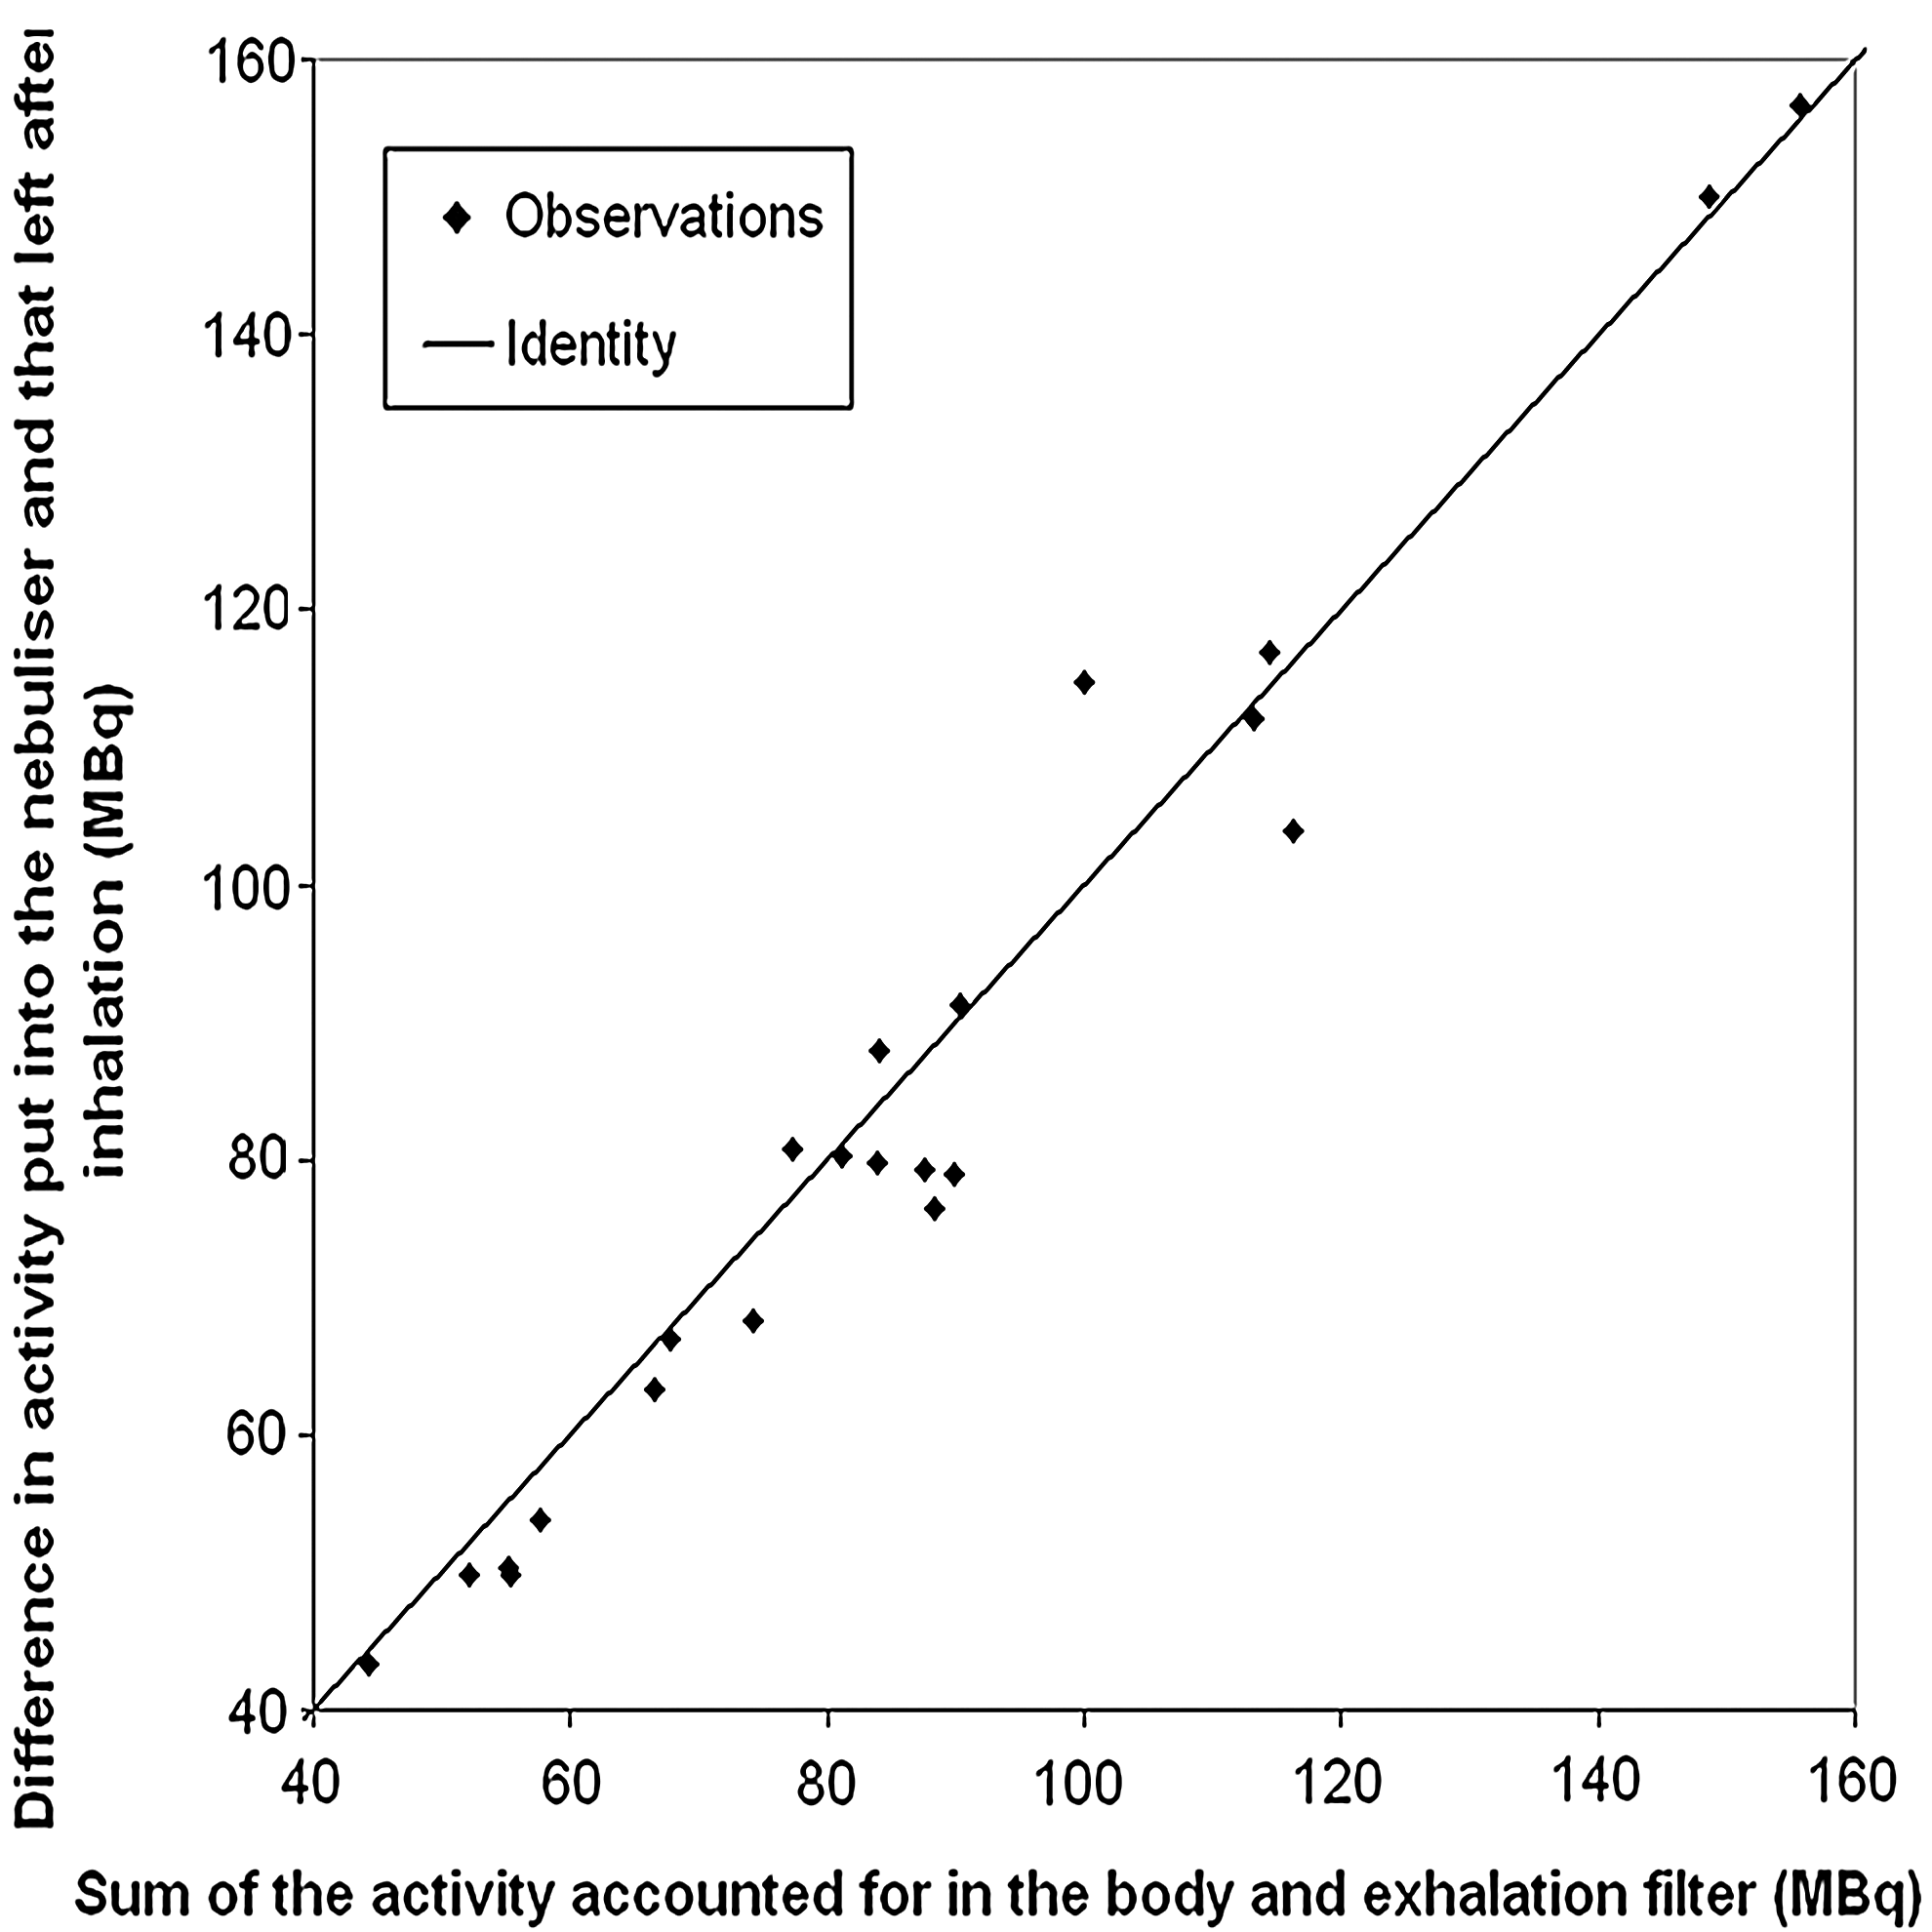
The total activity leaving the nebulizer assessed from (i) the difference in activity put into the nebulizer and that left after inhalation and (ii) the sum of the activity accounted for in the body and exhalation filter by planar imaging, corrected for mucociliary clearance. The line is the identity line.
Twenty-four–hour clearance
The 24-hr clearance is compared with the nC/P3D and with the outer-to-inner ratio (O/I), as shown in the graph of Figure 3. The C/P ratio has been the common expression of the regional deposition, but the reciprocal of this ratio, the O/I ratio, was recommended by the recently published guidelines on the standardization of techniques for the assessment of aerosol deposition from imaging.(7) Note that although the two methods of presenting the data are essentially equivalent, the resulting statistics in the form of correlation coefficients are different, if just slightly. We will use the C/P ratio for the remainder of this article to be consistent with our previous articles.(2,3)

The variation of 24-hr clearance with
To compare the spatial distribution of aerosol with the planar 24-hr clearance data in absolute terms, we calculated the following ratio:
where “24h clearance” represents the conducting airways deposition and “1 – 24h clearance” the pulmonary deposition. This is an estimate of the central-to-peripheral deposition ratio based on clearance measurements and is referred to as the 24-hr clearance C/P ratio. This has not been normalized for lung air volume in any way, so it is compared with the nonnormalized C/P ratio obtained from SPECT (Fig. 4A). There is good correlation between the two parameters, but the fraction of deposition in the central conducting airways derived from clearance is much higher than the fraction predicted from spatial analysis of SPECT. The equivalent correlation for the 2D C/P ratio is illustrated in Figure 4B, except that here only right lung data are presented. 2D C/P ratios were not calculated for the left lung due to overlap of the stomach. Again there is good correlation, but here the line of best fit does not pass through the origin, indicating that the two estimates of relative deposition in central and peripheral airways are not proportional. By contrast, the best fit line for the 3D C/P does pass close to the origin, suggesting it is a more faithful measure of the airway deposition. For comparison with previous results, the coefficients of variation of estimating 24-hr clearance from the normalized 2D and 3D C/P ratios for the right lung were calculated. These were 16.9% and 12.5%, respectively, which were just not significantly different (p=0.06).

The variation of “24h clearance/(1 – 24h clearance)” with
The inherent difficulty of assigning spatial deposition data to anatomical regions has been addressed by Fleming and his colleagues(3) by overlaying a morphological model in order to assign the deposition to the lung generations. Figure 5 shows the results assuming the standard ICRP definition of the conducting airways in the lung represented by generations 2–15 (CADF).
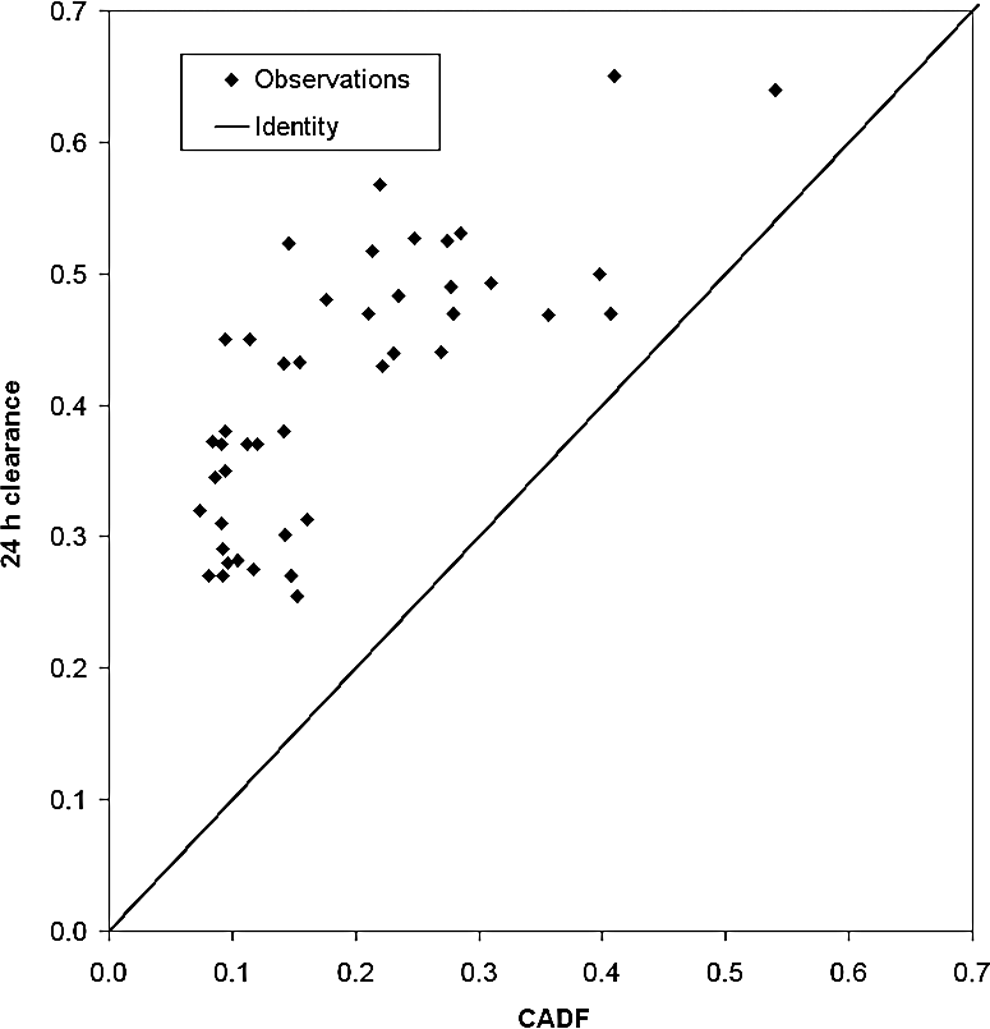
The variation of 24-hr clearance with the estimated fractional deposition in generations 2–15 (CADF). The line is the identity line.
Figure 6 shows the results obtained by assuming the Weibel definition of the conducting airways, wdf. It can be seen that the tracheobronchial (TB) deposition is under-represented (p<0.0001) in Figure 5 when using the ICRP definition, suggesting that aerosol was being cleared from airways deeper than generation 15. This is indeed consistent with wdf that includes a fraction of generations 16–19, thus improving the agreement as shown in Figure 6. The correlation coefficient (95% confidence interval) between wdf and 24-hr clearance was 0.60 (0.36; 0.75) (Pearson Correlation Statistics). The coefficient of variation of estimating the 24-hr clearance from wdf was 20%.

The variation of 24-hr clearance with the conducting airways deposition fraction (CADF) assuming the definition of the conducting airways in the Weibel model, wdf. The line is the identity line.
Comparison of right vs. left lung aerosol deposition
Planar imaging techniques used to measure aerosol deposition usually only consider the right lung, because the left lung can overlap the stomach where radioactivity deposited in the mouth and swallowed cannot be separated. Thus, it is of interest to compare quantitatively the deposition in the right and left lungs as deposition is known to be asymmetric,(11) using the 3D-SPECT images that permit the exclusion of counts in the stomach and more precise attenuation correction. This comparison is provided in terms of total deposition and regional deposition [nC/P3D ratio and BADF (generations 2–8)]. Figure 7 shows left versus right lung deposited activity. All the points are below the identity line, indicating that the total activity deposited is significantly lower in the left lung than in the right lung (p<0.0001) at a mean ratio (left/right) of 0.87±0.1 SD (n=22). However, when normalized to lung air volume using the following ratio:
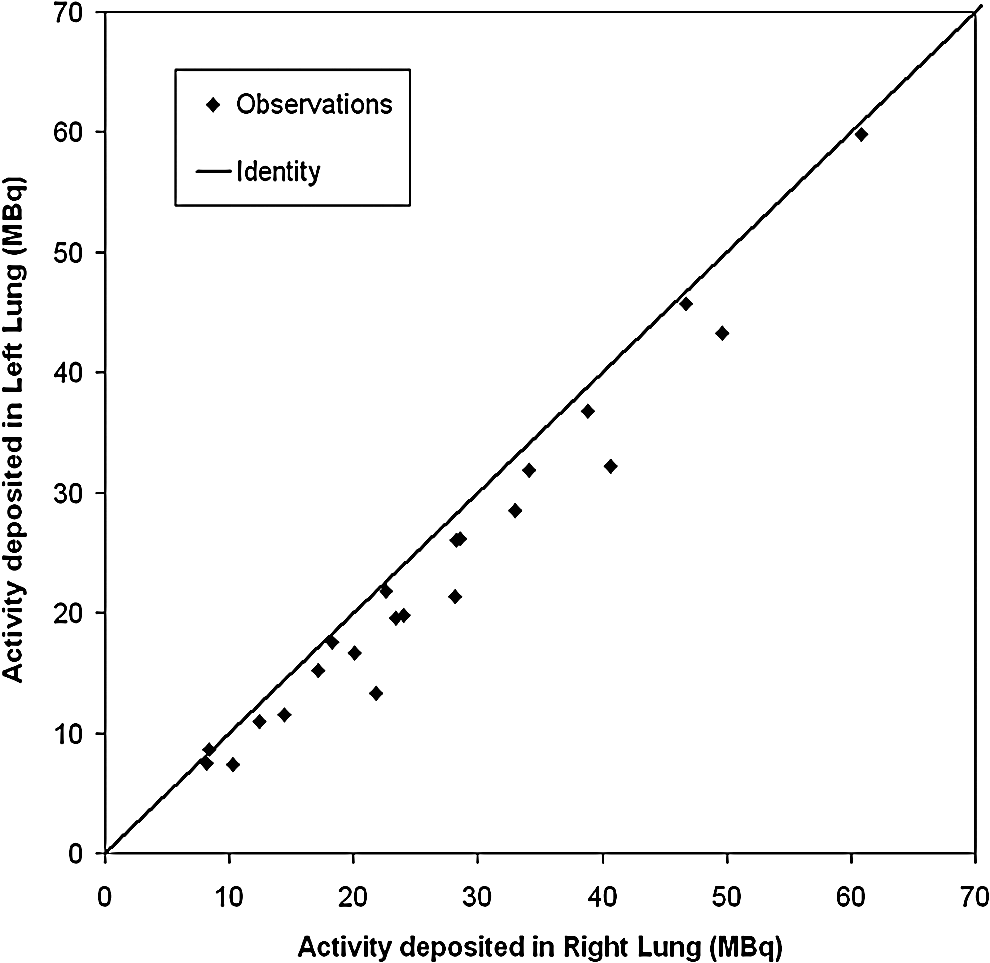
Comparison of deposition in the right and left lungs from 3D-SPECT. The line is the identity line.
the left lung deposition is significantly higher (p=0.0085) with a mean ratio of 1.08±0.12 SD (n=22) (see Fig. 8).
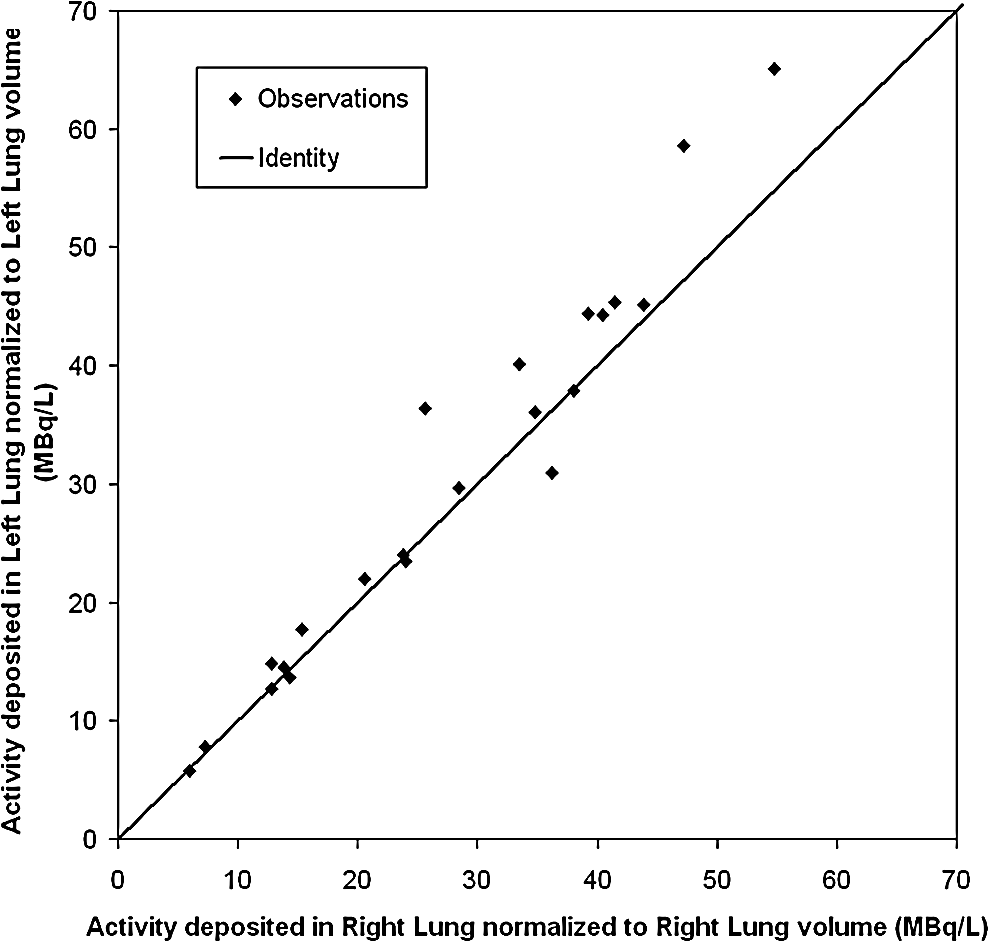
Deposition of activity in the right and left lungs from 3D-SPECT normalized to lung volume. The line is the identity line.
A comparison of the nC/P3D ratio for the left and right lungs showed that it was significantly higher for the left lung (p<0.0001) at a mean ratio (left/right) of 1.36±0.20 SD (n=22) (see Fig. 9). These results were confirmed by the calculation of the BADF, which was also significantly higher for the left lung (p=0.0004) than for the right lung (Fig. 10). The mean ratio of BADF, defined by deposition in generations 2–8, (left/right) was 1.68±0.74 SD (n=22).

Spatial deposition: 3D normalized central-to-peripheral ratio (nC/P3D) in the right and left lungs. The line is the identity line.
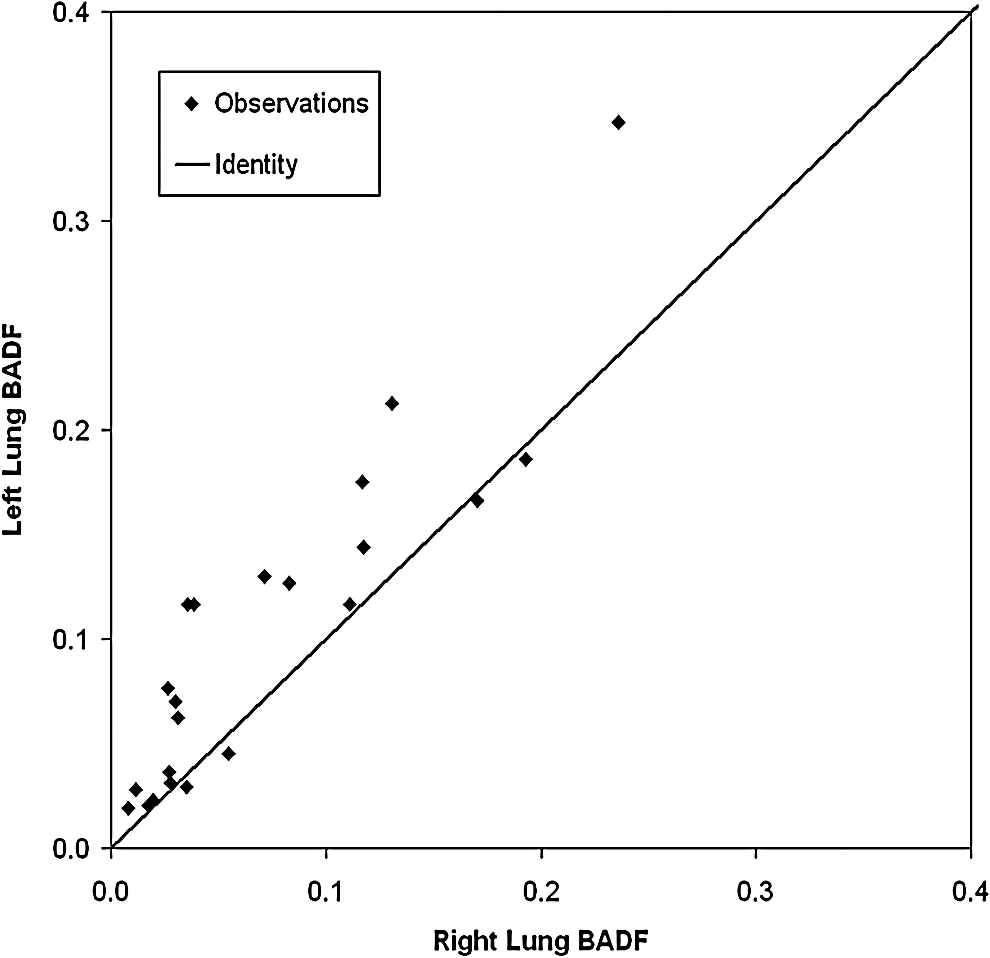
Airway deposition: bronchial airways deposition fraction (BADF; generations 2–8) in the right and left lungs. The line is the identity line.
A comparison of 24-hr clearance for the right and left lungs is shown in Figure 11; the difference was significant (p=0.0008). The mean left to right ratio was 1.04, which was considerably less than for nC/P3D and BADF. However, it provides an independent confirmation of the difference in regional distribution found from the image of initial deposition.
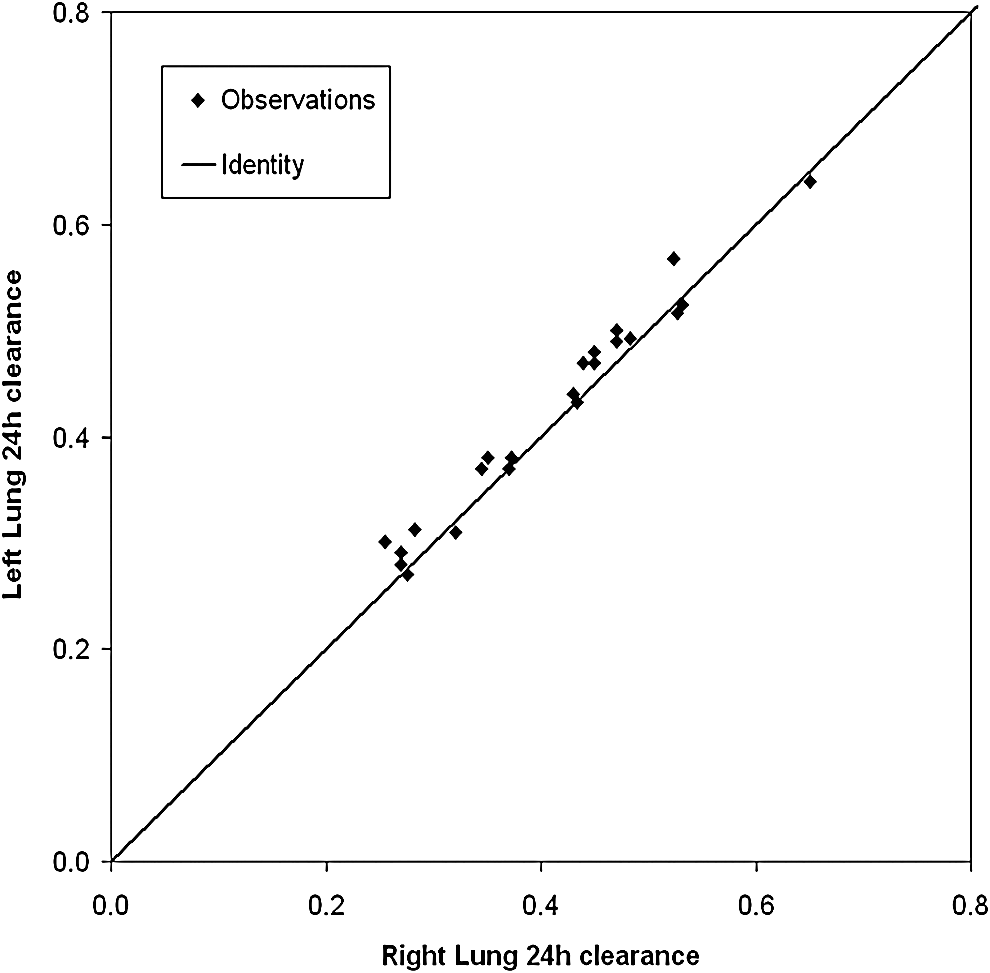
Twenty-four–hour clearance in the right and left lungs. The line is the identity line.
Influence of the controlled parameters (particle size, depth of breathing, carrier gas) on aerosol deposition
Influence of particle size and depth of breathing
Figure 12 reproduces the graph in Figure 6 of the 24-hr clearance versus CADF calculated with the Weibel model, wdf, but with colors and shapes of the symbols to differentiate the individual inhalation experiments. There is a clear distinction that large particles (in red) are more centrally deposited than small particles (in blue), but no clear distinction between the deep (squares) and shallow (triangles) breathing patterns.
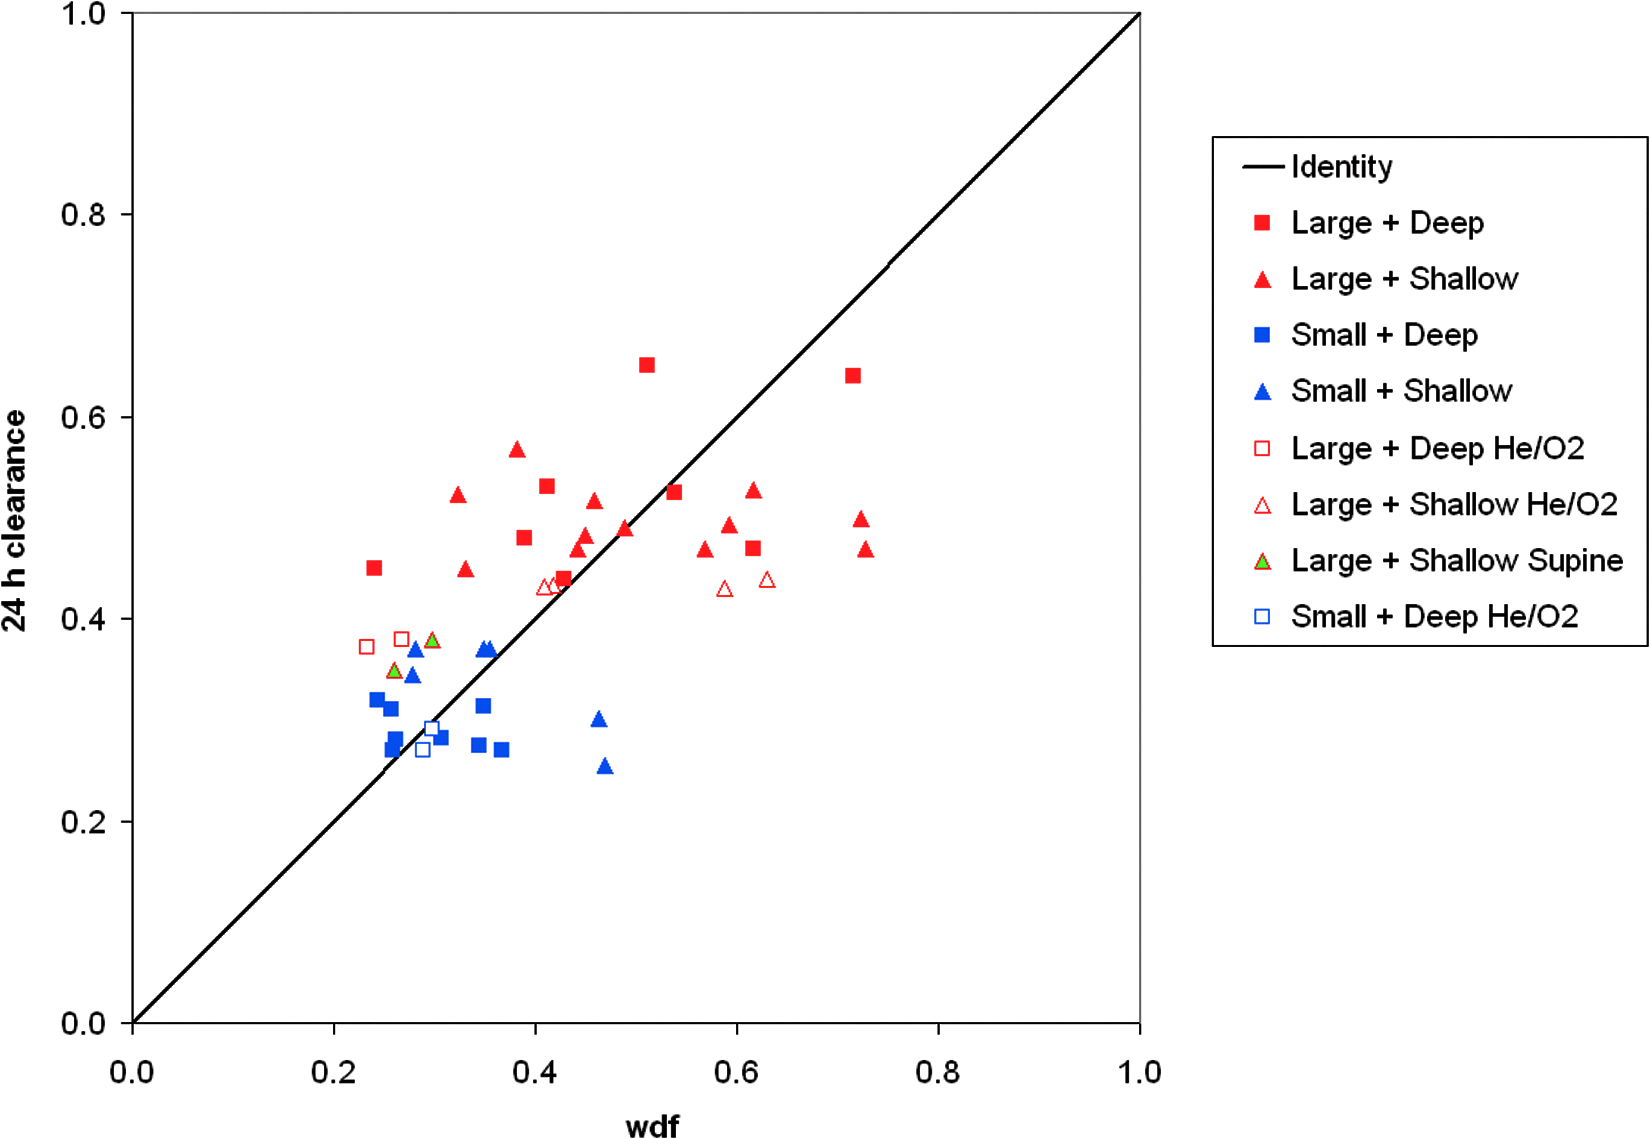
The variation of 24-hr clearance with the conducting airways deposition fraction (CADF) assuming the definition of the conducting airways in the Weibel model, wdf. The parameters have been differentiated with symbols and color codes. The line is the identity line.
These trends are confirmed by statistical analysis. nC/P3D, ET deposition (from planar images), 24-hr clearance (from planar images), and total airway deposition in the trachea and right and left lungs (from planar images) were compared for the four following combinations: (i) large particles and shallow inhalation, (ii) large particles and deep inhalation, (iii) small particles and shallow inhalation, and (iv) small particles and deep inhalation. The nC/P3D ratio, ET deposition, and 24-hr clearance were almost all higher for large particles whatever the breathing regime, whereas total airway deposition was higher for small particles. Two-factor analysis of variance showed that the effect of particle size was statistically significant on the nC/P3D ratio (p=0.0014), ET deposition (p=0.0037), 24-hr clearance (p<0.0001), and total airway deposition (p=0.0366), whereas the effect of inhalation parameters was not statistically significant on the nC/P3D ratio (p=0.3949), ET deposition (p=0.9558), 24-hr clearance (p=0.7097), or total airway deposition (p=0.3481).
Figure 13 shows total airway deposition, ET deposition, 24-hr clearance (conducting airways deposition), and 1–24-hr clearance (pulmonary deposition) for large and small particles, and deep and shallow inhalation, illustrating that the differences in deposition between large and small particles were more significant than those occurring due to changes from deep to shallow inhalation regimes.

Total airway deposition

Influence of the carrier gas: aerosol deposition breathing helium–oxygen vs. air
In Figure 12, the red clear symbols representing experiments with large particles and helium–oxygen are all below the solid red ones (representing experiments with large particles and air), meaning that breathing helium–oxygen has reduced deposition in the conducting airways determined from the planar 24-hr clearance measurement. The effect of carrier gas can be further studied using the generational representation of deposition based on the 3D spatial images and the conceptual morphological model(1) as shown in Figure 14. The results are expressed as a percentage of deposited aerosol in the right and left lungs separately, from generations 2 (lobar bronchi) to 23 (alveoli) for participants H05A (air) versus H05B (helium), and H06A (air) versus H06B (helium). It is noted that right versus left differences are less for helium–oxygen than for air, although the number of participants is insufficient to know if this is a consistent effect. However, this observation suggests that the heterogeneity of aerosol deposition with helium–oxygen as the carrier gas may be less than the case for air.

Generational deposition for healthy participants whose varying parameter was carrier gas.

The nC/P3D ratios were also calculated for both right and left lungs. nC/P3D was 1.95 and 2.94 for the right and left lungs, respectively, for H05A (air), versus 1.38 and 1.69 for H05B (helium–oxygen). For H06A (air), nC/P3D was 1.48 and 2.40 for right and left lungs, respectively, versus 1.23 and 1.47 for H06B (helium–oxygen). The nC/P3D ratios were lower for the experiments with helium–oxygen than for those with air, for the two participants and for both right and left lungs. These results suggest that deposition is less central and more peripheral when breathing helium–oxygen.
Comparison of deposition when breathing air versus helium–oxygen for all the participants inhaling large particles is given in Table 2, in the following regional terms: ET deposition, nC/P3D ratios (mean of right + left lungs), 24-hr clearance (mean of right + left lungs), total thoracic (i.e., trachea + lungs) deposition, and BADF. For the “air + large particles” combination, the number of tests was 10 (n=10), and for “helium–oxygen + large particles” combination, the number was 3 (n=3). These data support the premise that breathing helium–oxygen can increase peripheral deposition compared with central deposition.
BADF, bronchial airways deposition fraction; CI, confidence interval; ET, extrathoracic; nC/P3D, 3D central-to-peripheral ratio normalized to lung volume.
Discussion
The objective of this article was to present the results of an analysis of the in vivo deposition data obtained in a clinical study, designed to provide data for model validation, but that also allows for the study of the influence of several inhalation parameters on aerosol deposition. The focus has been on comparisons of results from the 2D and 3D imaging approaches, thus maintaining continuity with the previous imaging literature, but also providing a bridge to future analysis that will focus on the inherent 3D character of the data and direct correlation with anatomy obtained from the CT images.
The analysis described in this article does not conform exactly to the new standard guidelines for using planar imaging(12) and SPECT(7 for measuring aerosol deposition. This was done to keep consistency with the companion article describing the acquisition of the image database on these healthy participants. The deviations from the guidelines are in the planar analysis: (i) the use of a 10% contour to determine the lung ROI rather than the 15% recommended, and (ii) the calculation of C/P ratios rather than O/I ratios. It is felt that the difference in the planar ROI analysis technique is unlikely to make any significant difference to the results. The effect of calculating O/I ratios instead of C/P ratios has been investigated to some extent in this article (Fig. 3) and has been shown as expected to make only a very minor difference to the analysis.
The analysis began with SPECT/CT accuracy. The comparison between total aerosol deposition in the lungs determined from planar (2D) and SPECT (3D) imaging showed that planar imaging gave slightly higher deposited activity compared with the SPECT, but that taking the clearance into account enabled these differences to be reduced.
The dose accountability for planar imaging showed good correlation between the total activity leaving the nebulizer assessed from (i) the difference in activity put into the nebulizer and that left after inhalation and (ii) the sum of the activity accounted for in the body and exhalation filter. The difference between the mean activities was 2.7%, well within the 10% limit set by the International Society of Aerosols in Medicine guidelines.(12)
The study enabled measures of the regional distribution of aerosol deposition from the initial imaging measurement to be compared with the 24-hr clearance measurements, which are thought to be a good measure of conducting airways deposition in healthy volunteers. The division of the lung into inner and outer spatial zones for analysis of the initial deposition pattern is known to only loosely approximate to conducting (central) and alveolated (peripheral) airways. This is particularly true for 2D imaging, but even in 3D there is a significant contribution of alveolated airways in the inner central region, and the conducting airways also penetrate out almost to the edge of the lung. The observation that the fraction in the inner central region is lower than the clearance observed in the 24-hr measurements suggests that the influence of conducting airways in the outer peripheral region outweighs the impact of peripheral airways in the inner central region (Fig. 4A). This seems consistent with the suggestion by Weibel(9) that the conducting airways are found as deep into the airway tree as generation 19. It would be interesting to investigate the regional variation of 24-hr clearance, as this might give information on the relative content of conducting (clearing) and alveolated airways within the different regions. This will be the subject of further work.
The linear regression of 24-hr clearance C/P ratio and 3D spatial C/P ratio passed close to the origin, indicating that although the absolute spatial values were not correct, there was a proportionality between the two parameters. This suggested that the 3D spatial ratio was a faithful representation of the airway ratio. The systematic difference might be rectified by choosing a different definition of the outer and inner spatial regions, and this will be the subject of further work. By contrast, the linear regression of the 2D spatial C/P ratio was not proportional to the 24-hr clearance ratio, indicating that it was only an empirical index of the airway deposition pattern. The superiority of the 3D measures was also demonstrated in the better correlation of the normalized 3D ratio with 24-hr clearance compared with the 2D ratio, although this just failed to achieve statistical significance.
The importance of deposition in the smaller conducting airways is confirmed in the analysis of deposition by generation. The results obtained assuming the standard ICRP definition of the conducting airways in the lung represented by generations 2–15(13) and those obtained by assuming the Weibel definition of the conducting airways, wdf, suggested that aerosol was being cleared from airways deeper than generation 15.(9) The majority of these airways are located in shells 9 and 10 close to the other edge of the lung. This analysis uses a conceptual model that positions airways of different generations to the corresponding location in the spatial shell description of the lung. This has been designed based on information in the literature from Weibel and other studies on airway dimensions.(1) The shell locations of the central generations (2–5) have been validated with CT scanning, but there is no direct validation of the locations of the smaller airways, as these cannot be visualized in vivo. Therefore, errors in the conceptual model do offer an alternative explanation for the discrepancy between estimated percentage in generations 2–16 and the 24-hr clearance.
The acquisition of 3D data from SPECT enabled detailed study on deposition in the left lung without significant impact of activity in the stomach.(14) Comparison of right versus left lung aerosol deposition showed that the total activity deposited was significantly lower in the left lung than in the right lung. This was expected due to the lower air volume in the left lung. However, the left/right ratio of deposition was in fact a little higher than the ratio of air volumes, which was 0.83.(5) When normalized to lung air volume, the left lung deposition was significantly higher than the right, demonstrating that left lung deposition was greater than would be expected relative to the right on the basis of lung air volume alone.
It was also noted that central deposition was significantly higher for the left lung from both analysis of the initial deposition pattern and the 24-hr clearance. The difference between the right and left lungs in terms of 24-hr clearance was considerably smaller than the difference for nC/P3D or BADF (generations 2–8). BADF, and to a lesser extent nC/P3D, depend on deposition in the bronchial airways up to generation 8. This suggests that most of the difference in the left and right lung deposition occurs in the first few generations rather than the smaller conducting airways. The 24-hr measurement will be dominated by the deposition in the smaller conducting airways, which have a much larger relative volume. The increased nC/P3D on the left lung was found in all studies, suggesting that this is a general trend in control subjects across a range of different inhalation regimes. This finding is also consistent with previous results. Studies aiming to target aerosol delivery using bolus techniques have shown that shallow boluses targeted toward the central conducting airways are preferentially deposited in the left lung, whereas those targeted toward the lung periphery are more evenly distributed between the left and right lungs.(11)
The study on the influence of particle size and depth of breathing showed, as expected, a significant effect on deposition pattern due to particle size. The smaller particles had a slightly increased whole-lung deposition, 87% compared with 77%. These values were considerably higher than those predicted from conventional empirical models of aerosol deposition in the lung. These generally predict that, for particles of this size, more of the aerosol will be exhaled.(13,15) This may be related to hygroscopic growth within the lung, causing particles that would have been exhaled to be deposited in the lung due to their increased size. Future work will involve the application of computer models of deposition to these data in order to provide an explanation for this observation.
The larger particles had greater deposition in the ET region and in the central pulmonary airways. This was demonstrated both in the initial deposition pattern (nC/P3D) and in the 24-hr clearance results and is consistent with expected results from modeling(13) and from previous experimental studies.(14) The influence of inhalation parameters was less clear. Deep inhalation resulted in higher total deposition in the lung with less in the ET region and central pulmonary airways. However, this effect was smaller and more variable and not statistically significant.
In this study, uncontrolled but measured parameters were the breath-hold and exhalation times, because the volunteer had to move from the nebulizer mouth piece to an exhalation filter. We found no correlation between either total or regional deposition and these temporal data, probably due to the relatively short breath holds. The mean breath-hold time for studies with a shallow inhalation was 2.0 sec, and that for the deep inhalation was 1.7 sec. This difference was small and not statistically significant; it would be unlikely to produce any large systematic effect on the results.
The influence of using helium–oxygen as the carrier gas compared with air has been studied for the larger particles. Breathing helium–oxygen increased total lung deposition and reduced deposition in the ET region and the conducting airways fraction of pulmonary deposition.(16,17) However, the number of studies performed was considered too small to perform statistical analysis. Investigation of the estimated deposition per generation suggested that helium–oxygen may also decrease the heterogeneity of aerosol deposition between the left and right lungs. These results suggest that altering the carrier gas may help in targeting aerosol to specific parts of the airway tree. The reason for this effect is currently being studied using computer modeling of deposition. There may be effects due to the different density and viscosity of helium–oxygen.
The 24-hr clearance measurement was particularly good at distinguishing the effect of particle size, providing complete separation between the two groups of measurements using the large and small particle sizes. By contrast, the CADF using the Weibel definition of airways, wdf, was less effective at separating the groups. Although there was significant correlation between wdf and 24-hr clearance, there was considerable overlap in wdf values between the groups. This points to a limitation in precision in the shell to generation conversion. This can be explained by the significant proportion of conducting airway deposition found in the small airways of generations 15–19 mentioned above. The conceptual model used to analyze the images treats the acinus as a unit consisting of airways from generations 15–23. It therefore cannot easily separate deposition on these peripheral conducting airways and the alveoli, giving a limit on its ability to assess total conducting airways deposition.
The study has also contributed to the debate over the superiority of 3D imaging compared with 2D. For assessment of total lung deposition, the conclusion remains that although 3D activity measurements are theoretically more precise, this does not have a large impact on improving the precision of measurement in practice. The delineation of the lung regions is clearly improved in 3D, particularly when CT is used. Overlap of counts from activity in the trachea and stomach into the lung region is significantly reduced, and this allows more precise assessment of deposition in the trachea and of the regional lung deposition in the left lung. This has enabled this study to make a detailed comparison of regional deposition parameters in the left lung with those in the right. The results also suggest that 3D parameters of spatial deposition distribution provide better estimates of airways distribution from 24-hr clearance measurements than do the equivalent 2D measures. Further work on this is required to confirm this finding. Finally, 3D imaging enables the possibility of relating spatial regional deposition to deposition by anatomical location. Some initial results on this have been presented by estimating deposition by airway generation, but this is clearly a field for further research, working alongside the development of improved computer models of airway morphology and the deposition process. Thus, although there are obviously inherent advantages of 3D over 2D imaging, more work is required to demonstrate its clear practical benefits that could also be extended to improvements in clinical efficacy.
In conclusion, this study has demonstrated the value of 3D radionuclide imaging in assessing the regional distribution of aerosol deposition within the lung. The expected influence of particle size has been demonstrated, and new data on the regional distribution pattern have been presented using comparison of initial deposition with 24-hr clearance measurements. New information on the difference in deposition in left and right lungs has also been provided.
Footnotes
Acknowledgments
The authors thank Benoît Piednoit for his help on the statistical analysis. John Fleming and Joy Conway acknowledge the support of the Southampton Respiratory Biomedical Research Unit funded by the UK National Institute for Health Research.
Author Disclosure Statement
The authors declare that there are no conflicts of interest.