
Abstract
Abstract
Background:
Vibrating mesh devices are portable nebulizer systems with reported high efficiency. Losses occur during expiration, and particle size distributions vary. We describe an aerosol chamber designed to capture and condition aerosols from a typical vibrating mesh nebulizer, the Omron U22. The goal was to improve inhaled mass (IM) and respirable fraction (RF) and shorten treatment time.
Methods:
With test solutions of radiolabeled saline, we characterized the Omron U22 (three examples) vibrating mesh nebulizer measuring aerosol output with different breathing patterns, with and without manual breath synchronization. Particle size distributions were measured by cascade impaction as a “standing cloud” and during ventilation with a piston respirator. IM (percentage of nebulizer charge), respirable mass (RM), particle size distribution, and breathing time were measured with and without use of the chamber. Breathing patterns were designed to simulate tidal breathing with a “COPD” (chronic obstructive pulmonary disease) pattern (450 mL, rate 15, duty cycle 0.35) and “slow and deep” breathing for maximal lung deposition (1,500 mL, rate 5, duty cycle 0.70). Patterns of deposition were confirmed in a human volunteer using a gamma camera.
Results:
IM was significantly affected by breathing pattern and averaged 30.0±2.91% and 53.9±7.99% for COPD and slow and deep patterns, respectively. With the chamber, IM was less sensitive to breathing pattern (57.4±6.97%, 57.9±4.69%, respectively). Particle size distributions varied widely between devices and were markedly affected by both ventilating the device and addition of the chamber. With the chamber, RF and RM increased, and differences in particle size distributions between individual devices were minimized. Compared with breath synchronization, treatment time was reduced. Gamma camera images revealed reduced upper airway deposition consistent with predictions from in vitro cascade distributions.
Conclusions:
Our prototype chamber allowed for capture and conditioning of nebulized aerosol by mixing with room air and removal of large particles by impaction, providing better control of IM, RF, RM, and lung deposition, without the need for breath synchronization.
Introduction
J
Skaria and Smaldone, using radiolabeled droplets, tested a typical vibrating mesh nebulizer (Omron U22; Omron Healthcare Inc., Bannockburn, IL) and found that, in comparison with jet nebulizers, it had 40% less “residual activity,”(5) consistent with the concept of higher efficiency. However, when those authors measured drug delivery during simulated breathing [“inhaled mass” (IM)], it was not increased over commonly used jet nebulizers. Their data therefore suggested that aerosol was generated and lost from the device during simulated breathing. This principle was confirmed in a separate series of experiments when Diaz et al., in vivo, found that the use of breath actuation and controlled slow and deep breathing increased lung deposition of a vibrating mesh nebulizer to 65% of initial nebulizer charge.(6) The device used in the Diaz study, the I-neb (Philips Respironics, Parsippany, NJ), is similar to the U22, but with the added features of breath actuation and adaptive aerosol delivery, software controllers of breathing, which redirect the “lost” aerosol from the U22 to the patient, maximizing deposition. Therefore, to take full advantage of their efficiency, vibrating mesh nebulizers require sophisticated software control to regulate IM. An associated drawback to the use of breath actuation is an increase in treatment time.
In addition, compared with jet nebulizers, interdevice particle size distributions from mesh devices can vary widely between examples. Skaria and Smaldone reported variation in particle size distribution for the U22 from device to device, often with significant percentages of particles that were relatively large and potentially “nonrespirable.”(5) Based on the work of Sangwan and colleagues(7) and Solomita and Smaldone,(8,9) Skaria's results predicted considerable upper airway deposition in vivo. Nikander and colleagues and Diaz et al., in separate studies using I-neb, noted that regional upper airway deposition varied widely between subjects, often reaching 35–40%.(6,10) Combined with the work of Skaria and Smaldone, the scintigraphic studies indicate that mesh devices therefore may be associated with unpredictable upper airway deposition with potential upper airway side effects due to a population of large particles.
Vibrating systems, therefore, can be improved if (1) simple, non-software methods are available to prevent expiratory losses of aerosol, (2) the treatment time can be reduced, (3) inhaled particle size distributions are less variable between devices, and (4) the distributions contain fewer large particles. This article describes a method for attaining these goals. We demonstrate the value of a chamber and valve system designed to capture generated particles, retain them during expiration, and present them on demand to a patient. The chamber also conditions the particles and provides an aerosol in the range defined by our laboratory as truly respirable (approximately ≤2.5 μm).(7) Finally, our system does not require the use of breath actuation, resulting in a reduction in treatment time.
Materials and Methods
Principles
For wet aerosols, firm predictions of upper airway deposition from measurement of in vitro particle distributions are not standardized and, for nebulizers (both jet and mesh technology), product information is rarely accompanied by actual deposition imaging. Our approach has been to mimic actual patient use by measuring particle size distributions during simulated breathing. An important component of our technique is the use of low-flow cascade impaction (≤2 L/min) to minimize effects of the impactor on nebulizer function. The experience of our group has been reviewed in a series of publications and editorials summarized in Figure 1.(7–9,11) The graph represents the cumulative probability of impaction of the test aerosols on the impactor stages from different jet nebulizers. The horizontal axis depicts the mass distribution assuming that the aerosol particles have diameters distributed log normally with a mass median diameter and a standard deviation (shaded area), hence the term log-normal. If the particle size distribution followed this assumption, the data would show a straight line. As shown in Figure 1, this is often not the case, particularly for nebulizers. The scintigraphic images represent examples of deposition studies performed with the indicated nebulizers. Image analysis of regional deposition (upper airways versus lungs) has demonstrated that the intersection of the 2.5-μm line with a given particle size distribution partitions the distribution between the “upper airways” and the “lungs.” The stages above 2.5 μm “predict” the percentage of upper airway deposition for that device. The rest of the distribution predicts regional deposition in the lungs. In our hands, a measured particle size distribution that is near to the distribution of the AeroTech II (Biodex Medical Systems, Shirley, NY) jet nebulizer should have minimal upper airway deposition.
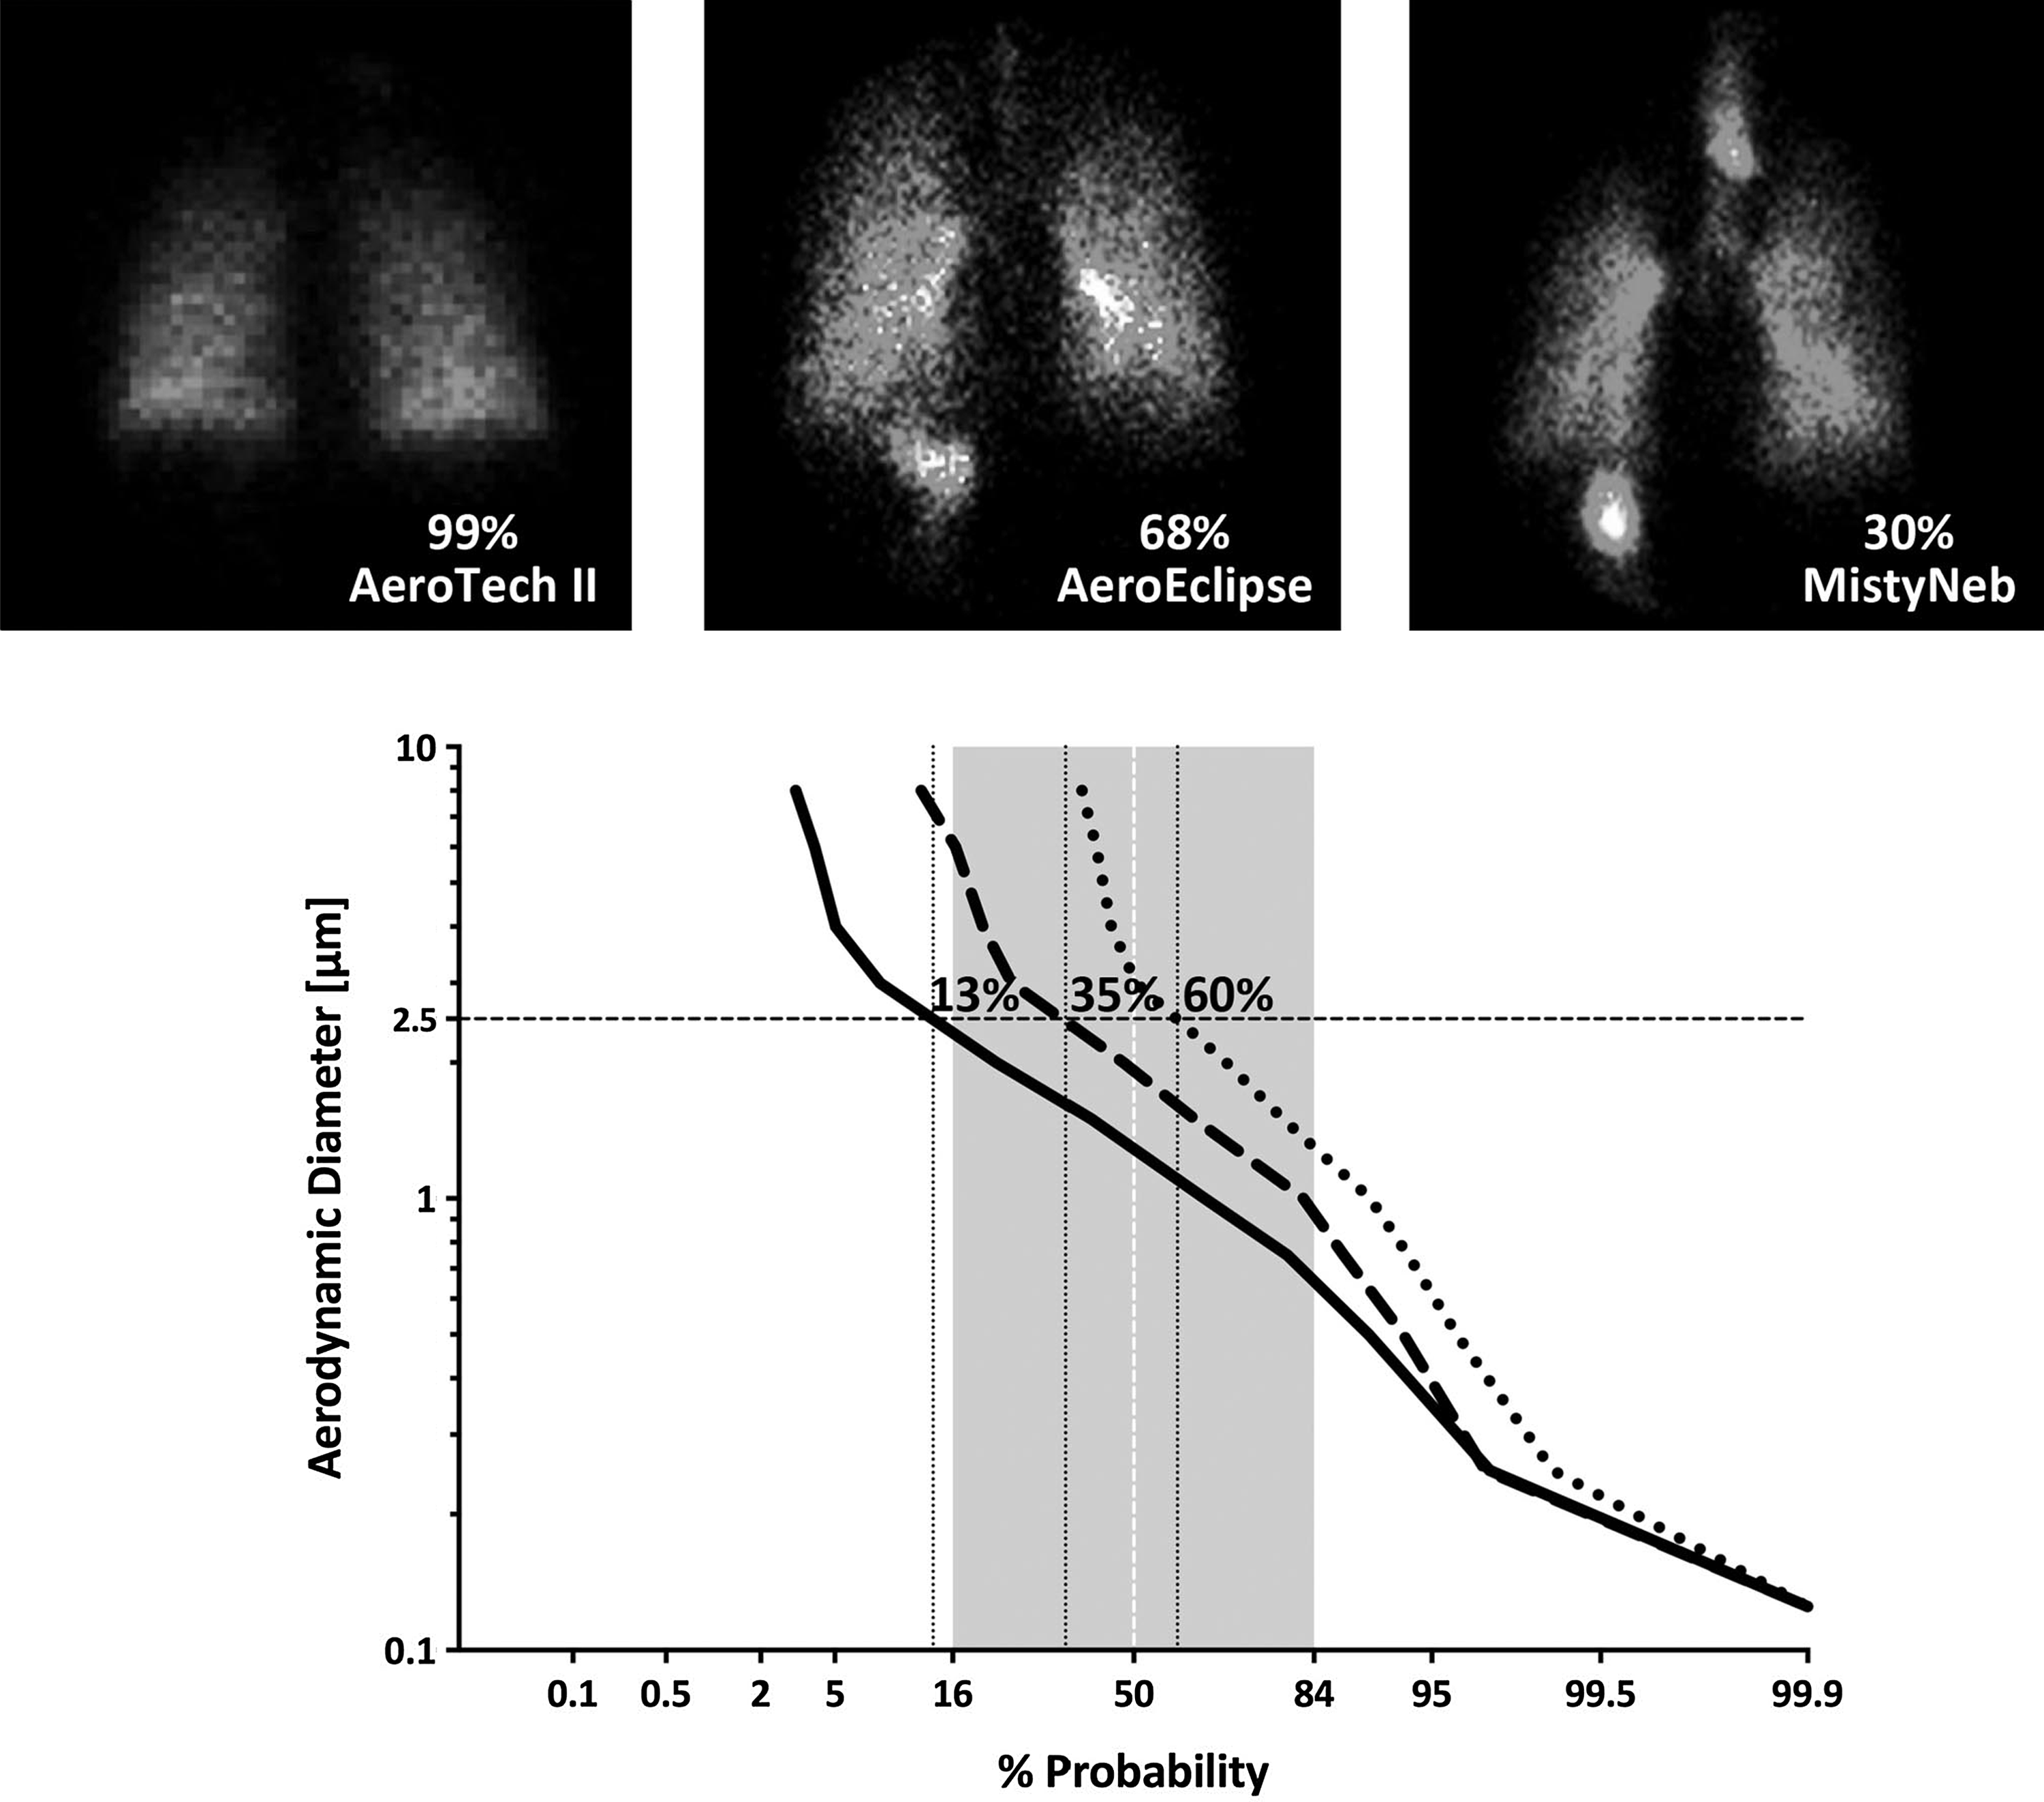
Empiric relationship between in vitro testing of aerosol distributions and in vivo regional lung and upper airway deposition. Average particle distributions from the literature for AeroTech II [mass median aerodynamic diameter (MMAD) 1.29 μm; Biodex Medical Systems, Shirley, NY],(8,11,16,17) AeroEclipse (MMAD 2.12 μm; Trudell Medical International, London, ON, Canada), and MistyNeb (MMAD 3.10 μm; Allegiance, McGraw Park, IL)(7) jet nebulizers are depicted in the graph by solid, dashed, and dotted lines, respectively. Images from typical deposition scans reported for these devices are indicated at the top. Particle size distributions were determined by techniques illustrated in Figure 2. The shaded region represents one standard deviation from the mean. The 2.5-μm line marks the approximate “cutoff” for upper airway deposition with the predicted probability for upper airway deposition indicated; regional lung deposition therefore would be equal to (100 minus predicted upper airway deposition). These values correspond with those seen in the deposition studies, with average values from references indicated on the scintigraphy images.
Bench setup
Figure 2 describes the experimental setup for measuring IM and particle size distribution for the Omron U22. The piston ventilator simulates a patient breathing. Particles captured on the filter (Pari, Starnberg, Germany), the cascade impactor (Marple, Thermo Fischer Scientific, Waltham, MA; constant flow 2 L/min supplied by vacuum pump), and the cascade T combined defined the IM. Figure 3 illustrates the circuit with a chamber interposed between the filter and cascade designed to funnel particles to the patient during inspiration and hold the particles generated by the nebulizer during expiration. The chamber consists of a modified valved holding chamber (VHC; InspiraChamber; InspiRx, Somerset, NJ; 170 mL), which is composed of antistatic plastic. As they pass through the chamber, the particles are exposed to unsaturated room air, which enters the chamber through the inspiratory port of the VHC and the plastic nebulizer connector. In Figure 2, exhaled gases pass directly back into the nebulizer mouthpiece. In Figure 3, exhaled gases exit the system through the expiratory valve in the VHC. Our laboratory has studied several configurations of this device with different chamber volumes and valve configurations, as well as different mesh nebulizers. In this article, we report on the in vitro behavior of the 170-mL chamber and the Omron.
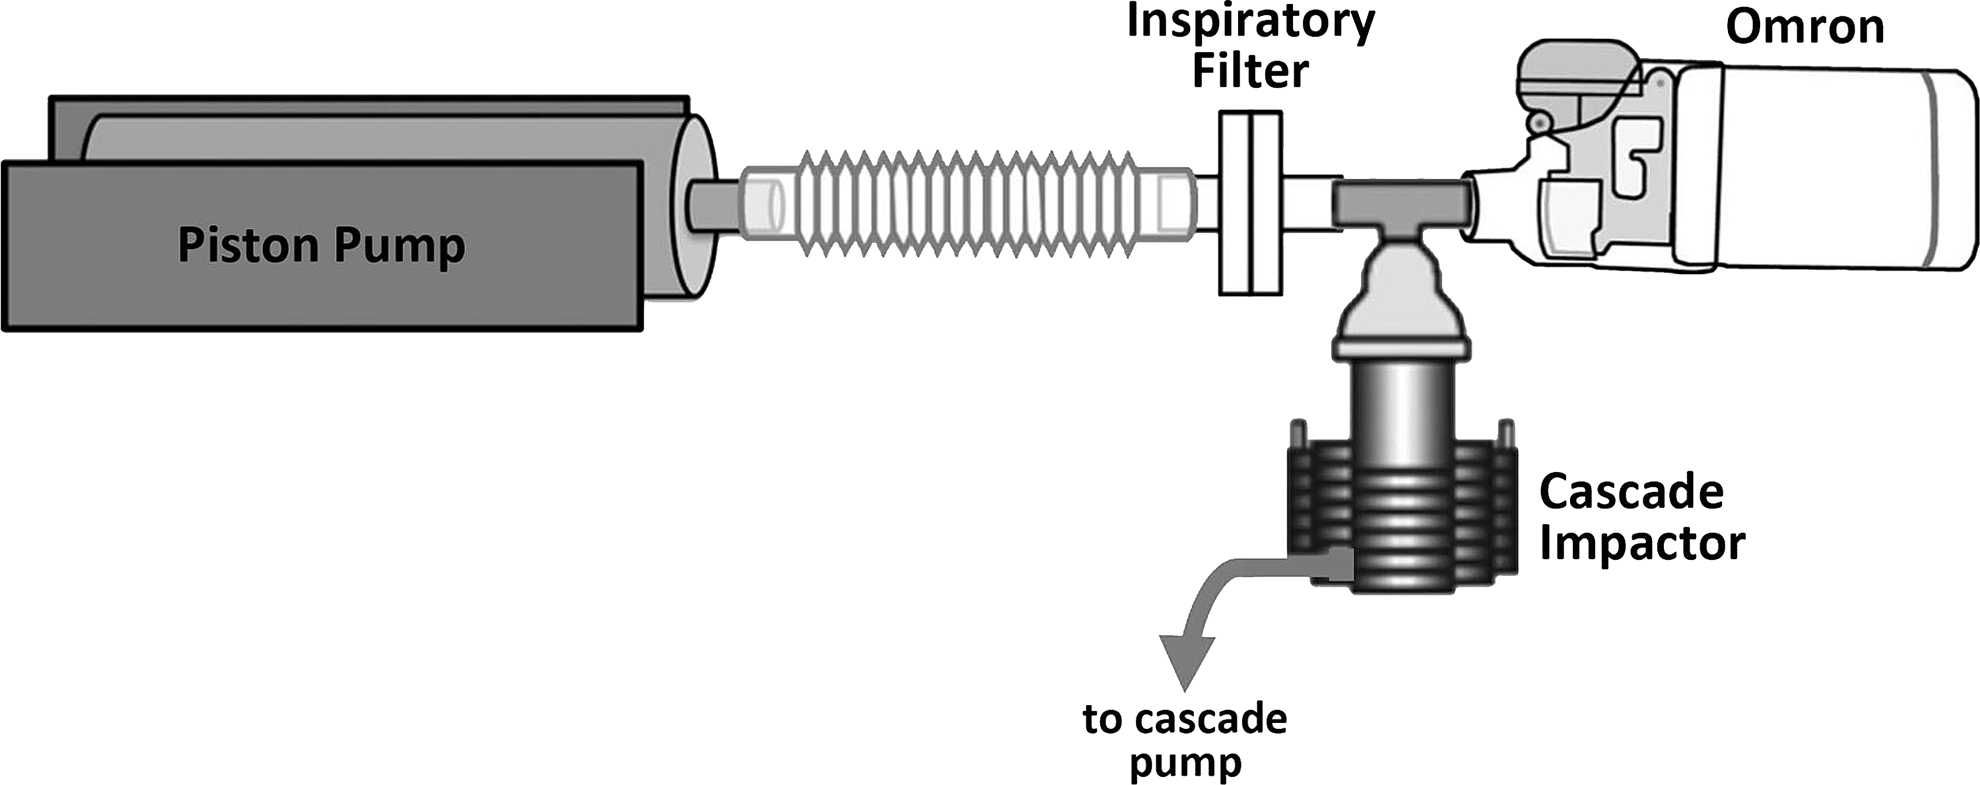
Bench setup for measurement of IM and particle size distributions using Omron nebulizer. The nebulizer was connected directly to the cascade impactor T piece in series with a filter. Total radioactivity in the cascade and filter defined IM. The piston pump settings were varied to deliver different breathing patterns. Standing cloud experiments were performed with the piston pump off and flow in circuit provided by cascade vacuum pump.
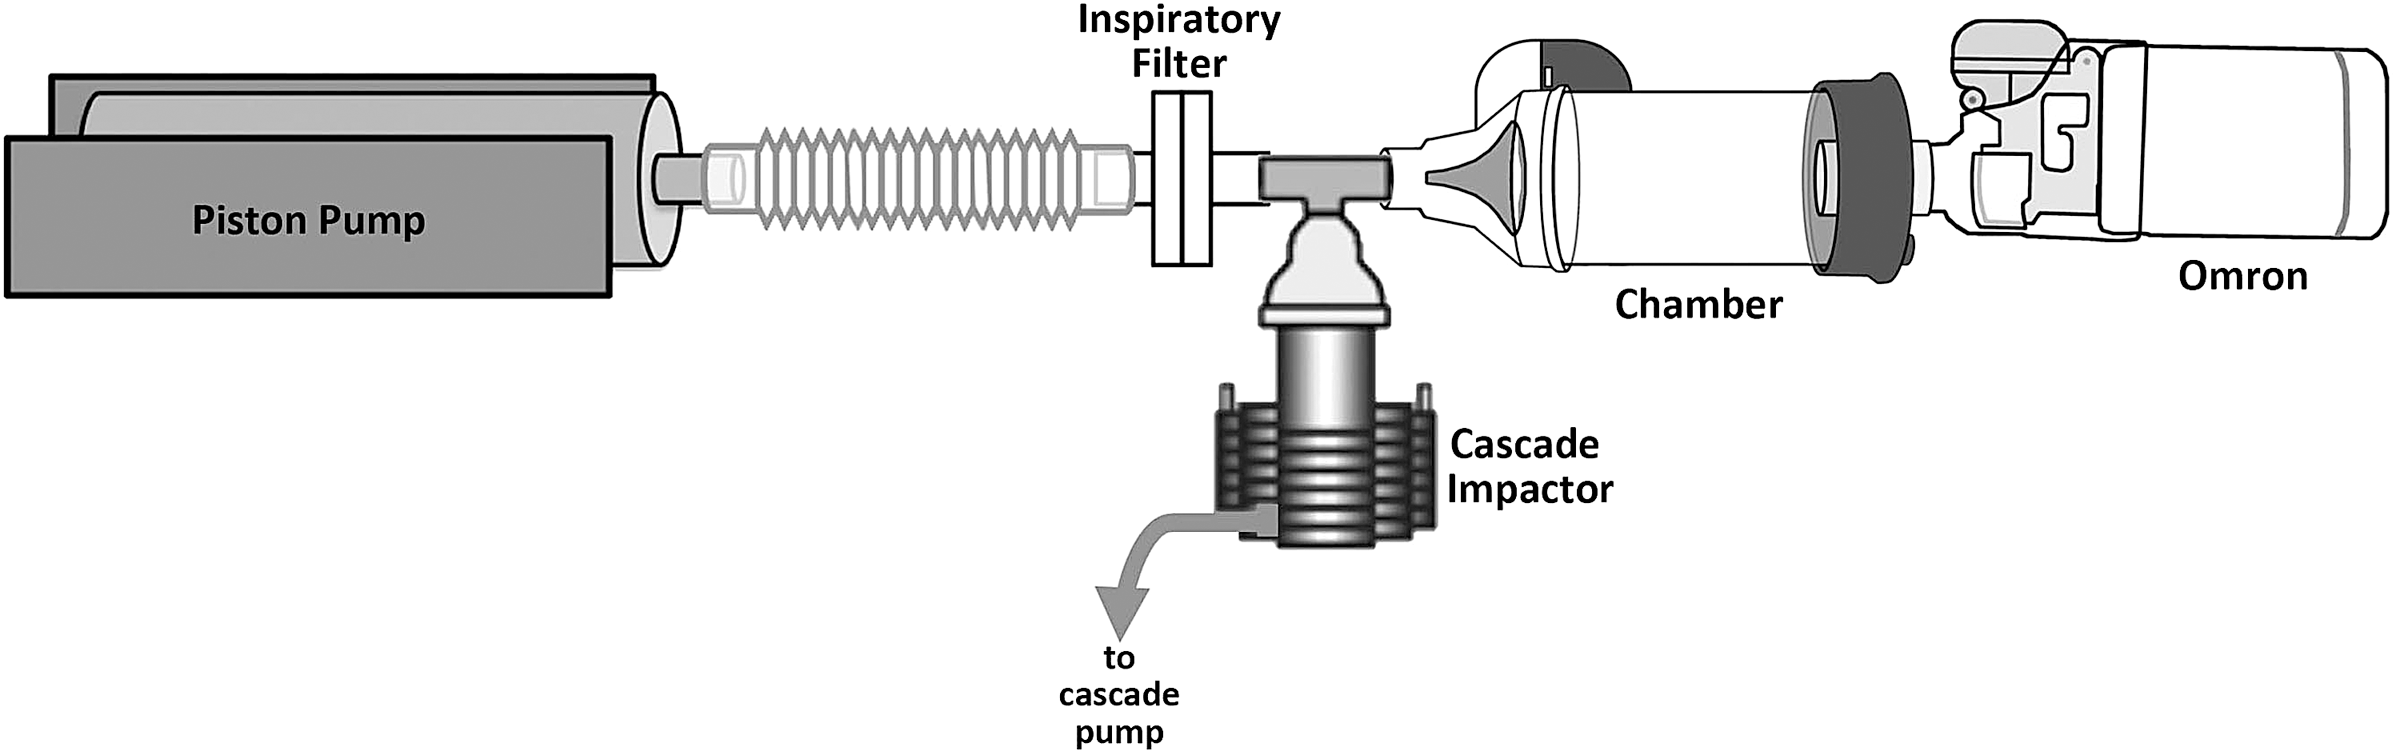
Addition of chamber prototype. The chamber was inserted between the Omron nebulizer and T piece. Inspiratory gases enter the chamber via the nebulizer connecter and the inspiratory valve on the chamber. Expiratory gases exit via the chamber exhalation valve.
Nebulizer charge
We tested three examples of the U22. For each in vitro experiment, the nebulizer was filled (nebulizer charge) with 0.5 mL of normal saline mixed with 400–900 μCi of 99m-technetium pertechnetate (99mTc). For human studies, our standard Institutional Review Board–approved protocol uses 150 μCi of 99mTc bound to sulfur colloid (99mTc–SC; Pharmalucence, Inc., Bedford, MA) to prevent leaching of radioactivity into the blood (described in detail by Diaz et al.(6)). Radioactivity defining the nebulizer charge was measured in a dose calibrator (Biodex Medical Systems). For each experiment, the nebulizer was run to dryness and the nebulizer reservoir measured for residual radioactivity (the nebulizer “residual”).
Breathing patterns
We used a Harvard Pump (Harvard Apparatus, Millis, MA) to simulate two breathing extremes: the first with prolonged expiration, “COPD” (chronic obstructive pulmonary disease) tidal volume of 450 mL, frequency of 15 breaths/min, and duty cycle of 0.35; and the second, “slow and deep,” a pattern designed to maximize lung deposition (tidal volume 1.5 L, frequency 5 breaths/min, and duty cycle of 0.70).
The U22 operates continuously. We measured the total output of the device by manually turning it on during the inspiratory phase of the Harvard pump and off at the onset of exhalation, thereby minimizing expiratory losses (manual breath synchronization).
Mass balance and inhaled mass
IM is the amount of nebulized aerosol captured in vitro that theoretically reaches the mouth of a patient. To measure IM, we quantified radioactivity following nebulization on the T piece, cascade impactor (including stages and housing), and IM filter using a calibrated ratemeter (Linak, Nordborg, Denmark). IM was reported as a percentage of the initial nebulizer charge. Radioactive deposition in the prototype chamber was also measured with the ratemeter. The sum of all components represents the total mass balance, which should approximate 100% of the nebulizer charge, barring aerosol losses to the environment.
Treatment time
We defined treatment time as that needed to completely nebulize 0.5 mL of radiolabeled saline. We measured treatment times for both breathing patterns during continuous nebulization and manual breath synchronization.
Particle size distribution and respirable mass
To measure particle size distributions, we used a 7-stage Marple Cascade Impactor, with a 2.0 L/min vacuum flow (Thermo Fischer Scientific). Radioactivity from each stage was measured via the calibrated ratemeter. Results were plotted as log particle size versus probability. We define respirable fraction (RF) as diameters less than 2.5 μm. Respirable mass (RM) is therefore the IM multiplied by the RF. The RM in effect is the percentage of the nebulizer charge, which we predict will avoid the upper airways and actually deposit in the lungs. Particle size distributions were also measured without simulated breathing, the so-called “standing cloud.” For the latter experiment, airflow in the system was generated by the cascade impactor vacuum pump (2 L/min).
Effects of humidity
Most of our experiments were carried out during months when relative humidity (RH) averaged 25%. To test the sensitivity of our experiments to changes in ambient humidity, we placed our experimental apparatus in a tent containing a humidifier and repeated measurements for the COPD pattern at different RH. We were able to raise the ambient RH to 50% and 90%.
Lung deposition study
The purpose of these experiments was to further test the predictive value of our in vitro measurements on the regional distribution of deposition between the lungs and upper airways (e.g., to define the data seen in Fig. 1 for mesh devices). Therefore, we used two experimental conditions that produced distributions at the extremes of our testing: relatively small and relatively large particles. Lung scintigraphy (Maxi Camera 400; General Electric, Horsholm, Denmark; Power Computing, Model 604/150/D, Austin, TX; NucLear Mac, Version 4.2.2, Scientific Imaging, Inc., Crested Butte, CO) was performed on a normal volunteer following inhalation of different aerosols (150 μCi of 99mTc-SC) of nebulized saline, generated by different Omron devices using the chamber. Immediately after inhalation, the subject swallowed a glass of water, and the counts in the stomach were used to estimate upper airway deposition (percentage of total regional deposition). Data were compared with that reported in Figure 1, with deposition related to that predicted by our history with the AeroTech II.(6,7)
Statistics
Data are reported as means±standard deviation (SD). Group data were statistically compared using the Mann-Whitney test. Calculations were performed using GraphPad Prism v. 6.0 for Mac OS X (GraphPad Software, San Diego, CA) and Microsoft Excel (Microsoft, Redmond, WA).
Results
Inhaled mass
Average data from all experiments are listed in Table 1. Figure 4 shows the mass balance, expressed as a percentage of the nebulizer charge. Mass balance measurements included IM, RM, the device residual activity, and, for chamber experiments, chamber deposition. System losses during expiration, e.g., unmeasured exhaled activity without chamber, could not be captured but were readily estimated by subtraction of all other components from the initial nebulizer charge. Figure 4A represents the COPD breathing pattern, and Figure 4B slow and deep breathing. For the COPD pattern (no chamber), IM of 30.0±2.91% was similar to that first reported by Skaria and Smaldone.(5) IM significantly increased with slow and deep breathing (IM=53.9±7.99%). Manual breath synchronization increased IM significantly for both patterns to 62.5±6.68% and 78.3±13.4%, respectively. The increase in IM for the slow and deep pattern reflects the increase in duty cycle. Addition of the chamber reduced the variation in IM with breathing pattern. IM increased from the COPD pattern of breathing to near that of simulated breath synchronization. RM improved for both patterns of breathing. With the chamber in place, we were able to account for nearly 100% of the initial nebulizer charge.
Inhaled mass (IM) presented as a percentage of the initial nebulizer charge.
The data indicate percentage of nebulizer charge.
BP, breathing pattern; IM, inhaled mass; RF, respirable fraction; RM, respirable mass (RF×IM); MMAD, mass median aerodynamic diameter.
p values for IM using Mann–Whitney test are as follows: a vs. b, p=0.0121; a vs. c, p<0.0001; d vs. e, p=0.0017; a vs. d, p<0.0001; d vs. f, p=ns.
Nebulizer residual activity ranged from 10% to 25% of the initial nebulizer charge with reduced residual when using the chamber, suggesting that, during expiration, without the chamber, more particles impacted in the nebulizer as expiratory gases were exhaled into the nebulizer. Chamber deposition was about 25% of the nebulizer charge.
Particle size distributions
Figures 5–7 depict the particle size distributions for standing cloud, ventilated nebulizer without chamber, and ventilated nebulizer with chamber experiments. The data are superimposed on the AeroTech II composite for comparison. Values of RF are listed in Table 1. The standing cloud distributions indicate particles that are largely nonrespirable with the average RF only 0.180±0.078. In addition, as we have found in previous studies, there is variation in distributions between individual devices. When ventilated (Fig. 6), each distribution shifts to the left with an increase in the RF now ranging between 0.676±0.158 and 0.538±0.227. This effect is enhanced with the ventilated chamber (Fig. 7) with RF of 0.822±0.0719 for the COPD pattern and 0.770±0.0753 for slow and deep breathing. More importantly, the mean RF is affected by Omron 3, which produced significantly larger particles than the other devices. As shown in Figure 7, for both patterns of breathing, the distributions of Omron 1 and 2 approximated that of the AeroTech II.

Standing cloud particle size distributions for Omron nebulizers. Reference graph shows ventilated AeroTech II jet nebulizer (dotted line). Symbols (circles, squares, and triangles) represent Omron 1, 2, and 3, respectively.
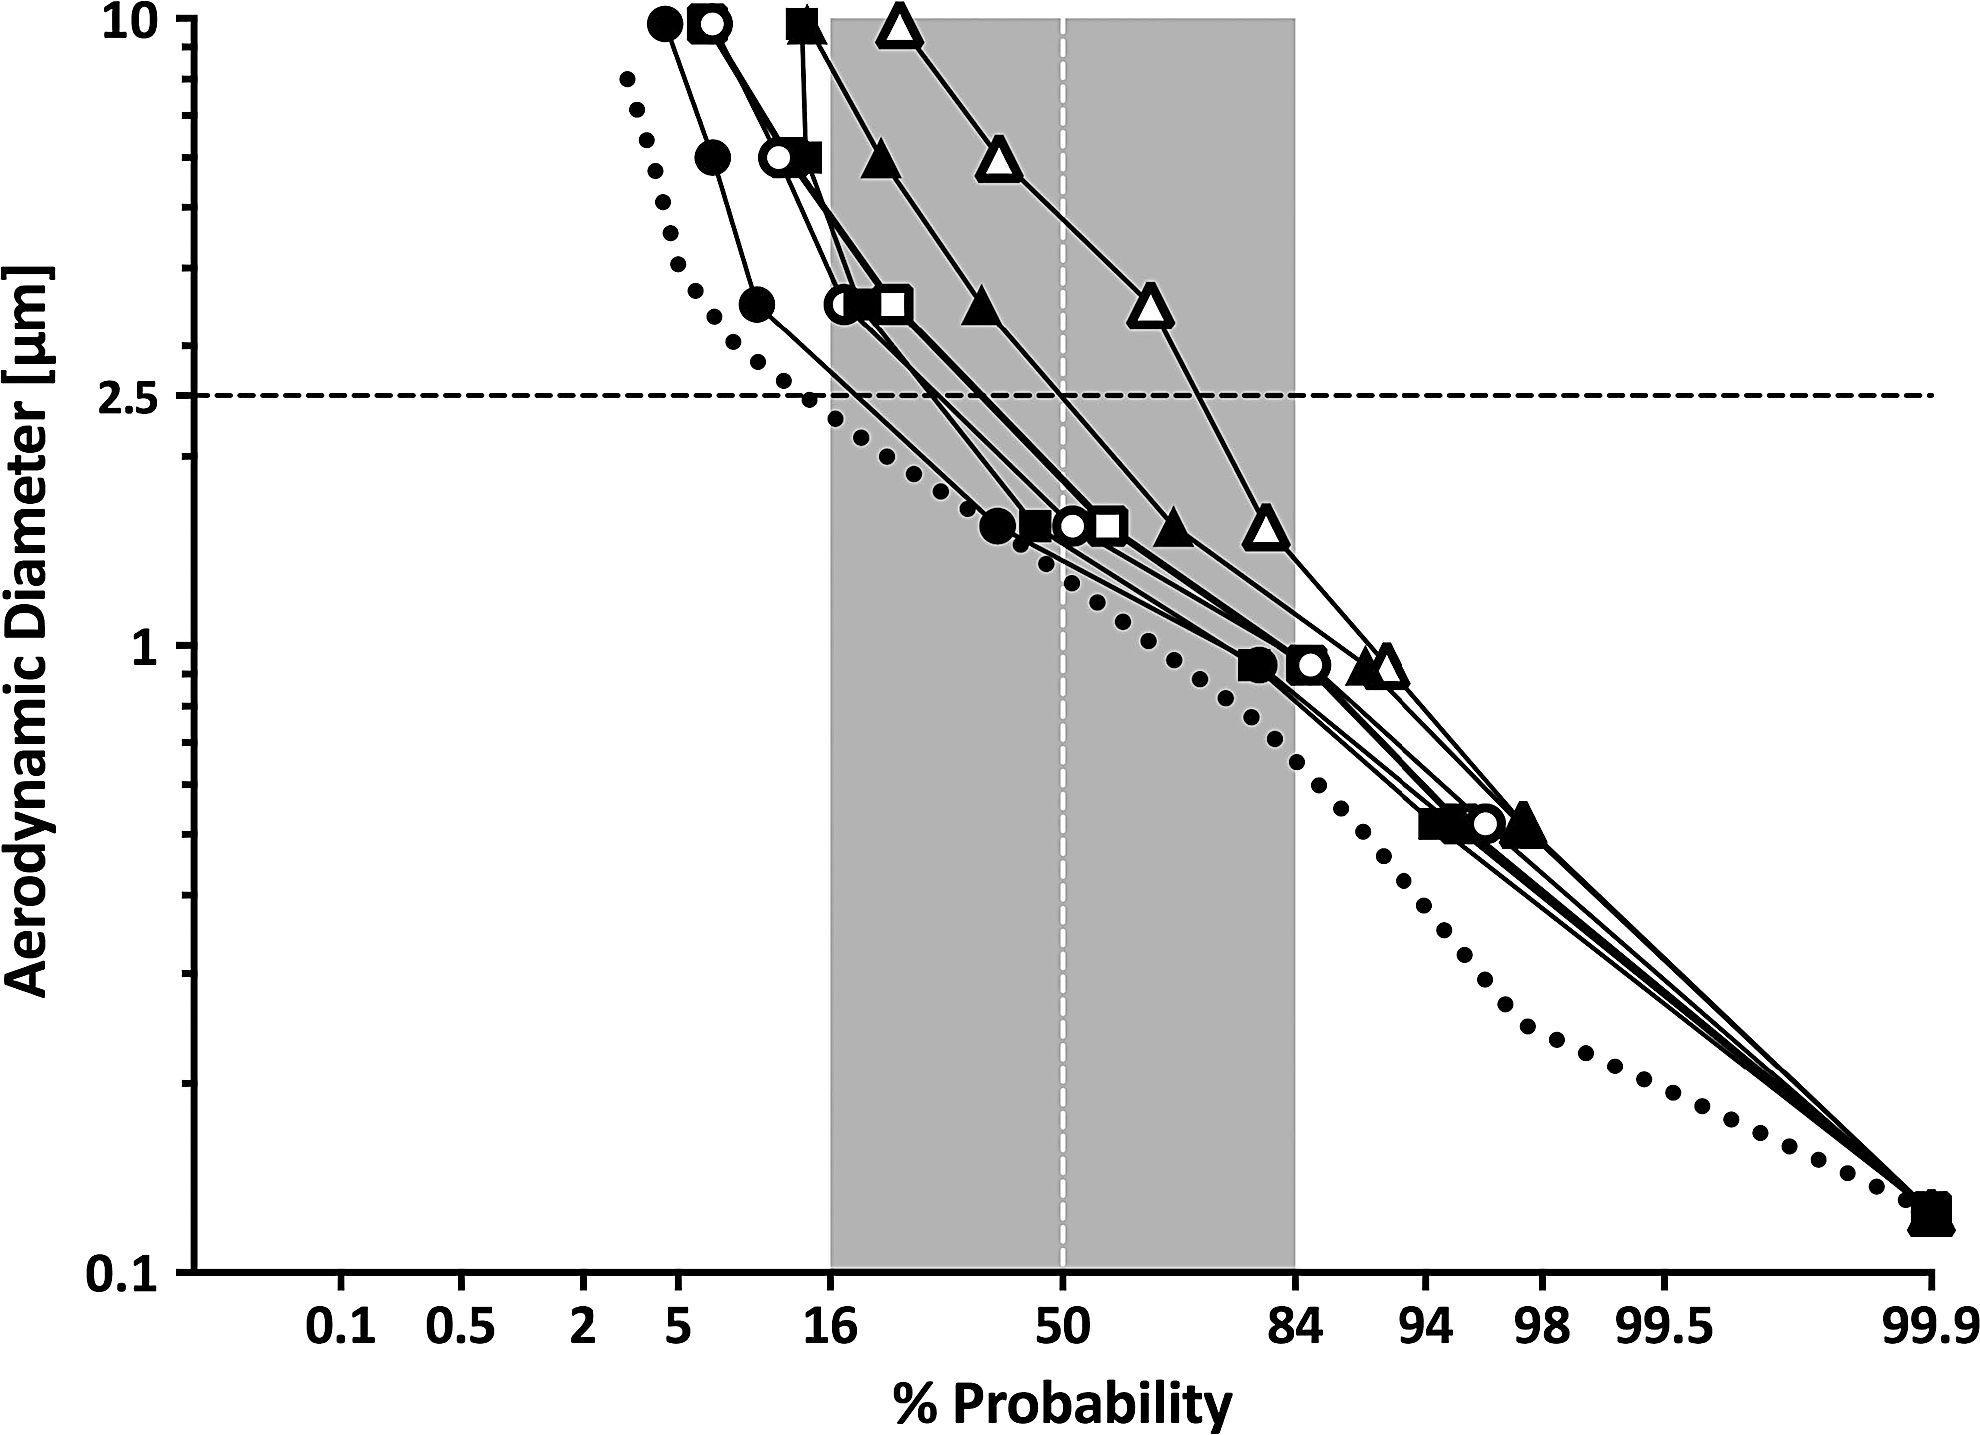
Particle size distributions measured during ventilation without the prototype chamber. Closed symbols depict the COPD breathing pattern (Vt 450, rate 15, duty cycle 0.35), and open symbols slow and deep breathing (Vt 1,500 mL, rate 5, duty cycle 0.70). Symbols (circles, squares, and triangles) represent Omron 1, 2, and 3, respectively; ventilated AeroTech II distribution is shown by the dotted line.
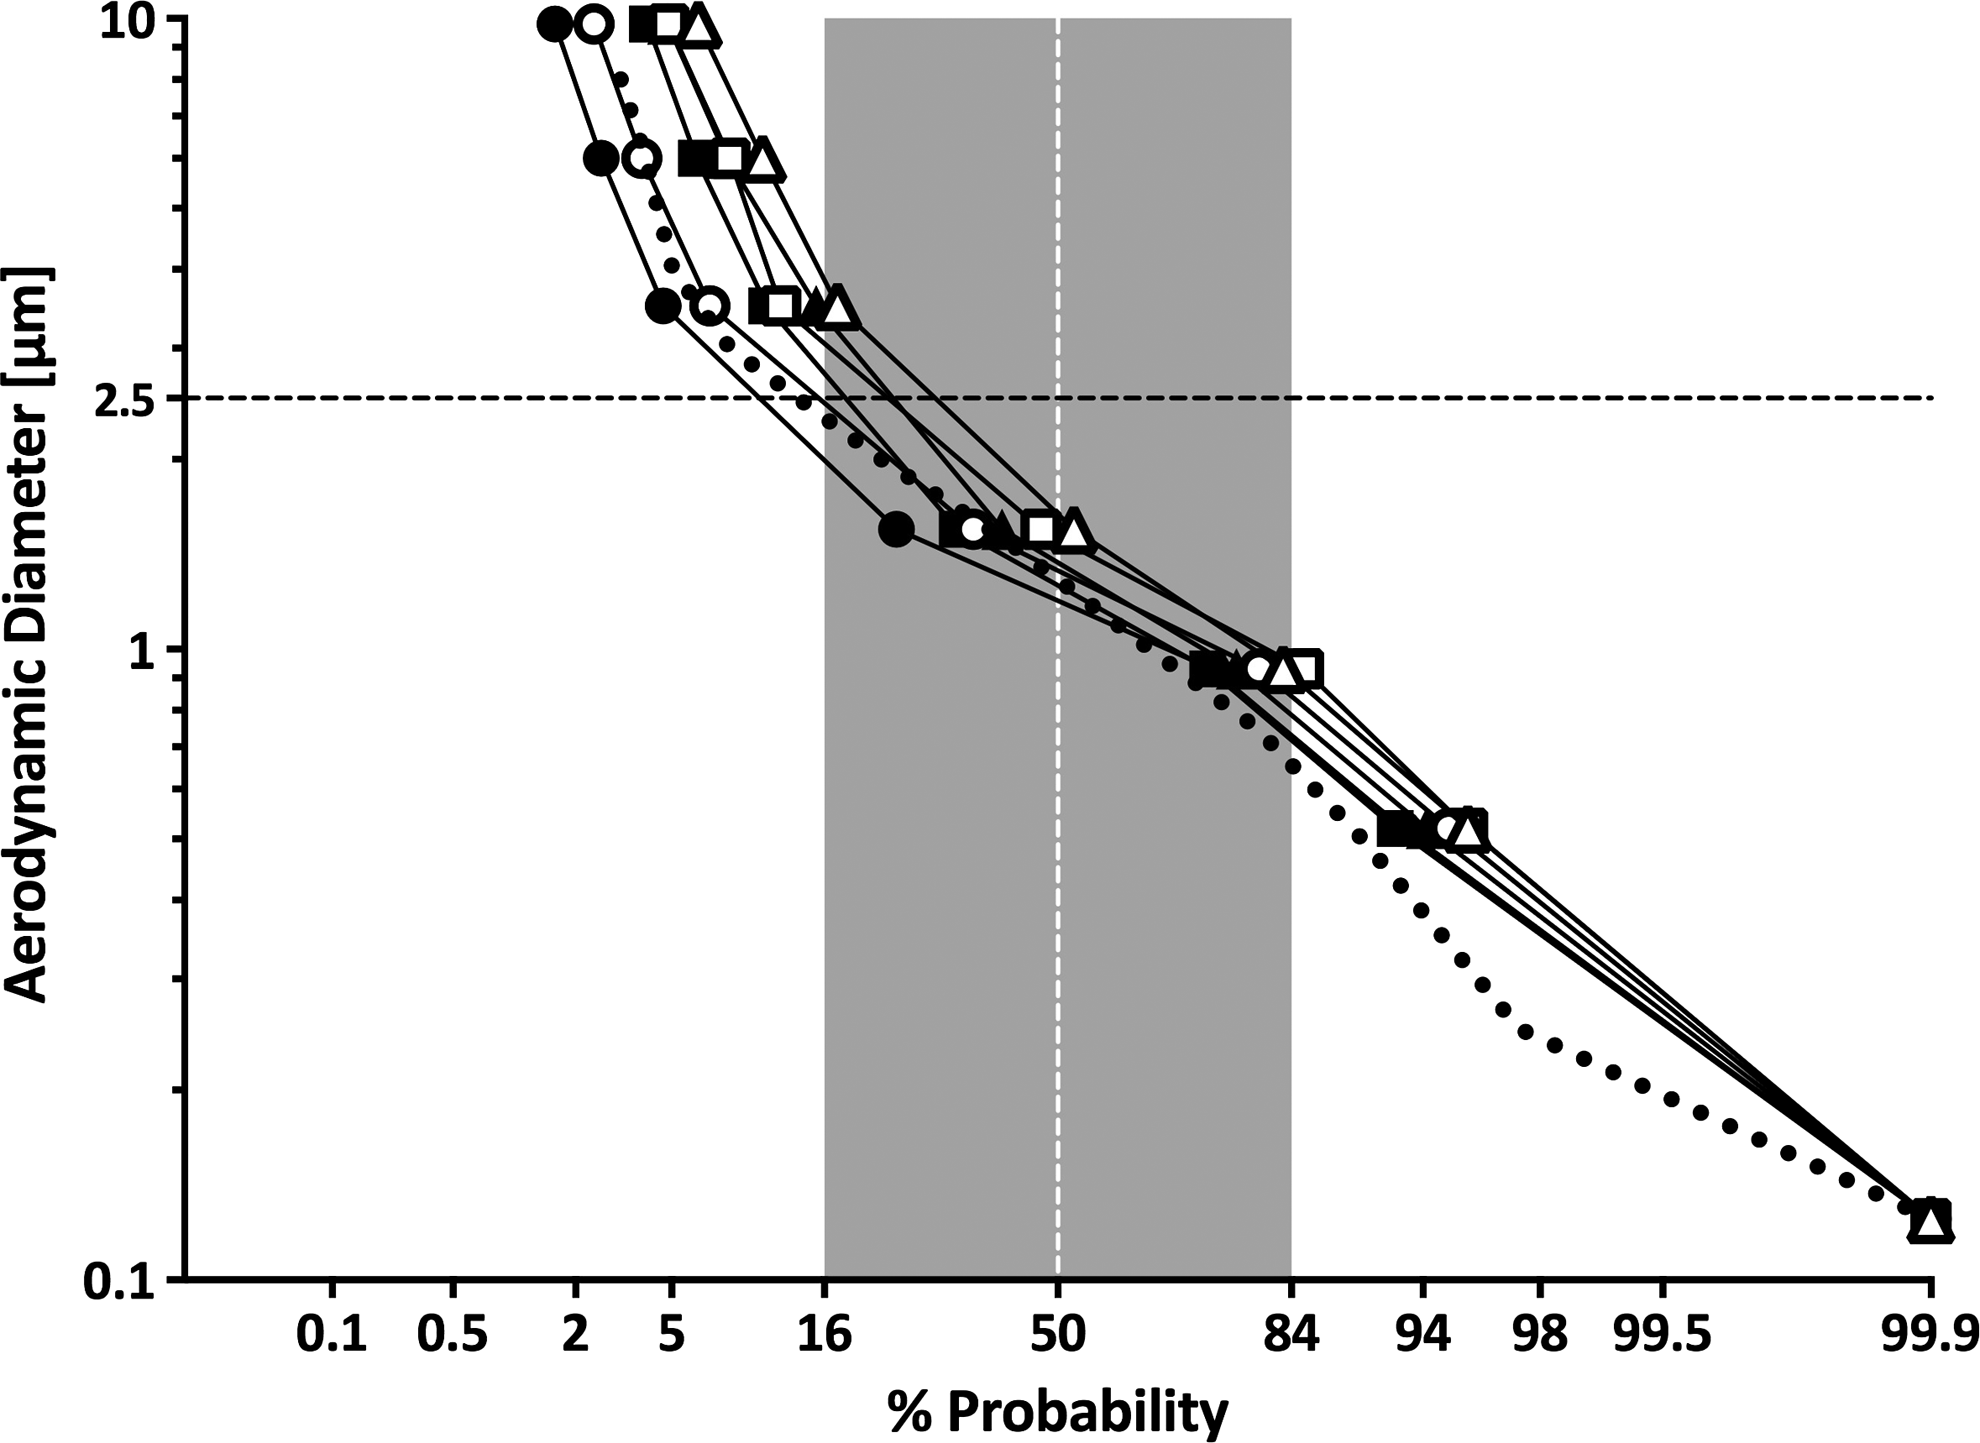
Particle size distributions measured during ventilation with chamber added to circuit. Closed symbols depict the COPD breathing pattern (Vt 450, rate 15, duty cycle 0.35), and open symbols slow and deep breathing (Vt 1,500 mL, rate 5, duty cycle 0.70). Symbols (circles, squares, and triangles) represent Omron 1, 2, and 3, respectively; ventilated AeroTech II distribution is shown by the dotted line.
Respirable mass
The chamber influence on the RM is listed in Table 1 and illustrated on the mass balance plots in Figure 4. Without the chamber, between 10% and 30% of the Omron's output would be expected to deposit in the upper airways (up to 40% of the IM). With the chamber, two effects are seen: first, an increase in IM for tidal forms of breathing (e.g., COPD pattern); and second, for all forms of ventilation, an increase in RF with a significant increase in RM.
Treatment time
Mean treatment times are listed in Table 1. As indicated from the magnitude of the standard deviation, there is significant variability between devices. Continuous operation results in lower times for all patterns of breathing.
Effects of humidity
Figure 8 and Table 1 summarize effects on particle size distributions using the chamber with large changes in RH. Changes in mass median aerodynamic diameter (MMAD) are small. There are small shifts in the particle size distribution, with mean RF ranging from 0.822 to 0.730 at the highest RH. These data suggest that humidity is not a significant factor in the final particle distribution leaving the chamber.
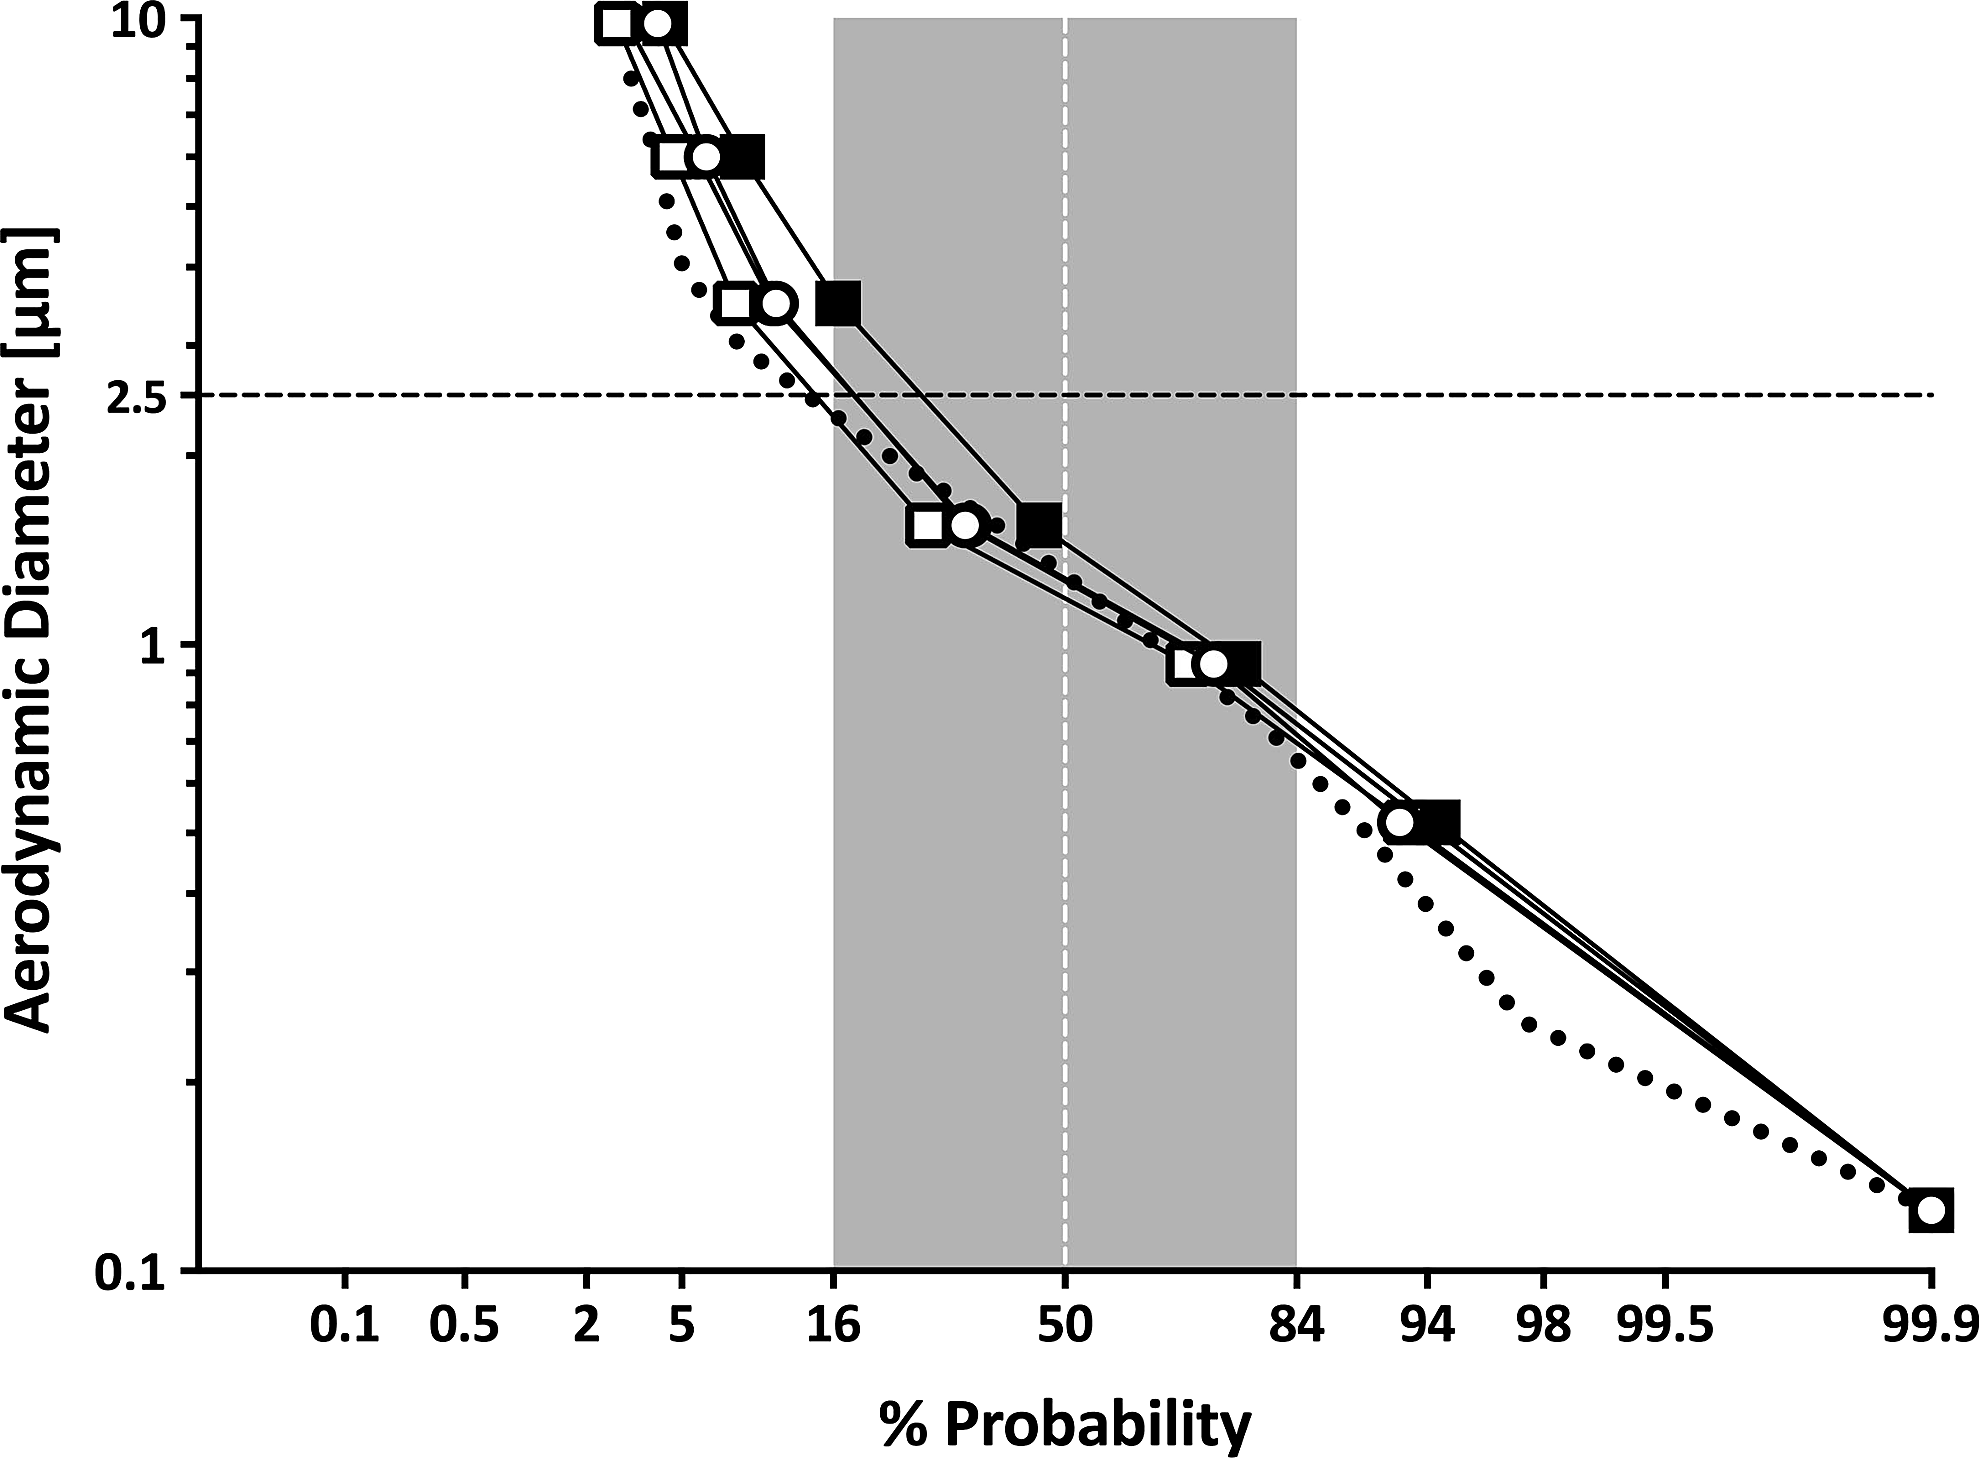
Ventilated particle size distributions with chamber using COPD breathing pattern at different RH: 21%, open circles (MMAD=1.26); 32%, open squares (MMAD=1.18); 50%, closed circles (not seen, as superimposed on open circles) (MMAD=1.27); and 90%, closed rectangles (MMAD=1.45).
Lung deposition
Figure 9 illustrates lung deposition images in the same volunteer using the nebulizer with chamber system. The subject used a slow and deep pattern of breathing. The indicated particle size distributions and corresponding images were measured following inhalation from a modified U22 device with the best RF (image A) and from a second U22 device, which produced the lowest RF (image B). The in vitro data predicted the observations seen in vivo. The distribution to the left of the AeroTech II line resulted in 100% regional deposition in the lung parenchyma (0% upper airway), and the distribution to the right of the AeroTech II line was associated with upper airway activity (shown in the stomach), which represented approximately 13% of the total regional deposition.
Particle size distributions superimposed on scintigraphy images in the same manner as in Figure 1. Subject inhaled radiolabeled particles from chamber circuit producing leftward distribution (closed circles; image
Discussion
Our goal is to reproducibly and efficiently deliver nebulized agents to the lungs, avoiding the upper airways. The present article indicates that the Omron U22 vibrating mesh nebulizer generates aerosols efficiently, but tends to produce large particles outside the respirable range. Although this article documents results for Omron technology, the authors and others have anecdotal experience with many examples of mesh technology with similar observations.(10,12) Therefore, to gain the full value of mesh aerosol delivery, we have applied our chamber device to capture exhaled particles, increase IM, modify the particle size distribution to increase RM, and decrease treatment time. Our chamber promotes mixing of particles with room air, allowing conditioning of the aerosol and resulting in an increase in the RF. The increase in RF combined with the retention of particles that would be lost during expiration significantly increases the RM, preserving much of the inherent efficiency of the nebulizer while minimizing upper airway deposition. Our deposition experiments confirm the value of our in vitro approach to predicting upper airway deposition first quantified for jet nebulizers and now applicable to mesh devices. This will facilitate bench testing of future designs before testing in human subjects.
Other investigators have designed chamber systems to improve device efficiency. For example, Vecellio and colleagues developed the Idehaler (La Diffusion Technique Française, Saint Etienne, France), a chamber designed to increase IM in vitro (to approximately 90%).(13) Their group has reported drug delivery in human studies using the Aeroneb mesh nebulizer (Aerogen, USA).(14) Although they have reported significant increases in delivery to the lungs, the particle size distributions appear unchanged, and the device is designed primarily to capture the plume of the Aeroneb without chamber losses.(13) Nektar has used a similar device(12) for the delivery of antibiotics in spontaneously breathing patients. In 15 normal subjects, Corkery et al. reported lung deposition averaging 43.1±6.1% of the initial nebulizer charge, with the remainder found in the upper airways (29.4±7.4%).(15) This pattern of delivery could pose a problem if upper airway deposition resulted in local side effects.
Like the Idehaler, our chamber also captures particles that would be lost during exhalation, but it modifies the component of the distribution that is destined to deposit in the upper airways. Our data suggest that there are two important phenomena affecting particles in our experiments: first, the effects of ventilating wet aerosols with room air results in shrinkage; and second, there is impaction of particles in the chamber. The evaporation effects are best shown in Figures 5 and 6 as the standing cloud distribution shifts to the left due to the effects of ventilation. Using the chamber results in further changes in the particle size distributions to the final distributions seen in Figure 7. The latter effect is likely due to impaction of large particles in the chamber. Further proof of this is suggested in Figure 8, where only minimal effects are seen on the final particles leaving the chamber with added humidity. Although ventilating with room air will shrink the particles (as with all wet aerosols), the chamber is necessary to preserve efficiency and take out the remaining large particles, as demonstrated by the significant increase in RM over that seen with spontaneous breathing without the chamber.
Finally, our study indicates how future designs of aerosol delivery systems can be further optimized. First, although chamber design can moderate the distributions of a population of mesh devices, limiting the population of meshes produced to those with holes smaller than those of Omron 3 (e.g., Omron 1 and 2) will help ensure that the final conditioned distributions approach that of the AeroTech II. Our data indicate that, compared with breath actuation, treatment time can be reduced with a chamber, but meshes that produce particles that are too small (e.g., smaller than those from Omron 1) will effectively prolong treatment time with no gain in deposition.(5) Controlling the flow of room air into the chamber is important in finalizing the aerosol distribution and lung deposition. These principles are illustrated in Figure 10, a diagram of an idealized chamber based on our experience to date. The mesh is inherent to the chamber and does not require fittings dependent on airflow through the mesh (unlike that of the Omron, which could not be sealed). Inspiration can be regulated via a valved one-way inspiratory orifice, which provides some resistance to flow (to control patient inspiration) and helps define the flow of air into the chamber. With the base of the device sealed, leaks are eliminated, inspiratory/expiratory valve design is simplified, and chamber volume can be reduced.
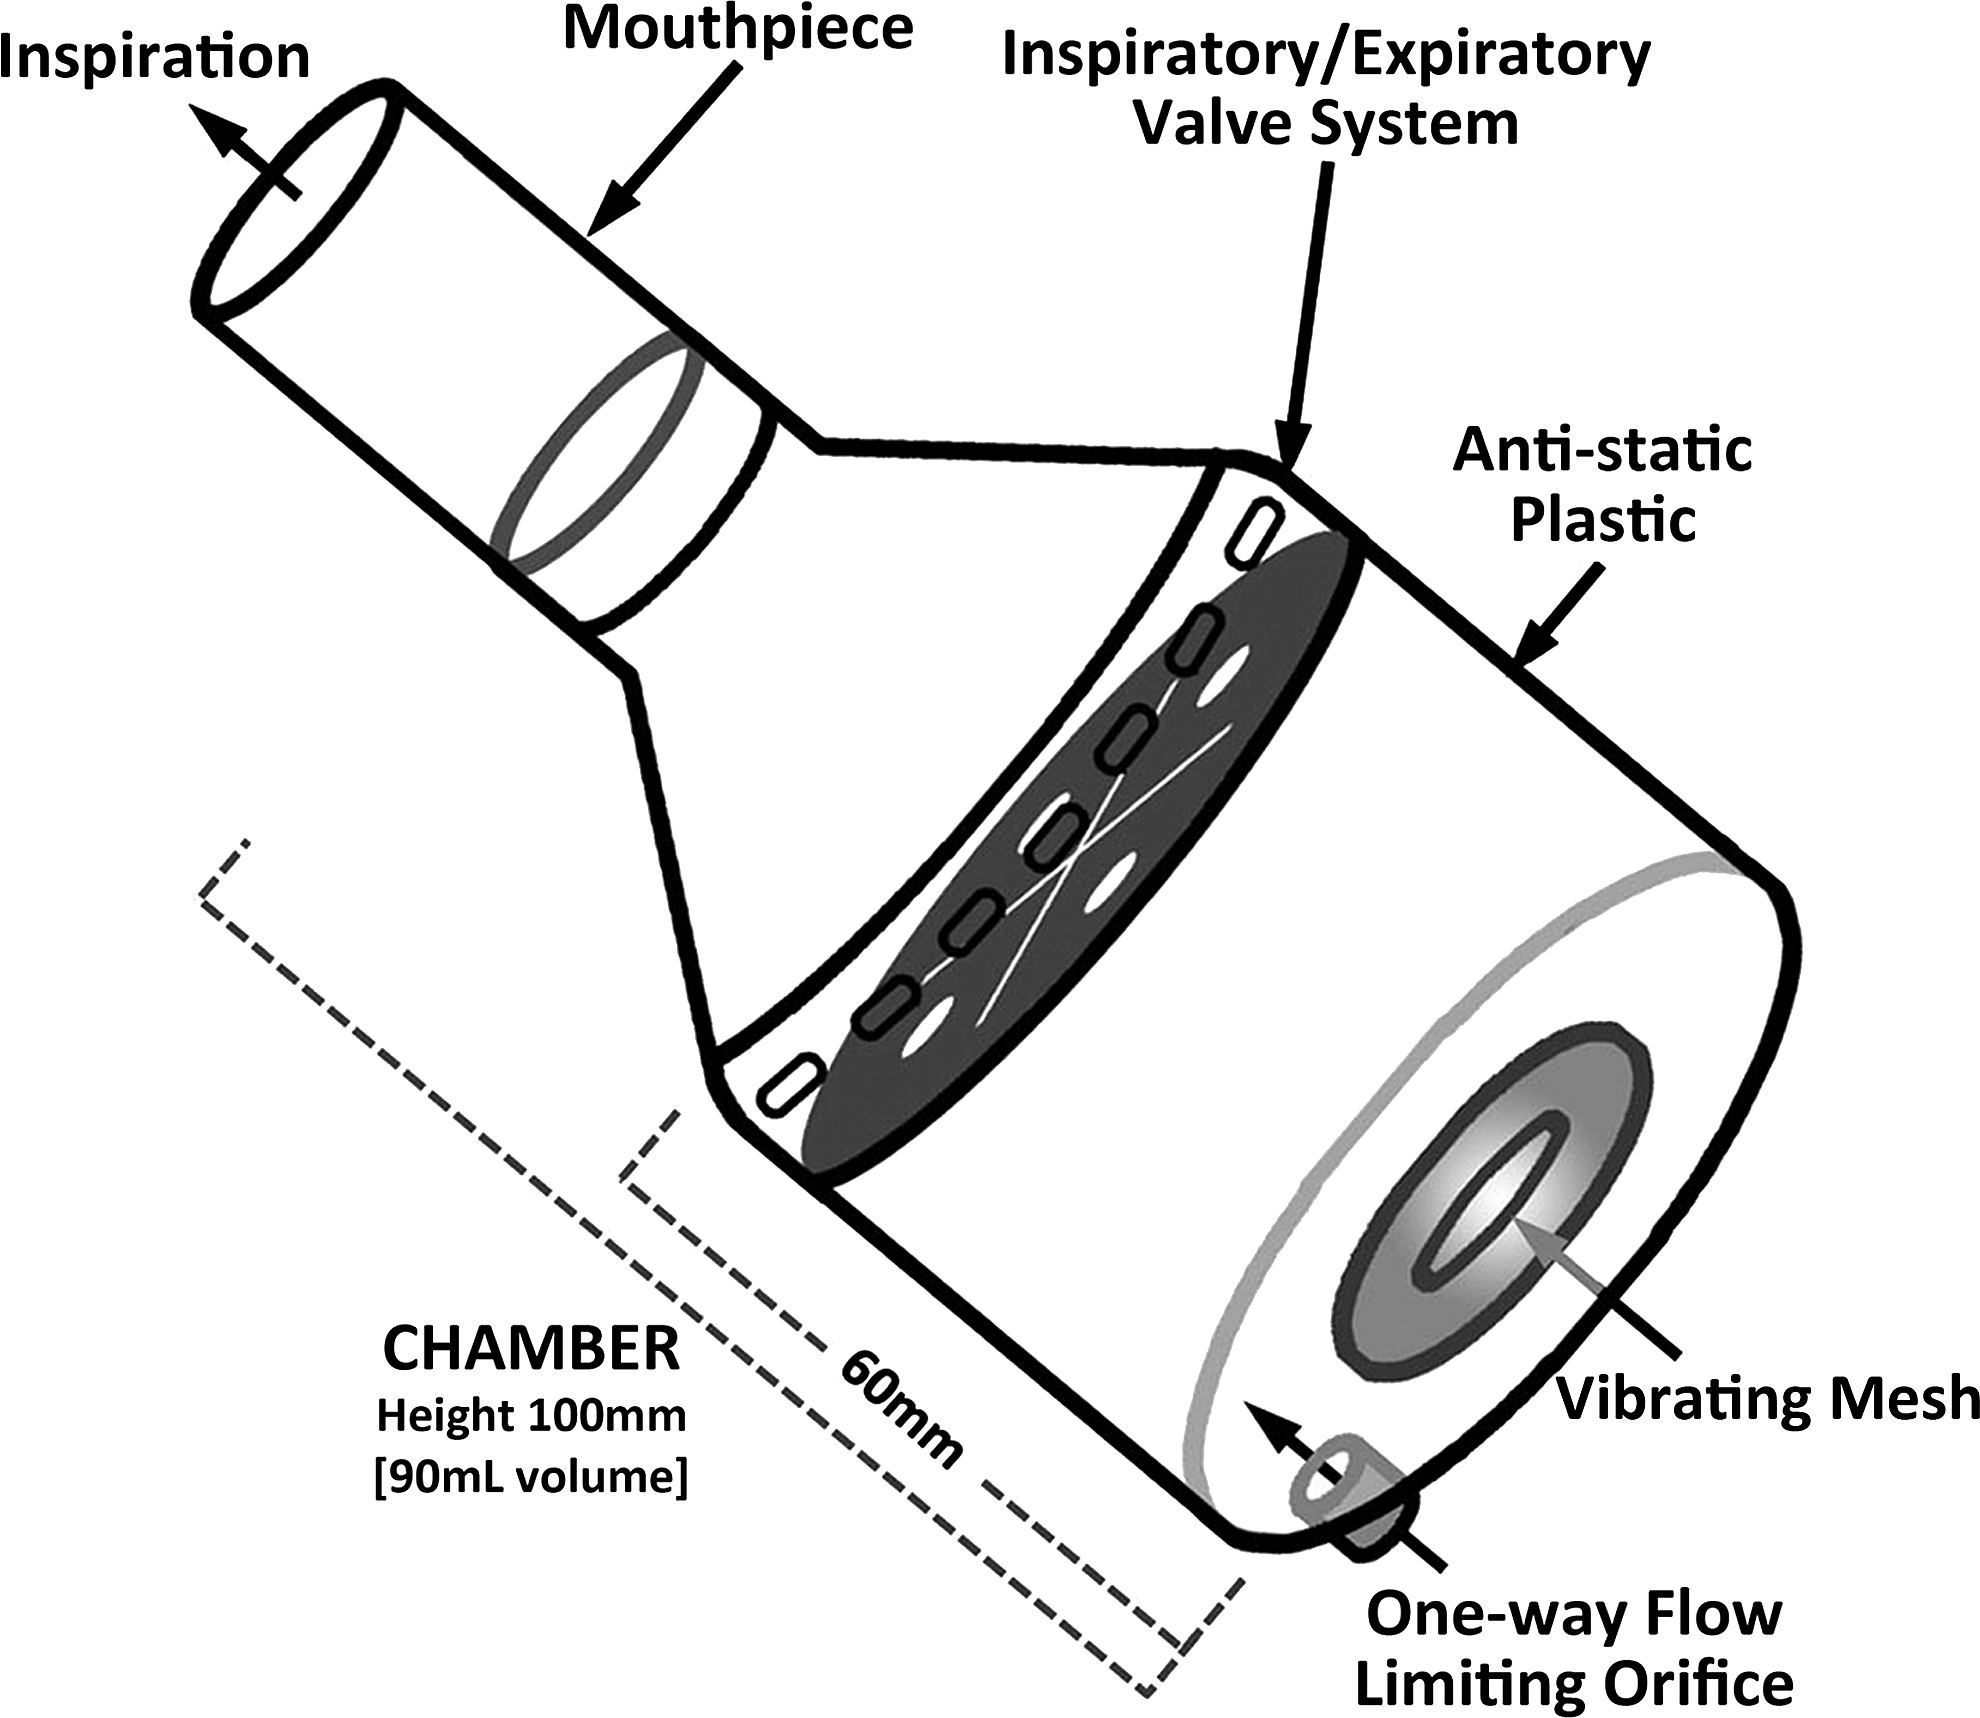
Idealized chamber design. Nebulizer is incorporated in chamber base with no opening for airflow; all inspiratory gases enter chamber via one-way orifice; chamber volume can be reduced (e.g., 90 mL); and valve system is designed to accommodate different breathing patterns.
Footnotes
Acknowledgments
The authors thank Lorraine Morra for technical assistance in performing the aerosol studies and preparing the manuscript.
Author Disclosure Statement
The authors declare that there are no conflicts of interest.