
Abstract
Abstract
Background:
Establishing robust in vitro–in vivo correlations (IVIVC) between aerosol performance, pharmacokinetics, and clinical efficacy is critical in developing bioequivalent drug-device combination products. Recent studies have demonstrated that realistic throat models tested under realistic test conditions may provide good IVIVC with respect to total lung deposition.
Methods:
The Alberta idealized throat (AIT) model was utilized with mean peak inspiratory flow rates determined from patient breathing studies. Various formulations of indacaterol (e.g., lactose blends, fixed dose combinations, engineered PulmoSphere™ particles) were tested in the AIT model and in clinical pharmacokinetic studies.
Results:
Good IVIVC were observed with respect to total lung deposition, systemic delivery, and the contribution of oral absorption to systemic delivery, with percentage differences from the mean in vivo measurements <15%, with most comparisons <5%.
Conclusions:
Anatomical throat models represent an exciting tool to aid in formulation development of pharmaceutical aerosols.
Introduction
T
Delvadia et al. explored IVIVCs for multiple marketed inhalation products (e.g., Spriva® Handihaler®, Relenza® Diskhaler®, Salbutamol Easyhaler®, Pulmicort®, Turbuhaler®, and Foradil® Aerolizer®) with anatomical throat models.(2,3) With the exception of Relenza Diskhaler, good IVIVC correlations were observed.(2,3) Delvadia et al. also found that the between subject variability in TLD could be accounted for, at least in part, by differences in throat anatomy and patient flow-time profiles.
Finally, Finlay and co-workers have also demonstrated good IVIVCs for their idealized versions of anatomical throats, extending the correlations into children.(4–6) As experimental evidence for the utility of anatomical throats grows, discourse has turned towards standardization of the throat models and flow-time profiles.(6–8) As well, discussions have begun as to how these models should be utilized in practice. Olsson et al. pointed out that if the anatomical throat models are utilized after pivotal clinical studies to make claims with respect to TLD and clinical performance, “then there may be a disconnect between those exposed to the risks (patients), and those harvesting the benefits (industry).”(7) In contrast, if the models are used to speed early product and clinical development, “the risks and benefits are held exclusively by industry.”
In this article, we will explore how an anatomical throat model can be used as a tool to predict in vivo differences in TLD and systemic exposure for different formulations comprising indacaterol, an ultra-long-acting β2-agonist (LABA) delivered with a unit dose dry powder inhaler. Indacaterol (QAB149) is approved for maintenance bronchodilator treatment of airflow obstruction in adult patients with chronic obstructive pulmonary disease (COPD).(10–12) The drug products marketed by Novartis (Arcapta™ Neohaler™ in the US and Onbrez® Breezhaler® in the EU) are formulated as lactose blends (LB) with coarse lactose monohydrate carrier particles. The Breezhaler is a portable, passive, capsule-based (size 3), dry powder inhaler of low resistance [R=0.06 cm H2O0.5 L−1 min].(13) The base indacaterol LB formulation will be compared with a LB formulation comprising a fixed dose combination of indacaterol maleate and glycopyrronium bromide (Ultibro® Breezhaler®, QVA149), and with a small porous particle formulation (PulmoSphere™, PS) of indacaterol maleate.
Materials and Methods
Materials
Lactose blends comprising indacaterol maleate are marketed in different dosage strengths (expressed in terms of free base) in different regions. In Europe, 150 mcg and 300 mcg doses are prescribed, while in the US the commercial product comprises a 75 mcg dose. The Ultibro lactose blend formulation approved in Europe and Japan contains 110 mcg of indacaterol maleate and 50 mcg of glycopyrronium bromide.(14,15) A lactose blend formulation of the glycopyrronium bromide mono-component (Seebri® Breezhaler®, NVA237) was also approved in the EU in a 50 mcg dose.(16) All three commercial drug products are approved for use in chronic obstructive pulmonary disease (COPD) only. They are not approved for use in asthma patients. The drug products utilized were supplied by Novartis Drug Supply Management (DSM).
The engineered porous particles comprising indacaterol were manufactured via Novartis' proprietary PulmoSphere manufacturing process, which is designed to improve lung targeting and dose consistency relative to currently marketed asthma/COPD drug products.(17–20) The PS particles are comprised of crystalline indacaterol maleate coated with a porous shell of distearoylphosphatidylcholine (DSPC) and calcium chloride in a 2:1 molar ratio. Nominal doses of 75 mcg and 37.5 mcg of indacaterol PS were filled into size 3 hypromellose capsules using a proprietary drum-based filling process.
In vivo methods
We reviewed the database of indacaterol clinical studies looking for in vivo studies that: (a) provided comparisons between different formulations comprising indacaterol, and (b) had significant pharmacokinetic data, preferably with charcoal block and intravenous controls to enable assessment of pulmonary bioavailability. Four clinical studies were selected for comparison with in vitro test methods. A detailed analysis of indacaterol pharmacokinetic studies can be found in a review published by Cazzola et al.(21) Serum indacaterol concentrations were experimentally determined using an on-line solid-phase extraction method coupled with liquid chromatography-tandem mass spectrometry detection.(22)
Biodistribution of indacaterol LB (Study 1)
The primary objective of Study 1 was to determine the absolute bioavailability of a single 300 mcg dose of indacaterol LB administered with the Breezhaler.(21,23) For drugs that are orally bioavailable, such as indacaterol, the total systemic exposure contains contributions from the fraction of drug delivered to the lungs, and the fraction delivered to the throat that is absorbed systemically via the gastrointestinal tract (Fig. 1). Study 1 was a single-center, randomized, open-label, single-dose, three-period crossover in 8 healthy volunteers. The three treatment groups were: (a) 300 mcg indacaterol LB inhaled via Breezhaler; (b) 200 mcg indacaterol solution administered via controlled intravenous infusion, and; (c) 600 mcg indacaterol LB inhaled via Breezhaler in conjunction with oral activated charcoal. As part of the study, it was demonstrated that administration of oral activated charcoal was effective in blocking gastrointestinal absorption of indacaterol resulting from throat deposition.
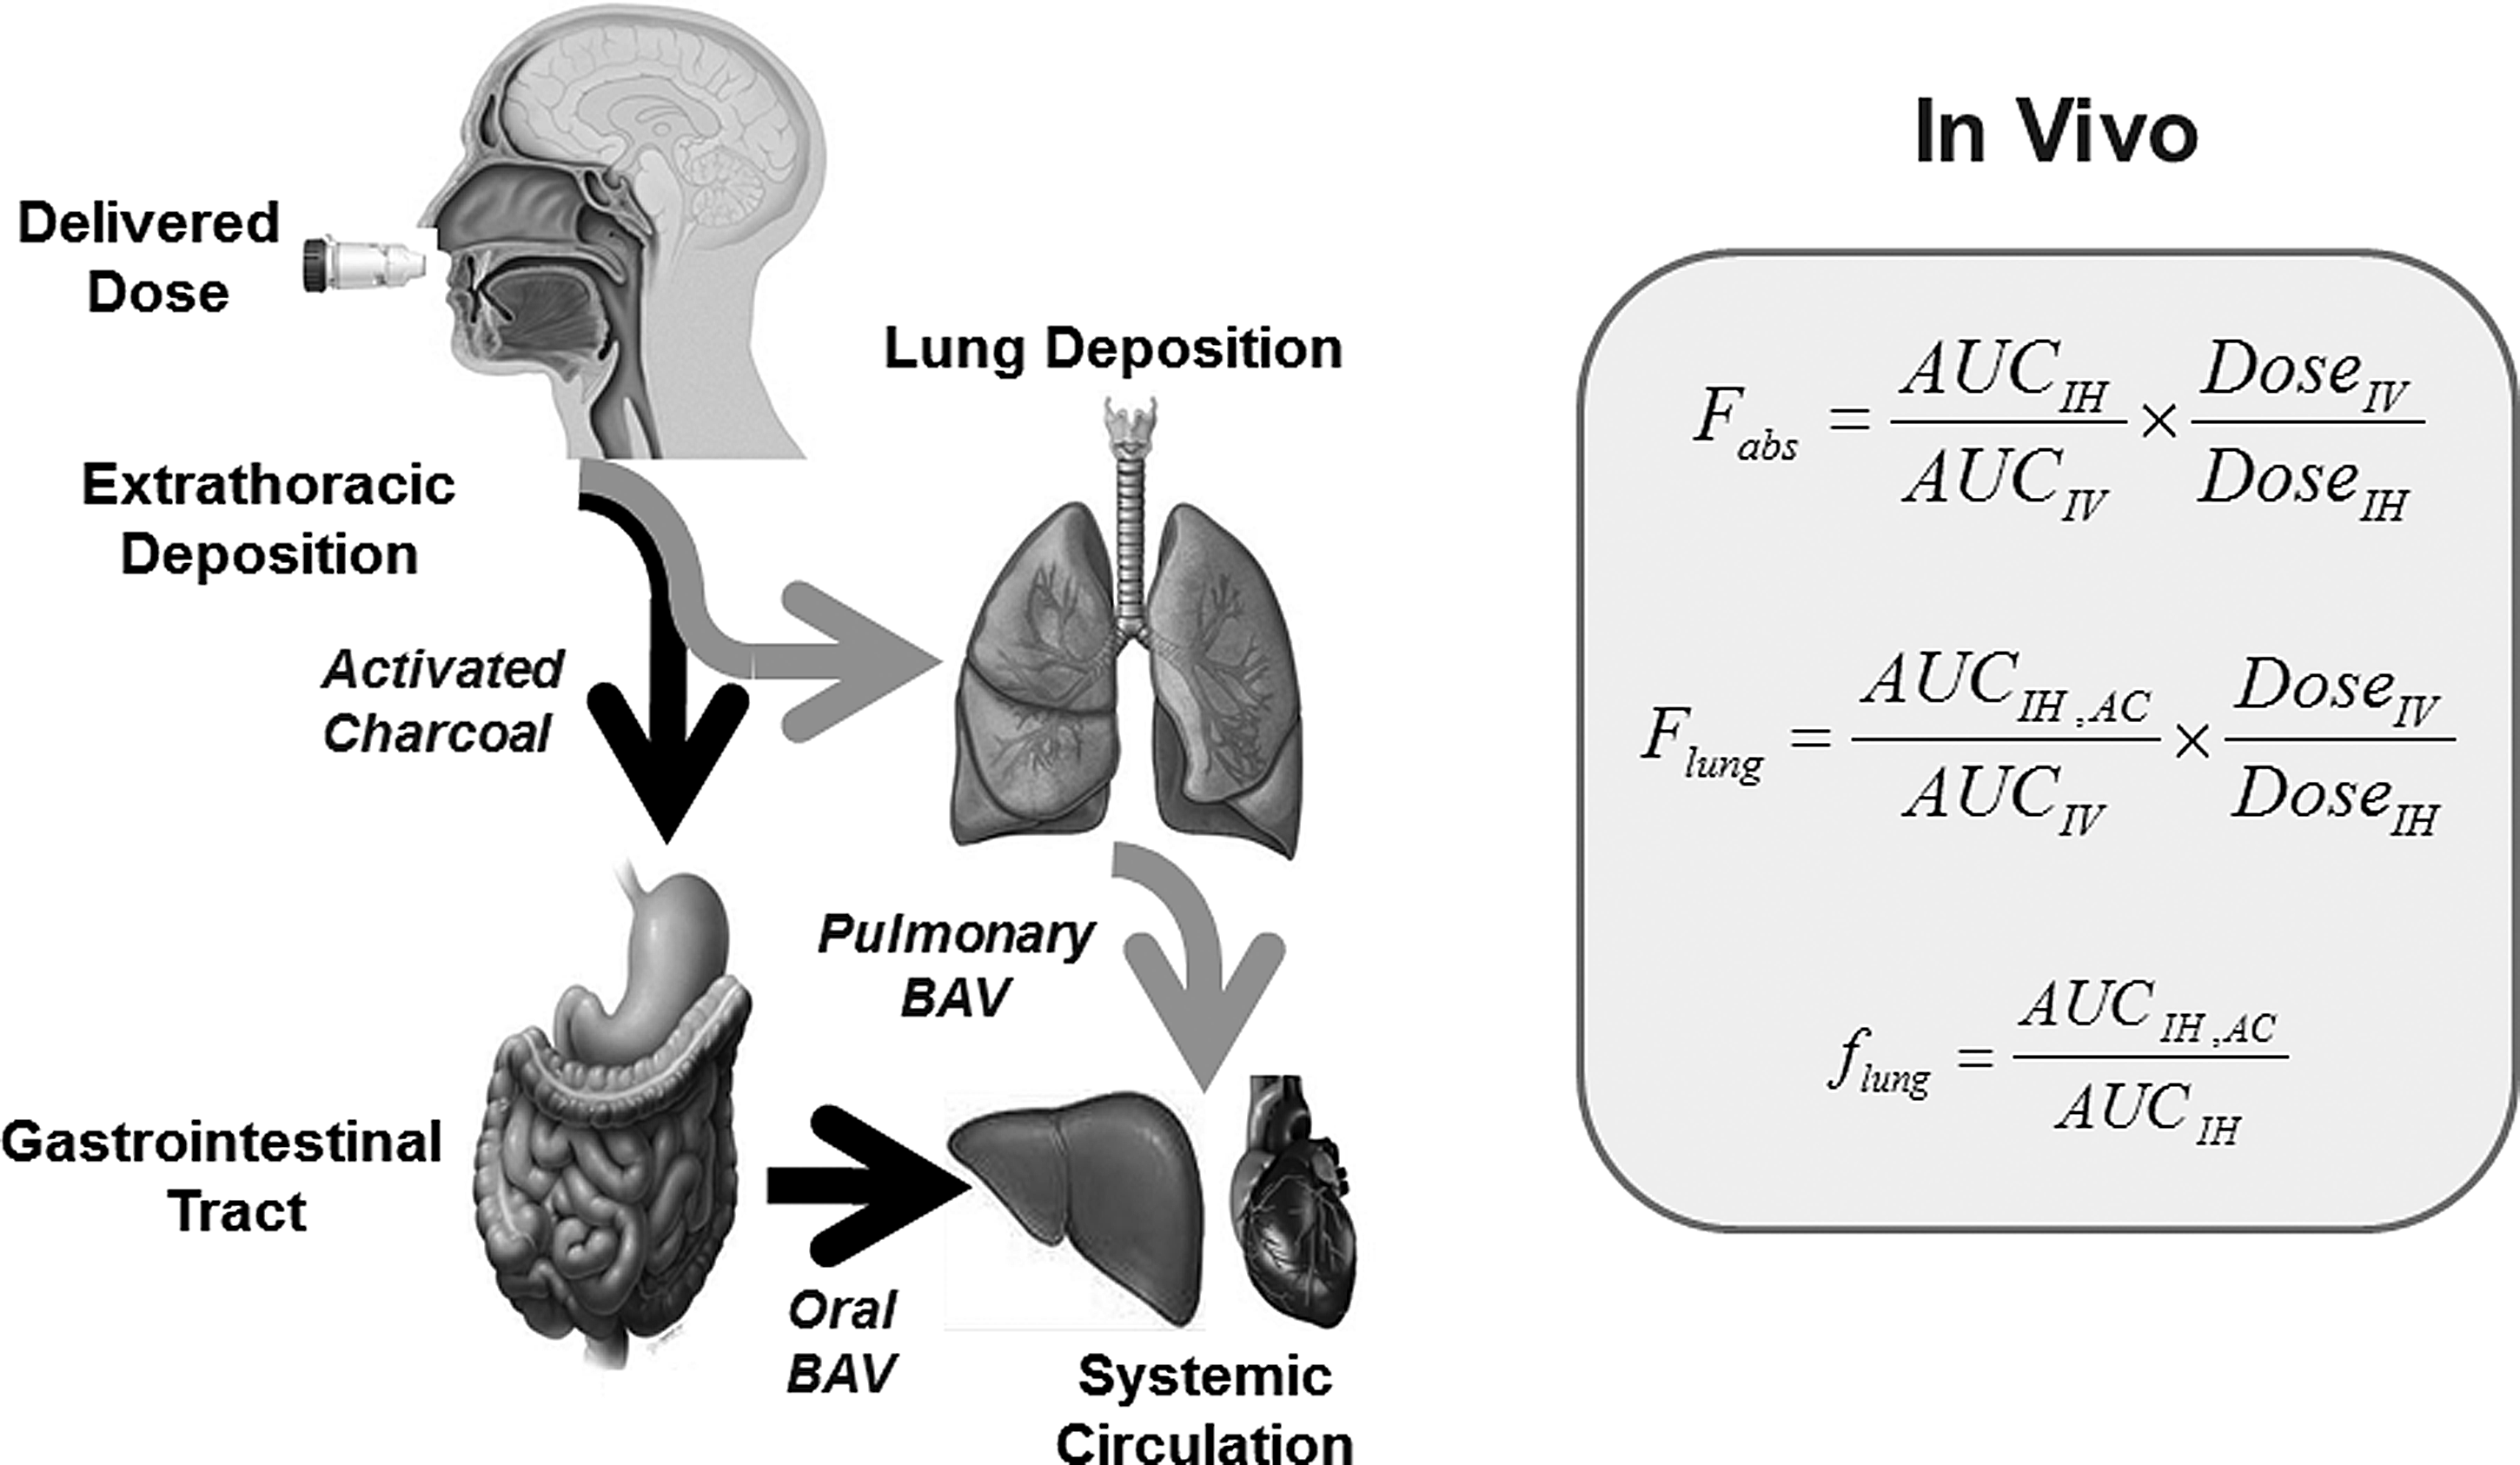
Diagram of the in vivo pharmacokinetic method used to assess biodistribution following aerosol delivery.
The absolute bioavailability,
The pulmonary bioavailability,
Given that indacaterol is absorbed with high efficiency into the systemic circulation, the pulmonary bioavailability provides a good measure of in vivo TLD. Finally, the relative contribution of pulmonary absorption to total systemic exposure,
Comparison of systemic exposure and lung function for LB and PS formulations of indacaterol in asthma patients (Study 2)
Studies 2 and 3 were conducted to assess the potential of the PS technology to deliver indacaterol as a life cycle extension to the safe and effective LB product. The objective of Study 2 was to compare the systemic pharmacokinetics and pharmacodynamics of indacaterol LB and indacaterol PS formulations in the Breezhaler. The study was a randomized, double-blind, double-dummy, multiple-dose (7-day), 4-way crossover study in 36 patients with persistent asthma. All patients in Study 2 were on a stable dose of inhaled corticosteroid for 4-weeks prior to screening and throughout the study. The four groups studied were: placebo, 75 mcg indacaterol LB, 75 mcg indacaterol PS, and 37.5 mcg indacaterol PS. The doses were selected to be at the knee or on the steep part of the FEV1 dose response curve to enable assessment of the impact of total lung deposition on lung function. The primary endpoint, trough FEV1 (day 8), was analyzed using an ANCOVA, with treatment, period, sequence and subject nested within sequence as fixed effects. The period baseline for FEV1 was included as a covariate in the model. Pharmacokinetic endpoints included: AUC0-24h, Cmax, and Tmax.
Comparison of systemic exposure for LB and PS formulations of indacaterol in healthy volunteers (Study 3)
The objective of Study 3 was to determine the relative contributions of lung absorption and oral absorption to systemic exposure of LB and PS formulations of indacaterol, via comparison of systemic pharmacokinetics with and without a charcoal block. The study was a randomized, open label study with the Breezhaler in 36 healthy volunteers. The nominal doses of indacaterol in the LB and PS formulations were 300 mcg and 150 mcg, respectively. The lower PS dose was chosen based on the in vitro aerosol studies which suggested that the lung delivery efficiency for the PS formulation was about twice that of the LB. For comparisons between the two formulations in Studies 2 and 3, the log transformed pharmacokinetic parameter data were analyzed using a fixed effects model with treatment, period, sequence and subject nested within sequence as fixed factors and period baseline body weight included as a covariate.
Systemic exposure for a fixed dose combination of indacaterol and glycopyronnium (Study 4)
Study 4 was a double-blind, randomized, placebo and active drug-controlled, incomplete crossover study to investigate the pharmacokinetics, safety, and pharmacodynamics of Ultibro Breezhaler LB in 29 healthy volunteers. The present analysis has focused on the differences in systemic exposure between the mono 150 mcg indacaterol maleate and 50 mcg glycopyrronium bromide formulations as compared to the fixed dose combination of the two drugs.
In vitro methods
Alberta Idealized Throat model
The in vitro total lung dose was determined using a stainless steel replica of the Alberta idealized throat (AIT), which represents a “manufacturable version” of the average geometry of adult subjects whose realistic throat geometries were obtained by magnetic resonance imaging and computed tomography scans.(24,25) This represents a throat size comparable to the medium-sized throats utilized by Olsson et al. and Delvadia et al. for determination of mean in vitro TLD in their studies.(1–3) A polysorbate wetting agent comprising equal parts Tween 20 and methanol was used for coating the interior walls of the AIT to prevent particle bounce and re-entrainment. A 75-mm customized filter holder was placed downstream of the AIT for determination of the mass of powder bypassing deposition in the throat. The mass of drug on the filter represents the in vitro TLD. The filters were assessed for drug content by high performance liquid chromatography (HPLC).(26)
Inspiratory flow profile
Two independent studies have been conducted to assess the inspiratory flow profiles of COPD patients with the Breezhaler(13) and Pavkov R, unpublished results. In the first study, a cross–section of COPD patients (n=26) with varying degrees of disease severity were able to achieve a mean peak inspiratory flow rate of 95 L min−1 through the Breezhaler, corresponding to a pressure drop (ΔP) of 4.4 kPa. All patients achieved a pressure drop of at least 1.3 kPa.(13) In the second study, also in 26 COPD patients, the mean peak inspiratory flow rate was 106 L min−1, and all patients achieved a pressure drop of at least 0.8 kPa (unpublished results). The magnitude of the mean pressure drop achieved by COPD patients with the Breezhaler device is consistent with that achieved by COPD and asthma patients in a range of dry powder inhalers of varying device resistance.(27) For the purposes of the IVIVC comparisons for clinical studies 1, 2, and 3, a square wave flow profile with a peak flow rate of 104 L min−1 and a total volume of 2 L was utilized. For the study exploring co-formulation effects in Ultibro (Study 4), a square wave profile with a peak flow rate of 90 L min−1 and a total volume of 2 L was utilized. These flow rates are consistent with the mean peak inspiratory flow rates observed in the breathing studies detailed above.(13)
Delivered dose
The delivered dose (DD) was obtained by mounting the inhaler into a test fixture, actuating the device with a controlled air-flow profile, and quantifying the drug mass collected on a filter using a drug-specific HPLC assay.(26) The DD ex-mouthpiece provides an in vitro measure of the total inhalation exposure of patients to the drug. DD testing was conducted with the same flow profiles as detailed above for the AIT determinations.
Aerodynamic particle size distributions
Aerodynamic particle size distributions (APSD) of the various powder formulations were assessed with a Next Generation Pharmaceutical Impactor (NGI). The NGI was operated at a flow rate of 60 L min−1 (from the mouthpiece) with a square wave inhalation profile (total volume=2 L for PS (N=3) and 4 L for LB products (N=5)).
Results
The pharmacokinetic data obtained in the four clinical studies is summarized in Table 1. Following IH administration, indacaterol exhibits a rapid onset of action (within 5 min), and a bronchodilatory effect that lasts 24 h.(21,28) The prolonged therapeutic effect is thought to be due to an interaction of the lipophilic indacaterol molecule with cell membranes of airway smooth muscle.(29) Despite having a solubility of just 0.2 mg/mL, indacaterol is rapidly absorbed into the systemic circulation with a Tmax of ∼15 min.(21,28) Indacaterol exhibits a two-phase clearance with a relatively rapid decline in serum concentration over the first 12 h, followed by a slow terminal elimination phase (T1/2 ∼90 h). (21,28)
The last serum sample was taken at 168 h for Studies 1 and 3, and 24 h for Studies 2 and 4.
Glycopyrronium also exhibits a rapid onset of bronchodilation (i.e., within 5 min) following IH administration.(30) The effect also persists over a period of ∼24 h. Glycopyrronium serum levels peak within 5 min of inhalation.(30) The drug has a measured clearance half-life of 33–57 h.(30)
AUClast represents the area under the curve taken from time zero to the last point where a serum sample was taken. For Studies 1 and 3 the last time-point was at 168 h, while for studies 2 and 4 it was at 24 h.
The values of Tmax >3 h observed for indacaterol and glycopyrronium in Study 4 are the result of the dosing regimen used in that study. Here, four consecutive doses were administered at time 0, 1, 2, and 3 h. The Tmax values for indacaterol and glycopyrronium were observed 15 min and 5 min following administration of the final dose, in agreement with the rapid systemic absorption described for these drugs above.
The in vitro data in the AIT for the various formulations used in the four clinical studies are presented in Table 2. The data reported in Table 2 include the delivered dose (i.e., the fraction of the nominal dose that bypasses deposition in the device), the fraction of the nominal dose that is deposited in the anatomical throat, and the TLD (i.e., the fraction of the nominal dose that is deposited on the filter post-AIT). Also presented is the calculated systemic exposure. This requires knowledge of the pulmonary and oral bioavailabilities of the drugs. The pulmonary bioavailabilities of indacaterol and glycopyrronium were assumed to be 100%. The measured oral bioavailabilities of indacaterol and glycopyrronium from the gastrointestinal tract are approximately 24% and 3%, respectively.(23,31,32)
Calculated from the mean delivered dose – mean lung dose
IVIVCs for indacaterol lactose blend (OnBrez Breezhaler)
In Study 1, indacaterol LB was administered via oral inhalation with and without oral activated charcoal.(21,23) Based on dose normalized AUClast parameters, the point estimate for the absolute bioavailability (
Table 3 compares the in vivo pharmacokinetic data with in vitro deposition data obtained with the AIT. The in vitro model predicts the key in vivo results (i.e., total lung delivery, total systemic delivery, and the contribution of lung delivery to total systemic delivery) to within 3% of the measured clinical value. The good IVIVC observed in total lung deposition of the indacaterol LB is consistent with the previous studies utilizing anatomical throat models detailed in the introduction.(1–6)
In vitro total lung dose for indacaterol LB formulation in the Alberta idealized throat model were obtained using a square wave flow profile at a flow rate of 104 L min−1, and a total volume of 2 L (n=5).
Estimates for in vitro systemic delivery and
Bioequivalence of lactose blend and PulmoSphere formulations of indacaterol
Demonstrating the bioequivalence of two dry powder inhaler products to the FDA is currently based on the “aggregate weight of evidence.”(33) That is, bioequivalence is predicated on achieving equivalence in terms of in vitro aerosol performance, systemic pharmacokinetics, and clinical efficacy. In Studies 2 and 3, we present data comparing the bioequivalence of a test formulation of indacaterol comprising engineered PS particles, with the reference LB drug product.
In vitro aerosol performance of indacaterol LB and indacaterol PS formulations in Breezhaler were assessed with the AIT across a range of peak inspiratory flow rates from 53 L min−1 to 128 L min−1 (Table 4, Fig. 2). This corresponds to pressure drops ranging from approximately 1.0 kPa to 6.0 kPa, encompassing the pressure drops determined for most COPD patients with the Breezhaler device. Table 2 presents the in vitro delivered dose and the in vitro TLD measured in the AIT. Although single doses of indacaterol PS (37.5 mcg) and indacaterol LB (150 mcg) were selected for the flow rate study, the results with other doses of the two formulations are essentially equivalent, as the formulations exhibit dose proportional aerosol performance (data not shown).
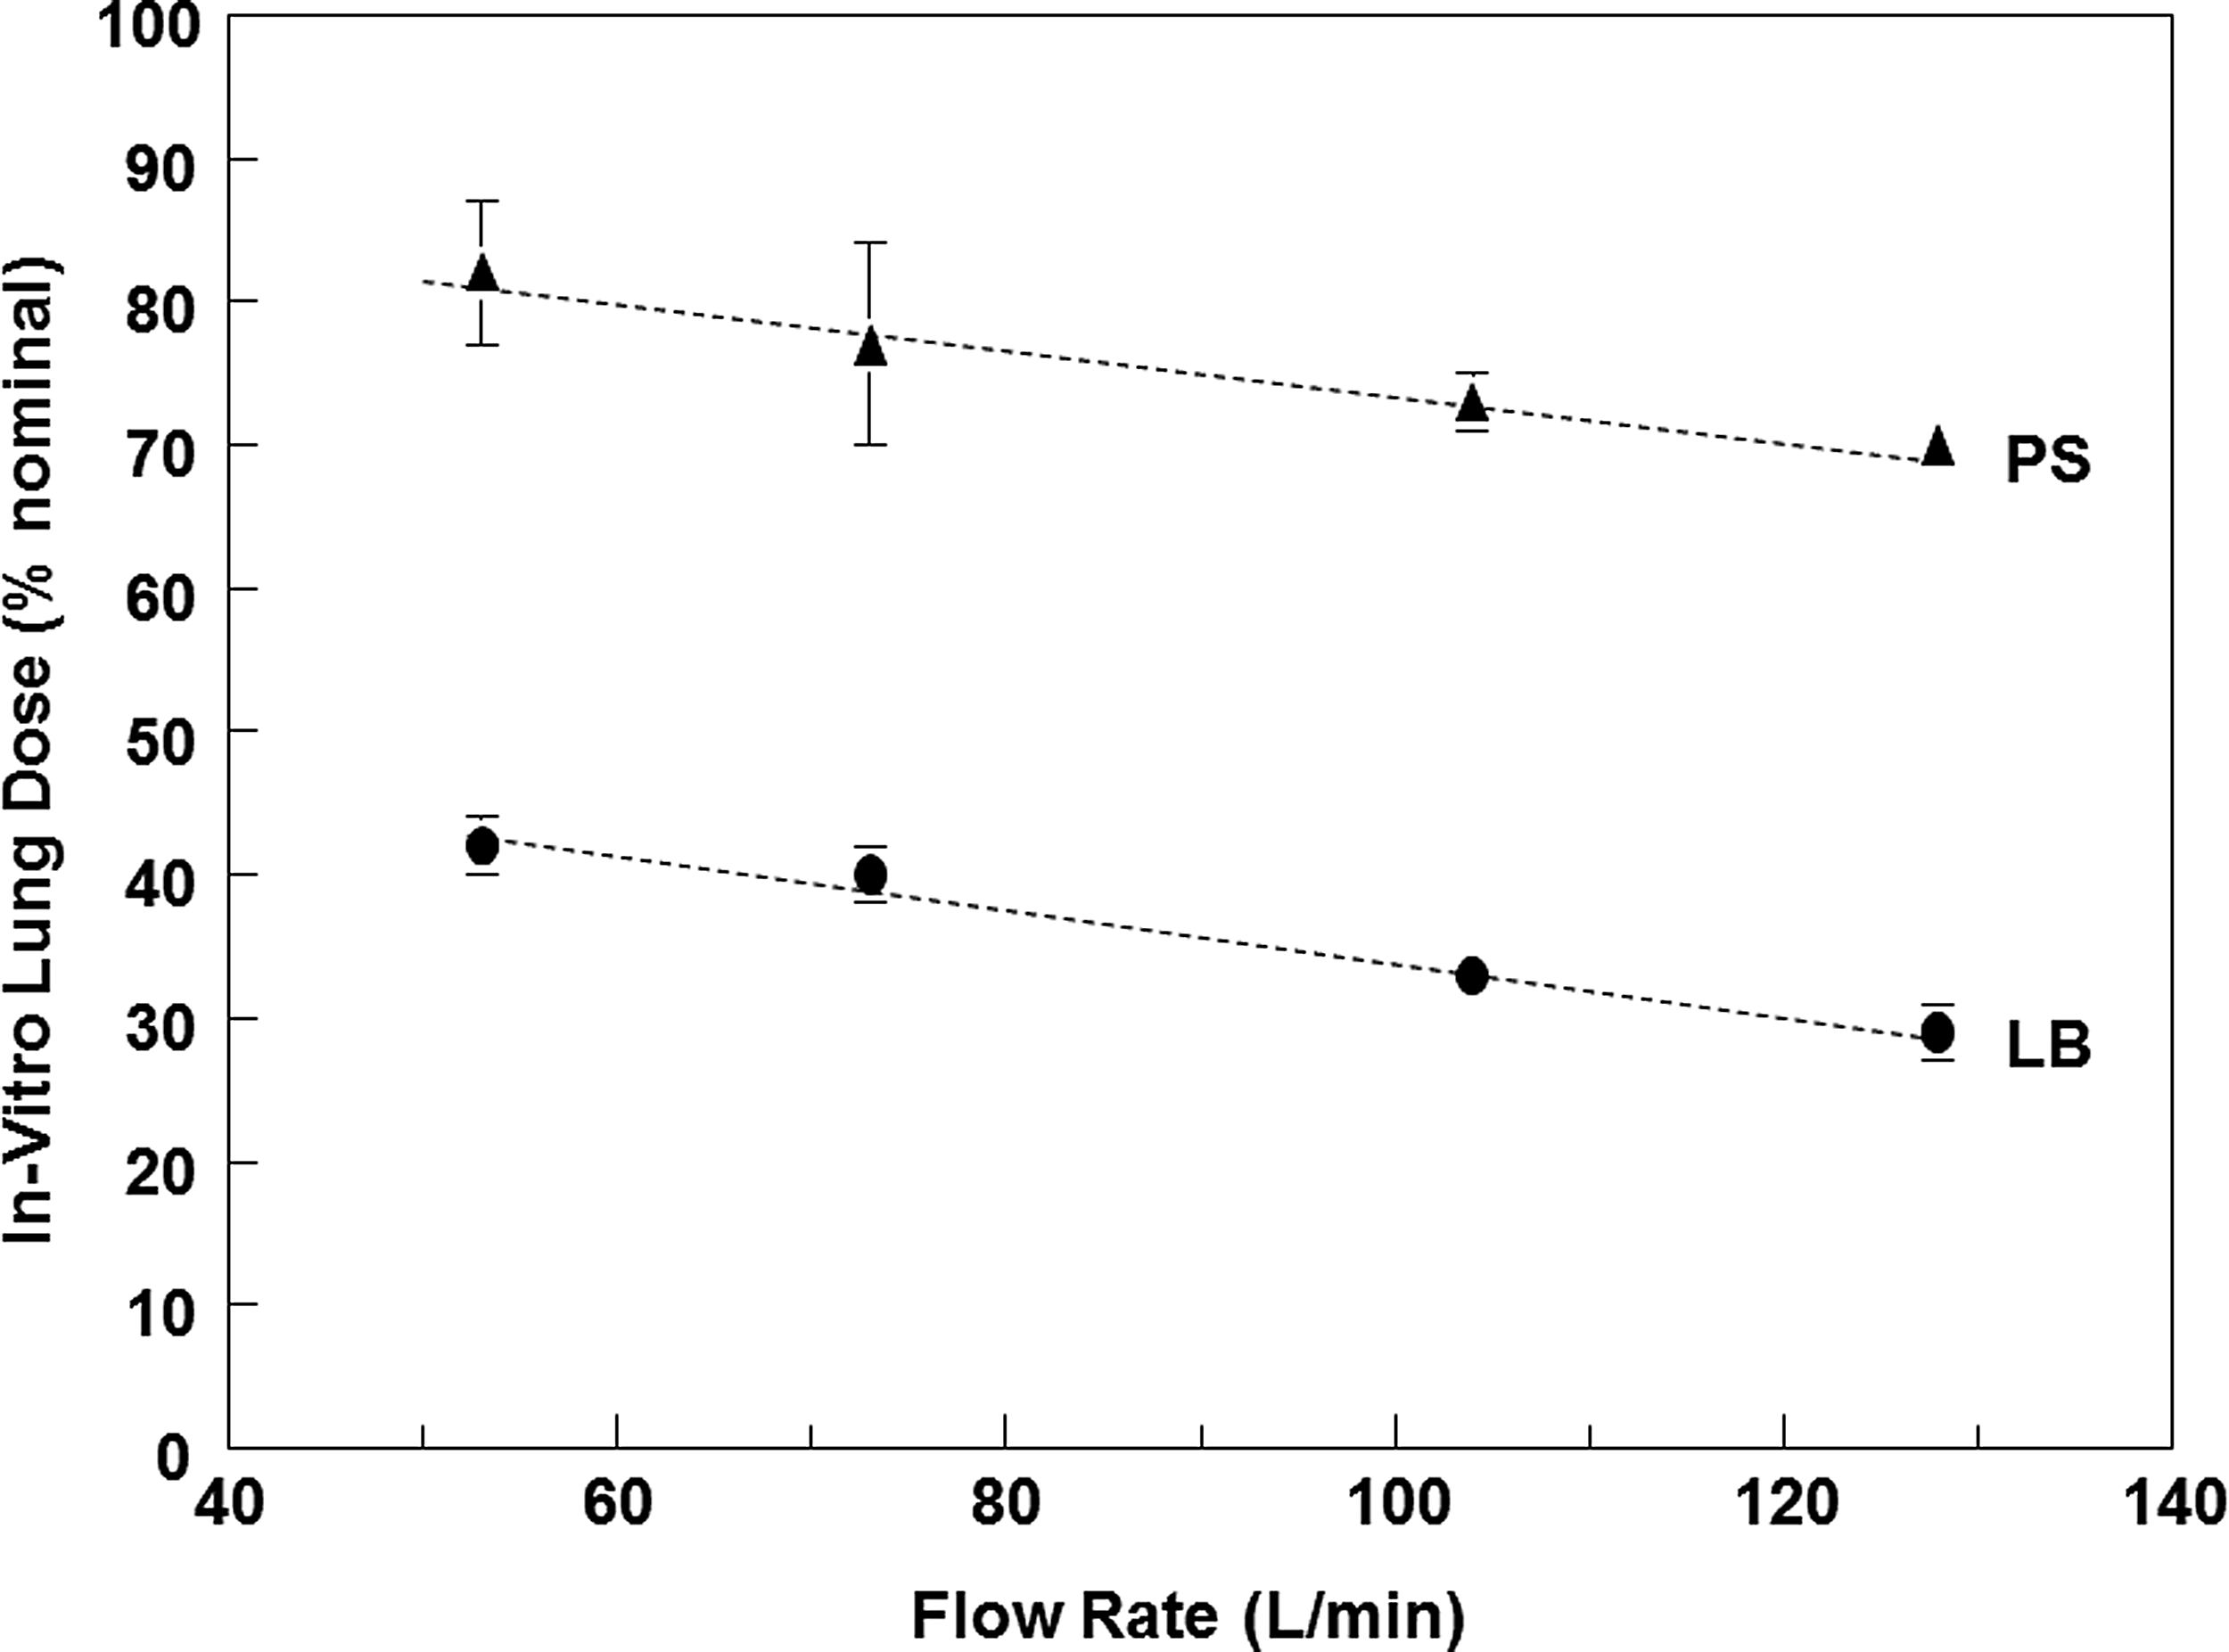
Mean total lung dose for indacaterol LB and indacaterol PS formulations following in vitro testing (n=5) in the Alberta idealized throat model described in detail previously.(24,25) Error bars are standard deviations. Tests used a square wave flow profile at various pressure drops (1, 2, 4, and 6 kPa) with a total volume of 2 L through the Breezhaler. The lines represent a linear regression of the measured datapoints.
Tests used a square wave flow profile with a total volume of 2 L.
For the indacaterol LB formulations, the delivered dose was approximately 79%–87% across the range of pressure drops tested. This is consistent with Pavkov et al., who found that the delivered dose varied from 78%–89% across pressure drops ranging from 1.2 to 4.9 kPa.(13) For the indacaterol PS formulations, the delivered dose was roughly 92%–95% from 2.0–6.0 kPa, decreasing to 84% at a 1.0 kPa pressure drop.
The in vitro TLD measured for the indacaterol PS powders was roughly twice that observed for the LB formulations across the range of flow rates tested (Fig. 2, Table 4). At the mean flow rate of 104 L min−1 utilized for IVIVCs (ΔP ∼4 kPa), the indacaterol dose post-throat was 33% for the LB and 73% for the PS formulation.
In a recent guidance for pulmonary specialists on respiratory therapies, Laube et al. suggested that each dry powder inhaler has a minimum threshold energy below which deagglomeration is inefficient, and drug delivery to the lungs is poor.(34) Below this threshold energy, it is believed that “the patient will receive no, or very little therapeutic effect from the drug.” It is clear from the data presented in Table 4 that even at flow rates as low as 53 L min−1 (ΔP=1.0 kPa), drug delivery to the lungs, as represented by the in vitro TLD, remained high. Given that nearly all COPD patients can achieve this flow rate through the Breezhaler,(13) it is likely that the minimum threshold energy for the Breezhaler lies below flow rates of practical significance. This is true for both LB and PS formulations.
For the indacaterol PS formulation, the in vitro TLD varied from the mean value at ∼4 kPa by +12% at 1 kPa, and by −4% at 6 kPa. Moreover, in the range from 2 kPa to 6 kPa, which represents the pressure drop achieved by the bulk of COPD patients (>95%), the in vitro TLD was ≥70%, varying by approximately 5% on either side of the mean flow rate. That is, drug delivery was largely independent of flow rate in the region of practical interest. The flow rate dependence for the LB was a bit higher owing to the lower TLD.
To explain the differences in in vitro TLD between the PS and LB formulations, it is instructive to compare their in vitro aerodynamic particle size distributions (APSD) obtained on a Next Generation Impactor (NGI). Figure 3 presents the APSD for indacaterol PS formulations (37.5 mcg and 75 mcg) and indacaterol LB formulations (75 mcg and 150 mcg) in the NGI operated at a flow rate of 60 L min−1 (ΔP=1.8 kPa). The dose proportional behavior of the LB and PS formulations discussed above was clearly evident in the impactor data. The measured APSD for the LB was bimodal, whereas the APSD for the PS formulation was monomodal. The large-sized mode observed in the LB is thought to be due to drug that remains adhered to the coarse lactose carrier particles during inhalation, and is then deposited in the USP throat and preseparator in the NGI. In contrast, the absence of carrier particles in the PS formulation and the fact that agglomerates of the low density particles are also respirable, may lead to low deposition in the USP throat and preseparator, and to a higher fine particle fraction. Interestingly, the normalized stage grouping for stages 3 to filter, representing the “respirable” portion of the aerosol with a size less than 4.5 μm, looks nearly identical in shape for the two types of formulations. Note that the ordinate scales for the two formulations differ. This reflects the roughly two-fold greater efficiency in drug delivery achieved with the PS formulation, as evidenced also in the AIT data. Hence, the differences in lung delivery efficiency for PS vs. LB may be due primarily to the elimination of the fraction of particles that deposit in the USP throat and pre-separator, and not to significant differences in the aerodynamic particle size distribution of the respirable drug particles. That is, the improvements in delivery efficiency may not necessarily impact regional deposition for the two formulations within the lungs.
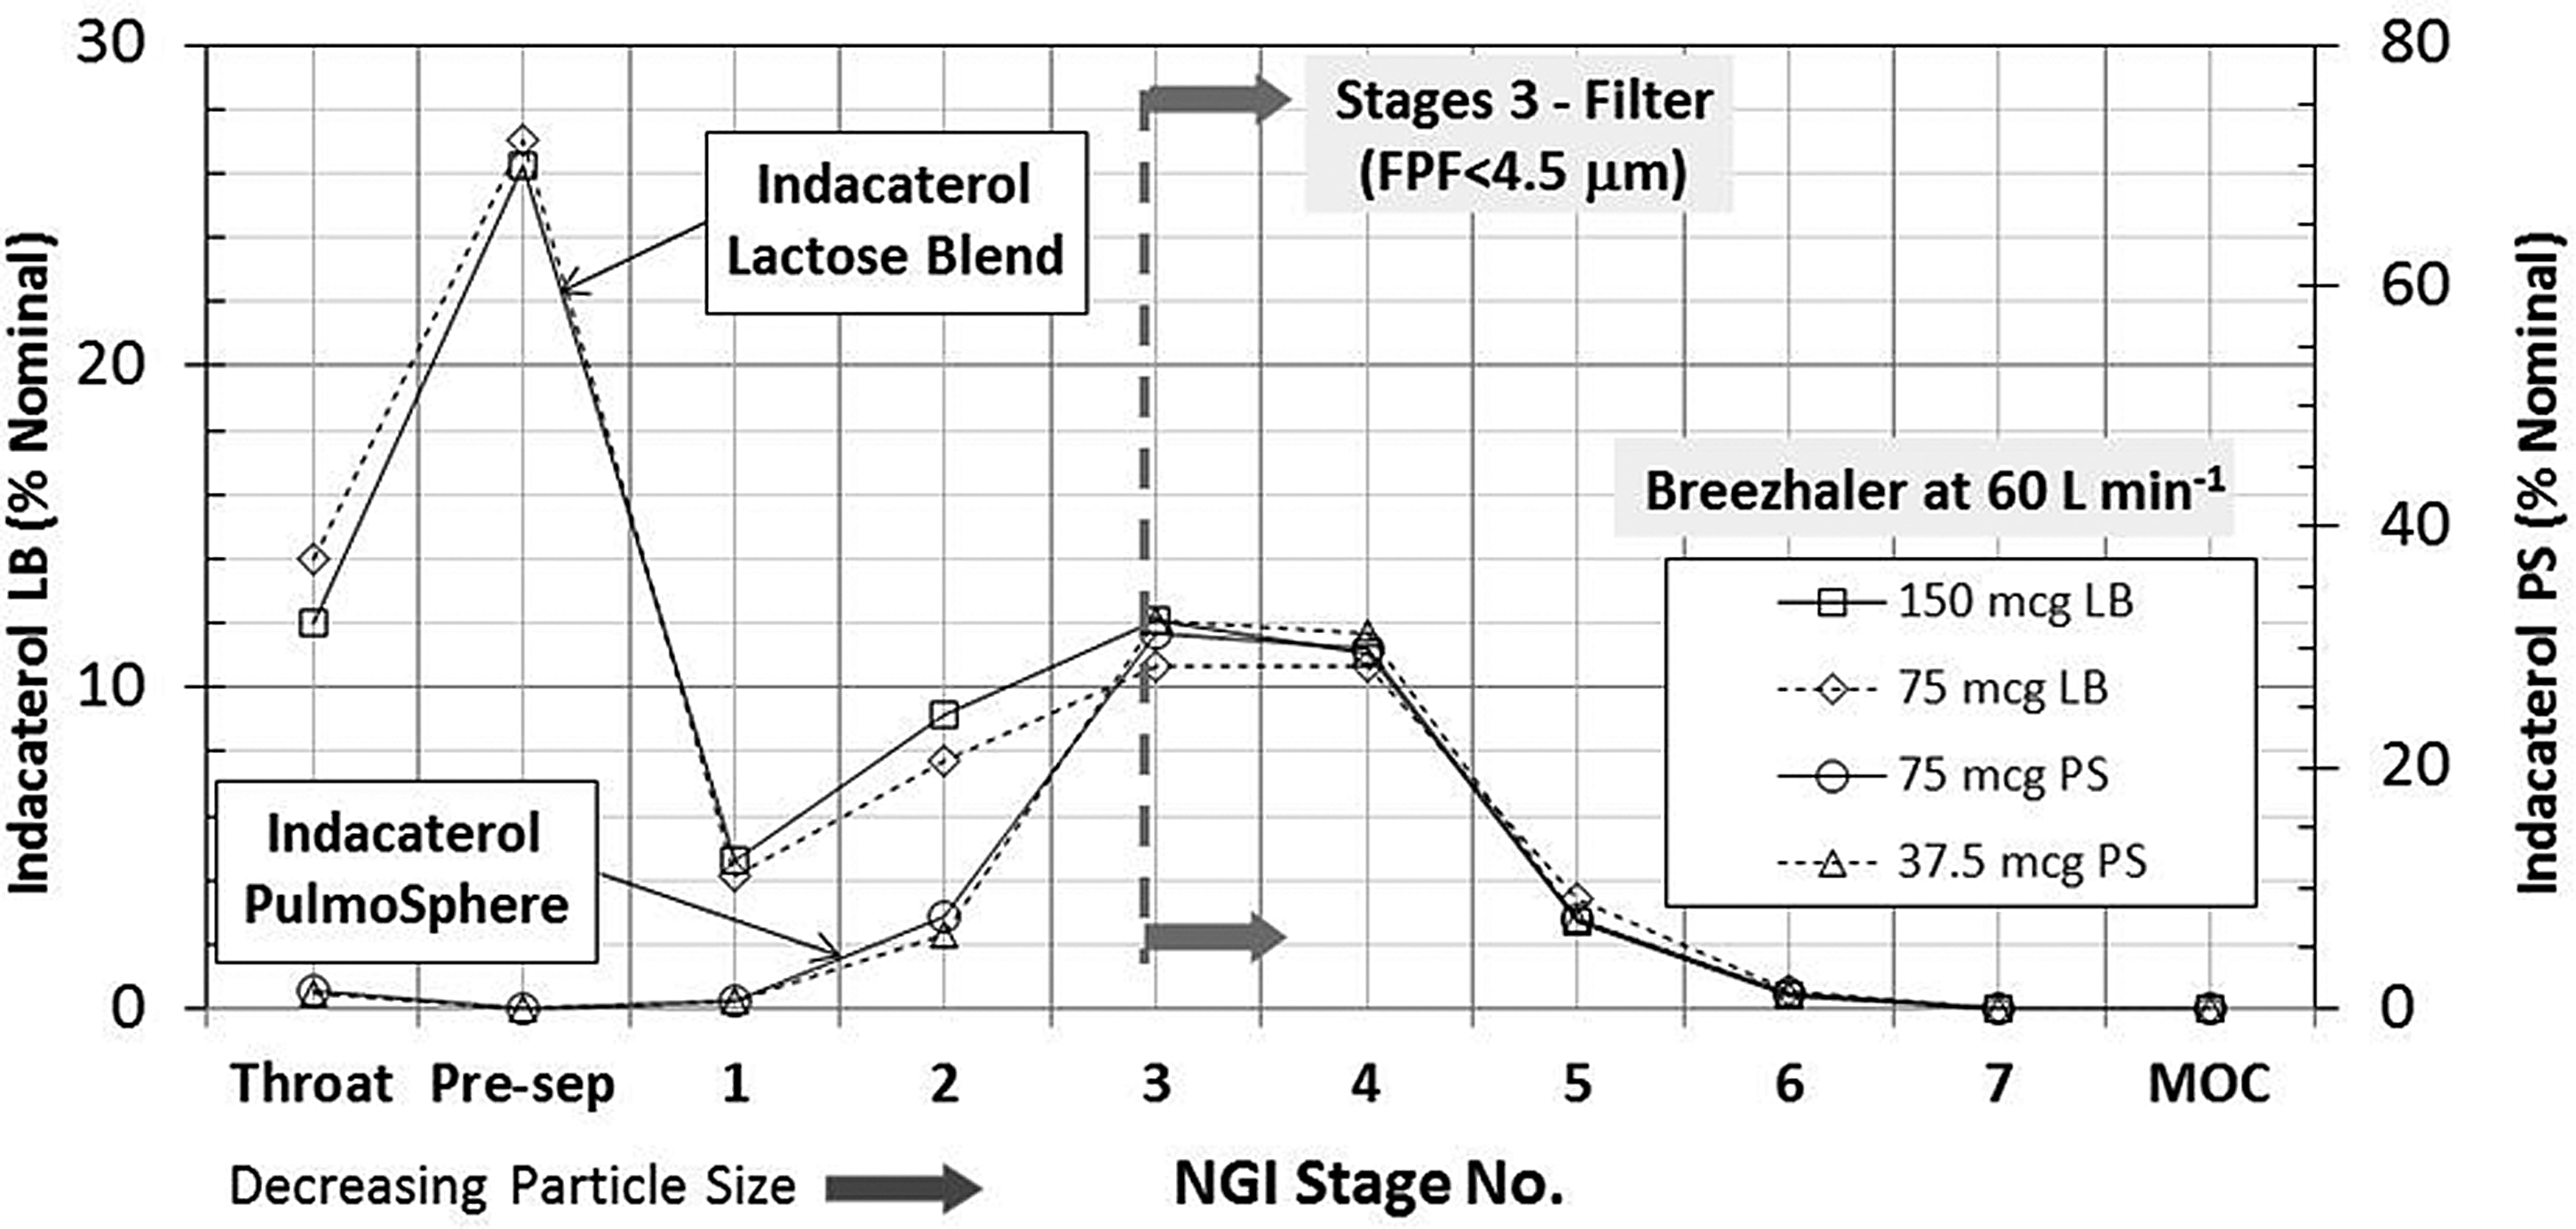
Comparison of the aerodynamic particle size distributions for indacaterol LB versus indacaterol PS formulations. For the indacaterol LB formulations, a square wave profile with a flow rate was 60 L min−1 and a total volume of 4 L was utilized (n=3 for 150 mcg nominal dose, and n=5 for 75 mcg nominal dose). For the indacaterol LB formulations, a square wave profile with a flow rate was 60 L min−1 and a total volume of 2 L was utilized (n=3 for 37.5 mcg and 75 mcg nominal doses). The lines connecting the points are arbitrary, to aid in data comparison. The plot is normalized for the fine particle fraction less than 4.5 μm. As such, the ordinates for the two formulations utilize different scales owing to the improved lung targeting observed for the PS formulation.
IVIVC for Study 2
The in vitro systemic exposure ratio for indacaterol PS formulations relative to an indacaterol LB formulation obtained in the AIT was compared with the in vivo systemic exposure ratios measured in asthma patients (Table 5). The pharmacokinetic data are plotted in Figure 4.
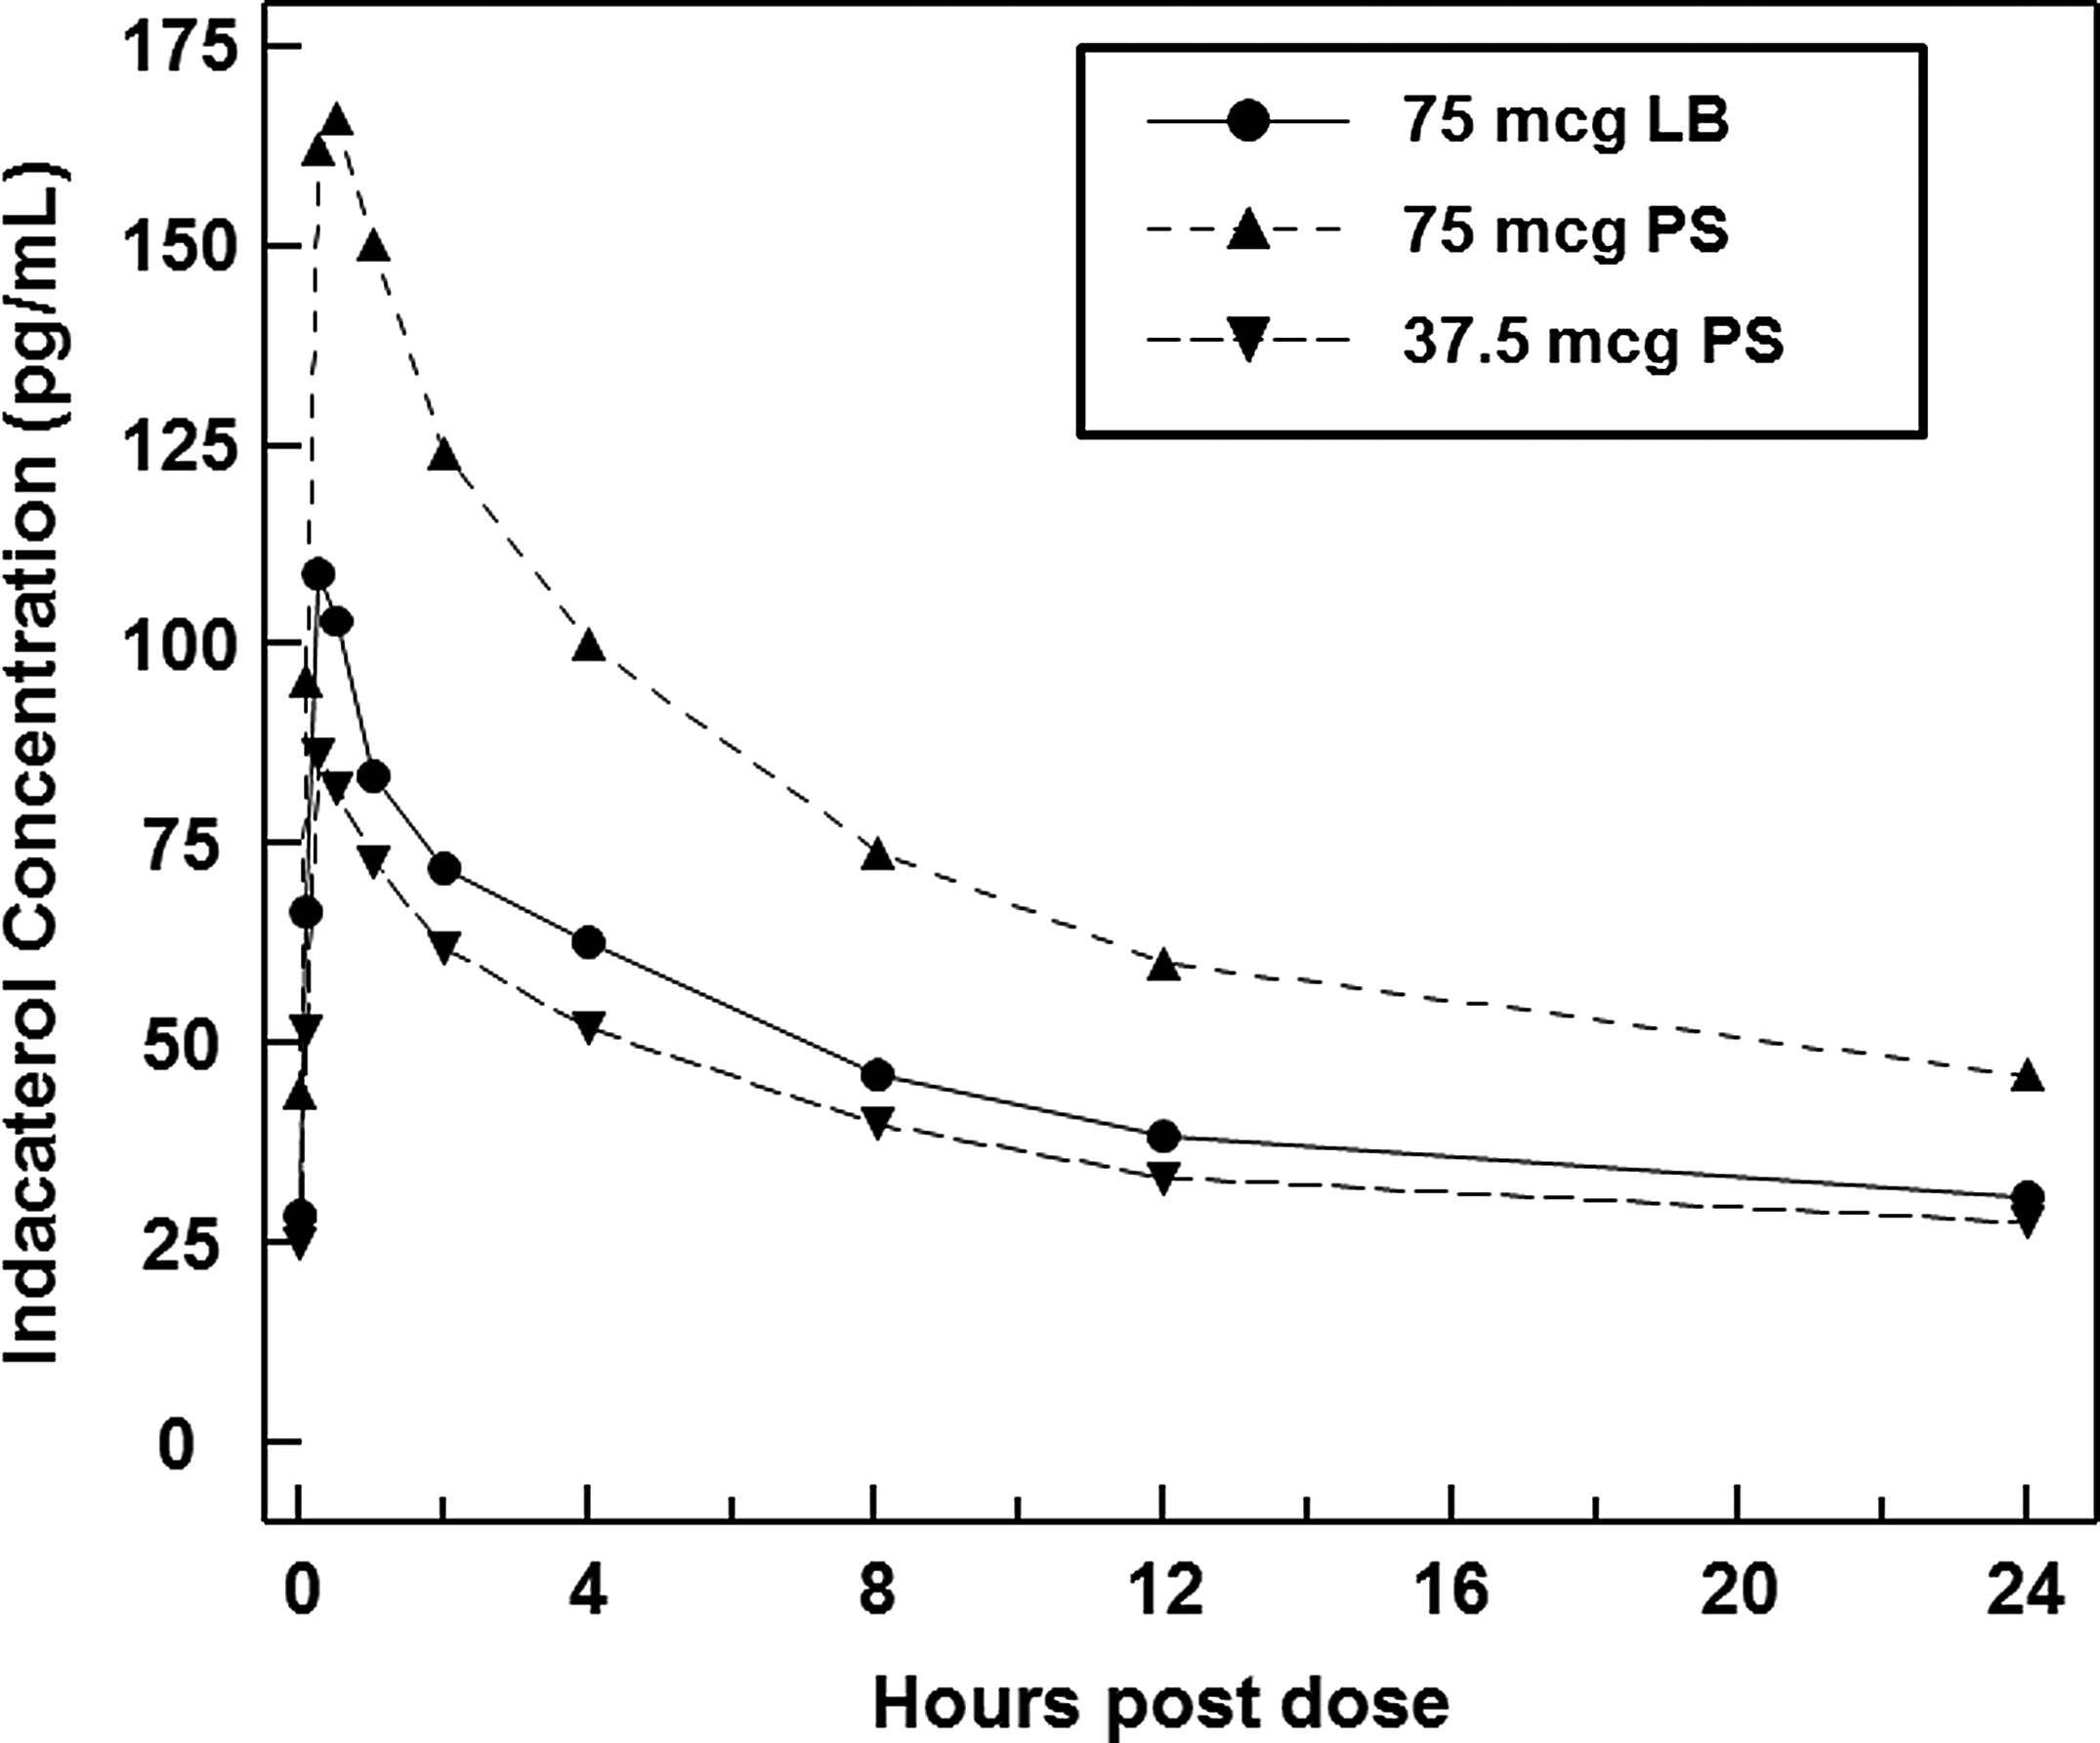
Comparison of mean serum concentrations of indacaterol as a function of time following inhalation of various indacaterol formulations in asthma patients (Study 2).
In vitro total lung dose for indacaterol LB and indacaterol PS formulations in the Alberta idealized throat model were obtained using a square wave flow profile at a flow rate of 104 L min−1, and a total volume of 2 L (n=5).
Dose proportional increases in AUClast and Cmax were observed in the pharmacokinetic data for the indacaterol PS formulations, with the values approximately twice as high for the 75 mcg dose in comparison with the 37.5 mcg dose. This is consistent with the dose proportional behavior observed in vitro. The total systemic exposure for the 75 mcg PS dose was significantly higher than the 75 mcg LB formulation and the 37.5 mcg PS formulation. This is due to the approximately two-fold greater lung delivery achieved with the PS formulation.
Results from the AIT model predicted an increase in systemic exposure for the PS formulation of 1.70-fold relative to the LB at an equivalent dose (Table 5). This is in close agreement (within 6%) with the exposure ratio determined in vivo (AUClast (PS)/AUClast (LB)) for the 75 mcg PS and LB doses at Day 1, where a point estimate of 1.61 with a 90% confidence interval of (1.47,1.76) was obtained. Close agreement (within 5%) was also noted for the 75 mcg LB and 37.5 mcg PS formulations as well, where the in vitro exposure ratio was 0.85, and the in vivo value was 0.89, with a 90% confidence interval of (0.81,0.97). Good agreement (within 5%) was also observed in terms of Cmax, where the corresponding ratios were 1.72 and 0.89 for the 75 mcg and 37.5 mcg PS doses, respectively.
The in vitro data predict that the total systemic exposure will be ∼15% less for a PS formulation as compared to a LB formulation when the total lung doses are comparable. This reflects the improved lung targeting (i.e., decreased contribution of oral absorption to systemic exposure) anticipated for the PS formulation. Overall, the observed in vivo pharmacokinetic data are consistent with the in vitro prediction of two-fold improvements in total lung deposition for the PS formulation relative to the LB.
Study 2 also explored the clinical efficacy of the two formulations. Due to the inherent variability in the measurement of FEV1 relative to the magnitude of improvements in lung function achieved with bronchodilators, accurate characterization of the dose response for indacaterol is challenging. The dose response curve for indacaterol in persistent asthma patients was assessed in a double-blind, double-dummy, placebo and active controlled dose ranging study in 511 patients.(35) The least squares (LS) mean trough FEV1 treatment related difference relative to placebo at day 15 for the 75 mcg dose was 0.17 L. Treatment differences versus placebo were similar for the 150 mcg dose, and the salmeterol control. Smaller differences in pharmacodynamics response were observed for the 18.75 mcg and 37.5 mcg doses (LS mean=0.09 L and 0.11 L, respectively), suggesting that the knee in the dose response curve for indacaterol LB in asthma patients occurs at a nominal dose of approximately 75 mcg or higher.(35) Below the 75 mcg dose, bronchodilator efficacy varies with dose (i.e., the steep part of the sigmoidal dose response curve), and above this dose bronchodilator efficacy may begin to plateau.
In the present study, all active (indacaterol PS and indacaterol LB) treatments significantly increased mean trough FEV1 over placebo on Day 8 (Table 6). Both indacaterol PS doses (37.5 mcg and 75 mcg) resulted in similar improvements in trough FEV1 (0.16 L and 0.19 L, respectively) compared to indacaterol LB 75 mcg (0.20 L)—all absolute differences on Day 8 were small and not statistically significant. Similar improvements were also noted in secondary endpoints (e.g., trough FEV1 at day 2, FEV1 AUC (0–4 h), FEV1 AUC (0–12 h)), for indacaterol PS and indacaterol LB treatments. These results are consistent with the in vitro results, which suggest that a similar TLD of indacaterol can be obtained with the PS formulation at half the dose. Nonetheless, the large variability in FEV1 measurements and the small sample size in this study make drawing definitive conclusions regarding clinical efficacy impossible.
Presented are the adjusted least squares (LS) mean values with the corresponding standard errors (SE), and difference in adjusted LS means and 90% confidence intervals (CI).
IVIVC for Study 3
The IVIVC in
In vitro total lung dose for indacaterol LB and indacaterol PS formulations in the Alberta idealized throat model were obtained using a square wave flow profile at a flow rate of 104 L min−1, and a total volume of 2 L (n=5).
Estimates for in vitro systemic delivery and
Estimates of in vivo lung and systemic drug concentrations calculated using the dose normalized IV data from study 1 (Table 1).
The differences between the in vitro and in vivo measurements in
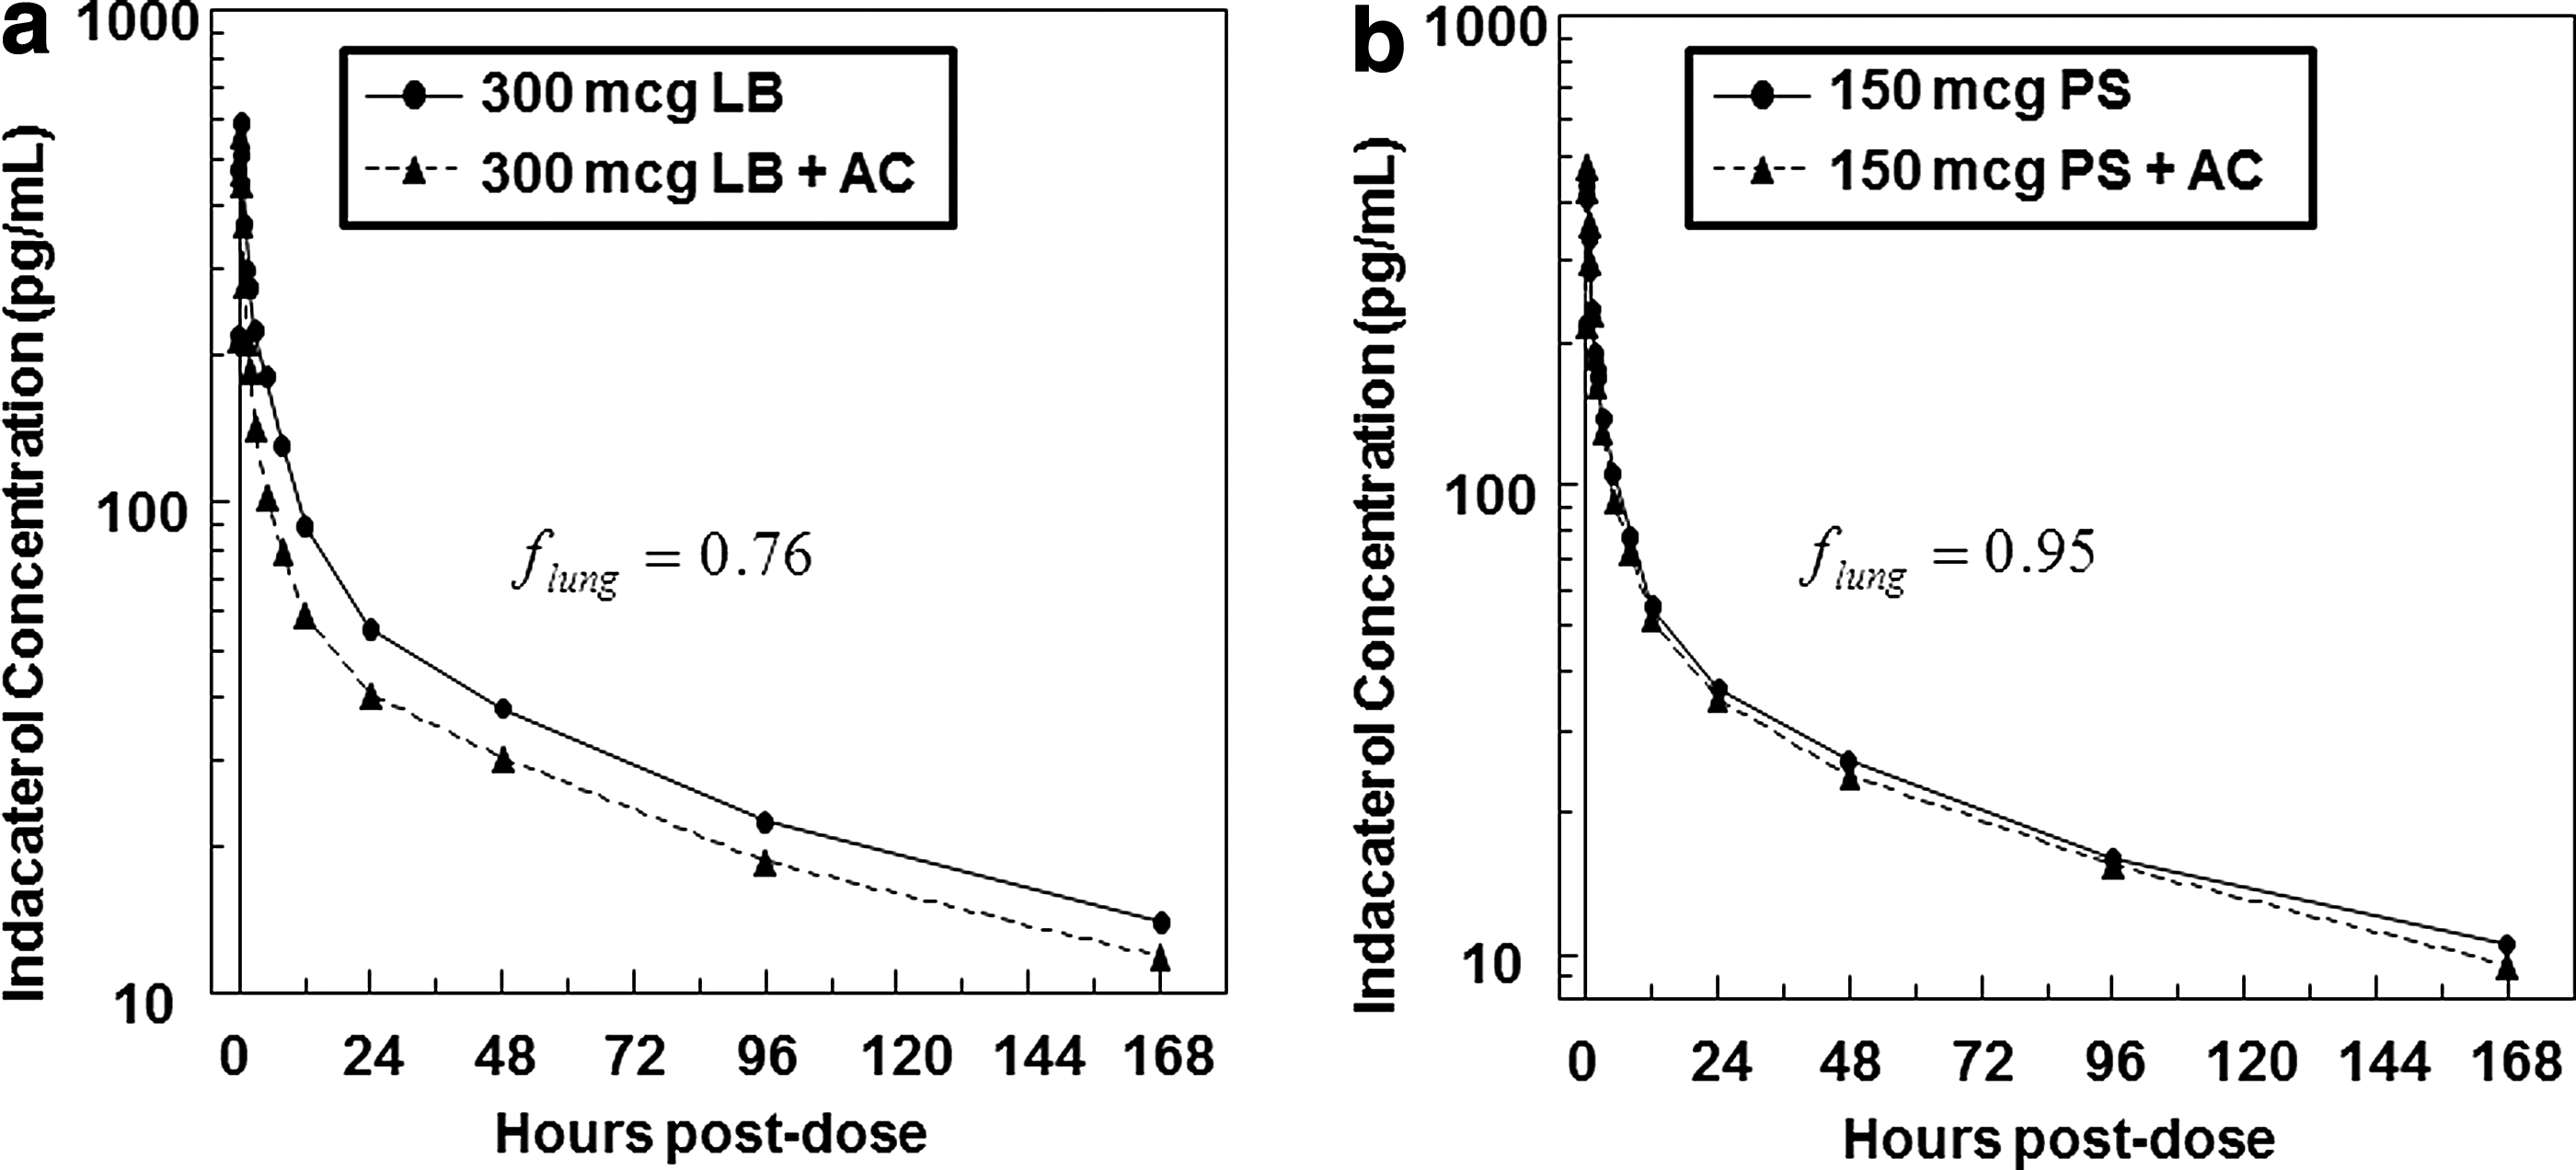
Comparison of mean serum concentrations of indacaterol as a function of time following inhalation with and without activated charcoal, AC in healthy volunteers (Study 3). Panel
In vivo estimates of lung and systemic delivery were made for Study 3 using the IV data collected for healthy subjects in Study 1. The point estimate of total lung deposition for the indacaterol LB in Study 2 was 0.38. This is just outside the 90% confidence interval of (0.30, 0.37) measured in Study 1, and represents a +12% increase in mean TLD compared to Study 1, and +15% relative to the in vitro prediction in the AIT. In contrast, the point estimate for total lung deposition for the corresponding PS formulation in vivo in Study 2 was 65%, a bit lower (-11%) than the in vitro prediction of the AIT. As a result, the ratio in TLD for the PS formulation relative to the LB was decreased to ∼1.7. The decreased ratio in TLD pushes the measurement of the bioequivalence of the two formulations, based on the standard 80–125% criteria for bioequivalence, to the edge of acceptability (Table 8). Here, the ratio of the adjusted geometric mean values for various pharmacokinetic parameters for the test PS formulation (150 mcg) and the reference LB product (300 mcg) are presented. To pass the bioequivalence guideline the 90% confidence interval must be within 80%–125%. Only the AUC0-24 parameter meets the criteria.
Co-formulation effects in fixed dose combinations comprising indacaterol and glycopyrronium
The formulation of fixed dose combinations (FDC) of two or more therapeutics in an ordered mixture can be challenging, as the adhesion of one drug to the carrier may impact the subsequent adhesion of the second drug, leading to aerosol performance for the mono products which differ from the performance in the combination.(36) These are often referred to as “co-formulation effects.”
IVIVC for Study 4
In the case of fixed dose combinations of indacaterol and glycopyrronium, a force control agent (i.e., magnesium stearate) is added to enable control of the cohesive-adhesive energy balance between the three components in the FDC formulation.(37,38) This leads to an increase in dispersibility for the indacaterol component from the carrier relative to the mono indacaterol drug product, necessitating a decrease in indacaterol nominal dose from 150 mcg to 110 mcg in the combination product. Addition of magnesium stearate increased total lung deposition from 35% w/w for the mono indacaterol LB formulation (absent force control agent), to 44% w/w in the FDC. For glycopyrronium, in vitro measures of total lung deposition were 50% w/w and 48% w/w for the mono and FDC formulations, respectively. It should be noted that in the case of glycopyrronium, the force control agent is present in both the mono and combo formulations. As such, these results indicate that the presence of indacaterol in the formulation has little impact on the aerosol performance of glycopyrronium.
Table 9 compares the predicted combo/mono systemic exposure ratios obtained for indacaterol and glycopyrronium in the AIT, with the combo/mono exposure ratios measured in vivo. For indacaterol, identical combo/mono exposure ratios were obtained in vitro and in vivo. For glycopyrronium, the mono and combo formulations had comparable systemic delivery in the AIT. The measured in vivo data showed slightly higher absorption for the combo formulation, leading to a difference between the in vitro and in vivo measurements of about 8%.
In vitro total lung dose for mono and combo formulations of indacaterol and glycopyrronium formulations in the Alberta idealized throat model were obtained using a square wave flow profile at a flow rate of 90 L min−1, and a total volume of 4 L (n=5).
Discussion
IVIVC established with a single point AIT model
In the present study, a single flow rate and a single anatomical throat model for an average adult subject were sufficient to predict in vivo systemic exposure in four clinical studies. The in vitro exposure predictions were within 15% of the in vivo measurement, with most predictions within 5%. While in some cases it may be necessary to mimic complete breath profiles when measuring aerosol leaving the AIT, our experience with capsule-based DPIs like Breezhaler has been that PIF is the major driver of aerosol performance. This means that total lung dose measurements can usefully be compared by use of a single representative flow rate through AIT; the correlations presented in the manuscript support the statement.
The recent findings demonstating a lack of IVIVC between the Rotahaler® and Diskus® for the delivery of fixed dose combinations of salmeterol xinafoate and fluticasone propionate are almost certainly due to in vitro testing that fails to utilize realistic throat models, and the effects of transient breath profiles on the different inhaler platforms.(39)
Realistic throat models provide several advantages relative to standard NGI methods for assessing total lung deposition. The test set-up is simpler, requires less analytical resource, and enables the use of simulated patient flow profiles, if desired. In this regard, there is no need to worry about selecting a flow rate for which the stage cutoffs of impactors are calibrated. Nor does one have to be concerned with the fact that a patient's flow rate varies throughout the inhalation profile. The data are easy to interpret and translate, enabling rapid assessment of the impact of flow rate, ramp rate, inhaled volume, changes in formulation, or changes in device design on total lung delivery.(40–42) The AIT is an excellent tool to aid in the design of clinical studies, including combination rule studies and bioequivalence studies.(42)
With that said, the good IVIVC established for anatomical throats is somewhat fortuitous, given the small number of subjects that are typically used to establish the in vivo TLD in PK and scintigraphy studies. This can be especially problematic for drug products with low TLD and high between patient variability. It the present study, different investigations with the same LB formulation of indacaterol resulted in significant differences in the mean value for TLD in healthy volunteers (34% vs. 38%). Ultimately, these differences contributed to difficulties in establishing bioequivalence between LB and PS formulations based on the predictions of the AIT model (Table 9). Hence, it is important that researchers be mindful of how in vivo variability may impact the use of these models to inform dose selection for bioequivalence studies.
It is worth noting that comparing the ratio of AUCs obtained by in vivo pharmacokinetic studies (as done in Study 2) does not provide a unique solution in terms of predicting total lung deposition. This is due to the contribution of oral absorption to total systemic exposure. The issue can be overcome by using a charcoal block to eliminate oral absorption as was done in studies 1 and 3. If the pharmacokinetics of the molecule under investigation are linear with dose, as indicated for indacaterol in Study 2, then the ratio of the AUC for the PS formulation to the AUC for the LB formulation is given by:
where D is the delivered dose, L is the lung dose, and
For Study 2, where the AUC ratio was 1.61, this reduces to:
Conclusions
The Alberta idealized throat model with realistic in vivo flow rates was utilized to predict in vivo systemic exposure for dry powder formulations of indacaterol maleate. Good in vitro–in vivo correlations were observed (absolute differences <15%) with respect to total lung deposition, total systemic exposure, and the contribution of gastrointestinal absorption to total systemic delivery for various formulations. Anatomical throat models can be used as a tool to aid formulation development of pharmaceutical aerosols.
Footnotes
Acknowledgments
The authors wish to thank the following for their contributions to generating the data used in establishing the in vitro–in vivo correlations presented in this article: J Beier, S Biswal, M Brown, N Devaraj, J Le, D Singh, B Sridhar, and J Vemula.
Author Disclosure Statement
All authors are full-time employees of Novartis. No conflicts of interest exist.