
Abstract
Abstract
Background:
A previous PET-CT imaging study of 14 bronchoconstricted asthmatic subjects showed that peripheral aerosol deposition was highly variable among subjects and lobes. The aim of this work was to identify and quantify factors responsible for this variability.
Methods:
A theoretical framework was formulated to integrate four factors affecting aerosol deposition: differences in ventilation, in how air vs. aerosol distribute at each bifurcation, in the fraction of aerosol escaping feeding airways, and in the fraction of aerosol reaching the periphery that is exhaled. These factors were quantified in 12 of the subjects using PET-CT measurements of relative specific deposition sD*, relative specific ventilation sV* (measured with dynamic PET or estimated as change in expansion between two static HRCTs), average lobar expansion FVOL, and breathing frequency measured during aerosol inhalation fN.
Results:
The fraction of the variance of sD* explained by sV* (0.38), by bifurcation effects (0.38), and by differences in deposition along feeding airways (0.31) were similar in magnitude. We could not directly estimate the contribution of aerosol that was exhaled. Differences in expansion did not explain any fraction of the variability in sD* among lobes. The dependence of sD* on sV* was high in subjects breathing with low fN, but weakened among those breathing faster. Finally, sD*/sV* showed positive dependence on FVOL among low fN subjects, while the dependence was negative among high fN subjects.
Conclusion:
The theoretical framework allowed us to analyze experimentally measured aerosol deposition imaging data. When considering bronchoconstricted asthmatic subjects, a dynamic measurement of ventilation is required to evaluate its effect on aerosol transport. The mechanisms behind the identified effects of fN and FVOL on aerosol deposition need further study and may have important implications for aerosol therapy in subjects with heterogeneous ventilation.
Introduction
T
Given what is known about aerosol deposition, it is likely that most of the variability in peripheral aerosol deposition among lobes, sublobes, or any set of peripheral lung regions, can be attributed to four distinct factors: 1) differences in regional ventilation,(1,4,5) 2) differences in how the aerosol and air distribute between branches in the series of bifurcations along the pathway feeding the region,(5) 3) variability in the amount of the aerosol that escapes the series of airways along that pathway,(6,7) and 4) variability in the amount of aerosol that reaches the periphery and deposits (i.e., is not exhaled).(8) Each of these mechanisms is described in greater detail below.
Because the aerosol particles are carried by airflow through the airway tree, heterogeneity in regional ventilation can generate heterogeneity in peripheral deposition.(9) When diseased regions are less ventilated than the rest of the lung, delivery of inhaled aerosol therapy may be reduced to areas where it may be most needed. For example, bronchoconstricted subjects with asthma might expect to receive lower local doses of inhaled bronchodilator or anti-inflammatory agents in ventilation defective regions. In the present work we compare the regional distribution of aerosol deposition among lobes against the corresponding distributions of ventilation estimated with two methods: one from the washout of a gas tracer during breathing as imaged with dynamic PET-CT, and the other inferred from the relative changes in volume between two lung inflation conditions as measured from static HRCT scans.
Heterogeneity in peripheral aerosol deposition may also occur due to differences in the concentration of aerosol reaching the periphery, even in lungs with uniform ventilation.(9) These concentration differences may develop by two distinct factors. One factor emerges at bifurcations when air and aerosol divide between daughter branches in unequal fractions. This may occur when aerosol entering the bifurcation is not well mixed within the cross section of the parent branch,(5) or when the inertia of the aerosol particles prevents them from following the airflow in sharp turns.
The second factor influencing the concentration of aerosol reaching peripheral regions is the fraction of aerosol that deposits along the airways that feed them. Deposition within these airways, generally by inertial impaction, reduces the concentration of aerosol reaching the periphery. The extent of the deposition within airways can vary depending on local variations in air speed, velocity profiles, and airway tree morphometry.(6,7,10)
In certain circumstances, not all of the aerosol escaping the central airways deposits in the periphery; small particles can remain in suspension and are exhaled.(8,11) When the fraction that is retained is similar among all regions of the lung, this effects the deposition but does not introduce heterogeneity. However, differences among regions in peripheral retention can lead to heterogeneity and are thus considered as a fourth source of variable peripheral deposition among regions.
In this article, we integrate these four factors into a theoretical framework that describes the processes of transport and deposition of an inhaled aerosol along the airway tree to the periphery. Using this framework we evaluate the influence of each factor based on PET-CT imaging data of lung anatomy, aerosol deposition, and ventilation in bronchoconstricted asthmatic patients. The unique ensemble of PET deposition and ventilation images along with the detailed morphology derived from multiple HRCT images3 presented here allows this information to be evaluated for the first time. The theoretical framework yields lobar indices of the sources of variability that can be used to validate the clinical applicability of patient-specific numerical models of aerosol deposition.
Nomenclature
Methods
We begin by introducing a general theoretical framework that describes deposition in terms of four distinct parameters that can vary among lobes. Subsequently, we describe the imaging protocol and the means of evaluating these parameters in a group of bronchoconstricted asthmatic subjects.
Theoretical framework
Overview
In this section we define a general framework that may be used to isolate sources of variable deposition among lobes, or any other region of the lung periphery that is subtended by a unique airway. We begin by defining appropriate measures of deposition and ventilation that are not sensitive to differences in volume among lobes, and introduce the notions of retention fraction and aerosol concentration. We identify two factors that can influence the concentration along each airway and identify the net contribution of each factor to differences in aerosol deposition among lobes. We then collect all sources of variability into a single expression that describes lobar deposition in Equation (6). To better compare these sources of variability across different subjects, we account for differences in overall dosing, lung size, centrality of deposition, and restate the expression in nondimensional, normalized form in Equation (9). After several simplifications, we decouple the sources of variability in Equation (15).
Lobar measures of deposition and ventilation
Deposition beyond the subsegmental airways within a lobe can be characterized by a specific deposition sDsl, where the subscript s indicates the subject studied and the subscript l indicates the lobe (or any other lung region). In this article, regions beyond the subsegmental airways are referred to as peripheral regions, while more proximal regions are referred to as central airways. sDsl is defined as the aerosol deposition with a lobe's periphery normalized by the total volume of the lobe measured at the mean lung volume during the subjects' tidal breathing (MLV). The specific deposition allows for meaningful comparisons between lobes of different volumes.
The ventilation of a lobe or lung region is similarly characterized by its regional specific ventilation
Retention fraction and aerosol concentration
The retention fraction η
x
of a location x along the airways is the fraction of the total aerosol that passes that location during inhalation that deposits. When ventilation data is acquired in conjunction with the deposition data, the concentration Cx of aerosol in the inhaled air can be evaluated at any location x along the airway tree. This is the average concentration along the cross section during inhalation of the aerosol, and is the ratio of aerosol to air volume that passed that location. The aerosol that passed the location is found by dividing the total deposition that deposited distal to that location Dx with the retention fraction of that location η
x
(to account for exhaled aerosol that did not deposit). For a cumulative volume of air Vx passing location x during inhalation:
Note the units of the concentration will be aerosol per unit volume of air. The aerosol itself can be described in terms of mass, volume, or number of particles.
Individual airway branching factors and escape fractions
When the airflow and the aerosol entering into a bifurcation split differently between daughter branches, the aerosol concentration entering a daughter the kth airway Cairway k, ent. is no longer equal to the aerosol concentration leaving the parent airway Cparent k,exit. We can therefore define a Branching Factor Bk for an airway k as:
Thus a value of Bk≠1 quantifies a change in aerosol concentration between mother and daughter airways (Fig. 1).

Concentration changes at a bifurcation and along an airway k are characterized by two transitions: Bk captures the change in concentration at the inlet of the airway, and Ek captures the change in concentration along an airway.
A second factor affecting the concentrations is the aerosol deposition along airways; as aerosol deposits along an airway wall, the concentration of aerosol in suspension is reduced.(6) The concentration of the aerosol leaving an airway, Cairway k, exit, and that entering it, Cairway k, ent. (Fig. 1), can be used to define an escape fraction, EK, as the ratio of these concentrations:
Note that because the volume of air entering and exiting an airway is identical, the escape fraction can be determined without knowing the ventilation. By combining Equations (2) and (3), it can be shown that the product of Bk and Ek is the ratio of Cairway k, exit to Cparent k, exit :
Net branching factors and net escape fractions
The path between the carina and the periphery of each lobe includes a series of bifurcations and airways that partition and trap the aerosol. For a lobe of a subject we can calculate the ratio of average aerosol concentrations between that leaving the subsegmental airways of that lobe Csl to that entering the tracheal carina Ccarina,s. Thus, for a set of airways ψsl leading to a specific lobe of given subject the net escape fraction can be written in terms of the product of branching factor and escape fractions:
Note that the product
Expressing specific deposition in terms of sources of variability
The lobar specific deposition of aerosol of subject s in lobe l is therefore:
The term
Rearranging into nondimensional form
A nondimensional form for Equation (6) can be used to compare data from subjects with different lung sizes who received different aerosol doses, different overall ventilation and deposition, and have different degrees of overall central deposition. It is also desirable to have the nondimensional variables vary about unity to simplify the analysis as is discussed below. Let us first describe the total aerosol passing a subject's carina D0,s as the sum of the deposited aerosol past the carina DT,s and the exhaled aerosol DE,s. DT,s itself can be expressed as the sum of the deposition in the periphery DP,s and that in central airways DC,s:
Using this we can expand the concentration at the carina using the definition of concentration given in Equation (1), rewritten in terms of the total deposition beyond the carina DT,s and the total average inspiratory flow through the carina
After substituting this relationship into Equation (6), a dimensionless form can be obtained by rearranging the terms and dividing by the total lung volume VL,s, and by DP,s/DT,s:
Here the dimensionless specific deposition and ventilation are:
These are the specific deposition of each lobe normalized by the specific deposition in the entire periphery of each subject
Note that the ventilation weighted average of
Finally, the retention fraction of each lobe has been normalized by the retention of the entire periphery of each subject
Decoupling sources of variability
Taking the log of Equation (9) transforms the product of effects into a sum of effects. Given that all the variables have been defined to vary about unity, we can further approximate the logarithm with the first order Taylor expansion of the logarithm about unity (log(x)≈x-1)), Equation (9) can then be approximated as:
In the specific case where these four effects are independent (i.e., there is weak covariance among the terms) we arrive at a decomposition of the variance in specific deposition in terms of the variance of the four factors that independently influence it. For the set S of all lobes among all subjects:
This final equation allows us to estimate the fraction of the variance that comes from each of the four factors. This equation states that the variability in relative specific deposition is approximately the sum of the variability in relative specific ventilation, the normalized net branching factor, the normalized net escape fraction and the normalized retention fraction.
Experimental methods
Overview
This section describes the imaging technique, and the method to extract the abovementioned parameters in a group of bronchoconstricted asthmatic subjects from PET-CT images of ventilation and aerosol deposition. The imaging protocol timeline is shown in Figure 2.
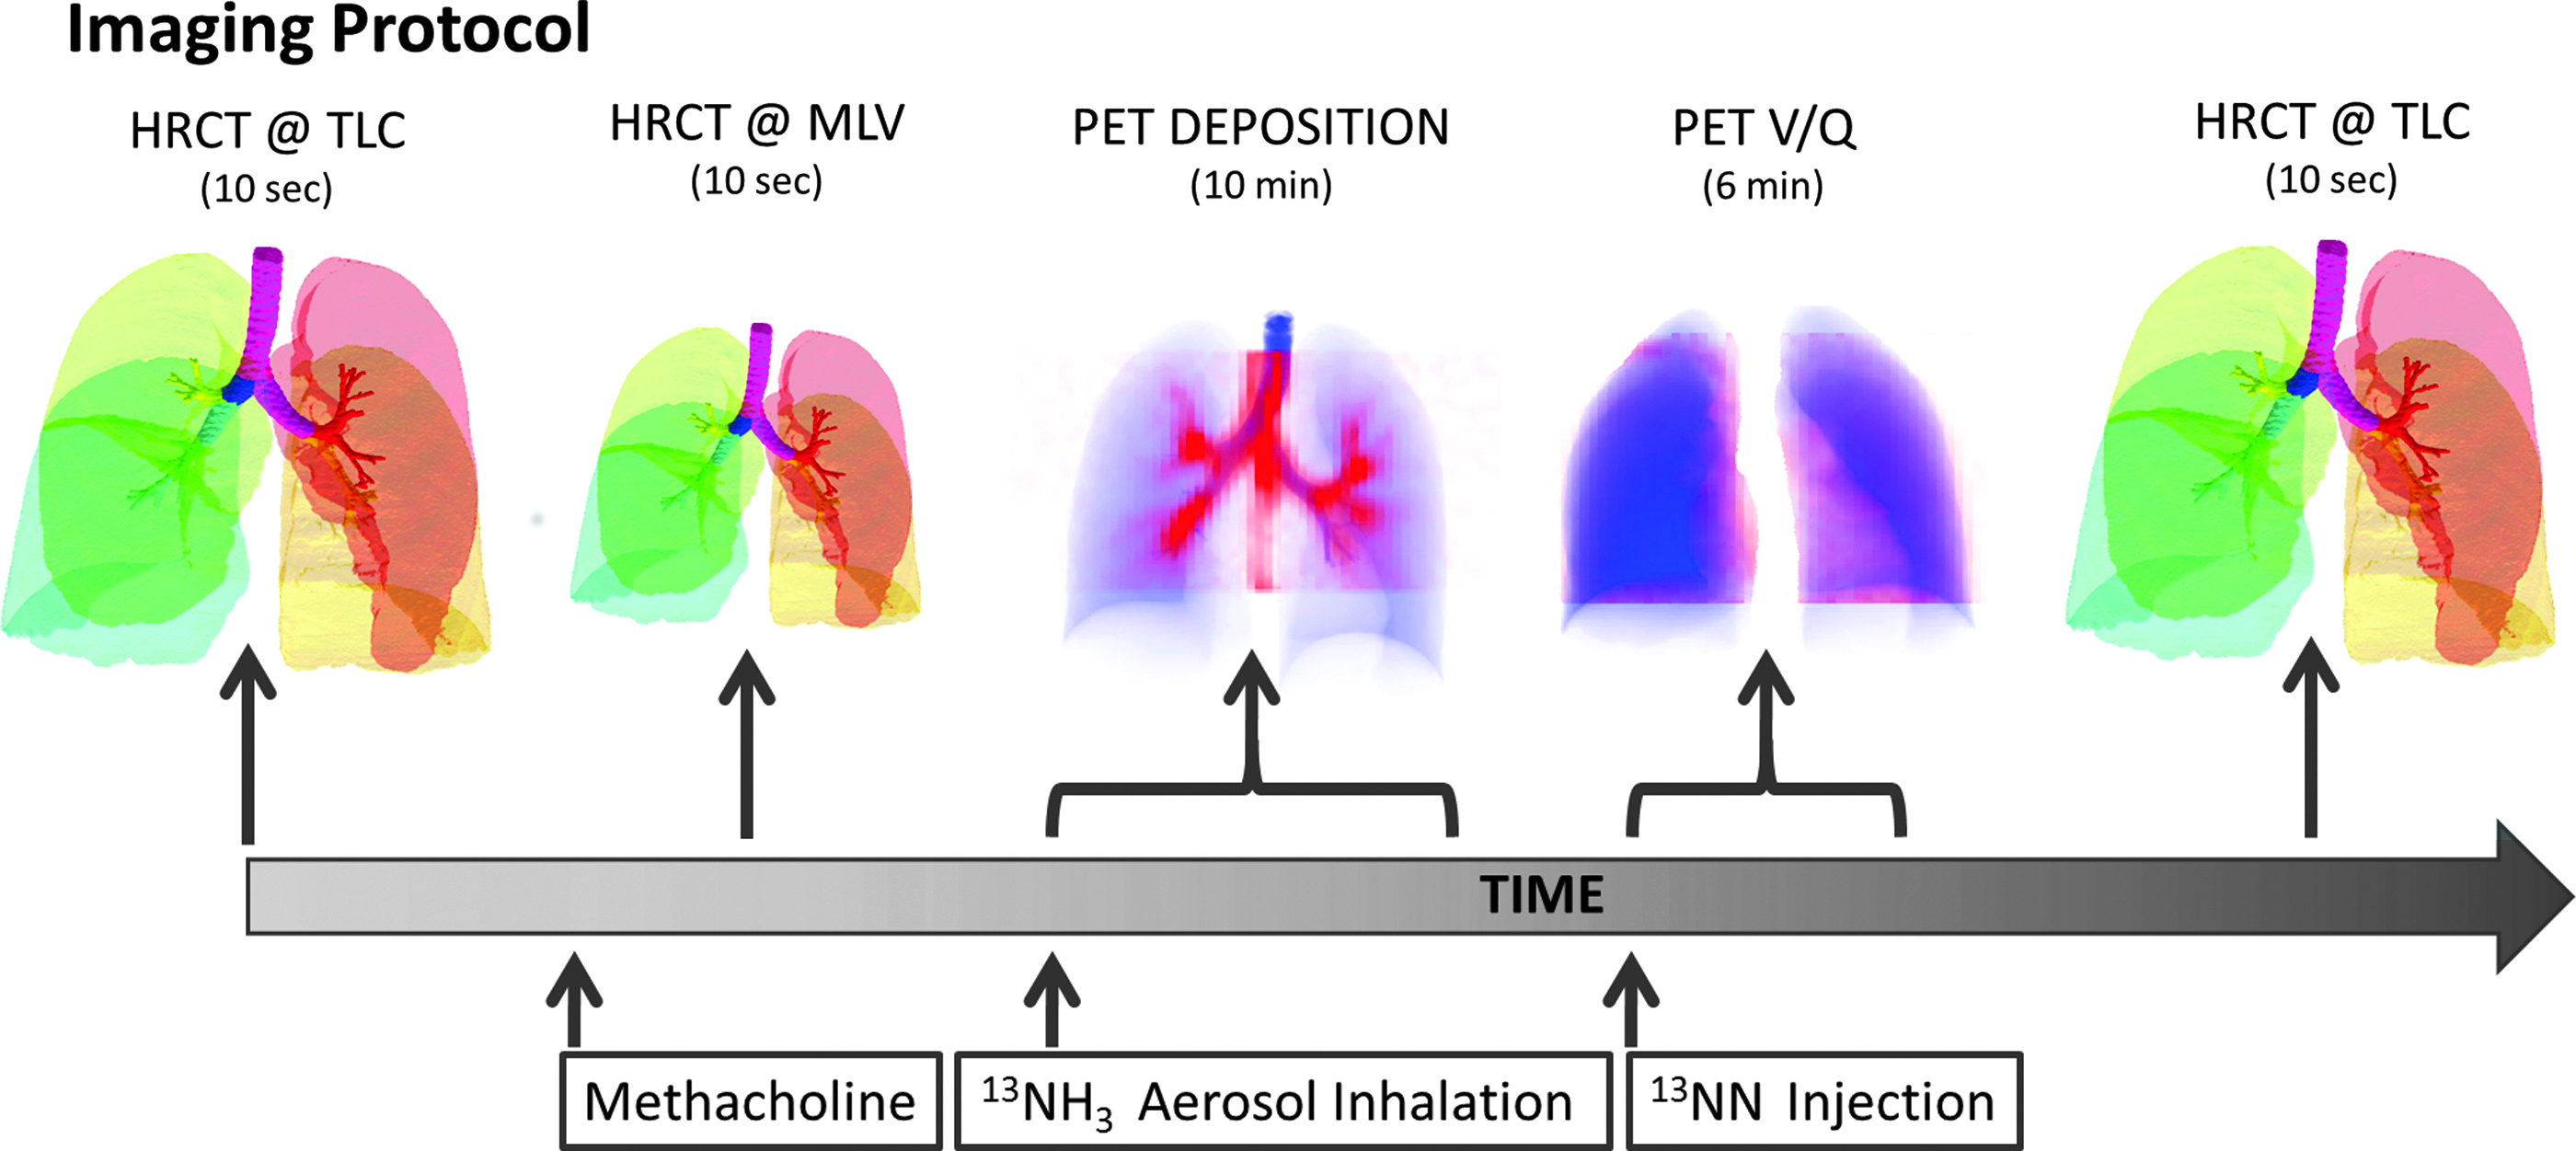
The imaging protocol sequence. Color images available online at www.liebertpub.com/jamp
Imaging protocol
The imaging protocol was completed at Massachusetts General Hospital with IRB approval (Application No. 2007P000493). Twelve asthmatic subjects were imaged with PET-CT (Biograph 64; Siemens AG). The subjects were young (average 20.1 years), predominantly female (3 male and 9 female) and not obese (BMI's less than 32 Kg/m2). All subjects had mild intermittent or mild persistent asthma as defined by the NIH Global Initiative for Asthma(12) with FEV1 and FVC≥80% predicted, fewer than daily symptoms, and peak flow or FEV1 variability of less than 30%. All subjects demonstrated reversible obstruction with inhaled albuterol (≥12% on previous spirometry).
During an initial screening visit the concentration of methacholine (MCh) required to cause a 20% drop in the subjects FEV1 (PC20) was estimated. On a second visit that same concentration was administered with five deep breaths of methacholine aerosolized by a DeVilbiss nebulizer and Rosenthal dosimeter (model 646, DeVilbiss Healthcare, Somerset, PA) with the subject in the supine position in the PET-CT camera. Three HRCT images were obtained during breath hold: one at total lung capacity (TLC) before bronchoconstriction, a second at mean lung volume (MLV) approximately 5 minutes after bronchoconstriction, and a final HRCT at TLC approximately 30 minutes after the MCh challenge.
To monitor lung volume and guide its value during imaging, a real time trace of instantaneous volume was obtained with an inductance plethysmograph (RIP) (SomnoStar PT, SensorMedics Corp, Yorba Linda, CA) and presented to the subject through video goggles. When imaging the lung at MLV with HRCT, the subject was instructed to stop breathing and hold his/her breath when the trace reached a line defining their MLV (previously determined during a 30 sec window of spontaneous breathing before the scan).
After the MLV HRCT image (16±5 min after the MCh challenge), an aerosol of 13NH3-labeled isotonic saline was generated with a vibrating mesh nebulizer (Aeroneb Solo, Aerogen, Galway, Ireland) and delivered via an Idehaler holding chamber (Aerodrug, Cedex, France) into the mouthpiece through which the subject was breathing while wearing a nose clip. The aerosol reaching the mouthpiece was previously characterized by laser diffraction as having an approximately lognormal distribution with a median aerosol diameter of 4.9 μm and a geometric standard deviation of 1.8 (4.9 μm VMD with a GSD of 1.8). This indicates that approximately 95% of the aerosol volume was between 1.5 and 15 μm.(13) While the subjects were supine in the PET-CT camera, intrapulmonary aerosol deposition was imaged with dynamic PET during the 2-min period of inhalation and the following 8 min of spontaneous breathing.
After the end of the deposition image collection (30±5 min post MCh) regional specific ventilation was assessed during a V/Q scan from the washout of a bolus of 13NN gas as described in detail elsewhere.(14) Briefly, during a V/Q scan nitrogen (13N-N) in saline solution was injected intravenously as a bolus during apnea. The poorly soluble radioactive nitrogen gas diffuses from the plasma to the alveolar airspace resulting in an intrapulmonary tracer distribution proportional to that of regional pulmonary blood flow. Following a 20 sec breath hold, the subject resumes breathing and the washout of the tracer is used to determine regional specific ventilation.
It was important to conduct the ventilation measurement as close as possible to that of deposition to minimize changes in the degree of constriction. The close proximity (15±2 min) between the deposition and ventilation images meant that there was some residual labeled aerosol that was registered as 13NN gas in the washout image. This residual activity was very small compared to the activity coming from the 13NN (<4%) and similar among lobes, and thus weakly affects
In 9 of the 12 subjects with ventilation images, we were also able to estimate the breathing frequency during aerosol inhalation from the RIP signal; the data from the first three subjects were recorded on an older laptop, and the signals could not be recovered.
Evaluating deposition and ventilation from the images
The PET images were analyzed to quantify the anatomical location of the aerosol deposition and the alveolar ventilation. The local tracer from the deposition images was assigned to anatomical regions (ARs) using the Grayscale method previously developed.(3) This technique allowed quantification of aerosol deposition within anatomically defined portions of the central airway tree (CA) and on distal regions fed by them, after accounting for blurring of the PET image due to breathing motion, limited spatial resolution of PET, and PET-CT co-registration uncertainties. Using Apollo™ software (Vida Diagnostics, Mountain View, CA) the lung was segmented into 14 ARs, including 5 peripheral lobar regions and 9 segments of the airway tree (Fig. 3). The lung periphery included the five lobes; left upper lobe (LUL), left lower lobe (LLL), right upper lobe (RUL), right middle lobe (RML), and right lower lobe (RLL). Central airways included the bronchus intermedius (BINT), the right and left main bronchus (RMB and LMB) and the trachea (TRC), as well as five lobar central airway trees feeding each lobe that included the lobar, segmental, and subsegmental airways.

Rendering of the 14 anatomically consistent regions (ARs) used in this study. The lobar central airways are color matched to the lobes that they feed. The 16 cm PET field of view and the typical placement of the PET image are shown with the rectangle. The PET field of view typically covers 83±8% of the lung volume, with 4±3% missing from the apex, and 13±7% missing from the base. Color images available online at www.liebertpub.com/jamp
The distribution of deposition throughout the lung and airways was described as the relative specific deposition
The relative distribution of ventilation during aerosol inhalation was assumed to be equal to that measured during the subsequent 13NN washout during the V/Q scan. Voxel by voxel ventilation was estimated from the best model chosen by the Akaike Information Criterion(14) among a two-compartment model, a one compartment model, a partial gas trapping model, and a full gas trapping model. Net alveolar ventilation for each lobe was estimated as the sum of voxel products of compartment's turnover rate times its gas volume. The gas volume in each compartment within a voxel was estimated by the gas content of the voxel (measured from the CT scan at MLV) multiplied by the fraction of perfusion of the voxel that was delivered to that compartment. The voxel by voxel estimates were then distributed among lobes based on how each lobe contributed to the activity in that voxel.(3) The total ventilation of the lobe is divided by the lobe volume to identify the specific ventilation
Estimating specific inflation from 2 HRCTs
An alternative estimate of lobar ventilation distribution, similar to one used in previous studies,(15,16) uses the change in lobar volume between two static HRCT scans from MLV to TLC as a proxy for the ventilation during tidal breathing. The specific inflation
where the V terms are the different total lung volumes post constriction and Ksl is a number close to 1 that corrects for lobar segmentation differences of the lobe between the two images. Under the assumption that differences in the tissue volume of a perfectly segmented lobe should not differ between the two images, and that changes in blood volume can be estimated from the entire lung, Ksl can be expressed in terms of the blood and tissue volumes VTissue of the lobes and lungs:
A dimensionless form for
Estimating lobar retention fractions
Lobar retention fractions could not be directly estimated from our data, nor were there values in the literature that could be directly used. However, based on global lung bolus retention data presented by Kim et al.,(8) we could estimate a global retention fraction of the periphery
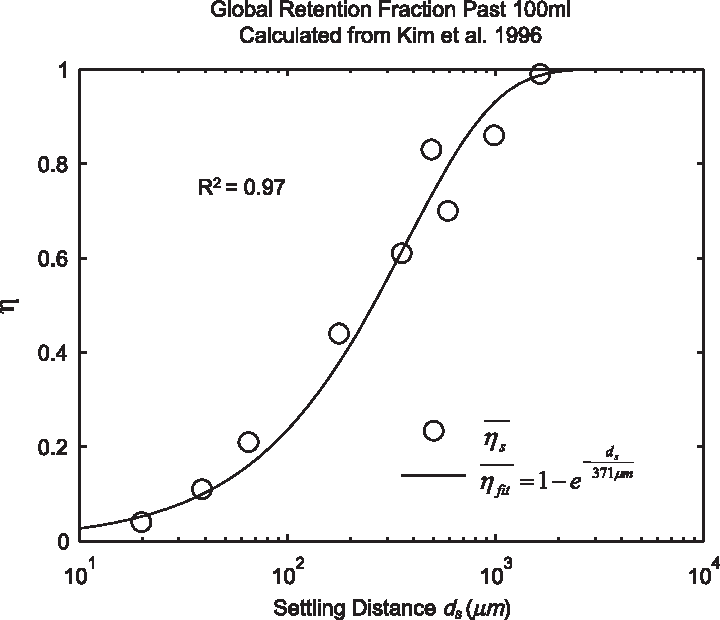
The global retention fraction estimated from the sequential bolus data presented in Kim et al.(8) versus the settling distance.
Evaluating

Estimates of the global retention in the lobar periphery for the polydisperse aerosols used in this study. The different lines describe different extents of proximal filtering of the larger sized aerosols; ‘No Filter’ assumes that the aerosol distribution entering the periphery is identical to the distribution at the mouth, while the filtered estimates assume that all particles above the filter size have already been deposited in the upper airways.
While this population averaged and lung averaged data can provide a useful estimate of the degree of average retention among all lobes, lobar retention fractions may vary substantially between subjects and lobes. For example, expanded lobes may have reduced η
sl
due to both the longer sedimentation distances and lower likelihood of impaction in the distended airways. The expansion of a lobe FVOL,sl can be defined as the total volume of gas Vgas per unit of tissue and blood volume VTissue in a lobe at MLV:
Note that FVOL,sl is a measure of the degree of regional expansion during a breath hold at MLV and is not directly related to regional tidal volume. Assessment of both fN and FVOL,sl may provide insight into retention fraction effects.
Apparent net branching factor and escape fraction
The net branching factor
Note that
In this article we will present the apparent parameters as a proxy for the actual factors, noting that they differ from the actual factors by the
The apparent branching factors can be evaluated from PET-CT deposition and ventilation images for the first four bifurcations in the airway tree (Fig. 6) by setting ηx as unity throughout the airway tree. The apparent escape fractions can be similarly calculated up to the lobar central airways. Due to the limited spatial resolution of PET, proximal airways within each lobe, up to the subsegmental airways, had to be lumped into a single compartment with an average lobar escape fraction.

The four bifurcations in which the changes in concentration between the parent and daughter can be evaluated using PET-CT. These bifurcations are at the terminal ends of 1) the trachea, 2) the left main bronchus, 3) the right main bronchus, and 4) the bronchus intermedius. Color images available online at www.liebertpub.com/jamp
Statistical analysis
Systematic Differences Among Lobes in
Results
Typical deposition pattern
PET-CT measurement of the aerosol deposition showed a highly centralized pattern of deposition in the present data set, with 33±6% of the aerosol entering the carina depositing in the airways up to and including the subsegmental generation. The maximum intensity projections for a typical subject are presented in Figure 7.

Maximum intensity projection of the highly central deposition pattern (red) of one typical subject in the current data. The green region is the PET field of view for this subject. Color images available online at www.liebertpub.com/jamp
Relationship between sD* and sV*
A global correlation between lobar ventilation and deposition for the group of subjects was found by pooling the non-dimensional results for all lobes of all subjects (Fig. 9, left). The distribution of
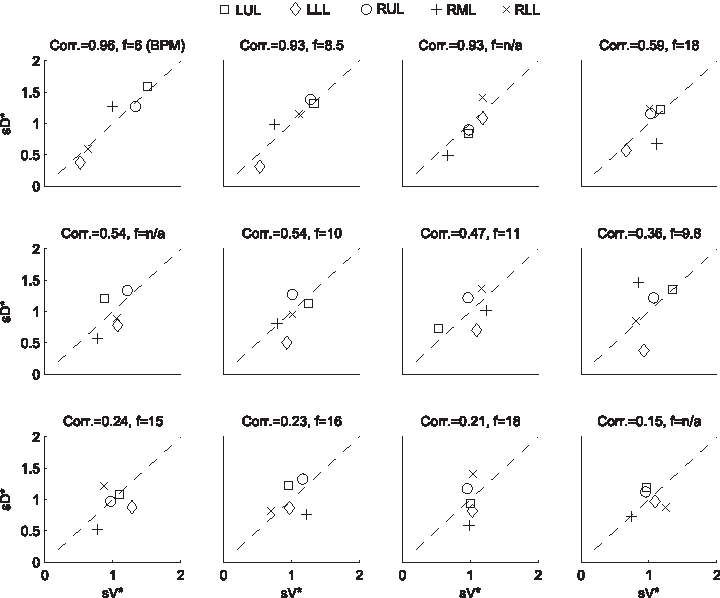
Subject-by-subject specific deposition vs. specific ventilation, organized by strength of the correlation. The breathing frequency during nebulization in breaths per minute is also shown in each figure caption.
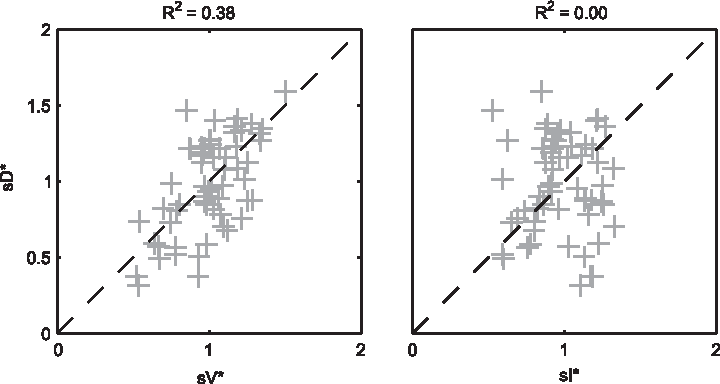
sD* vs. sV* (left) and sD* vs. sI* (right) for all lobes of all subjects. The square of the Pearson correlation coefficient is shown above each plot.
Relationship between sD* and sI*
We further compared the distribution of
Relationship between sV* and sI*
We found no correlation between
Sources of variability in sD*
There was high variability in
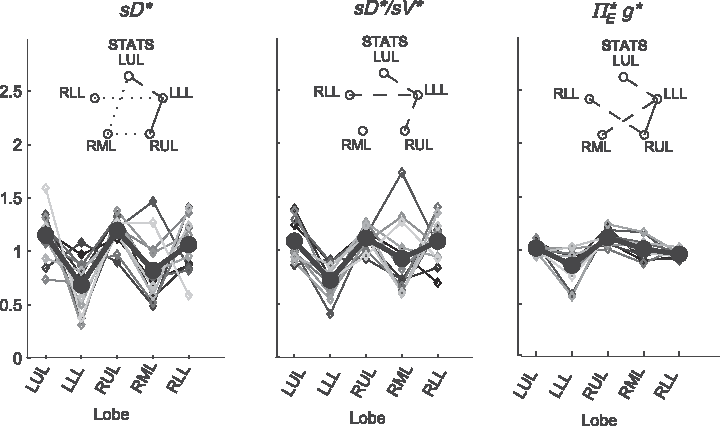
Variation among lobes as sources of variance are accounted for. Lobar values for each subject are connected with thin lines, and the thick solid line connects average values. Left: relative specific deposition sD*, Center: relative deposition per unit of relative ventilation (sD*/sV*), Right: the apparent escape fraction. Statistically significant differences between any two lobes are depicted as a line connecting the lobes in the inset above each plot (solid is p<0.001, dashed is p<0.01, and dotted is p<0.05). The absence of a line indicates that no statistically significant differences were evident.
The contribution of each of the three factors to the variability in specific deposition was characterized using the Pearson Correlation Coefficient squared among the specific deposition and measurements of its influencing factors. The contribution of these three factors to the average variability in
A relationship among fN, FVOL, and sD*/sV*
The inter-subject variability in sD*/sV* for each lobe was frequency dependent for the LLL, RLL, and RML. In Figure 11 the plots for each lobe have been ordered from left to right based on the relative degree of lobar expansion at MLV. Note the least expanded lobes (the LLL and RLL) tended to increase deposition per unit ventilation with increasing breathing frequency, while the opposite was true for the RML: the most expanded lobe of the lung.
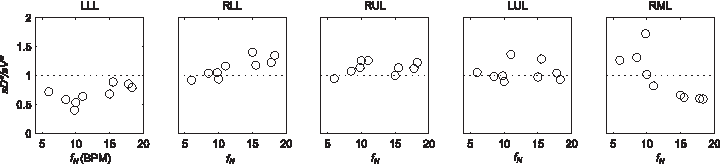
The ratio of sD*/sV* for each lobe vs. the breathing frequency during nebulization for the 9 subjects whom the frequency data was available. The lobes have been reordered based on their average inflation at MLV.
This behavior is shown by the significant frequency dependence of the correlation between lobar FVOL,sl and sD*/sV* for the different subjects (Fig. 12, Corr(Corr(sD*/sV*, FVOL),fN)=−0.97, p (Corr. >0)<0.0001). Note that the subjects breathing at the slower fN showed strong positive correlations, while those breathing the fastest showed a strong negative relationship between sD*/sV* and FVOL.
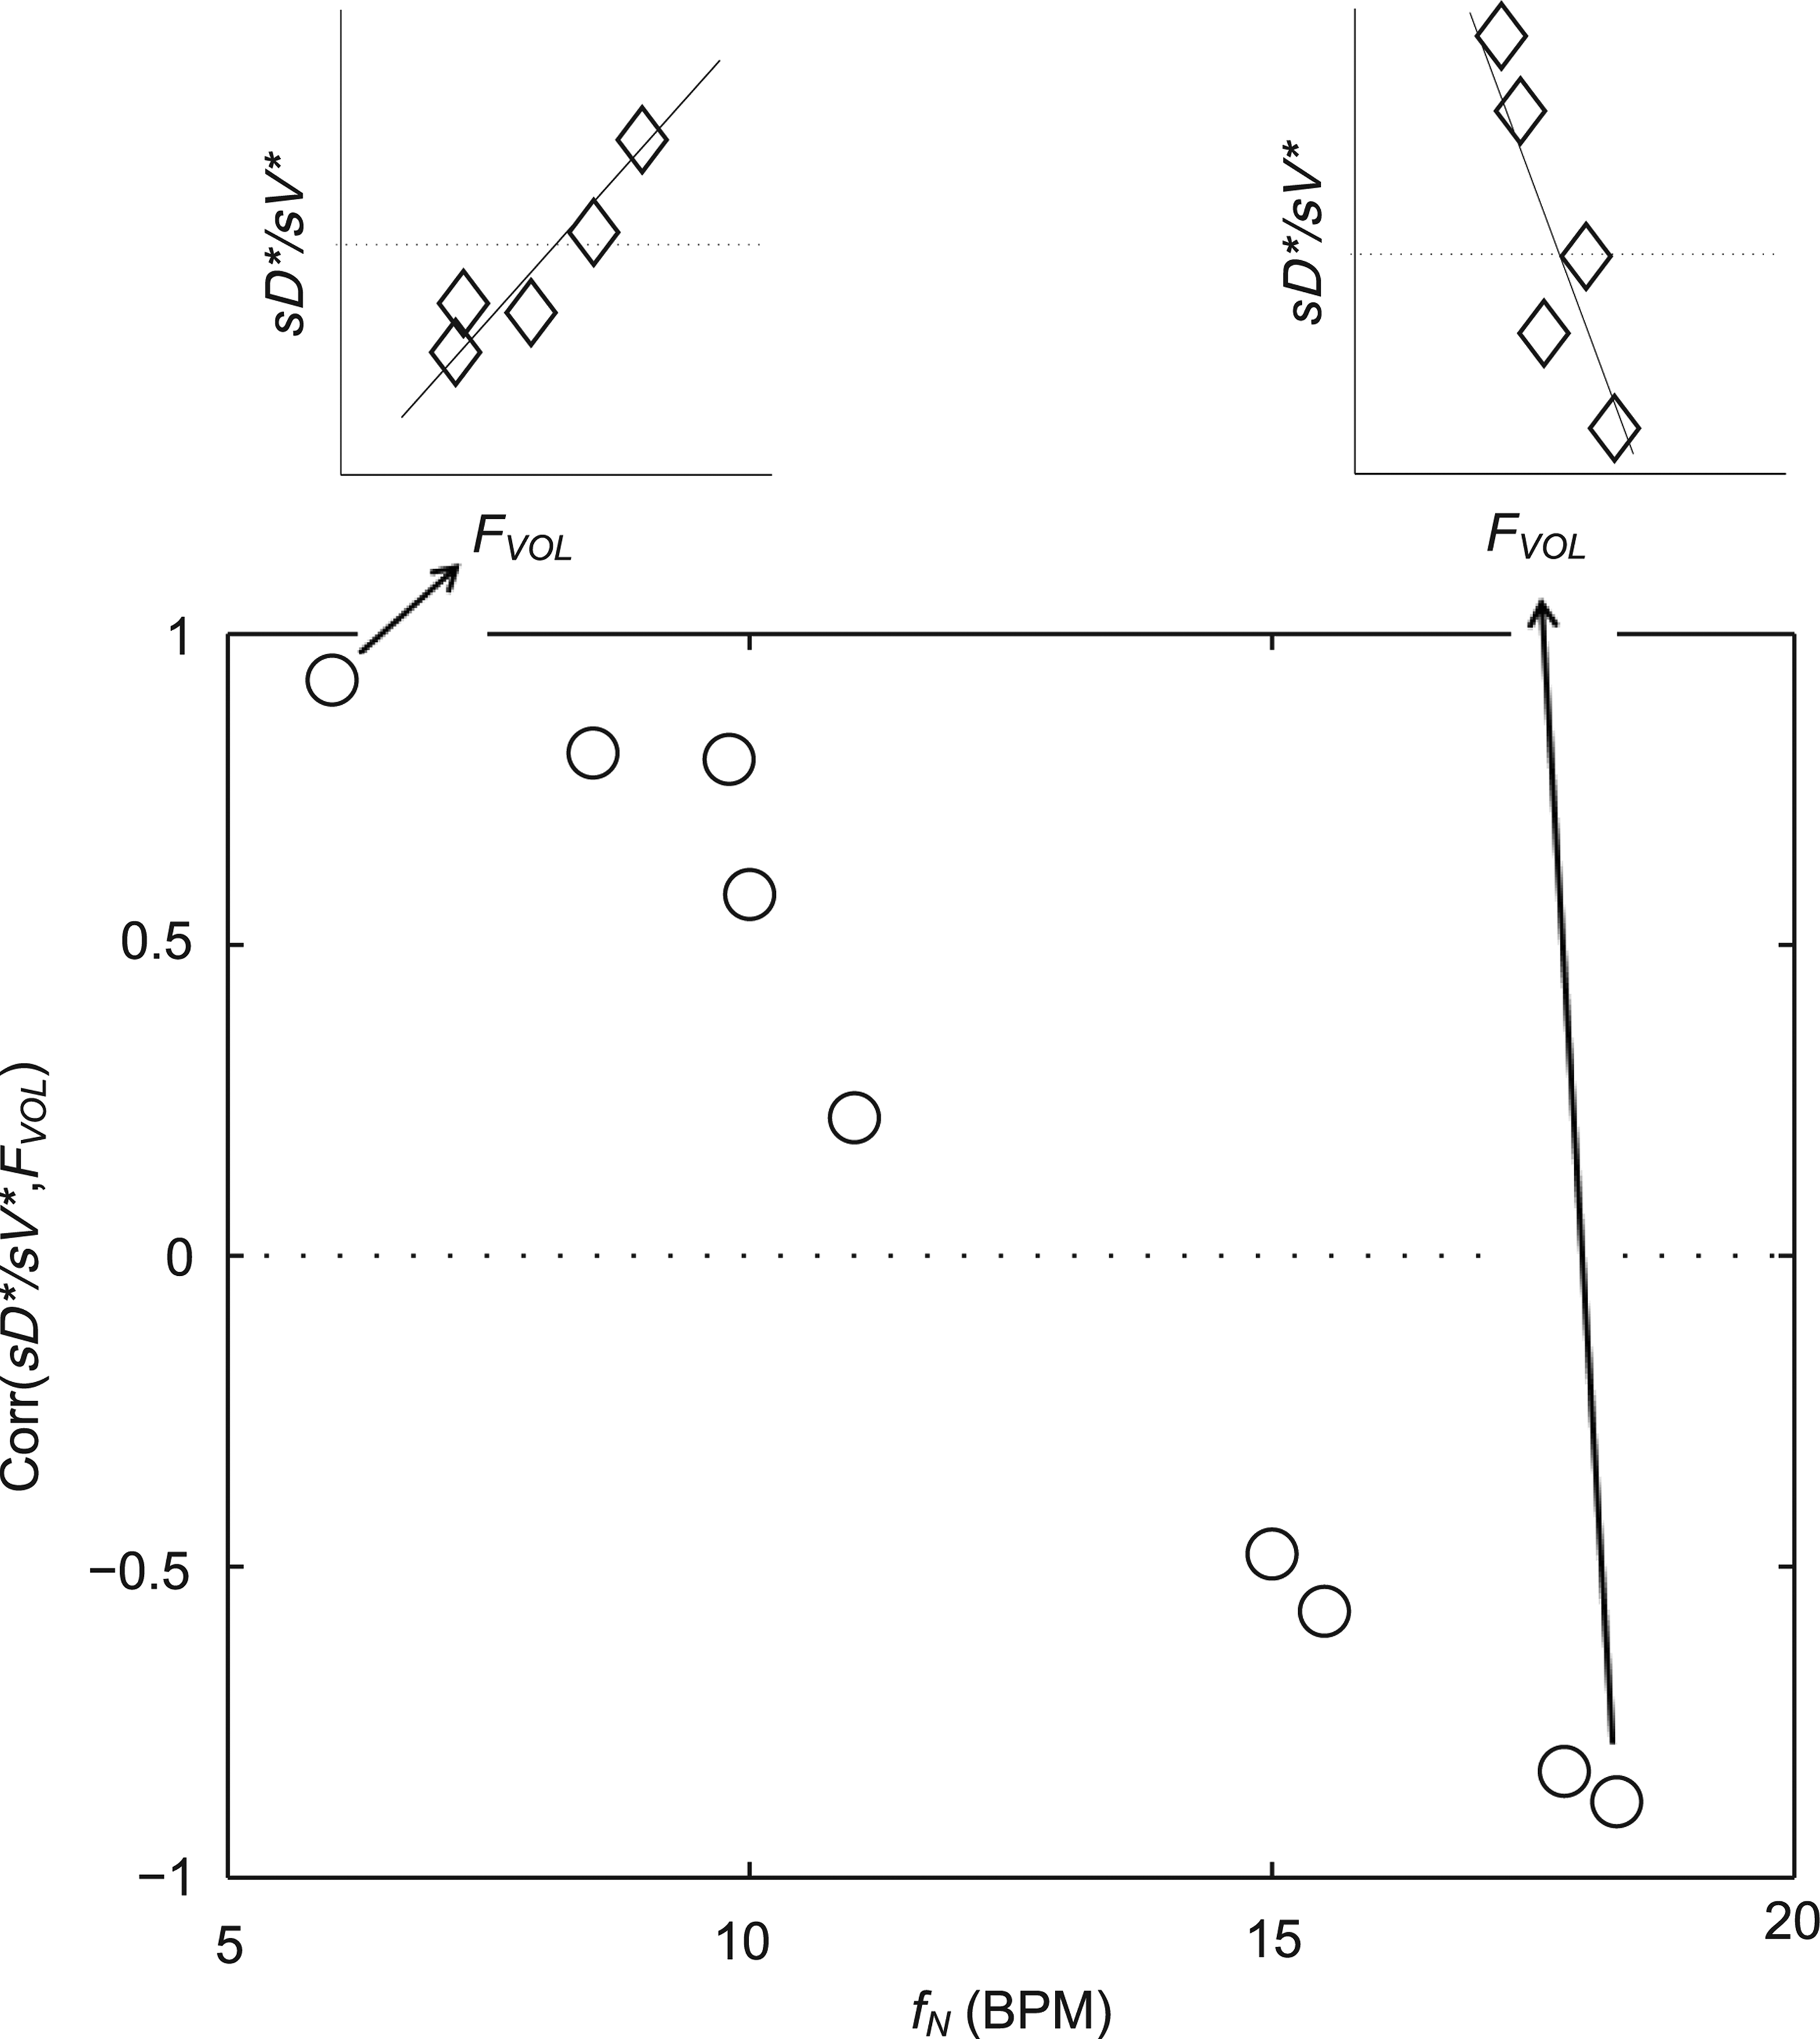
The relationship correlation between inflation FVOL and sD*/sV* was strongly modulated by the inhalation breathing frequency.
Discussion
Key findings
We have presented a theoretical framework to quantify four mechanisms that can lead to heterogeneous aerosol deposition among lobes: differences in lobar ventilation, uneven splitting of aerosol and air at bifurcations, differences in the fraction of aerosol deposited along the feeding airways, and differences in the fraction of aerosol that reaches the periphery but escapes via exhalation. We used this framework to quantify the contribution of these four effects in a group of 12 bronchoconstricted subjects with asthma. The following observations were seen from our data: First, differences in lobar specific ventilation (measured from the turnover rate of 13NN washout) and in the apparent net branching factors each accounted for more than a third of the variability in deposition among lobes and subjects. The remaining variability was caused by differences in deposition along the feeding airways as characterized by their apparent net escape fractions.
Second, subjects breathing slowly (<9 BPM) during nebulization had a strong relationship between regional deposition and ventilation with PET, while the relationship weakened in subjects breathing more rapidly. Also in subjects breathing faster, the more expanded lobes showed lower deposition per unit ventilation than less expanded lobes, while the opposite was true for subjects breathing slowly. Lastly, differences in lobe expansion between HRCTs at two lung volumes, sometimes used as a surrogate of regional ventilation, failed to explain the variability in regional deposition across subjects.
The relationship between sD* and sV* depend on fN
Large inter-subject variability was observed in the relationship between
This result is qualitatively consistent with the predictions of a recent CFD model by Darquenne et al.(9) using an idealized geometry of the human central airway tree and uniform specific ventilation among lung segments. Their results showed that the distal delivery of aerosol from the trachea to the lung segments was largely determined by the distribution on ventilation for Stokes numbers in the trachea less than 0.01. Conversely, when 10 μm particles were inhaled at flow rates 500 mL/sec, other effects besides the distribution of ventilation had a strong impact on the transport of aerosol from the trachea to the periphery. They also found that the Stokes number of the segmental airway feeding the sublobar segments explained 55% of the variance in deposition that was not otherwise explained by ventilation.
Similar quantification was attempted in the present experimental work but remained elusive; among other challenges, the polydisperse nature of the aerosol used in this study, together with uncertain proximal filtering effects, make it difficult to evaluate comparable Stokes numbers from the present data. In addition, the CFD model compares the number of monodisperse particles that escaped the central and segmental airways against the ventilation into the respective peripheral regions. The in vivo data measured here must consider that not all of the inhaled particles reaching the periphery deposit since some may be lost during exhalation. Despite these difference, the range in sD*/sV* (average COVLobes=0.277±0.067) was similar to the range in R (a measure equivalent to sD*/(sV*η*)) observed in the CFD model at a Stokes numbers in the trachea of 0.02 to 0.04. To use the present data to validate CFD models of aerosol deposition, a polydisperse aerosol should be used in the model, and the effect of incomplete deposition in the lobar periphery must be considered.
Lung disease may also influence the relationship between regional ventilation and deposition1. For example in the presence of constricted or obstructed airways can be expected to interfere with the relationship between ventilation and deposition. A narrow airway (such as in cystic fibrosis(18) or asthma(10)) both collects aerosol particles and reduces ventilation of subtended regions of the lung. Indeed, no relationship between ventilation and deposition could be found in 10 subjects with HIV infections using a 2D gamma-scintigraphy.(19) Other factors in poorly ventilated regions may lead to paradoxical increases in deposition; due to lower gas turnover rates(20) within these regions, suspended particles may have more time to sediment than in well ventilated regions. However, these paradoxical effects have only been observed after correcting for the bulk effect of reduced ventilation.(20) It is also plausible that the reduced caliber of constricted distal airways may lead to shorter sedimentation distances and allow for more complete retention.
On average, sV* accounts for a third of the variability in sD*, sI* does not
When we compared regional specific ventilation against
A recent study of mild to moderate asthmatic, but not bronchoconstricted, subjects compared estimates of ventilation using static HRCT at two lung volumes to the deposition pattern of 1.3 μm 99mTc particles inhaled during slow tidal breathing as imaged by SPECT-CT.(16) They found that the average difference in ventilation distribution of a lobe between the static estimates and the 99mTc deposition were only 3%. This measure would be approximately 12% of the lobar ventilation (only four effective lobes were used in that analysis). In contrast, our measurements using injected 13NN with PET-CT with bronchoconstricted asthmatic subjects during spontaneous tidal breathing showed average differences of 22% between
However, if dynamic effects were the only explanation for our findings, one could have expected that the correlation between
If CFD models of aerosol inhalation during tidal breathing are to reflect clinical reality in diseased or bronchoconstricted lungs, boundary conditions determined from measurement that are sensitive to the dynamic effects of slowly filling and emptying regions may be required. However, it is still possible that lobar inflation patterns measured from two static CT scans could yield representative boundary conditions for airflow in CFD models of healthy lungs, or in diseased lungs with slow and deep breaths.
Explaining the relationship among fN, FVOL, and sD*/sV*
Among subjects breathing at very low (<9 BPM) and very high frequencies (>17 BPM) the expansion of the lobes was strongly related to the deposition not explained by ventilation, albeit the direction of the effect depended on breathing frequency. While this signal was exceptionally strong, it is not easily interpreted. One possible explanation is as follows: lobes with high FVOL,sl are expected to have dilated airways with reduced retention η
sl
due to both the longer sedimentation distances and reduced likelihood of impaction due to slower velocities and wider turns. Additionally, the analysis based on data from Kim et al.(8) (Fig. 5) showed a 20%–60% reduced
It is important to note that although these explanations are consistent with the emerging phenomenon at high fN, alone they cannot explain why those same high FVOL,sl lobes appear to be receiving greater deposition than would be expected based on their ventilation at low fN. To explain this, a certain degree of bias for a positive relationship between FVOL,sl and sD*/sV*, driven by a consistently low sD*/sV* in the LLL (a lobe that also has low FVOL,sl). This low sD*/sV* appears to be evident in the
Methodological limitations
A number of methodological limitations in the present study should be considered when interpreting our findings. First, the lobar retention fractions could not be measured, but are required to obtain accurate estimates of the actual net escape fractions and branching factors. Unless particle motion can be visualized, these values may need to be estimated from CFD or analytical models in which the data provided by our study could be used as input. Despite this limitation, we were able to separate apparent net branching factor and escape fractions, and to directly express in Equation (21) how heterogeneity in retention fractions among lobes causes these measures to differ from the actual branching factor and retention fractions. Additionally, using aerosol bolus data from Kim et al.,(8) we identified a relationship that estimates the overall magnitude of the peripheral retention that we could expect in the present data, and provided a means to understand how breathing frequency during inhalation affects the retention.
It was also assumed that the fine particles that escape deposition in the periphery do not significantly deposit in the central airways on their egress from their lung. While this is likely the case when only a small fraction of the aerosol is exhaled, when a significant amount of aerosol is exhaled, deposition during exhalation should be considered, particularly in the presence of flow limitation in the central airways.(21) The primary consequence of not considering this effect is an underestimation of airway escape fractions. While the theoretical framework in this presentation is thought to be generally applicable, the experimental findings are limited to the conditions and population we studied. For example, changing the nebulizer setup can influence the aerosol size distribution and deposition pattern,(22) and might also influence the contributions of different sources of variability in specific aerosol deposition.
Additional limitations in the measurements arise from the estimation of ventilation distribution. The distribution of ventilation during nebulization was assumed to be similar to the distribution of alveolar minute ventilation measured 10 minutes later (30±4.5 minutes after Mch), an assumption that could be weakened by the presence of a nebulizer circuit during the nebulizing image, and the possibility of a reduced methacholine effect during the ventilation image. While some researchers have found little change in the degree of methacholine-induced bronchoconstriction after 60 min,(23) others have found that methacholine wears off by 60% within 30 min.(24)
There are also potential errors in the estimates of
Nonsystematic measurement errors should increase variability of parameters within and across subjects. The isolation of the net escape fraction from errors in ventilation may be partially responsible for the low variability across subjects of the net escape fraction (illustrated by the low inter-subject variability in net escape fraction of a given lobe in Fig. 10, right panel). Net branching factors, on the other hand, are sensitive to errors in both the ventilation and deposition assessment, and errors in both images likely contributed to some of the variance in the net branching factors.
Clinical relevance
In this study, we evaluated the heterogeneity in aerosol deposition and ventilation in conditions similar to those expected clinically by allowing the subjects to breathe freely without attempting to control their lung volumes or breathing frequency. This technique provided us with a data set of that spanned the physiological range of breathing frequencies during nebulization. From our results it has become clear that breathing frequency and lung expansion appear to have important effects on the relationship between ventilation and aerosol deposition among subjects at a lobar level. Although these effects were not expected a priori, they provide an important basis for future experimental and numerical studies where these effects can be controlled and evaluated. The present data set can be used to identify physiologically appropriate boundary conditions for ever improving CFD models.
Despite other sources of heterogeneity, it is clear that poorly ventilated regions of the lung will generally receive a smaller fraction of the inhaled aerosol than better ventilated regions. Lower deposition might result in paradoxical effects where an inhaled bronchodilator could aggravate the discrepancy between low and high ventilated regions. This effect has been anecdotally observed with imaging in our laboratory,(25) where a single administration of bronchodilator increased the size of ventilation defects in an asthmatic subject. In the present study, several regions that received low ventilation clearly showed markedly reduced aerosol deposition, as exemplified in the extreme case presented in Figure 13.
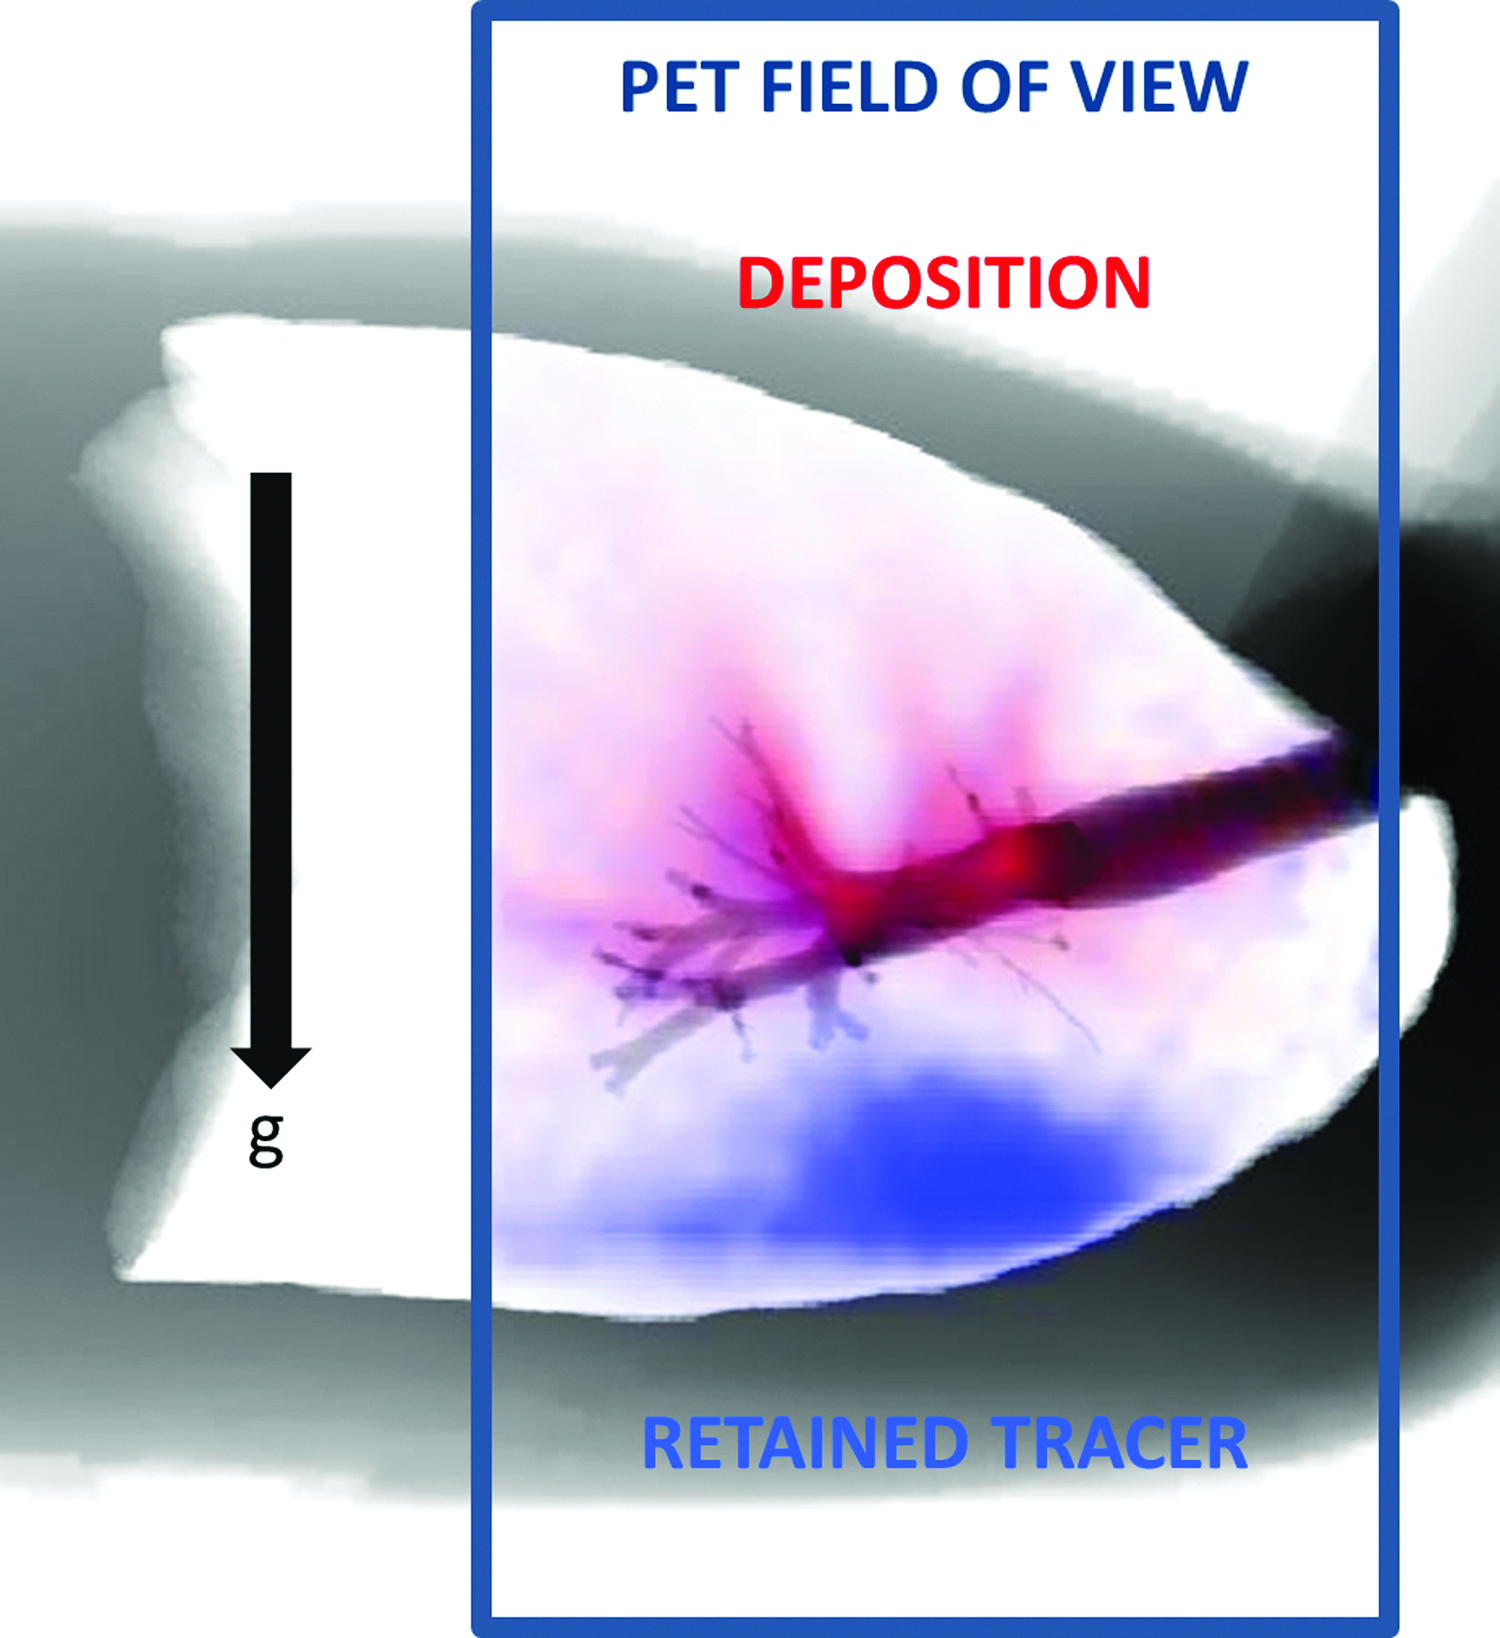
An extreme example of deposition (red) avoiding poorly ventilated regions (blue). Poorly ventilated regions in dependent regions of the lungs of this subject, shown by the high level of tracer retained at the end of washout, received little aerosol; the strong ventilation defects in the subject's left and right lower lobes may have caused the deposition to avoid the lower lobes. Color images available online at www.liebertpub.com/jamp
The theoretical framework presented here has proven to be a useful tool to describe and understand parallel heterogeneity in deposition among lobes. In the bronchoconstricted asthmatic subjects studied, more than a third of this variability was caused by ventilation heterogeneity; poorly ventilated lobes tended to receive lower aerosol deposition. Breathing was not controlled during nebulization in this study, and it is expected that the deposition pattern observed after nebulization during spontaneous breathing is reflective of the type of distribution that occurs beyond laboratory walls. The relationship between ventilation and deposition has implications for the distribution of aerosol therapies in subjects with heterogeneous ventilation, and should be considered when using inhaled therapies to treat regions of poor ventilation.
In summary, heterogeneity in specific deposition among lobes can emerge from 1) differences in lobar ventilation, 2) uneven splitting of aerosol and air at bifurcations, 3) differences in the fraction of aerosol trapped by feeding airways, and 4) differences in the fraction of aerosol that is retained in the periphery and not exhaled. These effects were integrated into a theoretical framework that provided insight into measurements of deposition and ventilation in bronchoconstricted asthmatic subjects. In this data, heterogeneous specific ventilation accounted in average for more than a third of the heterogeneous specific deposition of aerosols among lobes. This relationship can cause inhaled aerosol therapy to miss poorly ventilated regions. Lobar inflation between two CT images did not show a similar relationship, suggesting that dynamic PET may provide a better estimate of ventilation for bronchoconstricted asthmatic subjects.
The remaining three factors besides ventilation that influence specific deposition appeared to be related to the inflation of the lobes during nebulization in a way that was strongly modulated by the breathing frequency during nebulization, though the mechanism for this remains somewhat unclear. Understanding the ventilation-deposition relationship at a regional level may help to develop strategies for inhaled therapies.
Footnotes
Acknowledgments
Research reported in this publication was supported by the National Institutes of Health under award number R01HL68011. The content is solely the responsibility of the authors and does not necessarily represent the official views of the National Institutes of Health. Additional support was provided by American Air Liquide Inc., and Aerogen is thanked for providing the vibrating mesh nebulizers
Author Disclosure Statement
This work was sponsored in part by American Air Liquide Inc. and Aerogen. However, there is no conflict of interest with these parties on any of the material presented in this paper.
Appendix I
Lobar retention fractions were not available from our data. Inhalation bolus data from Kim et al.(8) were used to calculate the overall retention fraction at penetration volumes VP greater than 100 mL (about the depth of the subsegmental airways) for particle sizes dp ranging from 1–5 um, delivered at a fixed tidal volume VT of 500 mL constant inhalation speeds QN ranging from 150 to 500 mL/sec. To estimate the retention fraction, we calculated the fraction of the inhaled aerosol that deposited past 100 mL by removing the deposition in regions more proximal than 100 mL (provided in Fig. 8 of Kim et al.(8)) from the non-bolus total deposition (Table 3 of Kim et. al.(8)). We compared the deposition to the fraction of aerosol that survived the first 100 mL, which was determined by fraction exhaled in the 100 mL bolus depth experiment. The ratio of the deposited fraction to the fraction that arrived is the retention fraction.
We then calculated the distance ds that the monodisperse aerosols in each of the experiments would travel during the average residence time ts at depths greater than 100 mL if the particles traveled at the Stokes settling velocity vs.
where gravity, the density of the particle, and the viscosity of air are represented with their conventional symbols. We found that 97% of the variance among the experiments could be explained with a single parameter fit:
Note that the fit constant of 371 μm is on the order of an alveolus.
Estimating the global retention fraction in the present data set taken with polydisperse aerosols is significantly more complex. Given a particle distribution function P, the net retention fraction can be estimated as:
The particles size distribution was measured to be lognormal with a VMD of 4.9 μm and a GSD of 1.8. Larger particles are more likely to deposit in the upper airways, and the distribution reaching the periphery is expected to have a reduction in larger particles. We therefore numerically integrated the above equation for the net retention fraction for particles below several cutoff diameters (Fig. 5).
Appendix II
Apparent and actual net branching factors and escape fractions. From the theoretical framework it is clear that variability in both of these factors can influence variability in specific deposition among peripheral regions. However, our methodology does not allow measurements of regional retention fractions, and this limits our ability to measure the true branching factors and escape fractions. In the presence of incomplete peripheral aerosol retention (e.g., some portion of the aerosol is exhaled), we can only estimate an apparent concentration
In the absence of information about lobar retention fractions, it is necessary to understand how the apparent parameters (the factors that are calculated if the retention fraction is assumed to be one) relate to the actual parameters. If we consider the ratio of the escape fractions in terms of the distribution of aerosols, and then factor out the retention fractions, we arrive at our first result:
Further,
By substituting our first result into this equation we conclude that: