




Abstract
Abstract
Background:
Theoretical models suggest that He-O2 as carrier gas may lead to more homogeneous ventilation and aerosol deposition than air. However, these effects have not been clinically consistent and it is unclear why subjects may or may not respond to the therapy. Here we present 3D-imaging data of aerosol deposition and ventilation distributions from subjects with asthma inhaling He-O2 as carrier gas. The data are compared with those that we previously obtained from a similar group of subjects inhaling air.
Methods:
Subjects with mild-to-moderate asthma were bronchoconstricted with methacholine and imaged with PET-CT while inhaling aerosol carried with He-O2. Mean-normalized-values of lobar specific ventilation sV* and deposition sD* were derived and the factors affecting the distribution of sD* were evaluated along with the effects of breathing frequency (f) and regional expansion (FVOL).
Results:
Lobar distributions of sD* and sV* with He-O2 were not statistically different from those previously measured with air. However, with He-O2 there was a larger number of lobes having sV* and sD* closer to unity and, in those subjects with uneven deposition distributions, the correlation of sD* with sV* was on average higher (p < 0.05) in He-O2 (0.84 ± 0.8) compared with air (0.55 ± 0.28). In contrast with air, where the frequency of breathing during nebulization was associated with the degree of sD*-sV* correlation, with He-O2 there was no association. Also, the modulation of f on the correlation between FVOL and sD*/sV* in air, was not observed in He-O2.
Conclusion:
There were no differences in the inter-lobar heterogeneity of sD* or sV* in this group of mild asthmatic subjects breathing He-O2 compared with patients previously breathing air. Future studies, using these personalized 3D data sets as input to CFD models, are needed to understand if, and for whom, breathing He-O2 during aerosol inhalation may be beneficial.
Introduction
B
Indeed, computational fluid dynamic (CFD) models have shown lower aerosol deposition in the extrathoracic airways with He-O2,(10) reduced turbulent mixing,(11) increased peripheral deposition, and more homogenous ventilation.(5) However, experimental and clinical evidence testing the premise that He-O2 results in increased peripheral deposition(1,3–6,12–14) have not been conclusive and few studies have addressed whether using He-O2 as carrier gas homogenizes ventilation or aerosol deposition among parallel regions of the lung.
Given the complexity and multifactorial nature of aerosol deposition,(8) it is impractical and of limited clinical value to study the effect of breathing He-O2 in humans through highly controlled breathing conditions rarely seen in clinical situations. Instead, we believe that validated and physiologically informed computational models could be a more effective approach to explore how and for whom aerosol delivery with He-O2 may be of benefit.
As a first step in that direction, it is critically important to start with concurrent 3D imaging data sets of anatomical structure, ventilation, and aerosol deposition data in relevant clinical conditions, which are not currently available. To fulfill this need, in this work we set out to collect such experimental imaging data sets using PET-CT in bronchoconstricted asthmatic subjects receiving aerosol with He-O2 as a carrier gas under spontaneous uncoached breathing conditions. Together with data previously collected with air as the carrier gas,(8) these data sets will be useful to validate in the future advanced aerosol deposition CFD models under personalized realistic physiological conditions.
The small number of subjects in this study, the inter-subject variability in asthma, and the uncontrolled breathing pattern among them limits the statistical power to test for effects of carrier on the distributions of ventilation and aerosol deposition from these data sets. However using a theoretical framework described in a previous article,(8) we estimated the contribution of a number of factors on aerosol deposition in peripheral lobar regions of the lung and compared the results obtained breathing He-O2 with those obtained from independent group of similar subjects breathing air. With the purpose of generating hypothesis and support future studies, the present work seeks to contribute to our understanding of how carrier gasses affect the regional distribution of aerosol.
Nomenclature
Methods
Theoretical framework
We recently introduced a theoretical framework that quantified four factors affecting aerosol deposition in the lung periphery:(8) differences in ventilation, unequal partitioning between aerosol and air at bifurcations, differences in the fraction of aerosol escaping deposition in central airways, and differences in the fraction of aerosol reaching the periphery that is exhaled. We identified metrics for each of these four factors for each subject s and lobe l, and evaluated their values after normalizing by the respective lung averages for each subject.
The framework describes the relative specific deposition
We further demonstrated that in the absence of direct measurements of the lobar retention fractions, the specific deposition could be described in terms of the apparent net branching factor
Experimental methods
Overview
The imaging protocol, methods of image analysis, and the extraction of regional parameters, were identical to those described in our earlier study of bronchoconstricted asthmatic subjects breathing room air.(8) Portions of that study are used here for comparison. The only methodological difference between protocols was the carrier gas; instead of air, the subjects breathed a gas mixture of 79% helium and 21% oxygen (Airgas, custom blend) during aerosol delivery and the ventilation image. The subjects included in both studies were well matched in terms of demographics and pulmonary function (Table 1). They were young, predominantly female, had BMI's less than 32 kg/m2, and had mild intermittent or mild persistent asthma as defined by the NIH Global Initiative for Asthma(16) ( FEV1 and FVC ≥80% predicted, less than daily symptoms, and peak flow or FEV1 variability of less than 30%).
There were no statistically significant differences between the groups in these measures. Note that these are separate individuals and none of the subjects were imaged with both air and helium.
All subjects demonstrated reversible obstruction with inhaled albuterol (≥ 12% on previous clinical spirometry). Note that none of these subjects were imaged with both air and He-O2 due to limitations on the amount of radiation that we could safely administer. Additionally, while we collected aerosol deposition data in 14 subjects breathing air, in only 12 of these subjects were we able to obtain ventilation data, and these are used here for comparison with the subjects breathing He-O2.
Imaging protocol
The imaging protocol (Fig. 1) was completed at Massachusetts General Hospital with IRB approval (Application No. 2011P000755), and with subject consent. While breathing room air, the subject was positioned supine in the PET-CT camera and was imaged during a breath hold at total lung capacity (TLC) with high resolution computed tomography (HRCT). The subject was then fitted with nose clips, and methacholine (MCh) was administered over five deep breaths using a DeVilbiss nebulizer and Rosenthal dosimeter (model 646, DeVilbiss Healthcare, Somerset, PA) at a concentration determined on a previous screening day to cause a 20% drop in FEV1 (PC20).
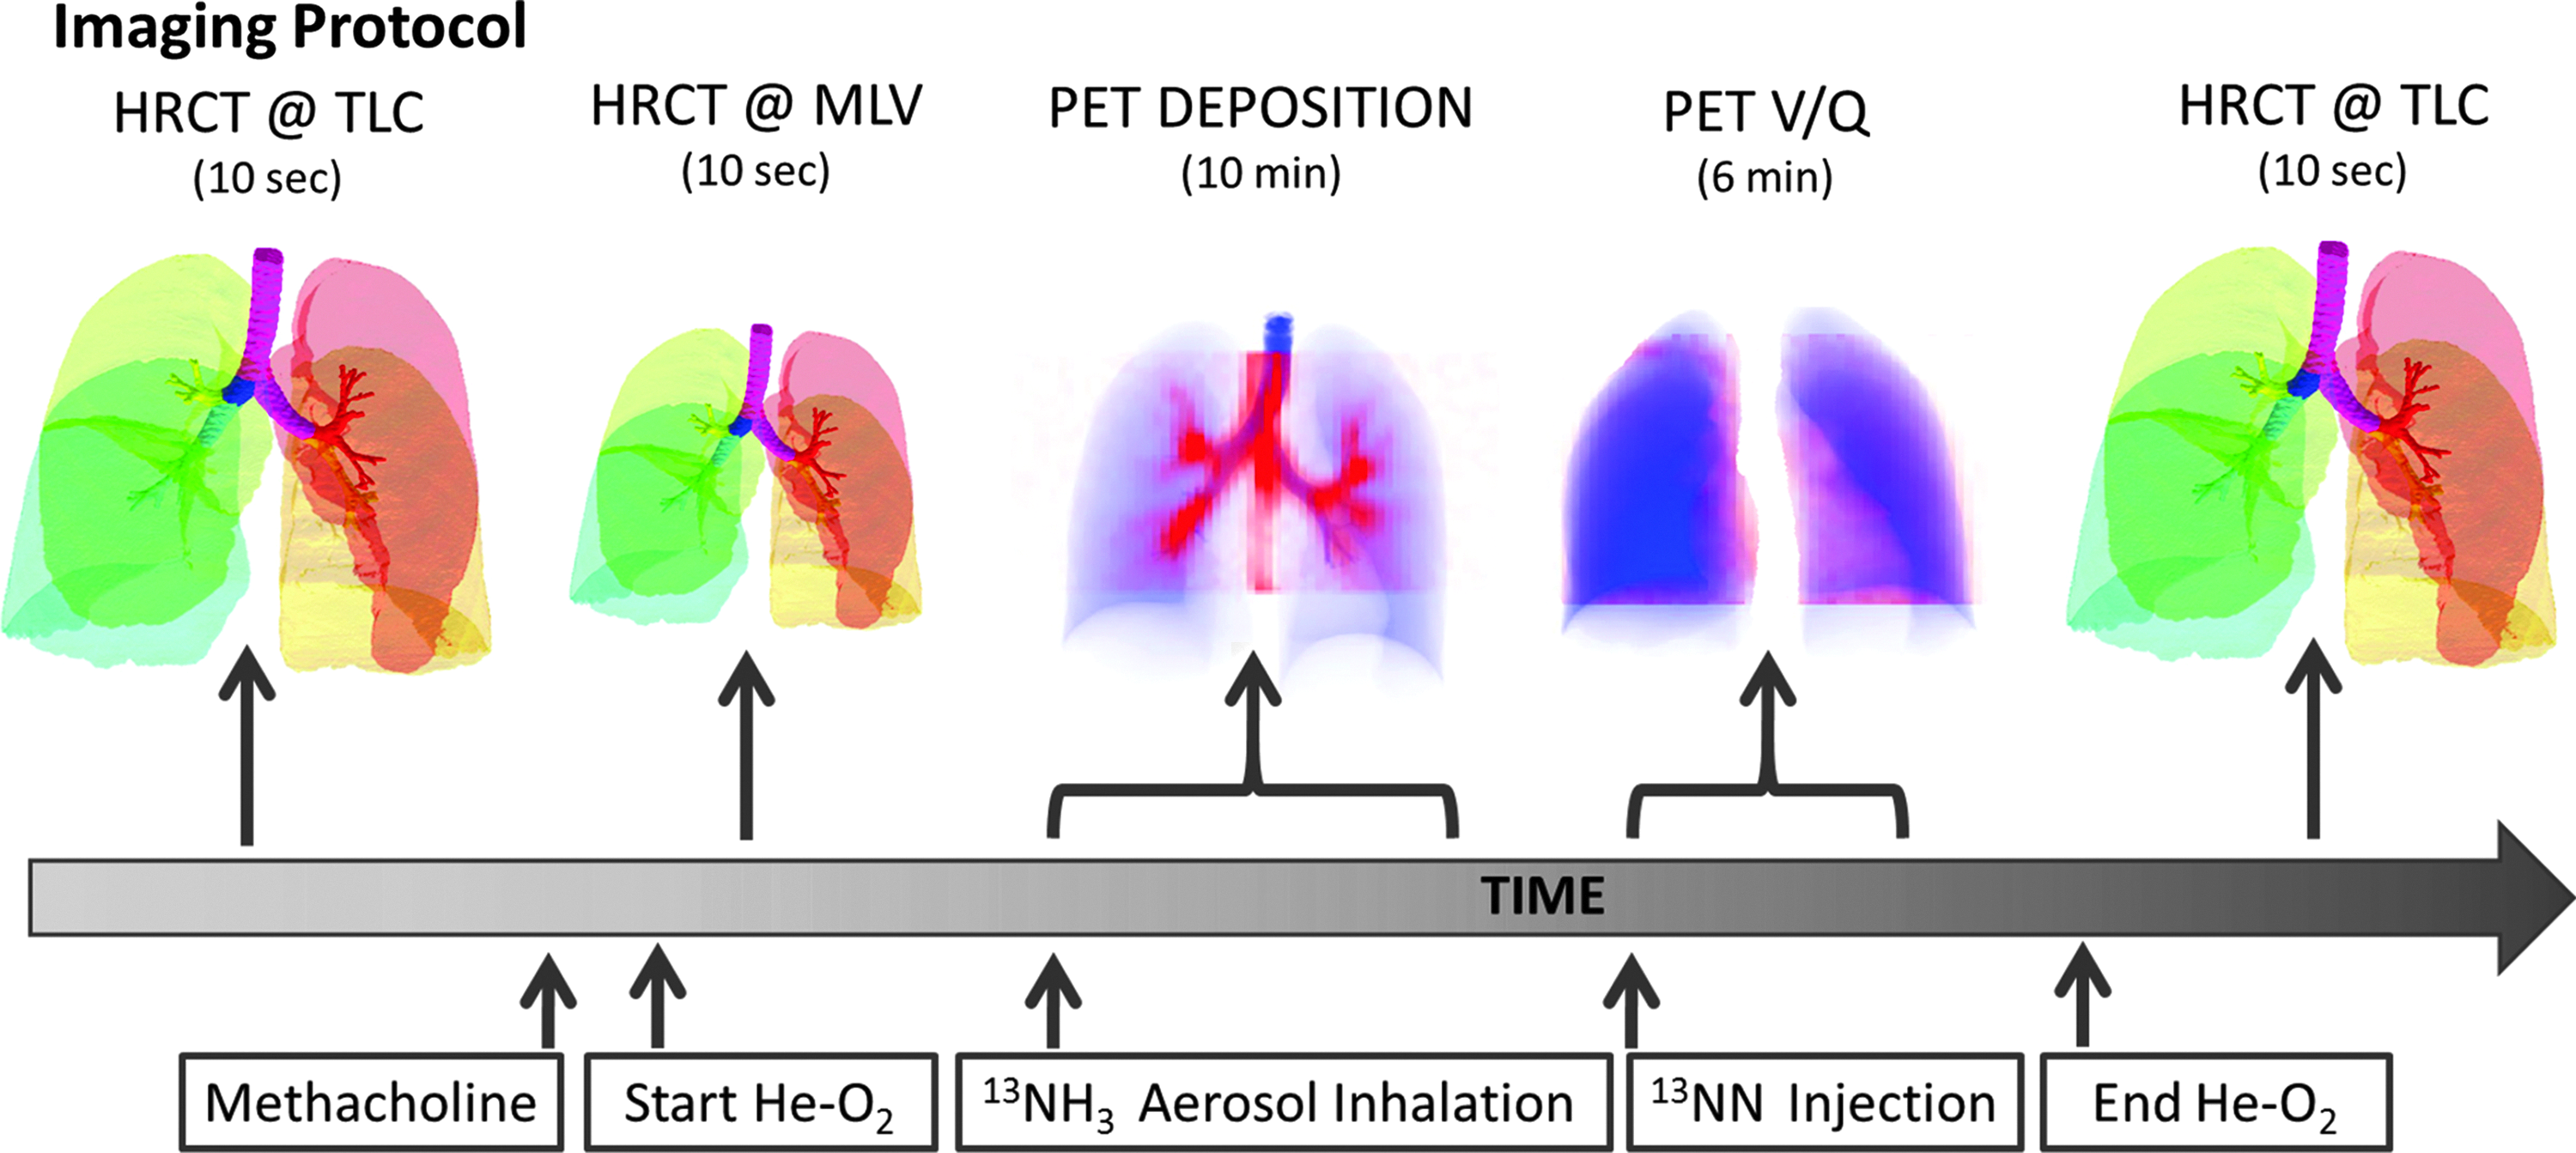
The imaging protocol for the He-O2 group.
The subject was then asked to breath via a sealed mouth piece from a breathing circuit (Fig. 2) that delivered a premixed gas of 21% O2 and 79% He. The circuit included a vibrating mesh nebulizer (Aeroneb Solo, Aerogen, Galway, Ireland) and an Idehaler holding chamber (Aerodrug, Cedex, France). After 5 minutes of free breathing, the subject was imaged again with HRCT during a breath hold at his/her mean lung volume MLV determined from impedance plethysmography during 30 seconds of steady tidal breathing before imaging.
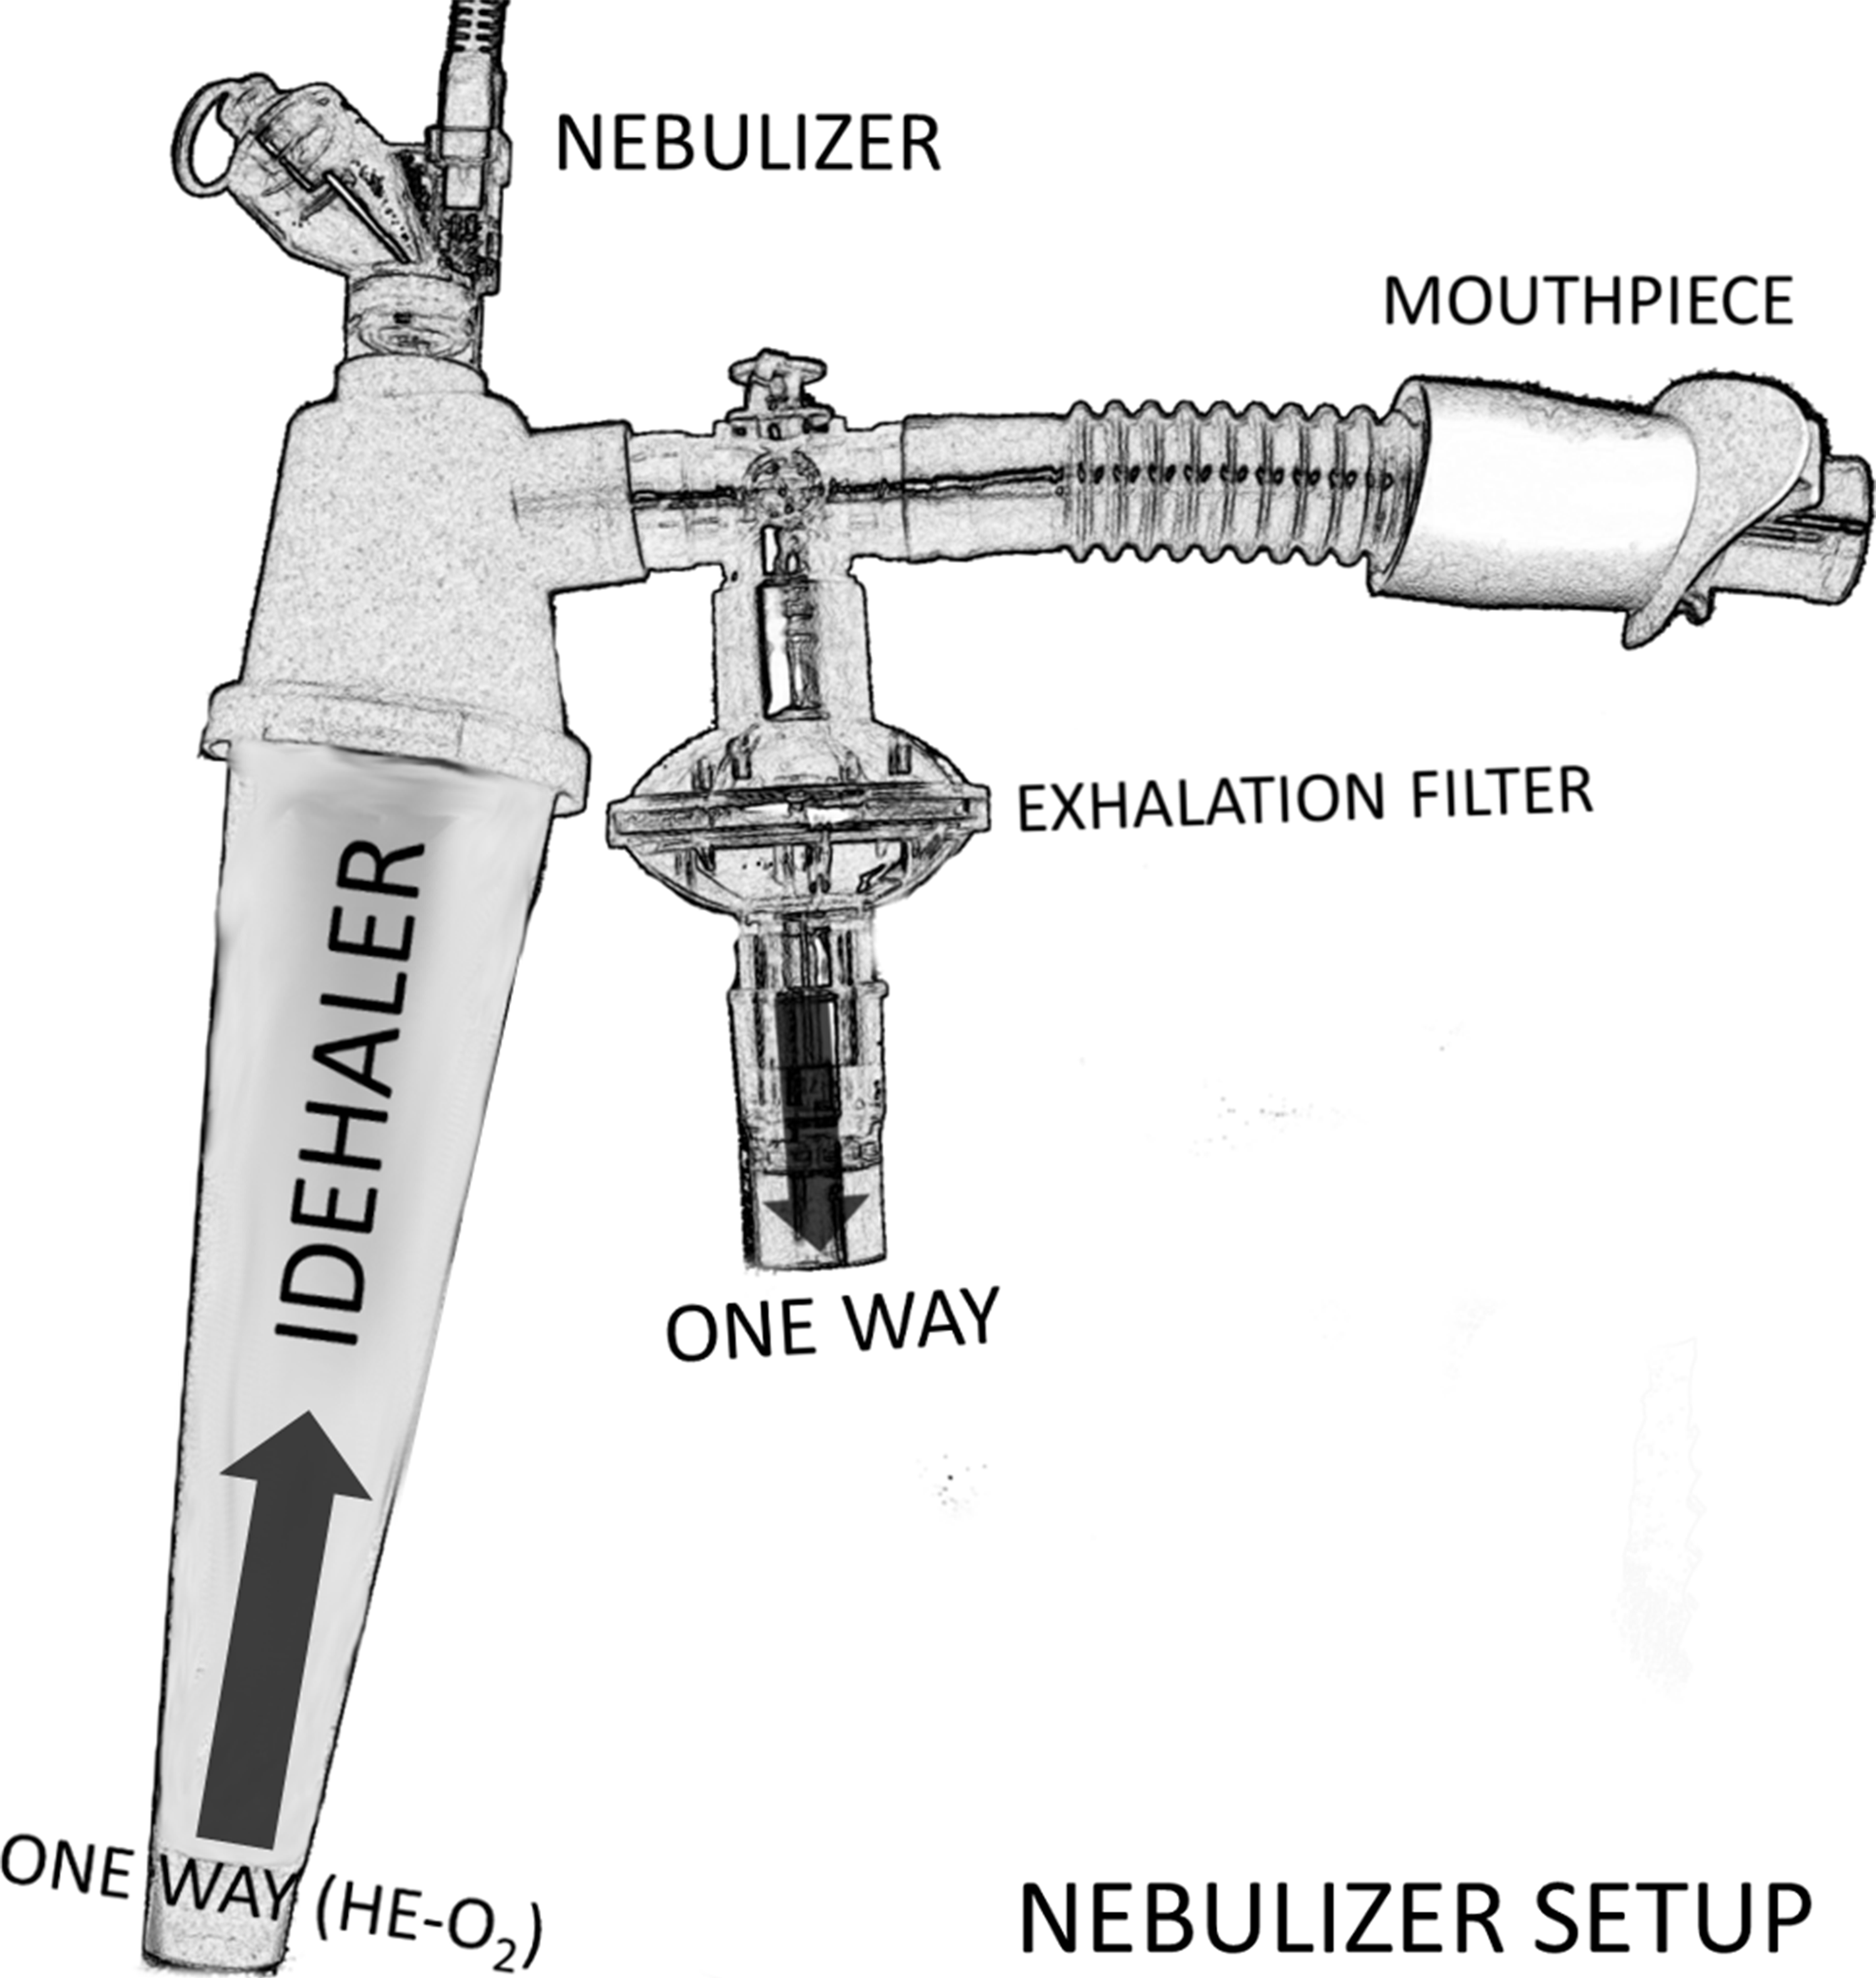
The breathing circuit used during nebulization. He-O2 gas was stored in a Mylar bag at atmospheric pressure. Both carrier gases were supplied through the base of the Idehaler through a one-way valve. After nebulization, the subject was switched to a second breathing circuit that continued to provide He-O2 without the nebulizer. Changing the circuit eliminated noise in the deposition image arising from residual tracer in the nebulizer.
Following acquisition of the HRCT scan, 1 mL of 13N-NH3 labeled (1–4 mCi) isotonic saline was aerosolized and inhaled over a period of 2 min while breathing He-O2. The particle sizes of the aerosol exiting the mouthpiece were previously characterized by laser diffraction to have a volume median diameter (VMD) of 4.9 μm and a geometric standard deviation (GSD) of 1.8 that was not significantly affected by the carrier gas.(17) At the end of the aerosol inhalation, the subject continued to breathe He-O2. PET image acquisition of the 13N-NH3 tracer within the lungs was conducted for 10 min, starting with the beginning of the aerosol inhalation. Deposition within the upper airways and mouth were not assessed.
Once the aerosol deposition image collection ended, the distribution of specific ventilation was assessed with PET using the 13NN bolus injection-washout method.(18) The method uses the low solubility of nitrogen in blood plasma to deliver the tracer to the lung; when an intravenous bolus of 13NN in saline solution passes through the pulmonary capillary bed, it diffuses from the blood plasma into the alveolar airspace. Starting with the tracer injection, subjects were asked to hold their breath for 20 sec at mean lung volume, followed by normal tidal breathing. Dynamic PET images were acquired for 7 min, starting simultaneously with the 13NN injection.
Imaging data was reconstructed in 4D and analyzed to evaluate the dimensionless values of relative specific depositions
The product of these branching factors along daughter branches leading to a given lobe, normalized to a lung average value, is the net apparent branching factor.(8) Note that both these terms are ‘apparent’ in that they are evaluated without considering the aerosol that was exhaled and is not present in the deposition image. The values of lobar retention needed to estimate the true net branching factors and escape fractions could not be directly measured from our imaging data.(8)
Possible effects of a heterogeneous lobar retention fraction
We could not determine the actual fraction of the aerosol retained in the periphery. However, we evaluated the effect of two parameters that might influence lobar retention: the inter-subject differences in the breathing frequency during nebulization
Lobes with high expansion
As with the air group, we could estimate a global retention fraction in the periphery
Assuming that this function holds for He-O2, and after accounting for the 16% reduction of ds caused by the more viscous He-O2 mixture compared with air,
Statistical analysis
Systematic differences among lobes in
In addition to evaluating heterogeneity among lobes, histograms of the voxel-by-voxel intrapulmonary distributions of
Results
Detailed 3D imaging data of ventilation and deposition were obtained in 10 subjects and analyzed on a voxel-by-voxel basis, as well as within 14 anatomically defined regions of the lungs and airways in each subject. These data sets also included 3D rendering of the airway tree up to the segmental airways, their average length, diameter, and cross-sectional areas, and bifurcation angles, as well as lung expansion in the periphery. Breathing frequency and pattern used by the subject during nebulization were also recorded.
Aerosol deposition pattern in air and He-O2
No obvious differences in the aerosol deposition pattern could be detected between the 3D images of He-O2 and air groups. This is supported by the visual similarity between the 2D projections of the images (Fig. 3) and the lack of quantitative differences (Table 2) among anatomical regions (AR). Note that the specific deposition in the central airways can be two orders of magnitude larger than the average deposition in the periphery as reported for air in our earlier work.(21)
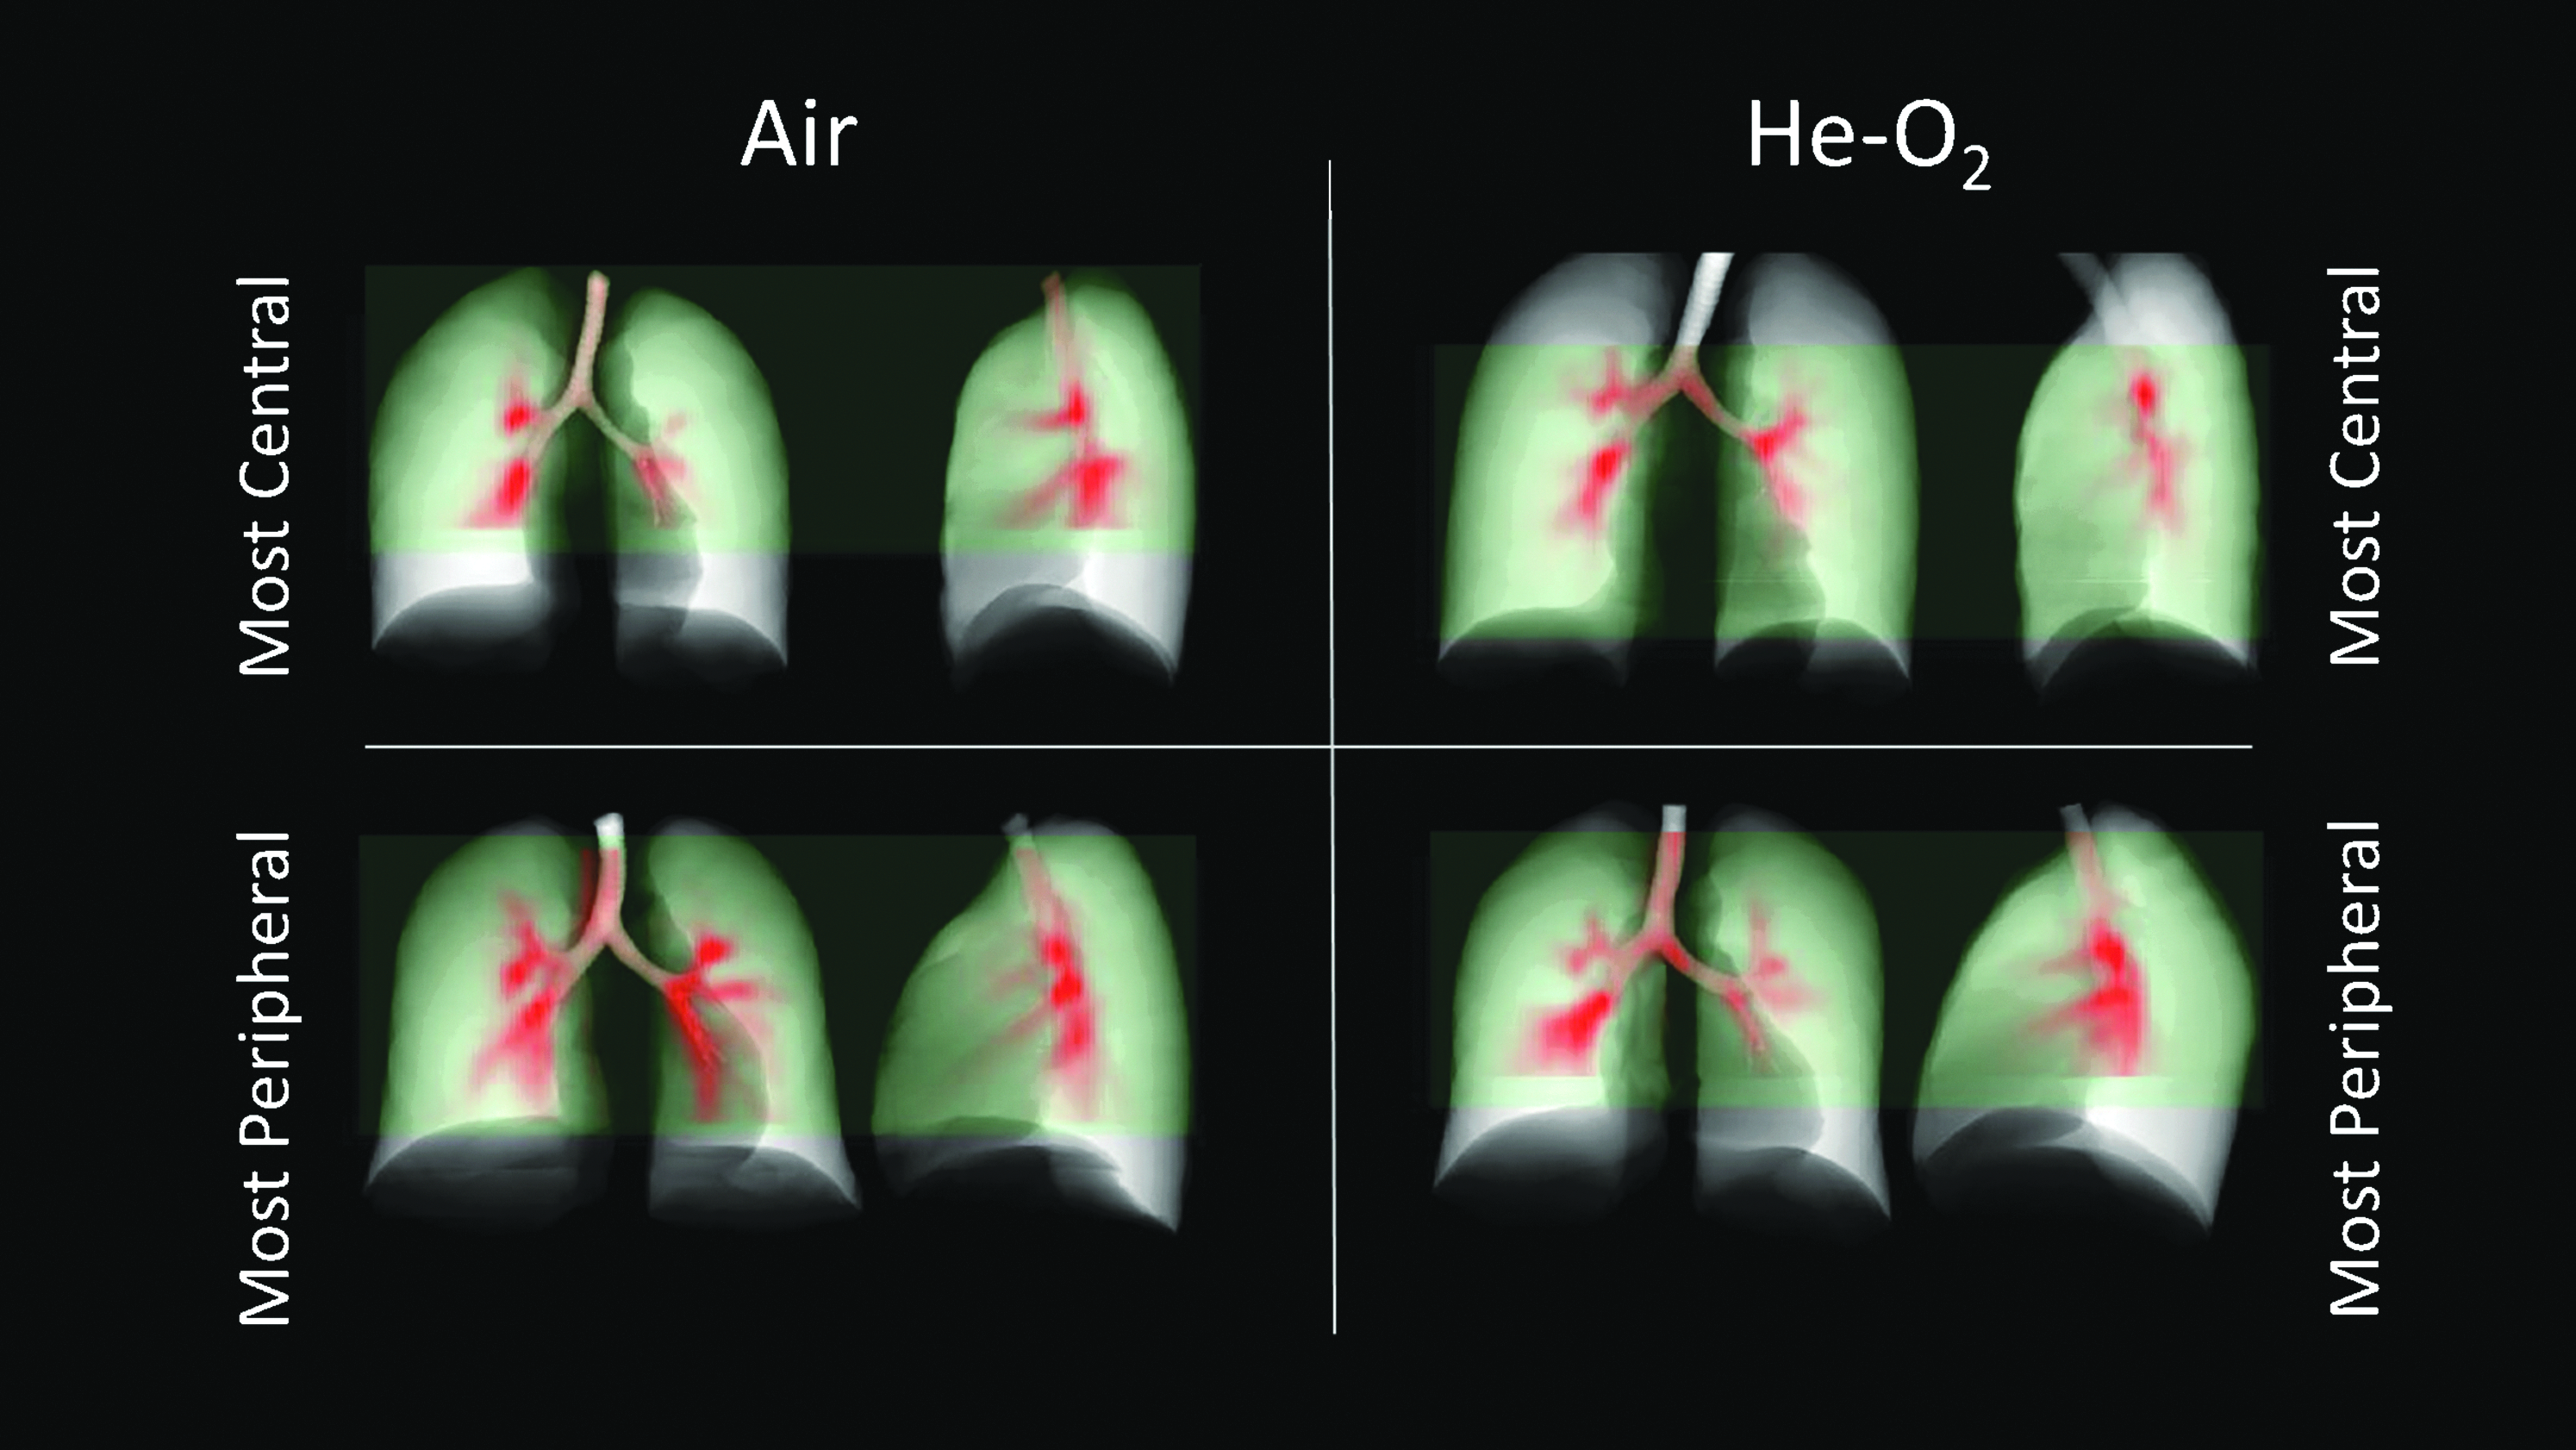
Maximum intensity projections for air and helium show similar highly centralized patterns of deposition. The subjects with the most central deposition pattern and with the most peripheral deposition pattern (determined by the ratio of deposition in the central airways to the total in all ARs) are presented for visual comparison. The PET field of view is shown in light green.
The relative specific deposition sD* is a measure of the concentration of the aerosol compared to the average concentration in the periphery. The total deposition is the fraction of aerosol that deposited in the anatomical region, and is given as a percent of the total deposition past the carina (the total lung dose TLD). There were no statistically significant differences in the regional deposition between the 12 subjects breathing air and the 10 subjects breathing He-O2 groups.
The fraction of the total aerosol that deposited past the carina that deposited in the periphery
Metrics describing the distribution of
There were no statistically significant differences between the groups.
Comparing the sources of variability in sD* in air and He-O2
Taken as a whole, the distributions of

sD* (left column), sD*/sV* (center column), and the apparent escape fraction (right column) for each lobe in the air (top row) and He-O2 (bottom row) subjects. Lobes of the same subject are connected with thin lines, and the average among subjects is shown with the circular markers and connected with thick lines. Statistical differences in parameters between any two lobes in the air group are depicted as a line connecting the lobes to the above each plot (solid is p < 0.001, dashed is p < 0.01, and dotted is p < 0.05). Note also the systematic cranio-caudal gradient in apparent escape fractions in the right and left lungs of both groups. The air data were presented in a previous publication,(8) and is presented here alongside the He-O2 data for comparison.
The relationship between sD* and sV* may be stronger in He-O2 than air
Both
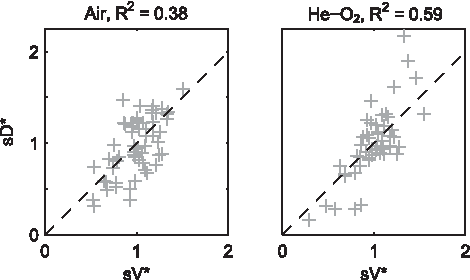
sD* vs. sV* for air (left) and He-O2 (right), along with the correlation squared between the metrics. Helium tended to have a wider spread in sD* and sV*, with a tighter correlation between the metrics than air.
However, when we considered only those subjects with uneven
The variability of the relative specific ventilation, the net branching factor, and the net escape fraction are presented in Table 4. Whereas the air data showed weak correlations among the lobar measures of relative specific ventilation, the apparent net branching factors, and the apparent net escape fraction (Table 5), the He-O2 data showed a significant and substantial correlation between ventilation and escape fractions with corr (
p < 0.05
Relationship between FVOL, sD*/sV* and fN was not present in the He-O2 group
In the 9 subjects breathing air with measurements of breathing frequency during nebulization fN, the relationship between lobe expansion FVOL and sD*/sV* among lobes for individual subjects had been found to be strongly modulated by the frequency of breathing during nebulization (corr(corr(sD*/sV*, FVOL),fN) = −0.97, p (corr. > 0) < 0.0001), with those subjects breathing at a low frequency showing a strong positive relationship, and those breathing at a faster rate having a strong negative relationship. In the He-O2 group these effects were not present (Fig. 6).
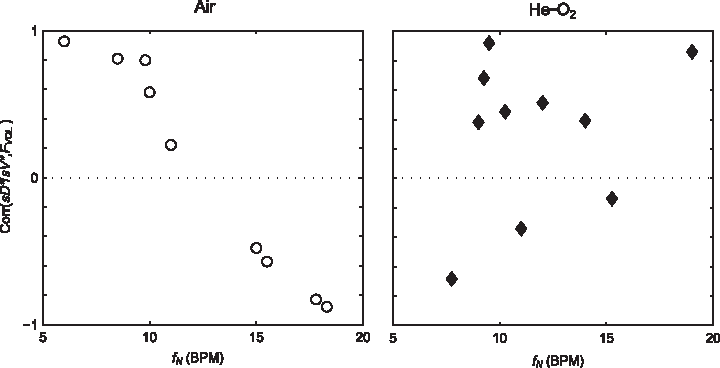
The correlation between sD*/sV* and FVOL for each individual subject, plotted against nebulization breathing frequency for air (left) and He-O2 (right). This relationship was strongly modulated by the breathing frequency for subjects breathing room air, but not for those breathing He-O2.
Discussion
Study design and main observations
The main purpose of this study was to collect 3D distributions of aerosol deposition during He-O2 breathing, together with detailed anatomical and functional data to be used as appropriate boundary conditions in future CFD modeling analysis. Given the large variability in the patterns of lobar sD* and sV* distributions previously observed with air,(8) this study was not powered to statistically evaluate whether the distributions of sV* or sD* with He-O2 were different than those with air. Tightly controlling the breathing pattern of the subjects, as well as using a cross-over design would have reduced the inter-subject variability of the data and may have improved its power to test for the effect of He-O2, but at the expense of reducing the amount of data obtained per subject vital to support the future computational studies.
In addition, as in the previous study breathing air, allowing the patients to breathe spontaneously during aerosol inhalation provided data sets with clinically expected variability in breathing patterns and thus enrich the relevance of the data set for validation of numerical models. Finally, given that the experimental data breathing air suggested that breathing frequency and lobar degree of inflation were modulating effects,(8) it was important to keep the protocol unchanged in this aspect. Therefore, in a hypothesis generating mode, we proceeded to evaluate the data obtained with He-O2 using a recently described theoretical framework to evaluate the factors affecting the distribution of sD* and compare the results with those obtained with air.(8)
From this analysis we observed that: 1) as with air, He-O2 resulted in a large inter-subject variability in the lobar distribution of sD* and sV*, and no statistical difference could be detected between both groups. However in the He-O2 group, there was a larger number of lobes with values of sD* and sV* around unity, suggesting that the gas may have reduced in their variability compared with air; 2) in subjects showing inter-lobar variability in sD* (COV2> 0.03), the correlation between sV* and sD* was higher in the subjects of He-O2 group compared with the air group; 3) in contrast with the results breathing air, where the correlation between sD* and sV* weakened among subjects breathing at higher breathing frequency during nebulization fN, there was no frequency dependence in the correlations seen in subjects breathing He-O2; 4) likewise, dependence of sD*/sV* on fN and lobar expansion observed among subjects breathing air was not detected in the group breathing He-O2.
Patterns of aerosol deposition were not different between the groups
The inter-subject variability in the distributions of lobar aerosol deposition and ventilation was as high in the He-O2 group as in the air breathing group, and they were not statistically different from each other. This was the case whether the images were inspected visually, the deposition within anatomical regions quantified, the characteristics of the voxel-by-voxel histograms compared, or the sources of variability in deposition among lobes quantified. While there was a tendency for the distributions of deposition and ventilation among all lobes to be more variable in He-O2 than in air, these results were not statistically significant.
Additionally, from Figure 5 it is evident that the group breathing He-O2 had a greater fraction of lobes with sD* closer to uniformity (average sD* ∼1) than air, together with a handful of lobes from some individuals with lobar sD* values much larger and smaller than unity. This is quantified in a histogram of abs(1-sD*) (Fig. 7) showing that one third of the lobes in the He-O2 group had a sD* within 10% of the mean value, compared to just 13% in the air group.
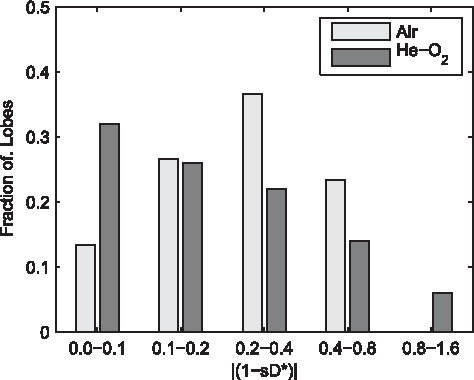
Histogram of the absolute difference of sD* from unity. Note that the He-O2 group has a greater fraction of lobes with sD* deviating by less than 10% of the average compared with the air group, while only in the He-O2 group did lobes deviate by more than 80% from the average.
Also, only in the He-O2 group were there lobes with sD* that deviated by more than 80% from uniformity. These lobes with extreme values in sD* corresponded to subjects also with extreme values in sV* (Fig. 5). Additionally, although the variability among all lobes tended to be larger in He-O2 group, the two subjects with the most uniform lobar sD* were both from the He-O2 group. Taken together, these findings support the possibility that He-O2 could be effective in some ‘responder’ subjects and not in others.(7) At present, a priori identification of those subjects is not possible, and more knowledge on basic mechanistic factors affecting the distribution of ventilation and deposition are needed.
The measurements taken in this study included ventilation and aerosol deposition on both a voxel-by-voxel basis, as well as within 14 anatomically defined regions of the lungs and airways. These could be used together with the 3D airway tree, lung expansion, and breathing frequency to provide personal, realistic boundary conditions for computational fluid dynamics (CFD) models. Together, these experimental data coupled with numerical models may help to explore in silico potential features distinguishing ‘responders' and non-responders.
Thus far, CFD models have shown lower aerosol deposition in extrathoracic airways with He-O2,(10) reduced turbulent mixing.(11) more peripheral deposition, and more homogenous ventilation.(5) However, experimental and clinical evidence testing the premise that He-O2 results in increased peripheral deposition have not been conclusive. Aerosol bolus studies have shown lower overall deposition,(3) with lower deposition in the upper airways, and increased deposition in the periphery.(4) 2D scintigraphy studies have had mixed results, with some showing either no difference in the upper airways(6) or among lung regions,(12) and others showing reduced deposition in the upper airways.(1)
Also using scintigraphy, another study reported increased lung deposition breathing He-O2 compared to O2 in pediatric subjects with severe airway obstruction, but not in subjects with lesser obstruction.(13) 3D imaging of aerosol deposition using SPECT-CT also showed variable results among two healthy and two asthmatic subjects, each imaged after inhaling aerosol suspended both in air and in He-O2. Of these, only one of the subjects with asthma showed a detectable change in deposition pattern, with a reduction in deposition with He-O2 within the central airways and an accompanying increase in the fraction of deposition within deeper generations.(13,19) The present work is the first in vivo study of the effect of ventilation distribution on aerosol deposition among parallel regions of the lung using helium oxygen as the carrier gas.
Given that the effects of He-O2 on the pattern of aerosol deposition have not been consistently observed, it is not surprising that the clinical benefit of using He-O2 as an aerosol carrier gas to deliver nebulized therapy in bronchoconstricted asthmatic subjects has also remained unclear. While some studies have shown improvements in FEV1,(22,23) PEFR,(23–25) FVC,(23) clinical score,(26) intubation,(25) and hospitalization rates,(26) others have found little or no benefit from the He-O2 in FEV1,(27,28) PEFR,(27,28) FVC, clinical scores, (28,29) and hospitalization rates.(30) An excellent overview of these conflicting results is presented by Kim and Corcoran,(15) who conclude that He-O2 mixtures should only be considered for those patients who present with severe asthma. It has also been suggested that older subjects may show greater improvement,(25) and that it may take time (>35 minutes of continuous nebulization with He-O2) to show a benefit over 100% O2.(26)
Kim and Corcoran(15) noted that the aforementioned studies that demonstrated clinical benefit of using helium oxygen as a carrier gas(22–26) all used large volume nebulizers that could meet the minute ventilation of the subject without dilution of ambient air. This was not a factor in the present study where a) the aerosol was produced by a vibrating mesh nebulizer not driven by gas, b) an Idehaler served as a reservoir for the aerosol, c) the inhalation circuit delivered a fixed gas composition independent of breathing flow rates, and d) the nebulization circuit included a tight fit mouthpiece and nose clips to prevent dilution of the He-O2 with ambient air (Fig. 2).
Relationship between sD* and sV* may be stronger in He-O2 than air
The lobar distribution of aerosol deposition tended to follow that of ventilation more closely in the He-O2 group compared with the air group when all lobes and subjects were grouped in the analysis. The difference in the correlation between sD* and sV* was only significant when comparing subjects with variability in sD* (COV2 >0.03). The He-O2 data had low variability in both sD* and sV* in two subjects. Excluding these subjects from the analysis is justifiable given that subjects with uniform distributions of sD* and sV* should only show random errors in the estimates of sD* and sV* that should be uncorrelated. The presence of limited error may also contribute to the trend for stronger correlations between sD* and sV* in He-O2. Even if the physical relationship between sD* and sV* were equal between the gases, if the error is similar between the groups, higher correlations would be measured in the He-O2 data due to the higher spread in both sD* and sV* in some subjects of the He-O2 group (evident in Fig. 5).
Ventilation was positively correlated with the apparent net escape fraction for He-O2 but not for air. Based on our theoretical framework, this covariance could be partially responsible for the trend for closer relationships between ventilation and deposition in He-O2; the effect of sV* on sD* includes an effect of the net escape fractions so that a higher overall correlation between sV* and sD* could be caused by a correlation of sV* with the apparent escape fraction effects in He-O2 that are not present in air. This is also likely the reason why the relationship between sD* and sV* appears to follow a slope greater than unity in Figure 5 in He-O2.
Why might there be positive correlation between sV* and the apparent escape fractions? One could imagine that severely constricted airways might both collect aerosol and result lower subtended ventilation, resulting in a low apparent escape fraction and a low sV*. However, we could also expect reduced apparent escape fraction due to higher aerosol velocities with greater central impaction among lobes with higher ventilation. It is also unclear why this effect might only be detected in He-O2 but not in air. It may be that the signal is in fact present in air, but could not be discerned without the elevated variability in lobar sV* present in some of the subjects breathing He-O2.
The corr(sD*, sV*) weakened among subjects breathing at higher breathing frequency during nebulization fN in air but not in He-O2. One could postulate that this effect may have been caused by increased heterogeneity in central deposition driven by propagation of turbulence originating in extra-pulmonary or central airways during air breathing at high fN that were reduced during He-O2 breathing. However, unless it was masked by differences in peripheral retention, if this effect were present it should have been reflected in differences in the apparent escape fractions between the carrier gases. Yet Figure 4 shows the similarity in apparent escape fractions between the groups.
Additionally, there was no evidence of increased variability in the apparent net escape fractions among lobes with increased fN for either carrier gas. In fact, the parameter that seems to best organize the apparent escape fractions was the position of the lobe on the cranio-caudal direction;
This finding is also surprising; one would have expected the lower (more caudal) lobes, which tend to have more straight paths and less sharp turns than the upper lobes, should have had higher escape fractions than the upper lobes. It is possible, however, that because of the poly disperse nature of the aerosol used, the sharp turn could have selectively filtered larger particles to the lower lobes, elevating the respective escape fractions compared with the upper lobes.
Relationship among FVOL, sD*/sV* and fN is only present in the air group
The breathing frequency during nebulization strongly modulated the correlation of sD*/sV* and lobar inflation among subjects in the air group.(8) This was not the case in the He-O2 group. One hypothesis behind the finding in air is that there was reduced aerosol retention in those lobes that were more inflated; the greater the inflation, the less the degree of bronchoconstriction, the greater the airway diameters, and the longer time sedimentation would take to complete, while impaction becomes less likely in the less constricted airways. At higher breathing frequencies, the time that the aerosol has to sediment in the periphery is reduced, which lowers the retention of all lobes in the lungs. If this leads to lower overall retention among lobes, small differences in retention among lobes due to differences in inflation and in constriction of smaller airways could have generated greater differences in the relative retention
Together with a bias for lower deposition in the less inflated LLL due to a lower net escape fraction, this hypothesis begins to explain the strong relationship seen in air, although it is unclear why this signal disappeared in He-O2. Particle sedimentation with He-O2 is expected to be similar or slightly lower than in air3, and the impaction effects are also expected to be similar in the laminar flows of the periphery.(5) It should be noted that two of the three subjects that had a negative correlation of sD*/sV* and lobar inflation while breathing He-O2 were the subjects with lowest variability in sV and sD* and, in the presence of error in the deposition and ventilation estimates, the sD*/sV* ratio may not be very meaningful. Whether these subjects are included in the analysis, the strong modulation of breathing frequency during nebulization fN on the correlation seen in air was still not present in He-O2.
Methodological limitations
Limitations in the measurements of deposition and ventilation have been discussed at length in previous publications,(8) and the reader is referred to those works for a more complete discussion of these limitations. Several important points are important to reiterate for the comparison of breathing He-O2 and air: part of the variance in the apparent net branching factor includes measurement errors in both ventilation and deposition. In contrast, the apparent net escape fraction is exclusively determined from the deposition image, and thus not affected by possible errors in the estimates of ventilation. This may be, in part, the cause for stronger statistical differences between lobes in the apparent escape fractions (Fig. 4, right column). However, the effect of these potential measurement errors in ventilation was not high enough to prevent the strong correlation between sV* and sD* in helium seen at all breathing frequencies.
Even if breathing He-O2 reduced the heterogeneity in ventilation in some subjects, there are several potential reasons why the effect was not detected statistically in the present study. First is the large inter-subject variability in the distribution of sV* and sD* in bronchoconstricted subjects with asthma. As discussed above, these differences could have been reduced in a protocol designed with crossover measurements between air and He-O2 in each subject and with strict control of the breathing patterns. Differences in response between He-O2 and air reported in the literature have generally been smaller than the inter-subject differences measured for each gas (e.g., the data presented in Darquenne et al.(3)).
Therefore, even with a crossover protocol (as were used in limited studies with SPECT-CT14), very large group numbers would be required to show statistical differences between the gases. The large inter-subject variability observed implies limited clinical relevance unless ‘responders' can be readily identified a priori. Additionally, the mostly central deposition pattern observed in bronchoconstricted subjects may have limited the sensitivity to detect peripheral deposition; it is possible that if aerosol inhalation is conducted with a controlled breathing pattern conducive to a more peripheral deposition pattern (deep breaths with prolonged breath holds), or with smaller aerosols, significant differences could have been observed.
However, even when crossover design was used with a pattern of ventilation conducive to peripheral deposition, a variable response to He-O2 will likely still be present among subjects. In a SPECT-CT study,(14) only one of the two asthmatics subjects, and none of the healthy subjects, responded with a more uniform distribution of deposition with He-O2. This reinforces the importance of using CFD analysis to better understand why and who may or may not respond to He-O2.
The subjects included in the present study were young mild asthmatics who were challenged with a PC20 concentration of methacholine. It has been observed that the benefits of He-O2 for inhaled therapy are more prominent in both older subjects(25) and in those subjects with severe bronchoconstriction.(13) It is therefore possible that older and more severely constricted subjects could be better candidates for aerosol delivery with He-O2 than the young mildly asthmatic subjects studied here.
Finally, this study, along with the parallel study in air, focused on heterogeneous distribution of the aerosol among the lobes, and for this reason did not image the mouth, throat, and upper trachea. If helium oxygen has lower deposition in extra-pulmonary regions, it would not have been included in our PET images. In fact, if a greater fraction of larger sized particles reached the carina with He-O2, this would have resulted in an increase in central deposition within the PET field of view masking any preference of He-O2 for deeper deposition in relation to the total inhaled dose.
He-O2 can influence the size of the aerosols emitted from the nebulizer,(13.31–33) and potentially the rate of hygroscopic growth in the lung. Martin et al. 34 found that particle volume median diameter (VMD) at the exit of Aeroneb Solo vibrating mesh nebulizers used with a T piece was larger for medical air (VMD of 5.5 ± 0.1 μm) than for helium–oxygen (VMD of 4.3 ± 0.1 μm) when the gases were supplied without humidification. Darquenne et al.(3) have noted that greater hygroscopic effects can be expected with He-O2 than with air, and this is supported by the results of Martin et al.34 who found that, in the presence of humidified gases, size differences between air and He-O2 were smaller than for dry gases. Observed differences between gases were attributed to increased evaporation of nebulized droplets in He-O2 versus air between the nebulizer and laser diffraction measurement volume.(30)
In the present study, the output of the nebulizer-holding chamber setup was tested using laser diffraction (Helos/BF with Inhaler module; Sympatec GmbH, Germany) in dry gasses at the Air Liquide laboratories, and droplet size distributions were found not to be sensitive to the differences in the inhalation flow rate or carrier gas. This is very likely due to the significantly increased droplet concentration that results from use of the holding chamber. Just as humidification limited droplet evaporation in the Martin study,(30) use of the holding chamber in the present study increased droplet concentration to the extent that any small initial amount of evaporation from droplets rapidly saturated the surrounding gas phase, thereby limiting further evaporation.
Such effects resulting in negligible hygroscopic size changes have been well described for high concentration aqueous aerosols,(35) and mathematical models have predicted that only trivial differences in hygroscopic size changes within the lung occur between air and He-O2, for droplet mass fractions typical of pharmaceutical nebulizers.(36) As a result, it is unlikely that particles grew to a significant extent in the humid lungs in either He-O2 or in air.
We used radiolabeled isotonic saline to identify the deposition pattern in both groups. While other studies have included a bronchodilator in the aerosol,(22,23,25–30) the introduction of an agent that interacts with the ventilation pattern would have interfered with our ability to identify the actual ventilation distribution over the entire course of nebulization. Additionally, in contrast with other studies,(1,2,4,5,14) we did not control the breathing pattern of the subjects; in our measurements the subjects were allowed to breathe spontaneously at their chosen breathing frequency and tidal volume. This provided us with a span of breathing patterns that might be clinically expected, and the range of fN allowed us to observe the influence of breathing frequency during inhalation on other factors.
In summary, the present study could not detect systematic differences in the pattern of aerosol deposition within the lungs and airways of the group breathing He-O2 and the group breathing room air. The clustering of more lobes around average deposition in several subjects is balanced by increase heterogeneity in lobes with extremes ventilation and deposition in others. Amid conflicting reports, some studies have found that He-O2 has lower deposition in the mouth, throat, and upper airways, and greater deposition in the periphery.(1,4)
It has also been suggested He-O2 can homogenize ventilation and aerosol deposition among in bronchoconstricted subjects.5,37) The large variability among subjects precluded the significant detection of either effect between the two groups of young bronchoconstricted mild asthmatic subjects that were studied, and a number of additional limitations with the present work bound the conclusions that we can draw. However, the quantitative 3D distributions of aerosol deposition during He-O2 and air breathing, along with detailed anatomical and functional data collected in this work, may be used to validate CFD analysis on an individual basis. It is hoped that such validated and physiologically informed computational models will improve our understanding of how and for whom using He-O2 as a carrier gas for aerosol therapy may provide benefit.
Footnotes
Acknowledgments
Research reported in this publication was supported by the National Institutes of Health under award number R01HL68011. The content is solely the responsibility of the authors and does not necessarily represent the official views of the National Institutes of Health. Additional support was provided by American Air Liquide Inc., and Aerogen is thanked for providing the vibrating mesh nebulizers at no cost.
Author Disclosure Statement
This work was sponsored in part by American Air Liquide Inc. Ira Katz, Andrew Martin, and Georges Caillibotte were employed by Air Liquide during the execution of this study. Air Liquide sells helium-oxygen gas. However, the He-O2 mixture used in this study was purchased from Airgas and there was no undue influence of Air Liquide on the design of this study, the interpretation of its results, or on the preparation of this manuscript.