
Abstract
Abstract
Background:
While it is generally accepted that inertial impaction will lead to particle loss as aerosol is being carried into the pulmonary airways, most predictive aerosol deposition models adopt the hypothesis that the inhaled particles that remain airborne will distribute according to the gas flow distribution between airways downstream.
Methods:
Using a 3D printed cast of human airways, we quantified particle deposition and distribution and visualized their inhaled trajectory in the human lung. The human airway cast was exposed to 6 μm monodisperse, radiolabeled aerosol particles at distinct inhaled flow rates and imaged by scintigraphy in two perpendicular planes. In addition, we also imaged the distribution of aerosol beyond the airways into the five lung lobes. The experimental aerosol deposition patterns could be mimicked by computational fluid dynamic (CFD) simulation in the same 3D airway geometry.
Results:
It was shown that for particles with a diameter of 6 μm inhaled at flows up to 60 L/min, the aerosol distribution over both lungs and the individual five lung lobes roughly followed the corresponding distributions of gas flow. While aerosol deposition was greater in the main bronchi of the left versus right lung, distribution of deposited and suspended particles toward the right lung exceeded that of the left lung. The CFD simulations also predict that for both 3 and 6 μm particles, aerosol distribution between lung units subtending from airways in generation 5 did not match gas distribution between these units and that this effect was driven by inertial impaction.
Conclusions:
We showed combined imaging experiments and CFD simulations to systematically study aerosol deposition patterns in human airways down to generation 5, where particle deposition could be spatially linked to the airway geometry. As particles are negotiating an increasing number of airways in subsequent branching generations, CFD predicts marked deviations of aerosol distribution with respect to ventilation distribution, even in the normal human lung.
Introduction
T
In contrast, in the therapeutic management of respiratory diseases, the inhaled airstream is utilized to carry aerosolized drug particles into the lungs. However, the narrowed diseased airways can redirect the airstream, dramatically affecting intrapulmonary gas flow distribution patterns,(9) and alter the distribution of inhaled therapeutic particles within the lungs.(10) Therefore, it is important to determine the extent to which aerosolized particles actually move with the ventilation gas flow that carries them through the respiratory tract to advance our understanding of the deposition mechanisms of toxic and therapeutic particulate matter.
In vivo studies evaluating inhaled particle transport and deposition in the diseased human lung that have controlled pertinent aerodynamic parameters such as particle size and ventilatory flow are scarce.(10–12) An experimental scintigraphic study in asthmatics indicated the importance of both flow and particle size in determining the regional topographical airways deposition of inhaled particles and also showed dramatic reductions in the delivered lung dose without loss of therapeutic efficacy by utilizing uniform-sized aerosols.(10) However, scintigraphy poses a radiation burden to patients, hampering systematic investigations.(12) Alternative approaches using computational fluid dynamic (CFD) simulations suggest that aerosol particle distribution may not entirely match gas ventilation distribution across the segmental bronchi, even in healthy lungs.(13) Yet, the clinical applicability of CFD approaches is limited due to the lack of experimental data within a realistic airway geometry.
In this study, we developed an integrated theoretical and experimental lung model to address the central question of whether aerosols follow ventilatory gas flow distribution in man. To this end, we undertook 3D printing of a thin-walled hollow airway structure based on computed-tomographic imaging of the bronchial tree down to generation five. By embedding this physical cast in a tubing network leading to the five lung lobes, we aimed to deliver radiolabeled particles of uniform size (monodisperse) to assess the trajectory of the particles through these airways and beyond into the five anatomical lung lobes. Exacting control of particle aerodynamic size and breathing flow during the aerosol exposure experiments, and a detailed analysis of the scintigraphic images based on geometrical reference points, enabled a direct quantitative comparison with state-of-the-art large eddy CFD simulations in exactly the same 3D lung geometry.
Finally, the CFD simulations were also used to predict aerosol distribution patterns for a smaller particle size (3 μm) and to simulate gas versus aerosol distribution between lung units subtending from generation 5 airways.
Methods
Details of the airway model, the CFD model simulation parameters and scintigraphic image acquisition, and postprocessing are provided in the Supplementary Data. The digital airway contours of the 3D model, segmented from a CT of the bronchial tree from a young healthy female, merged with an average upper airway model(14) and its 2D projections are depicted in Figure 1. The terminal airways of the physical airway cast (Fig. 2) were each snugly fitted with silicone tubes of 1m length with a low-resistance bacterial filter (Microgard®II, Carefusion, SanDiego, CA; Niox®, Aerocrine, Morrisville, NC) sited halfway in the tube. All tubes led into individual entrance ports in a custom-built flow collector (EM Technik, Maxdorf, Germany) with one common exit port through which air was drawn using a suction pump (Andersen Samplers, Atlanta, GA).

The digital air space contours of the airway model.
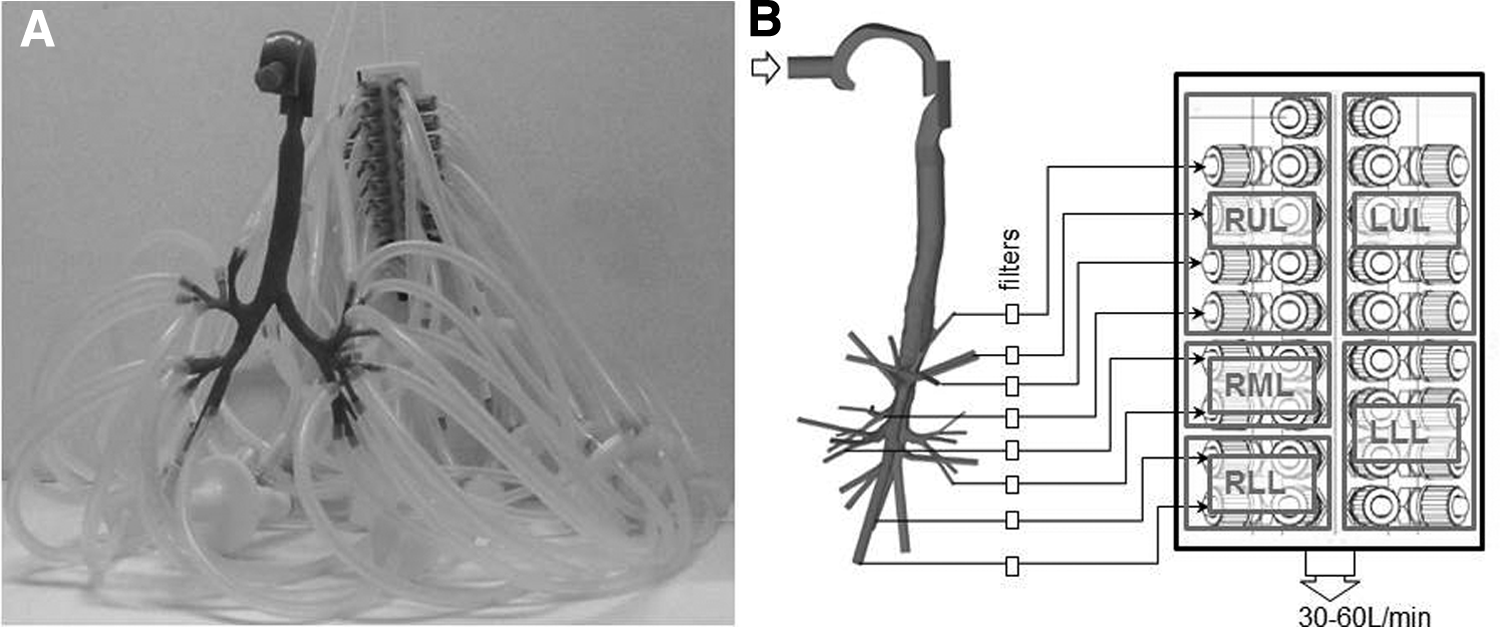
The airway model integration in the experimental setup.
To measure airflow through each of the terminal pathways, a flow meter (TSI4040, St. Paul, MN) was fitted between the downstream end of the low-resistance particle filter and the tube that connected it to the flow collector. On the flow collector, entrance ports were organized according to the lobar unit that the corresponding terminal airway belonged to (Fig. 2B). This facilitated grouping of tubes and filters for imaging of aerosol deposition per lung lobe after aerosol exposure of the cast.
For the aerosol exposure experiments, the tracheobronchial physical cast was attached to the reservoir of the spinning-top aerosol generator (STAG2000; BGI Instruments, Waltham, MA) through a 2-m straight tube. Monodisperse (geometric standard deviation <1.22) radioaerosols of 6 μm aerodynamic diameter were generated as previously described.(15) At each experiment, the suction pump was connected to the flow collector exit port to entrain air throughout the tracheobronchial cast at a constant flow of either 30 or 60 L/min. Following 5 minutes of aerosol exposure, the suction pump was halted and the terminal airway tubes were disconnected from the tracheobronchial cast.
As per arrangement on the flow collector (Fig. 2), the tubes and filters corresponding to the five individual lung lobes were placed in separate bags for scintigraphic imaging by carefully positioning these within the 400 × 540 mm gamma camera field of view. In this way, all aerosols exiting the model could be quantitatively linked to each of the five lung lobes. The tracheobronchial cast was also placed on the camera for a frontal scintigraphic view, and the camera heads were rotated by 90° for a lateral view. The experiments were repeated on separate days to achieve three sets of experimental data for each flow condition (30, 60 L/min).
The scintigraphic images of the cast were overlaid with the regions of interest, ROI1 to ROI5, which were scaled to the actual model geometry as depicted in Figure 1B and C. By summing the counts of ROI1, ROI2, and ROI3 and also the cumulative counts obtained on all tubes and filters, the total amount of aerosol that had entered the model was determined to serve as the total count to determine deposition rates of selected ROI.
In the same geometry of Figure 1, CFD simulations were performed. The fluid field was simulated using large eddy simulation as previously described,(14) and particle transport was calculated by numerically integrating the equation of motion of each particle, including the effect of drag and gravity. Throughout the airway structure, cross sections were defined at the entrance of each airway segment (indicated in Fig. 1A) to track aerosols entering and leaving each segment of the model. The cross sections were used to accurately compute all aerosol deposition data that could be obtained experimentally (for instance, distribution of aerosol toward left and right lungs or toward the five lobes).
We also compared the agreement between aerosol deposition patterns in the airway cast as measured by scintigraphy and simulated by CFD as follows. Particles deposited on the walls of the 3D model as computed by CFD were first projected on the two perpendicular planes corresponding to scintigraphic imaging. Then, particle count in each planar location was dispersed according to a dispersion function obtained by scintigraphic measurement of point sources inside the physical cast (Supplementary Fig. S4; Supplementary Data are available online at www.liebertpub.com/jamp).
Results
Figure 3 illustrates the resolution obtained with the scintigraphic maps of aerosol deposition in the physical cast; all experimental data are in the Supplementary Data (Supplementary Figs. S1 and S2). The five regions of interest based on the model contours (Fig. 1) were superimposed onto the frontal and lateral scintigraphic aerosol deposition images as a reference so that aerosol deposition at the glottis and in the airways could be clearly distinguished. The greater relative aerosol deposition in the oropharynx versus the airways in the case of inhalation flow at 60 L/min (Fig. 3B) versus 30 L/min (Fig. 3A) was also readily appreciated. The aerosolized particles that exited beyond the airway endings of the physical cast were collected in silicon tubes and filters. The tube and filters were grouped, according to the lung lobes that the airway endings belonged to, to quantify the particle mass distribution between the five lung lobes (five lower panels in Fig. 3).

Scintigraphic images of 6 μm particle deposition in the airways. Frontal and lateral views with the cast positioned as in Figure 1B, C, and five smaller images of the tubings and filters capturing all particles escaping the cast toward the LUL, LLL, RUL, RML, and RLL. The color scales of all panels in this figure relate to a logarithmic color scale with maximum value corresponding to the highest count rate in the image.
The CFD simulations provided a flow field of the gas (represented in Fig. 4A,B for 30 L/min) and the corresponding predicted deposition pattern of the 6 μm particles on the walls of the model (Fig. 4C). Projecting all the deposited particles of Figure 4C onto the frontal and lateral planes, and applying experimental point dispersion by scintigraphy, resulted in Figure 4D; Figure 4E provides the same representation for 60 L/min. This allows a visual appreciation of the level of agreement between experimental (Fig. 3A, B) and simulated (Fig. 4D, E) particle deposition patterns in the airway model. However, a quantitative comparison between all three experiments and each corresponding simulation for both flows can be inferred from the profiles in Figure 5. These profiles were obtained by summing all experimental or simulated counts at each linear distance between the top and bottom of the TB cast by scanning the image from the leftmost outline of ROI4 to the rightmost outline of ROI5 and dividing the counts at each linear distance by the total counts in the TB cast.
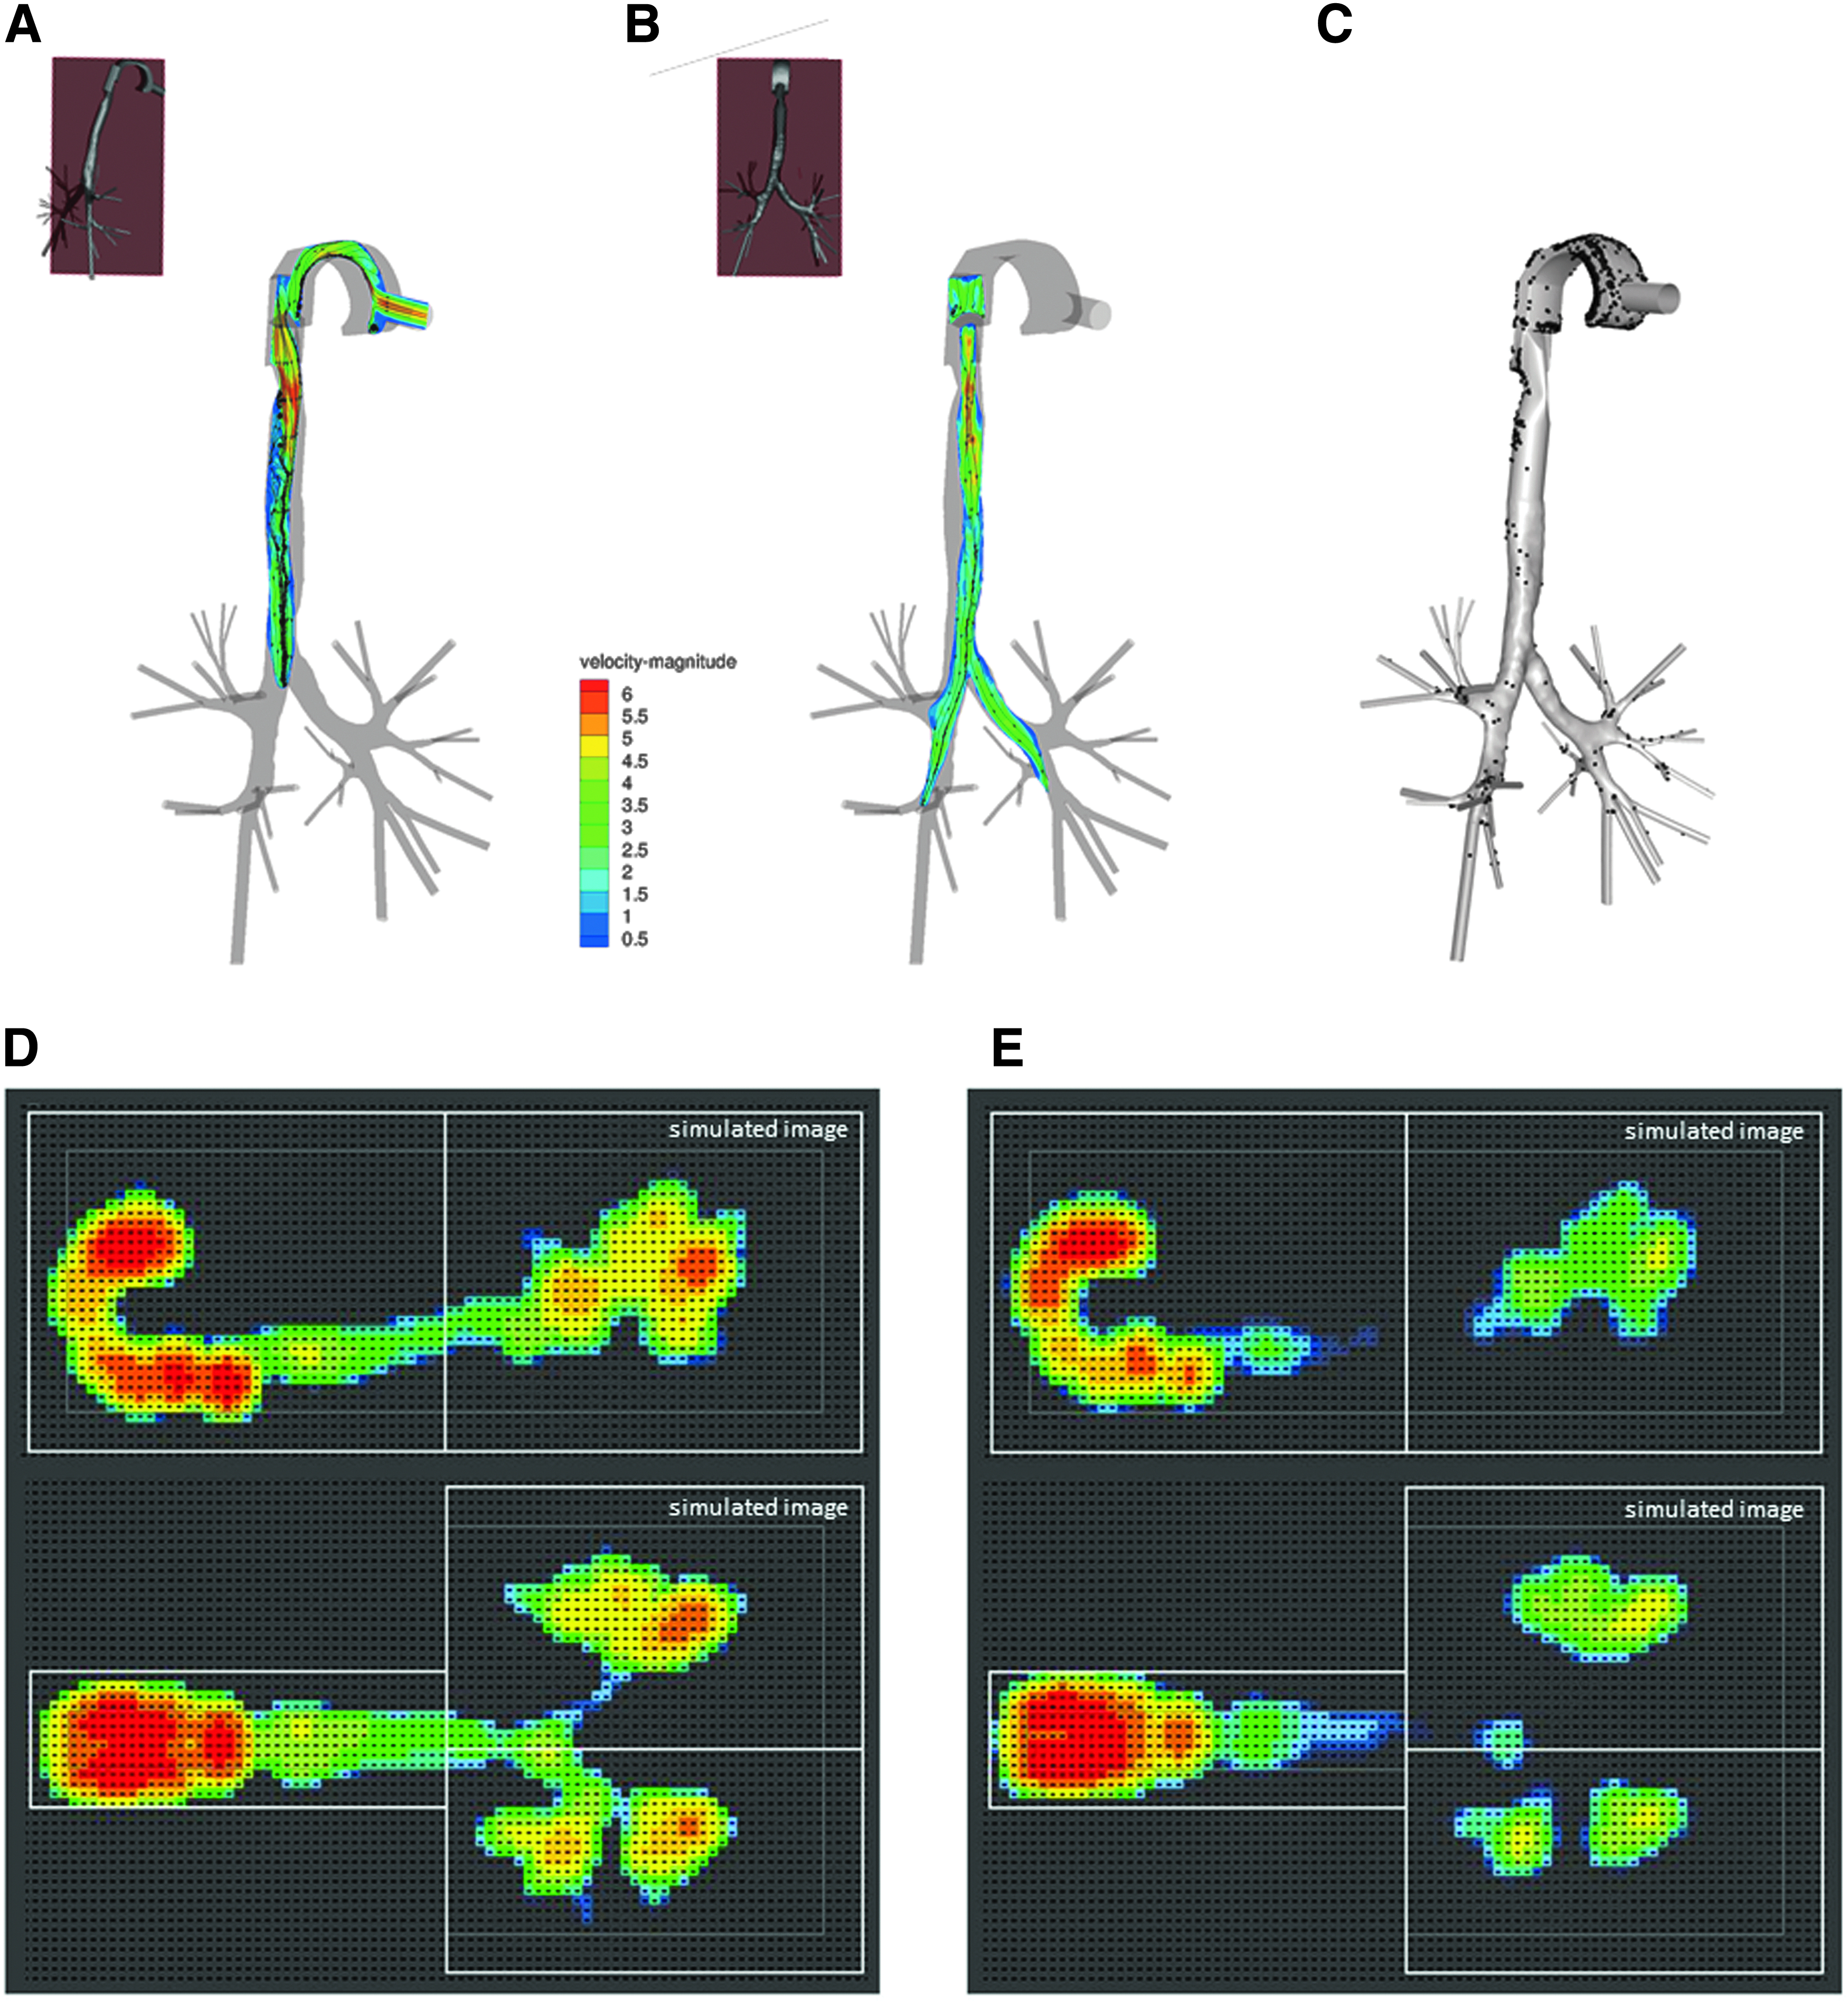
Illustration of simulated flow fields and particle distribution over the airway model at 30 L/min and simulated projections at 30 and 60 L/min.

Experimental and simulated normalized count profiles in the TB cast. Relative deposition is obtained by considering all counts at a linear distance between top and bottom of cast and dividing these by all counts in the model. Three experimental curves for 6 μm (three solid lines) and one simulated curve for 6 μm (dashed line) and for 3 μm (dotted line). (
Figure 5 also shows the profiles for 3 μm derived from the CFD-based images in Supplementary Figure S3. From the representation in Figure 5, it can be appreciated that irrespective of absolute deposition, a greater proportion of particles passes the oropharynx to deposit in the lower portion of the TB cast when comparing 3 versus 6 μm particles. This holds true for both flow rates.
The experiments and simulations were in agreement to show that the total aerosol deposition in the 3D model increased with increasing airflow from 30 to 60 L/min (experiment: 28% ± 0.2% [SD] to 69% ± 7% [SD]; simulation: 24% to 74%). In absolute values, particle deposition in the airways beyond the trachea (generation 1 to 5) was relatively low and very similar for both airflows (experimental values ranging 3.0%–3.5%; simulation data 5%–6%). However, since the number of particles remaining in suspension beyond the trachea also depends on flow, the resulting deposition efficiency of this airway compartment (generation 1 to 5) increased with increasing airflows from 30 to 60 L/min (by a factor 2.6 in experiments; a factor 3.1 in CFD simulations), as expected for particle transport dominated by inertial impaction.
Interestingly, at low airflows (30 L/min) through the model, aerosol deposition favored the airways of the left lung, resulting in a left-to-right (L/R) ratio of airway deposition above unity (experiment L/R: 1.35 ± 0.04 [SD]; simulation L/R: 1.30). Increasing airflow to 60 L/min led to a decrease in the L/R airway deposition ratio (experiment L/R: 1.16 ± 0.10 [SD]; simulation L/R: 1.20). Despite an L/R airway deposition ratio >1, the left lung received a smaller proportion of total aerosol mass (which includes particles in suspension and deposited) compared with the right lung. This is entirely consistent with the smaller portion of gas ventilation into the left lung. Indeed, both experiments and simulations were in agreement to show an L/R ratio of gas ventilation of 0.88 and a near identical L/R ratio of aerosol mass of 0.89 ± 0.02 (SD) (experimental) and 0.91 (simulation) at an airflow of 30 L/min. We also compared gas and aerosol distribution over the five lobes (Fig. 6), showing that between the lobes aerosol distribution is more or less in proportion to gas distribution, both in experiments and CFD simulations.
Experimental and simulated gas and aerosol distribution over the five lobes. Gas and aerosol distribution over LUL, LLL, RUL, RML, and RLL. Aerosol distribution also includes particles that got deposited in the airways leading to the corresponding lobe. (
Using only CFD and including also 3 μm particle size, we also investigated to what extent aerosol mass distribution diverged from gas ventilation distribution as it spreads over more airways in subsequent bronchial generations. This was quantified by considering the ratio of gas flow (as a percentage of total gas flow) to aerosol flow (as a percentage of total aerosol flow), Raer/gas, as suggested by Darquenne et al.(13); Raer/gas = 1 in a given airway represents a perfect match between aerosol mass flow distribution and gas ventilation distribution toward the lung units subtended by these airways. The individual Raer/gas values computed in each airway of subsequent bronchial generations between 2 and 5 are depicted in Figure 7, showing a progressive increase of Raer/gas variability with particle size and flow.
Simulated aerosol deposition and distribution in subsequent airway generations between generation 2 and 5. Deposition efficiency in subsequent generations (connected symbols) and the values obtained for parameter Raer/gas when relating aerosol distribution to gas distribution over each generation (see text for details). Open and closed symbols represent 3 and 6 μm particles, respectively. (
Switching off gravity in the CFD model did not affect any of the deposition or distribution parameters by more than 3%, consistent with the fact that under the experimental conditions of the study, the main contributing factor to the observed aerosol behavior was particle impaction and not sedimentation.
Discussion
We systematically investigated particle transport in the lungs using monodisperse aerosols of 6 μm since this particle size is common to the size range of aerosol drug formulations to treat the lungs and to that of the PM10 fraction; that is, the fraction of particulates in air smaller than 10 μm, employed when referring to adverse environmental particles considered injurious to the lung.(16) Our combined CFD and experimental data in a human airway structure show that those inhaled particles that are able to negotiate the oropharynx have an aerosol mass distribution between the five lung lobes roughly corresponding to their gas ventilation distribution (Fig. 6). Therefore, at the lobar level, inhaled aerosols essentially get carried away in proportion to the air flow as they become distributed between the different lung lobes.
In our normal human airway cast, experimental and simulated gas ventilation distribution (Fig. 6) was determined by the airway geometry since the only boundary condition (for experiments and simulations) was that pressure at all airway outlets was the same. This gas ventilation distribution is slightly different from that in two previous CFD models (Fig. 6), where mass flow imposed on the segmental bronchi was considered proportional to subtended segment volume from an anatomical study (left upper lobe [LUL]: 20%, left lower lobe [LLL]: 25%, right upper lobe [RUL]: 20%, right middle lobe [RML]: 9%, right lower lobe [RLL]: 26%)(13) or where the imposed mass flow distribution was based on CT-derived lobar volumes in one supine human subject (LUL: 15%, LLL: 35%, RUL: 13%, RML: 5%, RLL: 32%).(17) Despite these differences (Fig. 6), the smallest lobe (RML) generally receives the smallest portion of the inhaled air, and of the larger lobes, the lower lobes (LLL, RLL) tend to receive a greater portion of inhaled air versus the upper lobes (LUL, RUL), depending also on the orientation in the line of gravity.
In patients with chronic respiratory disease such as asthma, cystic fibrosis, or chronic obstructive pulmonary disease (COPD), clusters of diseased airways or parenchymal tissue can impair normal expansion of selected lobes. The same holds true for COPD patients undergoing lung volume reduction interventions,(18) where a lung lobe is either removed or deliberately blocked from the rest of the lung. In all the above pathologies, aerosolized drug therapy is utilized for treatment, and we suggest that redistribution of drug particles will follow the redistribution of gas ventilation over the lung lobes. A confounding factor in lung disease, which can be studied with the same methodology described here, is how local airway obstruction modifies flow fields, potentially causing additional turbulent eddies affecting local aerosol transport and deposition.
The question of whether inhaled aerosol particles distribute over the lung units in proportion to the airflow distribution over these same units is difficult to study directly in vivo since this requires both computed tomographic imaging to accurately define the anatomical contours of ventilated lung units and single-photon emission to image gas and aerosol distribution between these units.(19) At the lobar level, no such gas or aerosol distribution data are currently available in healthy subjects or patients with respiratory disease. In vivo imaging data of gas ventilation and aerosol mass distribution between the left and right lungs do exist,(20–23) showing that the preferential particle transport toward the right lung tracks the preferential gas transport toward the right lung.
However, not all CFD simulations agree to reproduce this experimental result. For instance, a recent CFD simulation study of particles greater than 2.5 μm predicted an L/R ratio of lung aerosol distribution greater than 1, despite a gas ventilation L/R ratio of less than 1.(17) The authors referred to specific glottal vortices in their particular model geometry to interpret their CFD result,(17) and possibly the cross-sectional left main bronchus/right main bronchus (LMB/RMB) ratio of the model (which was only 55% vs. 70%–85% used by us and others) could also have contributed to this paradoxical L/R result. Another CFD simulation study in a bronchial airway model without oropharynx(13) did not report particle deposition in the airways, but observed that aerosols roughly followed gas flow, implying an L/R ratio of aerosol distribution smaller than 1.
Our CFD could be confirmed with experimental data in exactly the same geometry, also obtaining an aerosol distribution L/R <1, in agreement with the in vivo imaging data in normal subjects. Hence, we conclude that in a human lung with normal oropharyngeal and bronchial airway features, the distribution of aerosol mass (the sum of particles depositing within the model and those that exit airway generation 5) roughly follows gas ventilation distribution toward the left and right lungs. The deposition of 6 μm aerosols was greater in the airways of the left lung compared with the right, which is largely due to the LMB being more curved and of a smaller lumen cross section than the RMB (in our cast, cross-section ratio LMB/RMB ∼70%).
The large eddy simulation CFD model showed that from airway generation 3 onward, there was considerable divergence between the aerosol mass distribution and gas ventilation distribution (Fig. 7). The deviation of Raer/gas values from 1 was greater as particle size and aerosol flow increased and the airway belonged to a higher branching generation. This confirms the observation by Darquenne et al.(13) that impaction is the main cause of a heterogeneous aerosol loss along the airways such that aerosol distribution is no longer in proportion to gas distribution in segmental bronchi (which covered branching generations 3–8 in their model).
Translating this finding to the clinical scenario, the treatment of patients with inhaled aerosolized treatment delivered to airways beyond generation 5,(24,25) may have inconsistent therapeutic responses since aerosol distribution can no longer be directly related to ventilation distribution as is usually assumed in empirical prediction models.(26) In this scenario, a novel personalized treatment approach(27) based on mapping of the obstructed airways coupled with a reliable CFD simulation method could be employed to circumvent a localized aerosol supply problem in such patients. Ideally, this would incorporate data on the patient's gas ventilation distribution either assessed by a ventilation imaging modality(28) or estimated from noninvasive tests.(29) Our model allows flexibility, where downstream resistances can be introduced on selected airway tubes in our physical cast to replicate patchy gas ventilation distribution in patients and thereby allow the resulting aerosol redistribution to be studied in a variety of airway diseases.
Limitations of the study
Before initiating this study, we accepted two limitations to keep radiation exposure (dose and duration) during experimental handling to a minimum: we did not image each tube and filter attached to each generation 5 airway separately, and we chose to image by planar imaging in two perpendicular planes instead of full SPECT. Despite these limitations, the principles of the present study could inform similar studies with alternative imaging techniques such as magnetic resonance or fluorescence imaging where this limitation can be avoided. If only the distribution beyond the cast is relevant, chemical assays on tubes and filters may even suffice.
We did not attempt to coat the TB cast inner walls, which may have led to some aerosol particles bouncing off the wall in experiments, whereas the CFD simulations assume a trap boundary condition. In this sense, the comparison of absolute deposition values (that were expected to be low anyway) should be interpreted with caution. However, the main aim of the present study was relative aerosol deposition and distribution in and beyond the cast, which should have been affected less by this limitation. Another intrinsic limitation of the study design is the lengthening of the terminal airways to allow steady boundary conditions for CFD; since these were also incorporated in the physical cast, simulated and experimental deposition efficiency of generation 1–5 may not correspond to that which would be obtained if an additional branching generation were added.
Finally, we only considered a constant inhalation flow in a model with a fixed-orifice glottis, which may not entirely reflect the situation in a normal breathing human subject. However, it did meet our main study goal to render the experimental and CFD simulation condition as similar as possible. Once validated in this way, CFD simulations can be made to include conditions that are almost impossible to obtain experimentally.
In conclusion, we show here that particle distribution over the lung lobes roughly follows the corresponding gas ventilation distribution in a normal human airway structure. By combining aerosol imaging experiments and CFDs in a realistic 3D printed hollow cast, the scintigraphic images of aerosol deposition also revealed loci of disproportionately high particle deposition in distinct geometrical locations under different flow conditions. The CFD model was also used to explore to what extent aerosol distribution deviated from gas distribution across an increasing number of smaller airways in branching generations up to 5.
Footnotes
Acknowledgments
This project was supported by the Fund for Scientific Research-Flanders (FWO-Vlaanderen, Belgium), a VUB Concerted Research Action grant, and the National Institute for Health Research (NIHR) Respiratory Disease Biomedical Research Unit at the Royal Brompton and Harefield NHS Foundation Trust and Imperial College London. Dr Omar S Usmani is a recipient of a UK NIHR Career Development Fellowship.
Author Disclosure Statement
No competing financial interests exist.
References
Supplementary Material
Please find the following supplemental material available below.
For Open Access articles published under a Creative Commons License, all supplemental material carries the same license as the article it is associated with.
For non-Open Access articles published, all supplemental material carries a non-exclusive license, and permission requests for re-use of supplemental material or any part of supplemental material shall be sent directly to the copyright owner as specified in the copyright notice associated with the article.