
Abstract
Abstract
Background:
Intranasal delivery protocols that can effectively deposit drugs to the olfactory region are severely lacking. Furthermore, it is still challenging to quantify nasal deposition on a regional or local basis, which is crucial in assessing the performance of targeted olfactory drug delivery.
Objectives:
To visually and quantitatively compare drug depositions in the nose and olfactory region with normal and bidirectional breathing patterns with vibrating mesh and jet nebulizers.
Methods:
A sectional nose cast was developed based on an anatomically accurate nasal airway model to visualize deposition patterns and quantify regional doses. Sar-Gel was used to visualize the deposition pattern inside the nose and the delivered doses were measured using a high precision scale. Numerical modeling was performed to understand the underlying mechanisms in both the normal and bidirectional deliveries.
Results:
Results show that the bidirectional technique yielded higher deposition in both the nasal cavity and the olfactory region for both nebulizers. However, the vibrating mesh nebulizer was found to be more responsive to the bidirectional breathing and elicited more increase in the olfactory delivery than the PARI Sinus. The deposition patterns under the bidirectional breathing are highly different between the two nasal passages, with more dispersed distributions in the nasal passage with exiting flows. For both nebulizers, reducing the inhalation flow rates increased the nasal dose, but decreased the olfactory dose, which was consistent between in vitro measurements and numerical simulations.
Conclusions:
The bi directional technique with a vibrating mesh nebulizer is recommended for both nasal systematic and olfactory drug deliveries. The Sar-Gel based method in combination with sectional nasal casts appears to be a practical approach to visualize local depositions.
Introduction
T

Olfactory region and nasal airway model.
The complex structure of the nasal cavity makes drug delivery to the olfactory region a challenging task. In addition, mucus lines the inner wall of the nose and serves as an obstacle for the direct nose-to-brain drug delivery. The nasal valve, which is a flow-limiting area in the upper airway, filters out most inhaled drug aerosols due to its minimum cross-sectional area within the nose. Unwanted drug loss into the lungs can be another issue for the olfactory drug delivery. With standard intranasal delivery methods, significant portions of administered drugs can enter the lungs with inhalation air flows if particles are small and inertial depositions are limited. During inhalation, the nasopharynx remains open as the rear portion of the soft palate flips downward. The unwanted lung doses can adversely affect both the lungs and the liver as a result of entering the blood stream through the lungs.
To address this issue, Djupesland et al.(6) proposed a novel delivery method termed as the bidirectional delivery technique. This technique takes advantage of the soft palate's natural tendency to close the nasopharynx during an exhalation through the mouth. A dose of medicine is administered into the nose by having the patient blow into the delivery unit to trigger the release of drug particles.(6,7) Because the soft palate blocks the nasal cavity from the mouth during drug delivery, particles will enter one nostril, sequentially travel through the two nasal passages, and exit through the other nostril (Fig. 1b). This process gives the drug particles more time in the nose and possibly enlarges the nasal cavity due to higher flow resistance. More importantly, the uplifted soft palate restricts the particles within the nose, thereby eliminating the issue of lung contamination.(6) It has been demonstrated that the bidirectional delivery system reduced the dripping in the nose and increased drug deposition at the top portion of the nasal cavity in comparison to standard nasal devices such as dry powder inhalers (DPI) and nebulizers.(8–10)
Particle deposition patterns are highly sensitive to the anatomical details of the nasal cavity, which dictate the airflow field and particle motions in the nose. Developing an anatomically accurate nasal airway model is the first critical step to obtain reliable in vitro experimental results. The nasal cavity is characterized by convoluted nasal passages and narrow meatuses, which have been measured as 2.0–4.0 mm in the middle meatus and 1.5–2.0 mm in the superior meatus.(11,12) The olfactory region is located at the uppermost part of the superior meatus and the airway width is even smaller, ∼1.0 mm.(13) These narrow intricate passages result in unique nasal aerodynamics, with the majority of inhaled air going through the median passage and only a small portion being ventilated to the superior meatus and olfactory region.
A biological implication of such a flow partition is that only a limited amount of inhaled particles can penetrate into the olfactory region, which should be low enough to protect the delicate olfactory nerves and high enough for the nerves to sense the smell.(14) An unrealistic model geometry of the nasal airway, especially in the superior meatus and nasal valve region, could lead to artificially higher deposition in the olfactory region.
A key aspect in studying olfactory delivery is to accurately determine where the drug particles deposit and how many particles reach the target. The characterization of particle deposition in both the distribution and dosage can be achieved by computational modeling,(15–19) in vitro experiments,(20–22) and in vivo gamma scintigraphy or SPECT/CT.(7,23,24) Computational fluid-particle dynamics (CFPD) simulations have been widely adopted in the past decade to investigate respiratory aerosol dynamics. With the help of CFPD simulations, it becomes feasible to examine the details of airflow and particle trajectories in complex structures like human noses and lungs, which are difficult to observe in experiments or life conditions. The in vitro experiments use human nasal cavity replica models and provide viable means to verify or calibrate computational predictions, as well as to mimic in vivo bioavailability of administered medicines. Gamma scintigraphy with Technetium-99 m (99m Tc)-labeled particles is a popular imaging technique in nasal and pulmonary drug delivery studies.(25–27) The images captured by the gamma camera visualize the deposition patterns that are represented by a color gradient in the respiratory airway, with a more intense level of color corresponding to more deposition in that particular area.(21)
However, gamma scintigraphy does have several drawbacks that motivate researchers to explore other alternatives.(28–30) As an alternative, Kundoor and Dalby(21) proposed to use Sar-Gel (Sartomer Arkema Group, Exton, PA) to qualitatively visualize the particle deposition patterns, which is a water-reactive paste that changes color from white to a crimson or purple when it contacts moisture.(26,31) Studies demonstrated that Sar-Gel had a high sensitivity to droplets from nasal sprays and nebulizers and reacted with water volumes as low as 0.5 μL.(21,31)
Recently, Xi et al.(32) visualized the deposition patterns from different types of nasal spray pumps and nebulizers in a sectional nasal cast. A Sar-Gel image is composed of varying color depths, which represent the distribution of deposited vapor mass. In this study, a colorimetry method was developed to quantify the droplet deposition based on the color depth of the Sar-Gel images.(32) The combined ease of application, sensitivity, and simple image processing suggest that Sar-Gel can serve as an alternative to more expensive imaging techniques like gamma scintigraphy.
The objective of this study is to test the feasibility of standard nebulizers for olfactory delivery in an image-based adult nasal airway model. Two delivery techniques (normal and bidirectional) and two types of nebulizers (vibrating mesh and jet) will be tested under three inhalation conditions. The deposition pattern will be visualized using a color-based method (Sar-Gel) and the delivered doses will be measured using a high precision electronic scale. Complementary CFPD simulations will be conducted to gain insights into the differences in flow and aerosol dynamics between the normal and bidirectional techniques.
Materials and Methods
Nasal cast
A multisectional, 3D printed nose cast model was used to perform each experiment. The nose cast was developed from a nasal airway geometry that had been reconstructed from MRI scans of a 53-year-old male. The nose cast had a uniform wall thickness of 4 mm and a detail size of 0.1 mm, which is the level of the geometrical detail retained in the hollow cast. An in-house 3D printer (Stratasys Objet30 Pro, Northville, MI) was used to build the nose cast replicas. The material is polypropylene (Veroclear, Northville, MI), which is transparent and rigid, and the layer thickness is 16 μm, leading to a smooth surface.
The nasal airway cast consisted of three major components: the left side of the nasal cavity, the right side, and the nasopharynx connecting the two together that leads down to the throat. There was a step-shaped groove at the ends of each cast parts for good sealing and easy assembly. Splitting the right nasal passage into two parts reveals the nasal turbinate structure and allows direct visualization of the deposition pattern within the right nasal passage. To measure the olfactory doses, the regions representing the olfactory mucosa were separated from the nose cast, as shown in Figure 1c.
In vitro experiment design
A vibrating mesh nebulizer (Drive Voyager Pro) and a jet nebulizer (PARI Sinus) were used to conduct each test. The brochures of the Voyager Pro and the PARI Sinus listed their droplet size ranges as 1–5 μm and 3.2 μm, respectively. The PARI Sinus has a secondary pulsating flow of 45 Hz frequency with an amplitude of 24 mbar, and was designed specifically to deliver drugs to paranasal sinuses.(26) Albuterol sulfate was used as the model drug with a concentration of 0.1% w/v. In this study, a rectangle-shaped nozzle was used to guide the nebulized aerosols into the nasal cavity.
To simulate the normal intranasal drug delivery, a vacuum was connected to the nasopharynx of the nose cast. The nebulizer was introduced into the right nostril and the left nostril remained untouched (Fig. 1b). To visualize the aerosol deposition pattern, Sar-Gel was spread evenly with a gloved fingertip to the inner surfaces of the nasal cast. These include the nasal septum and turbinate surfaces in the right nasal passage, which was cut open to reveal the turbinate structures (Fig. 1). For the convoluted passages (meatuses) that were not accessible to the fingertip, no Sar-Gel was applied. This inaccessibility of Sar-Gel, however, will not affect the visualization result of aerosol deposition because these convoluted meatuses are also visually hidden.
In an attempt to provide an even coating on the inner surface of the nasal airway cast, excess Sar-Gel was wiped away. A photo of the nose cast with Sar-Gel was taken immediately after the drug administration. Control trials were also performed by exposing the Sar-Gel-applied casts to the ambient air. No discernible variation in the Sar-Gel color was observed within 5 minutes, which is longer than the time needed to complete one test. This observation was corroborated by Kundoor and Dalby,(21,31) who also reported that Sar-Gel was not very responsive to the moisture in the ambient air. To quantify the nasal and olfactory deposition rates, the nose cast was measured before and after drug administration without Sar-Gel using a high precision scale. Detailed procedures will be described in the following section.
In the bidirectional tests, the back of the nasopharynx was sealed to simulate the airway closure by the soft palette during exhalation. The hollow cast of the right nasal passage was cut open along its top ridge to reveal its internal structures, as illustrated in Figure 1c, while the left nasal passage kept intact, considering the technical complexity in precisely cutting the cast model. As a result, to study the deposition in the first passage, a “right in, left out” mode was adopted by releasing nebulized aerosols to the right nostril and connecting the vacuum to the left nostril. Conversely, to study the deposition in the second passage, a “left in, right out” mode was used by releasing aerosols to the left nostril and connecting the vacuum to the right nostril. The diagram of bidirectional delivery is shown in Figure 1b.
Deposition test procedures
The schematic diagram of intranasal deposition test is shown in Figure 2. There are three steps: drug delivery testing, deposition rate and deposition pattern analysis, and cast cleaning dehumidification. A vacuum (Robinair 3 CFM, Warren, MI) was connected to the nasopharynx to simulate the inhalation, and the volumetric flow rate was monitored by an in-line flow meter (FL-510; Omega, Stamford, CT). To measure the aerosol deposition, the weight of the nasal cast (W0) was first measured using an electronic scale (Sartorious, 0.01 mg precision, Elk Grove, IL). It was then connected to the delivery apparatus. Drug aerosols were administered into the left nostril for a specified period of time at an orientation of 60° from the horizontal direction.(21) The new weight of the cast was measured immediately after the drug administration (W1). The difference (ΔW = W1 − W2) gave the weight of deposited aerosols, and the deposition rate was calculated as the ratio of ΔW to the spray/nebulizer output. After each test, the cast was dried in an oven (Thermolyne Furnatrol 18200, Dubuque, IA) set at 55°C for 60 minutes. The cast was then removed from the oven and left for an additional hour to allow the cast to become fully equivalent to the environment in temperature and humidity. Each measurement was repeated five times for statistical analysis.

Schematic diagram of the intranasal deposition test. There are three steps:
Statistical analysis
Minitab 17 analysis software (State College, PA) was used to analyze deposition results to determine the importance of different factors. One-way analysis of variance (ANOVA) and Tukey's method with stacked data were used to evaluate the sample variability. Results were presented as mean ± standard deviation. A difference was considered statistically significant if p-value was <0.05.
Numerical methods
Incompressible and isothermal airflow was assumed in this study, with steady inhalations. The Low Reynolds Number k − ω turbulence model was used to resolve the airflow field.(33) Particle trajectories were computed using the Lagrangian tracking scheme. The particle diameter considered in this study was 3.2 μm, which is typical of the vibrating mesh nebulizer output.(34,35) The simulations of airflow and particle dynamics were conducted using ANSYS Fluent (Canonsburg, PA). In our previous studies, the UDF-enhanced Lagrangian model with near-wall interpolation algorithm(36) has been shown to provide good agreement with in vitro measurements in human airways for both micrometer particles(37,38) and nanoparticles.(39) The total and subregional deposition fractions (DF) are defined as the ratio of particles depositing in the whole region or a specific subregion over the total number of particles entering the nose.
Results
Depositions with normal and bidirectional techniques
Figure 3 displays the deposition patterns in the right nasal passage using two types of nebulizers by releasing aerosols for 20 seconds. The flow rate was 18 L/min. With the normal delivery method, the mesh nebulizer appears to target the middle turbinate region, whereas the PARI Sinus nebulizer gives a more dorsal deposition pattern toward the olfactory region. This difference is due to the slightly higher speeds of aerosols exiting from the PARI Sinus nebulizer, as indicated in Figure 2b. Aerosols generated by both the mesh and PARI Sinus are soft mist and have much lower speeds than those from the ultrasound or traditional jet-typed nebulizers.(32) However, the aerosols from the mesh nebulizer appear to be even slower than those from the PARI sinus, which is a jet-typed nebulizer.

Deposition pattern for the mesh (Voyager Pro) and PARI Sinus nebulizer with
Therefore, aerosols from the PARI Sinus nebulizer possess a larger inertia that helps them penetrate deeper into the dorsal nasal passage. This higher inertia also renders the particles to be less dependent on the nasal airflows, as shown by the similarity of the PARI deposition patterns between the normal and bidirectional methods (Fig. 3a vs. b). Under the bidirectional delivery, both nebulizers gave an improved olfactory deposition (Fig. 3b). Particularly, the bidirectional technique delivered apparently more aerosols to the dorsal turbinate region with the mesh nebulizer (Fig. 3a vs. b). The mesh nebulizer appeared to deposit more droplets in the olfactory region than the PARI Sinus nebulizer (Fig. 3b); however, this difference is insignificant.
Figure 4 shows the deposition images of the five trials using the PARI Sinus nebulizer under bidirectional breathing conditions. The dose range was 5.2 ± 2.1 mg under the standard delivery and 8.0 ± 2.4 mg under the bidirectional delivery. Despite the slightly different distributions of aerosol deposition, the general patterns among trials are similar, with all having a dispersed pattern and aerosol accumulations in the nasal valve and anterior turbinate. Therefore, the performance of PARI Sinus was consistent and the results fall within reasonable uncertainties.
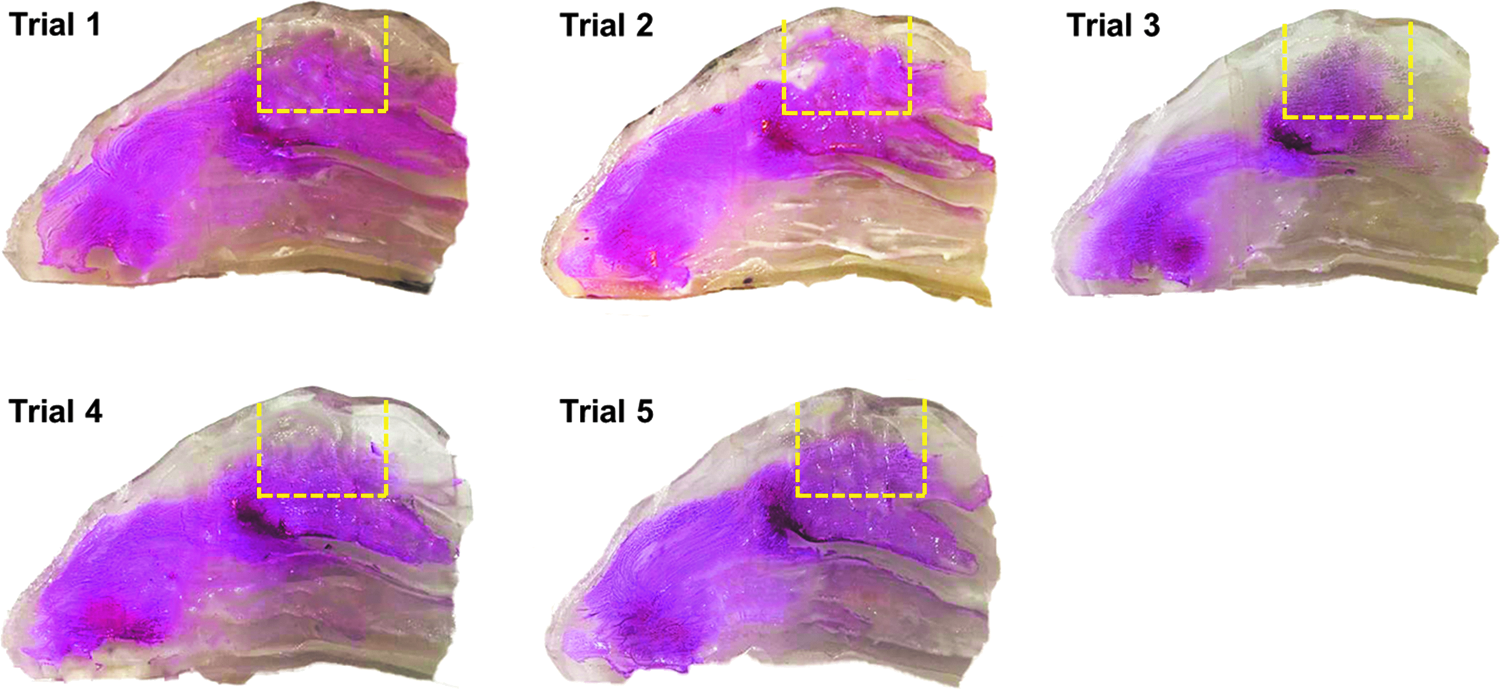
Deposition patterns of five trials for the PARI Sinus nebulizer with the bidirectional delivery protocol. Color images available online at www.liebertpub.com/jamp
The comparison of nasal and olfactory doses between the normal and bidirectional delivery techniques is shown in Figure 5. The aerosol releasing time is 20 seconds for both the mesh and PARI nebulizers. The results are presented as the mean ± SD from five trails. Overall, the bidirectional technique yielded higher depositions in both the nasal cavity and the olfactory region compared to the normal technique. It is interesting to see from Figure 5 that PARI Sinus performs better in delivering more doses to the vestibule-turbinate and olfactory regions with the normal delivery method, while the mesh nebulizer is better with the bidirectional technique.
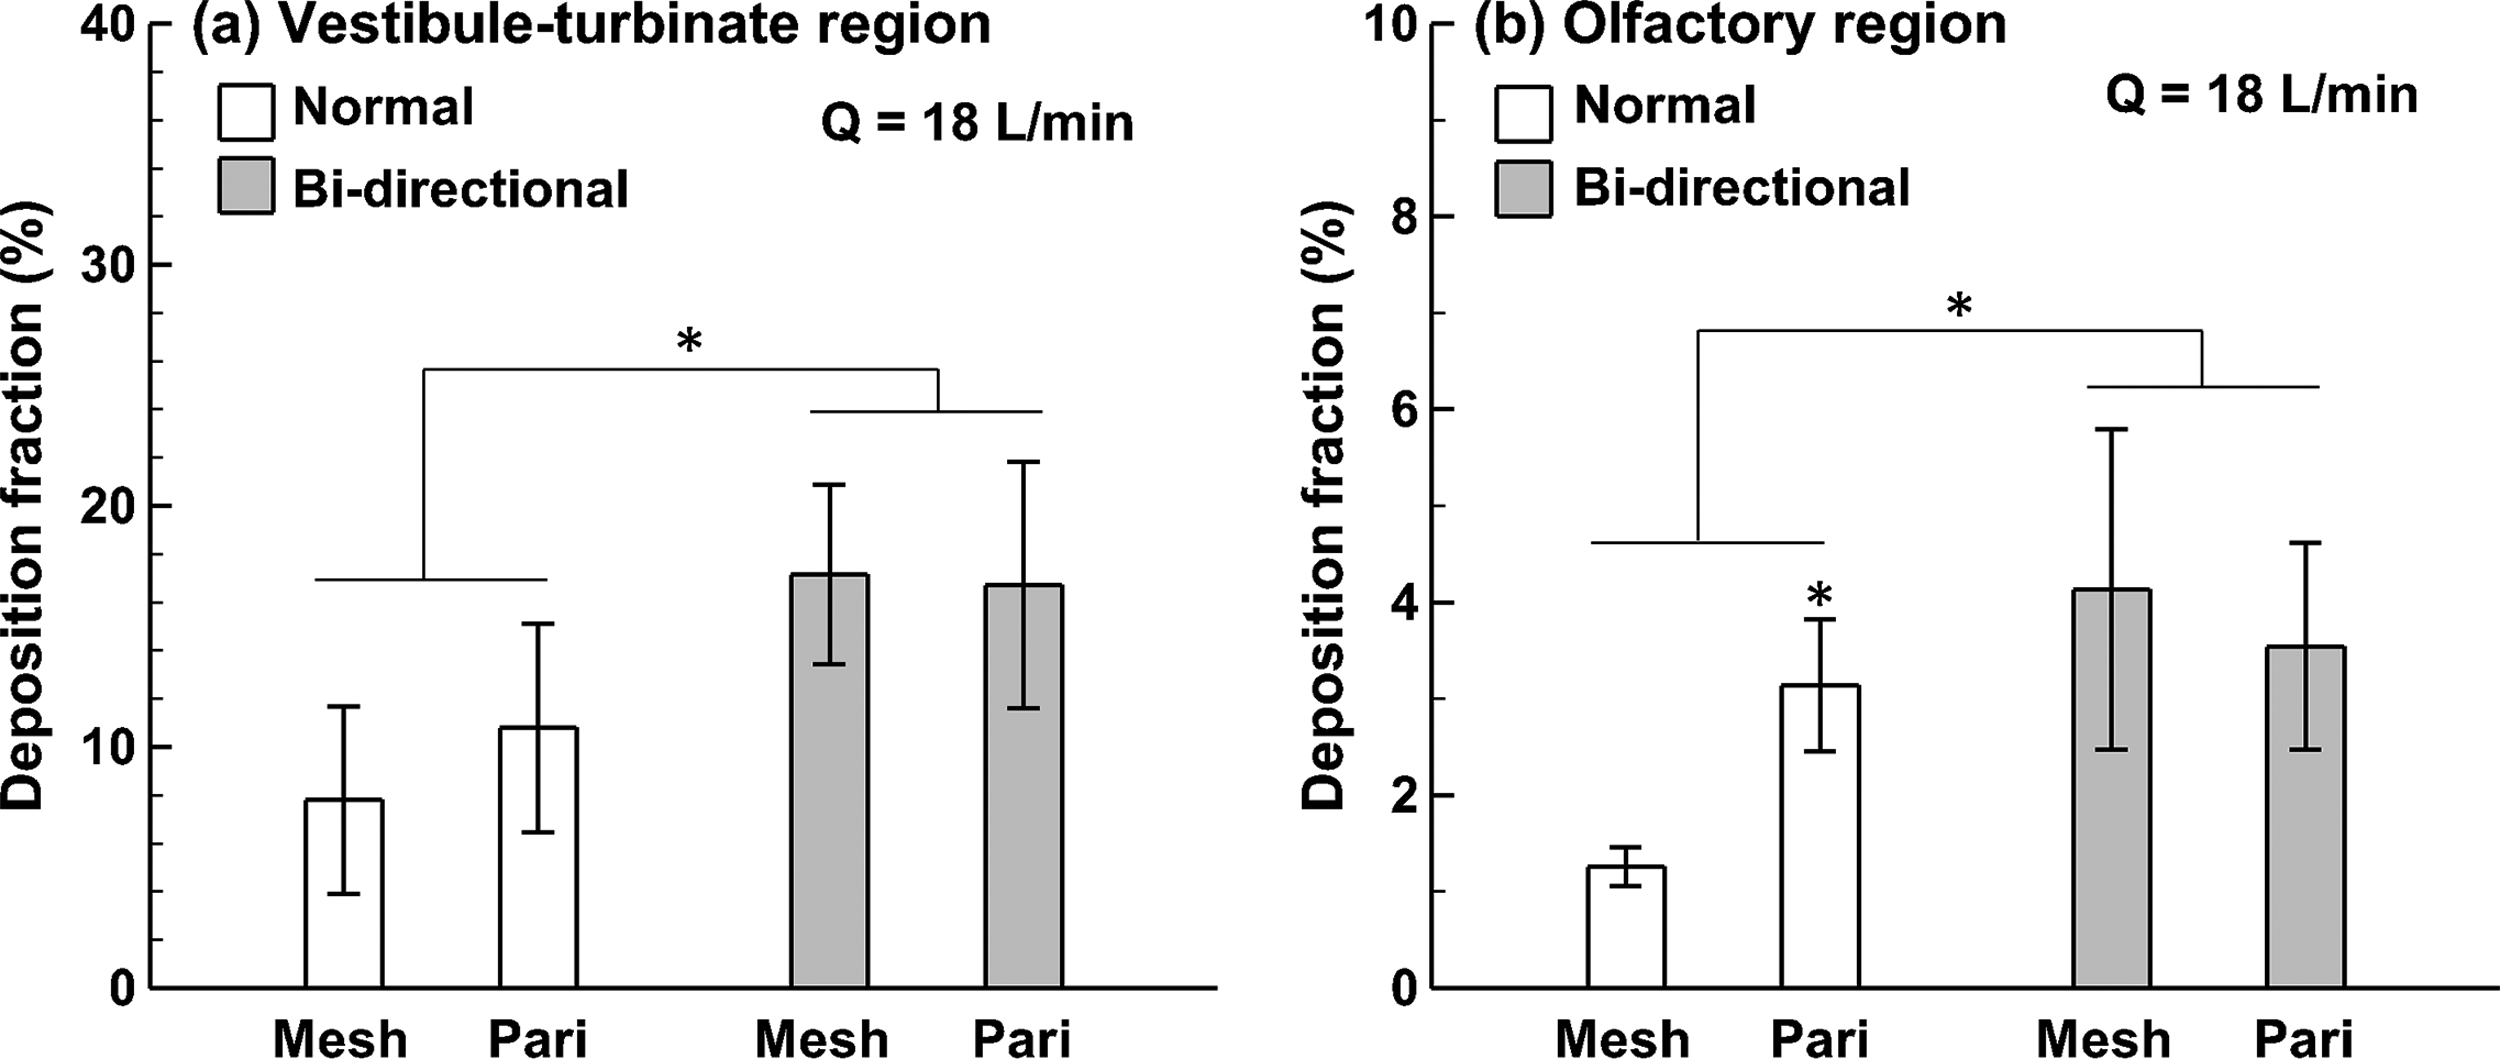
Comparison of DFs between normal and bidirectional delivery protocols using two nebulizers for 20 seconds in
When comparing the effect of the nebulizer type on deposition enhancements using the bidirectional technique, significantly improved depositions were attained with the mesh nebulizer in both the nasal cavity and the olfactory region (Fig. 5). In contrast, such improvement was relatively small with the PARI Sinus nebulizer, and was even smaller in the targeted olfactory region. Regarding the mesh nebulizer, there was a factor of 2.2 increase in the nasal cavity and 3.3 in the olfactory using the bidirectional technique. In contrast, the increase factor was 1.5 and 1.2 for the PARI Sinus (jet) nebulizer in the nasal cavity and olfactory region, respectively.
Figure 6 compares the DF in the vestibule-turbinate and olfactory region between the normal and bidirectional breathing patterns at different inhalation rates. Three flow rates were considered (6, 12, and 18 L/min) with the mesh nebulizer. Again, the bidirectional technique delivers much higher doses than the normal technique in both the vestibule-turbinate and olfactory region for all inhalation flow rates considered. Regarding the vestibule-turbinate region, the measured dose decreases with increasing inhalation rates. In contrast, the dose in the olfactory region increases as the inhalation rate increases.
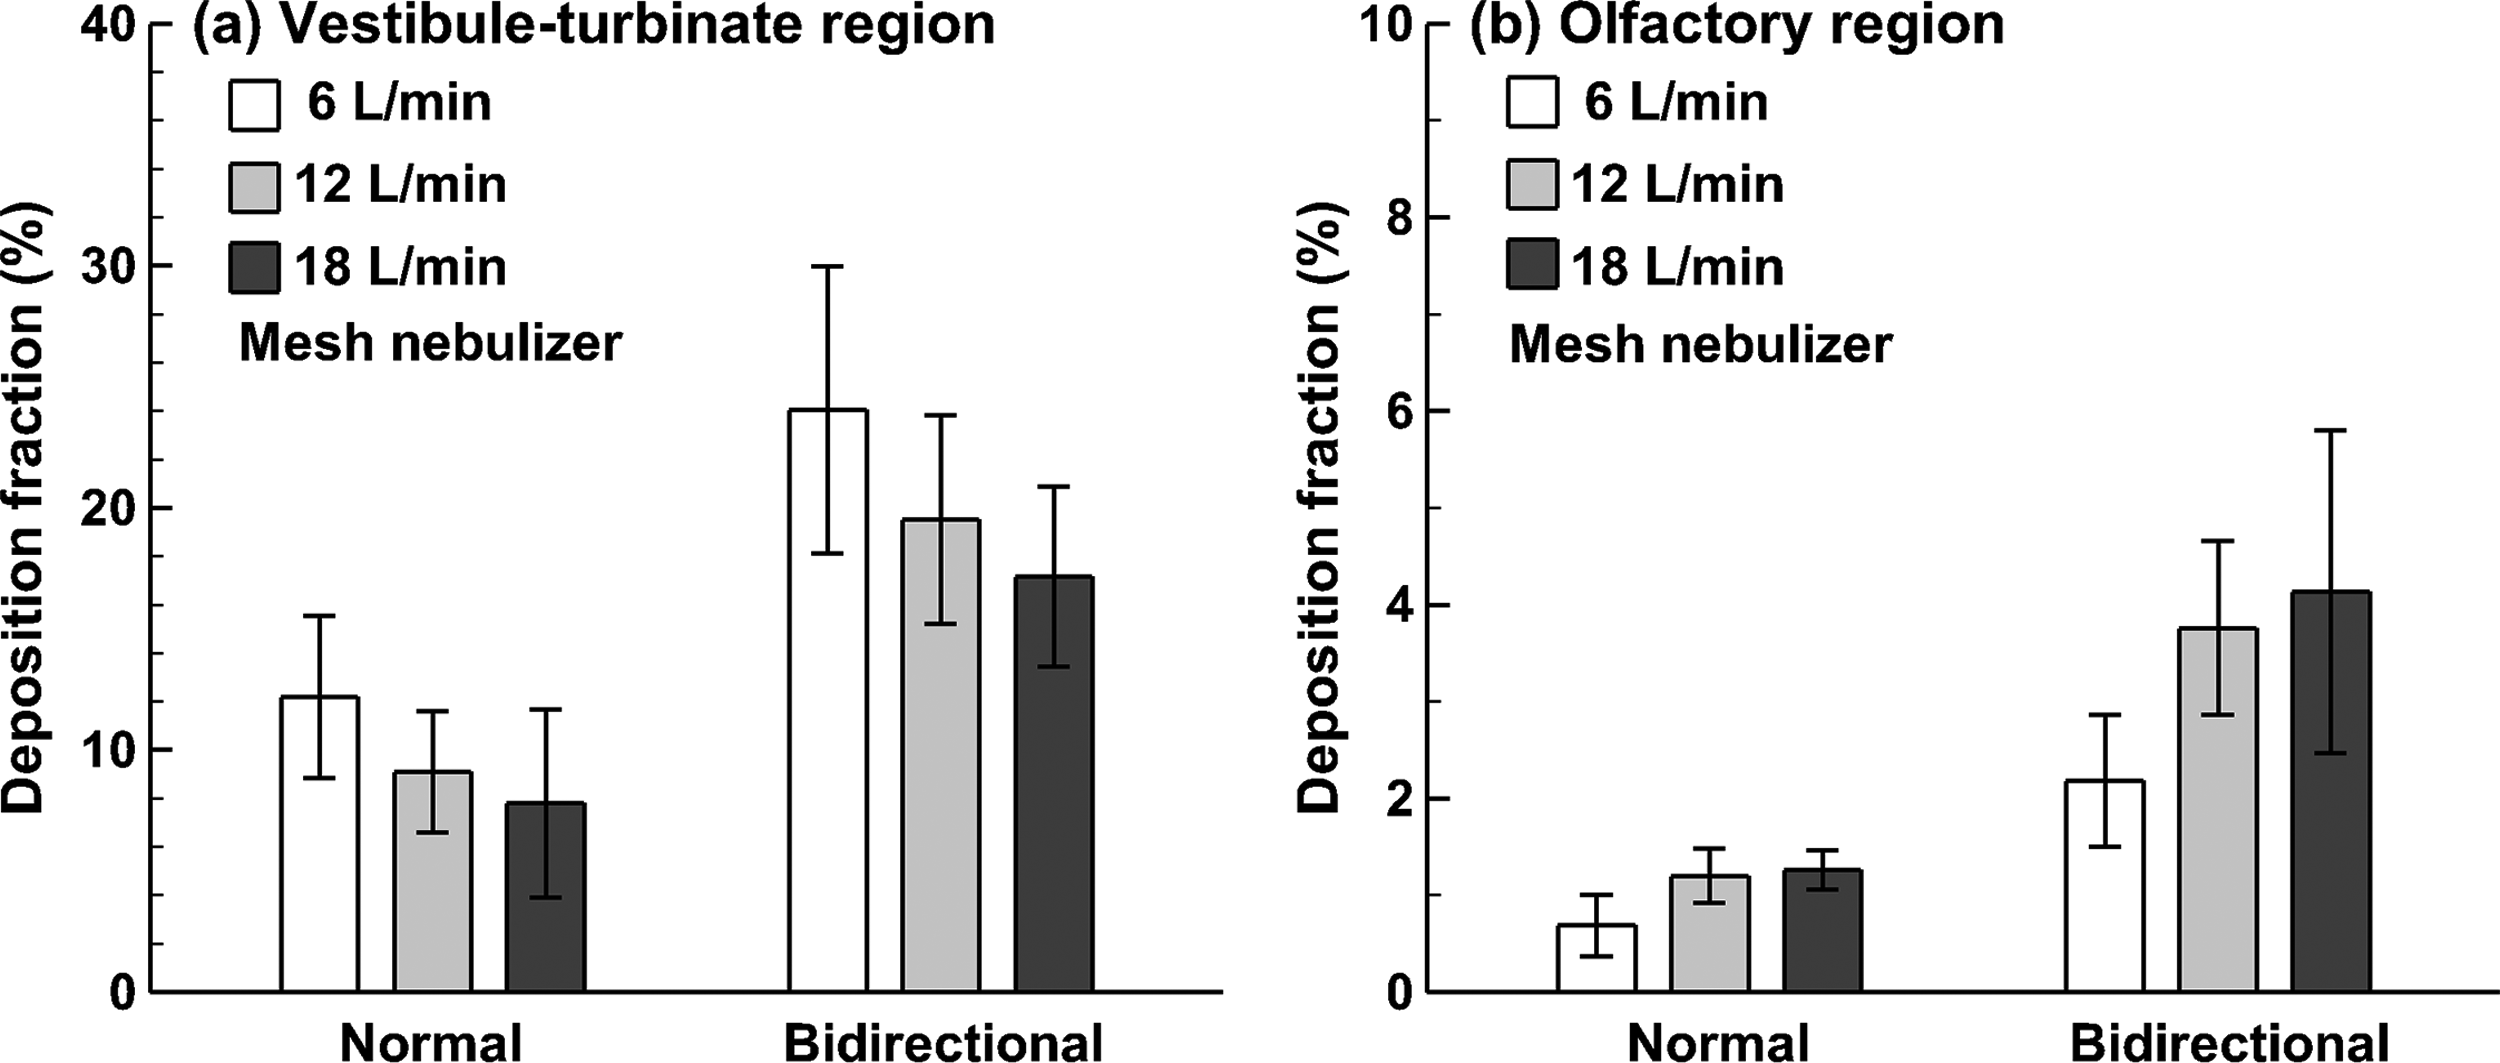
Comparison of the effect of the inhalation flow rate on deposition enhancements using the bidirectional protocol in
Deposition visualization in the second nasal passage
Different patterns of particle deposition are expected in the two passages under the bidirectional breathing pattern. To visualize the deposition pattern in the second passage, the direction of the bidirectional delivery was reversed, namely from “left in, right out” to “right in, left out” (Fig. 7a), so that particle deposition in the left (exiting) passage could be revealed. As expected, much fewer aerosols were deposited in the second passage, as evidenced by the light pink color on the turbinate surface in Figure 7b as opposed to the deep purple in Figures 3 and 4. This diminished deposition is reasonable considering that the majority of administered droplets have been filtered out in the first (entrance) passage.

Deposition pattern in the second (exiting) nasal passage using the bidirectional delivery protocol for the mesh (Voyager Pro) and PARI Sinus nebulizers:
Another salient feature in Figure 7b is the dispersed deposition distribution for both nebulizers. The focused aerosol localization observed in the first passage using the mesh nebulizer (Fig. 3) was missing in the second passage, indicating a more irregular airflow field within. To better characterize the deposition pattern in the second nasal passage, aerosols were released for a longer period of time (1 minute) and the resultant images were shown in Figure 7c. Similar patterns were observed in the second passage between the mesh and PARI nebulizers. However, there appeared to be more deposited aerosols using the mesh nebulizer than the PARI nebulizer.
Numerical simulations
To understand the influences of the delivery methods, numerical simulations were conducted to obtain the airflow field within the nasal passage with the normal and bidirectional delivery methods (Fig. 8). The inhalation flow rate was 18 L/min (1.6 m/s at the nostrils). To reveal the airflow distributions, the nasal conchae in the right nasal passage were removed. From Figure 8a–c, it is clearly shown that the highest speed airflows occur in the nasal valve, which has the minimum cross-sectional area. The majority of the stream traces go through the median nasal passage, while only a small portion of stream traces pass through the three meatuses (inferior, middle, and superior) with low speeds (blue color). In the bidirectional method, airflow enters one nostril, travels through the nasal passage, diverts into the other nasal passage in the nasopharynx region with a 180° change in direction, and exits through the second nostril. The airflow distribution in the first nasal passage is illustrated in Figure 8b, which appears similar to that of the normal delivery method. By contrast, dramatic differences in airflow distributions are observed between the first and second nasal passages (the right passage in the “left in, right out” mode) (Fig. 8b vs. c).
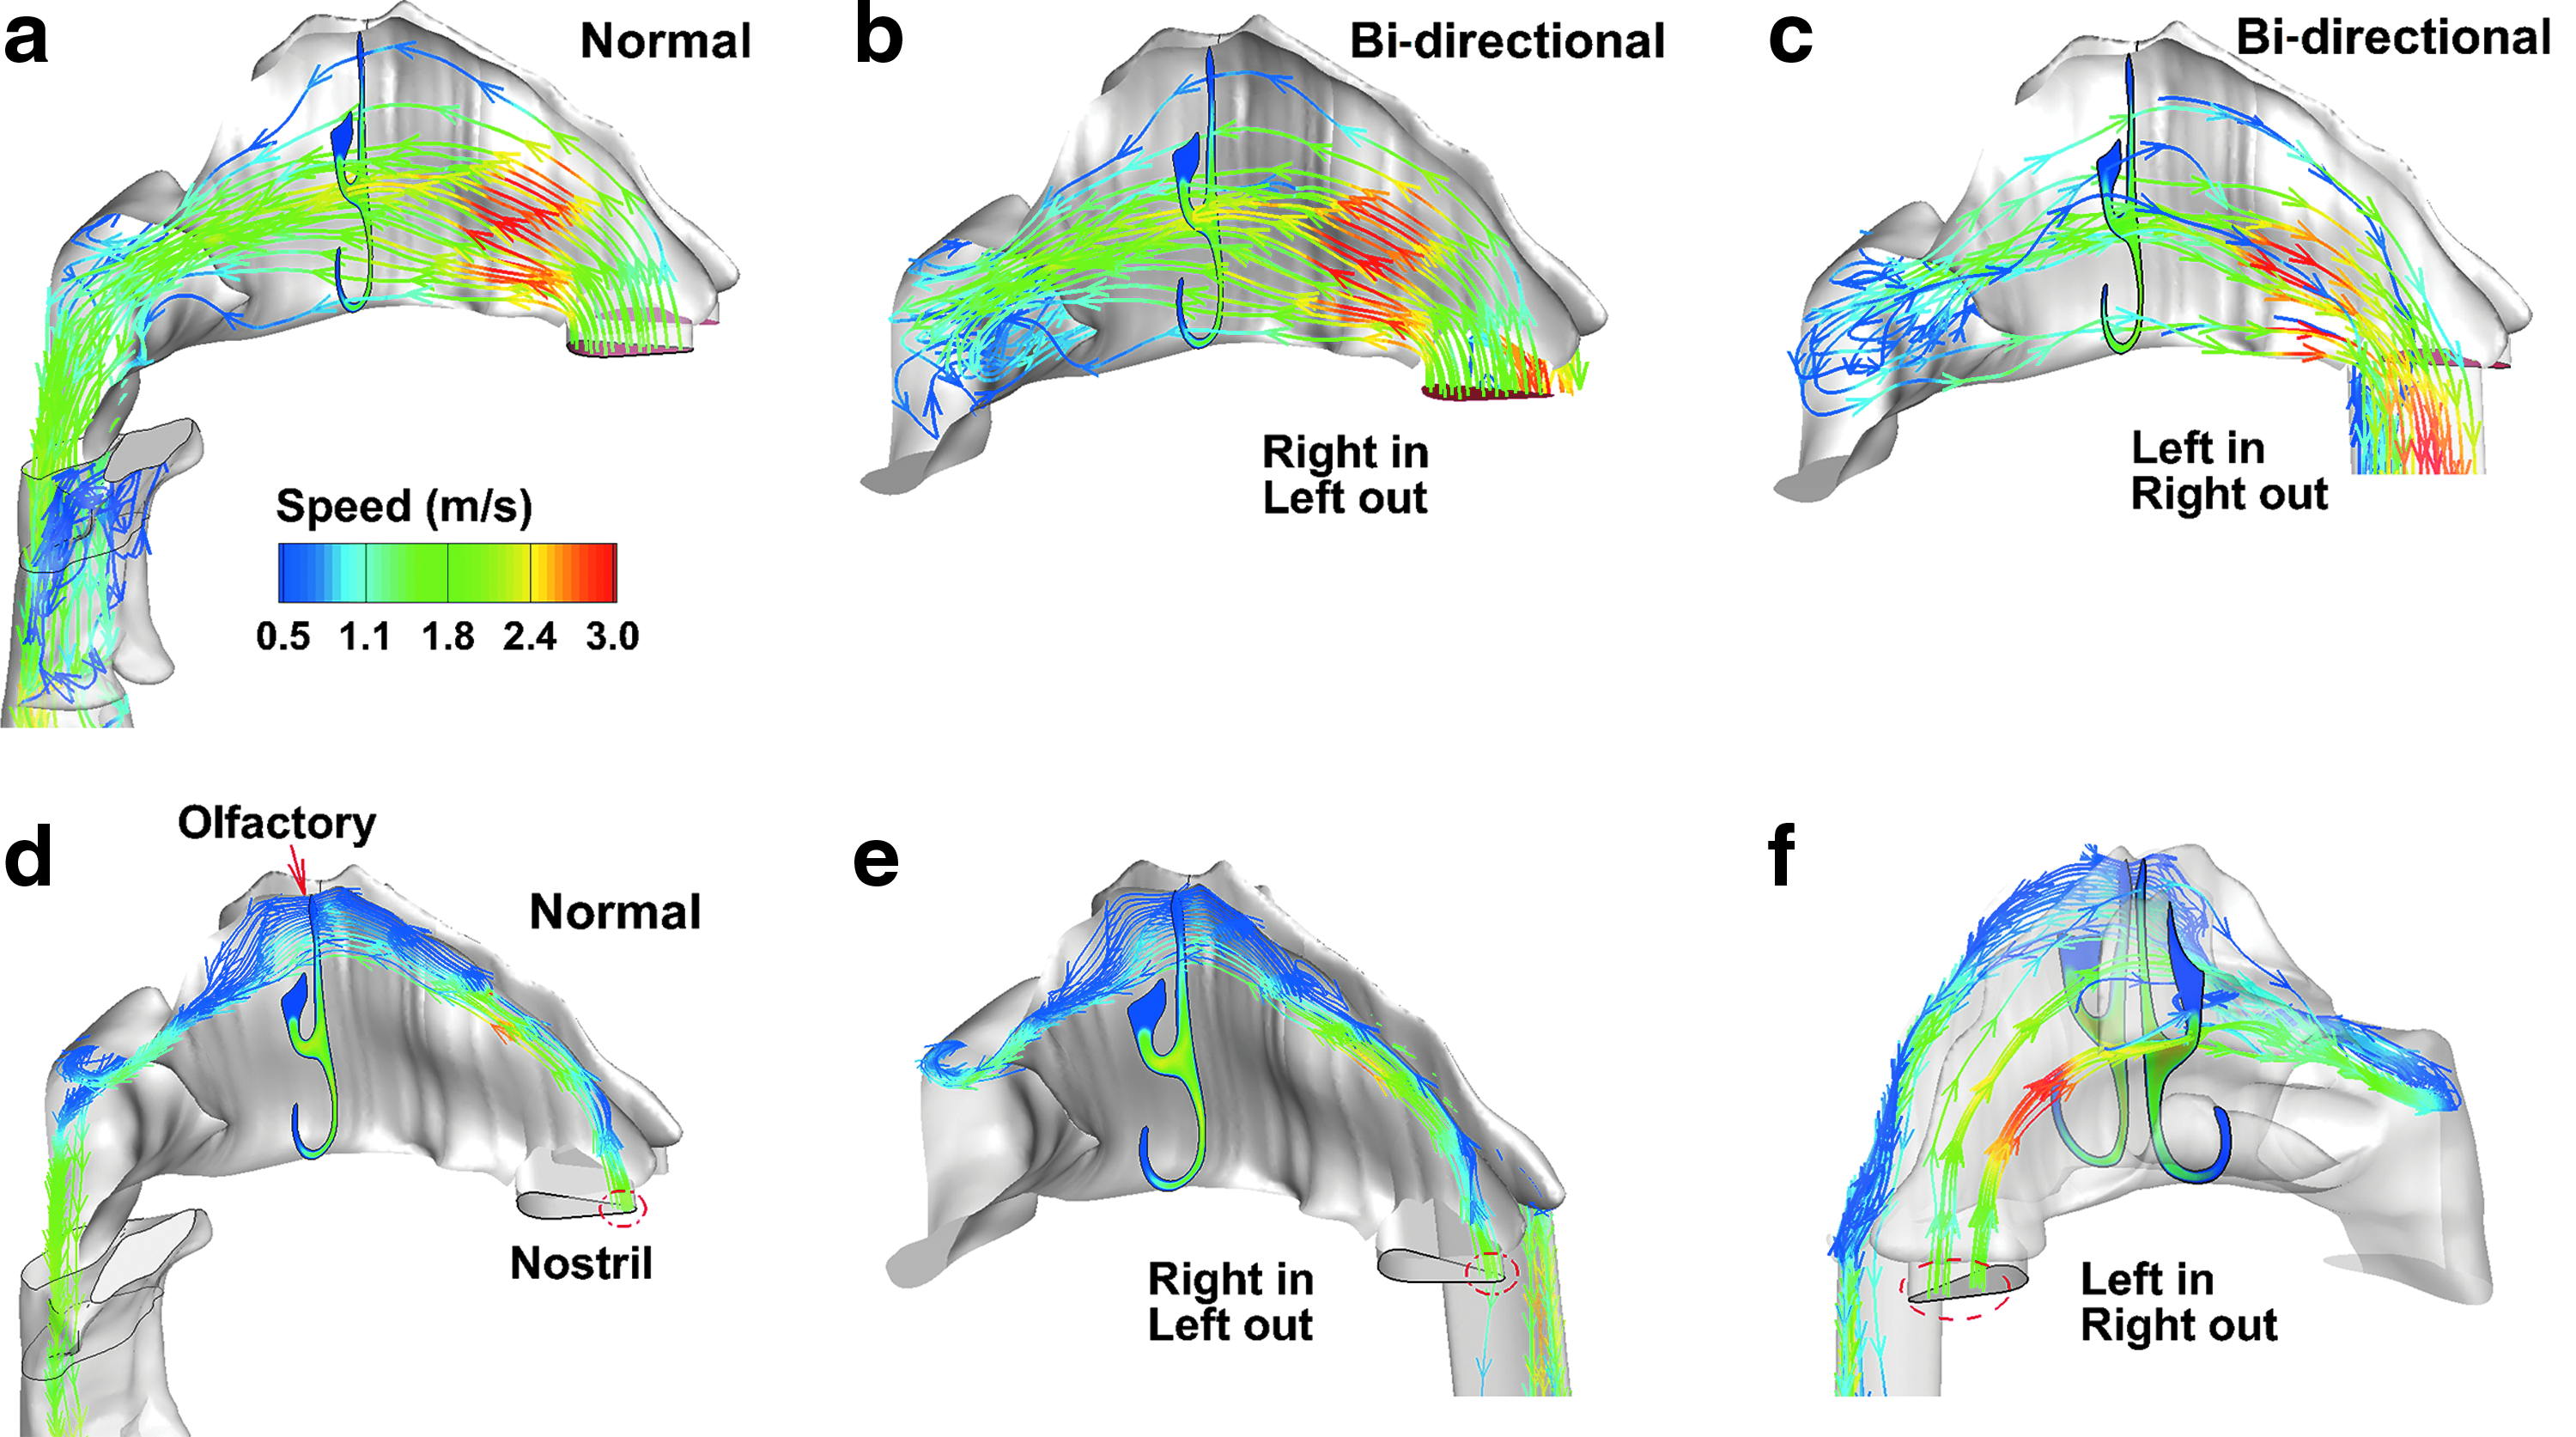
Numerical simulations of airflow stream traces in the nose:
To understand the olfactory depositions, the airflows ventilated to the superior meatus were traced back to the inlet, as shown with the dashed ellipses in Figure 8d–f. For both the normal and bidirectional methods, the airflows that could possibly penetrate into the superior meatus and olfactory region in the first passage were traced back to a focused region in the nostril tip (dashed ellipses in Figure. 8d, e). Considering the second nasal passage, such airflows were noted to originate from a wider region that includes both the upper and middle nostril (Fig. 8f).
To further understand the bidirectional implications on particle transport, snapshots of particle motion at various instants after administration were computed and compared to the normal condition in Figure 9a. The velocity vectors were also plotted on particles at selected instants. Again, similar patterns of particle motion in the first nasal passage were observed for particles released less than 30 mseconds. After 30 mseconds, particles approached the nasopharynx and changed directions sharply in the bidirectional mode to enter the second passage, leading to a greater resistance than the normal mode (the left and middle panels in Fig. 9a). This increased resistance would affect the airflow and particle dynamics in both nasal passages, and in the second passage, in particular, due to the ambient pressure at its exit. The right panel in Figure 9a shows the particle profiles in the second passage after being released 100 and 150 mseconds, respectively. Compared to the well-defined aerosol profiles in the first passage (the left and middle panels in Fig. 9a), dispersed distribution of particles is observed in the second passage (the right panel in Fig. 9a).

Comparison of aerosol transport and deposition between the normal and bidirectional methods:
To study the influence of the inhalation flow rate on the particle transport and deposition, three flow rates (6, 12, and 18 L/min) were considered. The snapshots of particle motions show slight differences among the three breathing conditions when plotted on a relative time scale (u/t/L, where u is the inlet speed, t is the time, and L is the characteristic length scale); however, these differences are not obvious and are not presented. Interesting differences are observed in the surface depositions, as shown in Figure 9b. First, the deposition pattern shifts downward at the lower inhalation flow rate for all the three breathing modes considered, which is evidenced by the majority of blue particles (6 L/min) lying below that of the red particles (18 L/min) (Fig. 9b). This deposition shifting is reasonable in light of the reduced particle inertia and increased gravitational effect at a lower speed.
Second, the normal delivery technique leads to more dispersed deposition pattern in the vestibule-turbinate region, while the bidirectional condition gives a more focused pattern, with a larger amount of particles penetrating into the middle and inferior meatus (the first two panels in Fig. 9b). Furthermore, the deposition pattern is more focused in the first passage (the second panel vs. the third panel in Fig. 9b).
Figure 10 compares the numerically predicted depositions between the normal and bidirectional deliveries under different flow rates. The particle size considered is 3.2 μm, which is typical of the two nebulizers (PARI Sinus and Vibrating mesh) utilized in this study.(34,35,40) More particles deposit in the middle meatus (dashed ellipse in Fig. 10a) under the bidirectional condition (right in, left out) in comparison to the normal condition. For both delivery techniques, particle deposition in the nose decreases with increasing inhalation flow rate, while deposition in the olfactory region increases with increasing flow rate (Fig. 10b); the deposition mechanisms responsible for this observation will be discussed in detail in later sections.
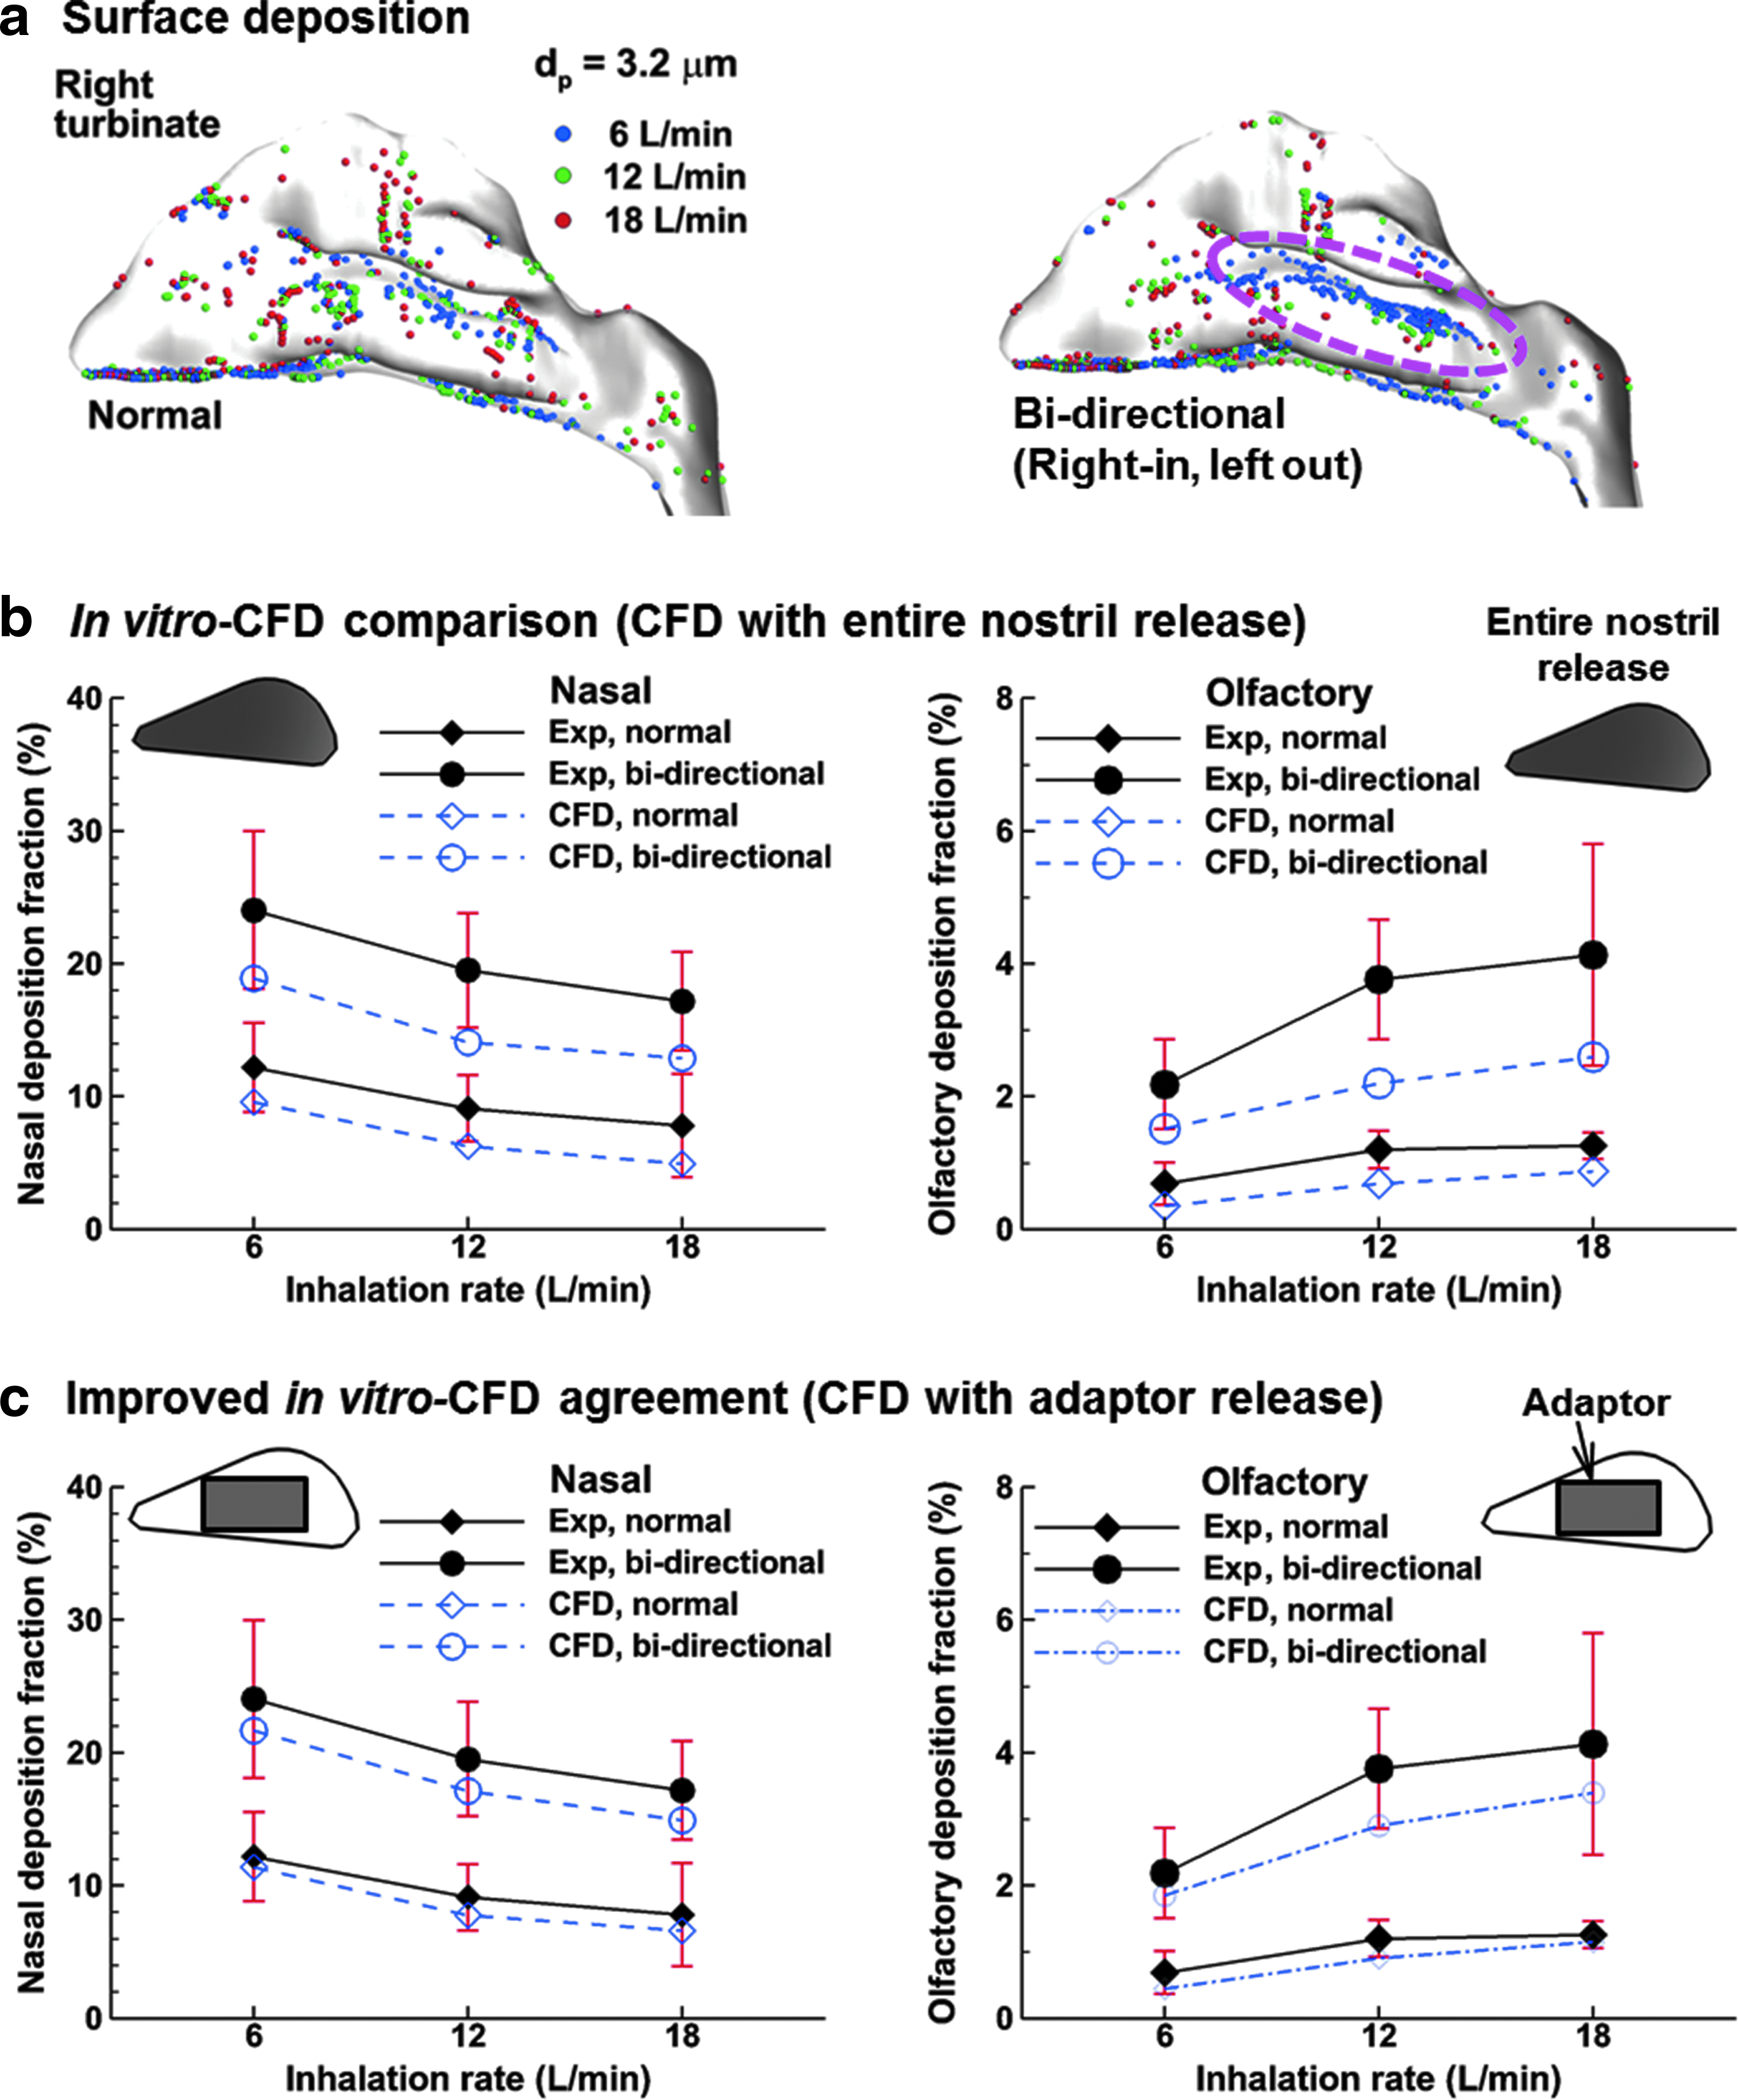
Surface deposition and comparison of DF between in vitro tests and CFD predictions under three inhalation conditions.
Considering the bidirectional delivery, particles will sequentially travel through the two nasal passages, which permit longer residence time for particles to deposit onto the nose surface and, therefore, gives much higher deposition than the normal delivery. The ratio of the first-to-second passage DF was 73:27 for 6 L/min, 69:31 for 12 L/min, and 66:34 for 18 L/min, respectively. Comparing the in vitro experimental data and computational fluid dynamics (CFD) predictions, a good agreement was observed between them in the trend of deposition variation with inhalation rate (i.e., the nasal deposition decreases, while the olfactory deposition increases with increasing inhalation flow rate, in both methods). However, the CFD predictions significantly underestimated the experimental data (Fig. 10b). One possible reason for this underestimation is that CFD modeling releases particles evenly into the entire nostril, while in experimental tests, particles were administered into the upper nose from a rectangular shaped nasal adaptor. To evaluate the release area effects, new CFD simulations that mimic the adaptor administration were conducted and the results are presented in Figure 10c. The in vitro-CFD agreements in both nasal and olfactory DF were improved when releasing particles from the adaptor (rectangle) than the entire nostril.
Discussions and Conclusion
In this study, we examined the feasibility of the bidirectional delivery technique to improve the olfactory deposition using a vibrating mesh nebulizer (Voyager Pro) and a jet nebulizer (PARI Sinus). Results of this study demonstrated that for both nebulizers, the bidirectional delivery method yielded a better deposition rate in both the nasal cavity and the olfactory region. This observation corroborated the results of Djupesland et al.(41,42) that, the bidirectional method is preferred over the standard delivery approach.
Results of this study indicated that the bidirectional technique works better with the mesh nebulizers than the jet-typed nebulizers. The bidirectional technique led to a significantly enhanced deposition in both the nasal cavity and the olfactory region when using the Voyager Pro (mesh nebulizer). In contrast, the advantage of this technique was much less pronounced when using the PARI nebulizer. It is therefore recommended that, for optimal olfactory targeting, the bidirectional method should be used in combination with mesh-typed nebulizers, which typically generate smaller particle sizes with lower initial speeds than other types of nasal devices.
A few clinical trials of the bidirectional technique have been reported, which include the usage of DPI(6,7) and nasal spray pumps.(42) There is yet no reported trial of the bidirectional nasal delivery using nebulizers, even though the working principle of the bidirectional delivery should also be applicable with a nebulizer. Considering that a nebulizer constantly generates aerosols with relatively low exiting speeds, a reservoir is needed to buffer the aerosols generated during mouth inhalation. An alternative is to use a Y-shaped cannula, with the nebulized aerosol and auxiliary airflow separately entering the two inlets, while the mixed aerosol exiting the cannula and entering the nose. The patient is instructed to exercise mouth breathing, while lifting the soft palate to cut off the communication between the mouth and nose. In this way, the delivery can be continuous.
Similarly, as the breath actuated bidirectional delivery, the exiting cannula will be sealed to the nostril to maximize the delivered doses into the nose. It is acknowledged that each device has its specific recommended usage and purpose. This study was not intended to compare which device is superior when operated as recommended, but rather to test these devices as candidates with new delivery protocols for a new purpose, that is, to deliver aerosols to the olfactory region.
The multisectional nasal casting, in combination with the Sar-Gel approach, was demonstrated to provide practical means to quantify and visualize local depositions in the nasal airway. Advances in imaging and manufacturing technologies provide more controls on cast preparation. An anatomically accurate nasal airway model that was previously reconstructed from MRI scans(16) was used to develop the hollow nose cast by means of stereolithographic and 3D rapid prototyping. To characterize the deposition patterns, the left nasal passage was incised into two parts (septum and turbinate) along the top ridge, which clearly revealed the complex structure of the nasal turbinate (Fig. 1b). This cut-open nose cast had a unique advantage in the visualization and quantification of local depositions within the nose, whose small size and labyrinth passage make it inaccessible to most measuring instruments.
By separating the nasal septum from the turbinate, aerosol deposition patterns inside the nose can be directly displayed using color-changing gels or fluorescent particles. To directly measure the delivery efficiency to the olfactory region, this region was separated from the main nasal cavity and fabricated separately into two parts by 3D printing (Fig. 1b, right panel). The projected area (not the surface area) of the OL is ∼5.4 mm2. In comparison, gamma scintigraphy has also been implemented to visualize and quantify the deposition pattern inside the nose. However, it generates a 2D image of varying brightness depending on the particle concentrations in the camera direction. As a result, it cannot differentiate depositions on different walls that overlap in that direction.
Another setback of the gamma scintigraphy is that the perceptiveness of the radioactive particles can be influenced by the distances from the camera and by the physical properties of the nasal tissues/bones. Furthermore, radioactive substances are used. Even through proven to be nearly harmless, they are not readily available, need professional handling, and are generally costly. Compared to gamma scintigraphy, the Sar-Gel based method has the advantages of being simple, direct, less expensive, not changing the drug formulations, and no radiolabels.
In this study, lower nasal deposition and higher olfactory deposition were observed at higher inhalation flow rates for both mesh and PARI nebulizers, as shown in Figures 6 and 10. This lower nasal deposition can be explained by the deposition mechanisms specific to the small particle size considered in this study. For particles of ∼3 μm in diameter, inertia impaction is not the predominant deposition mechanism. Instead, particle deposition is a result of three concurrent mechanisms: interception (convection), inertia impaction, and gravitational sedimentation (Fig. 11a).
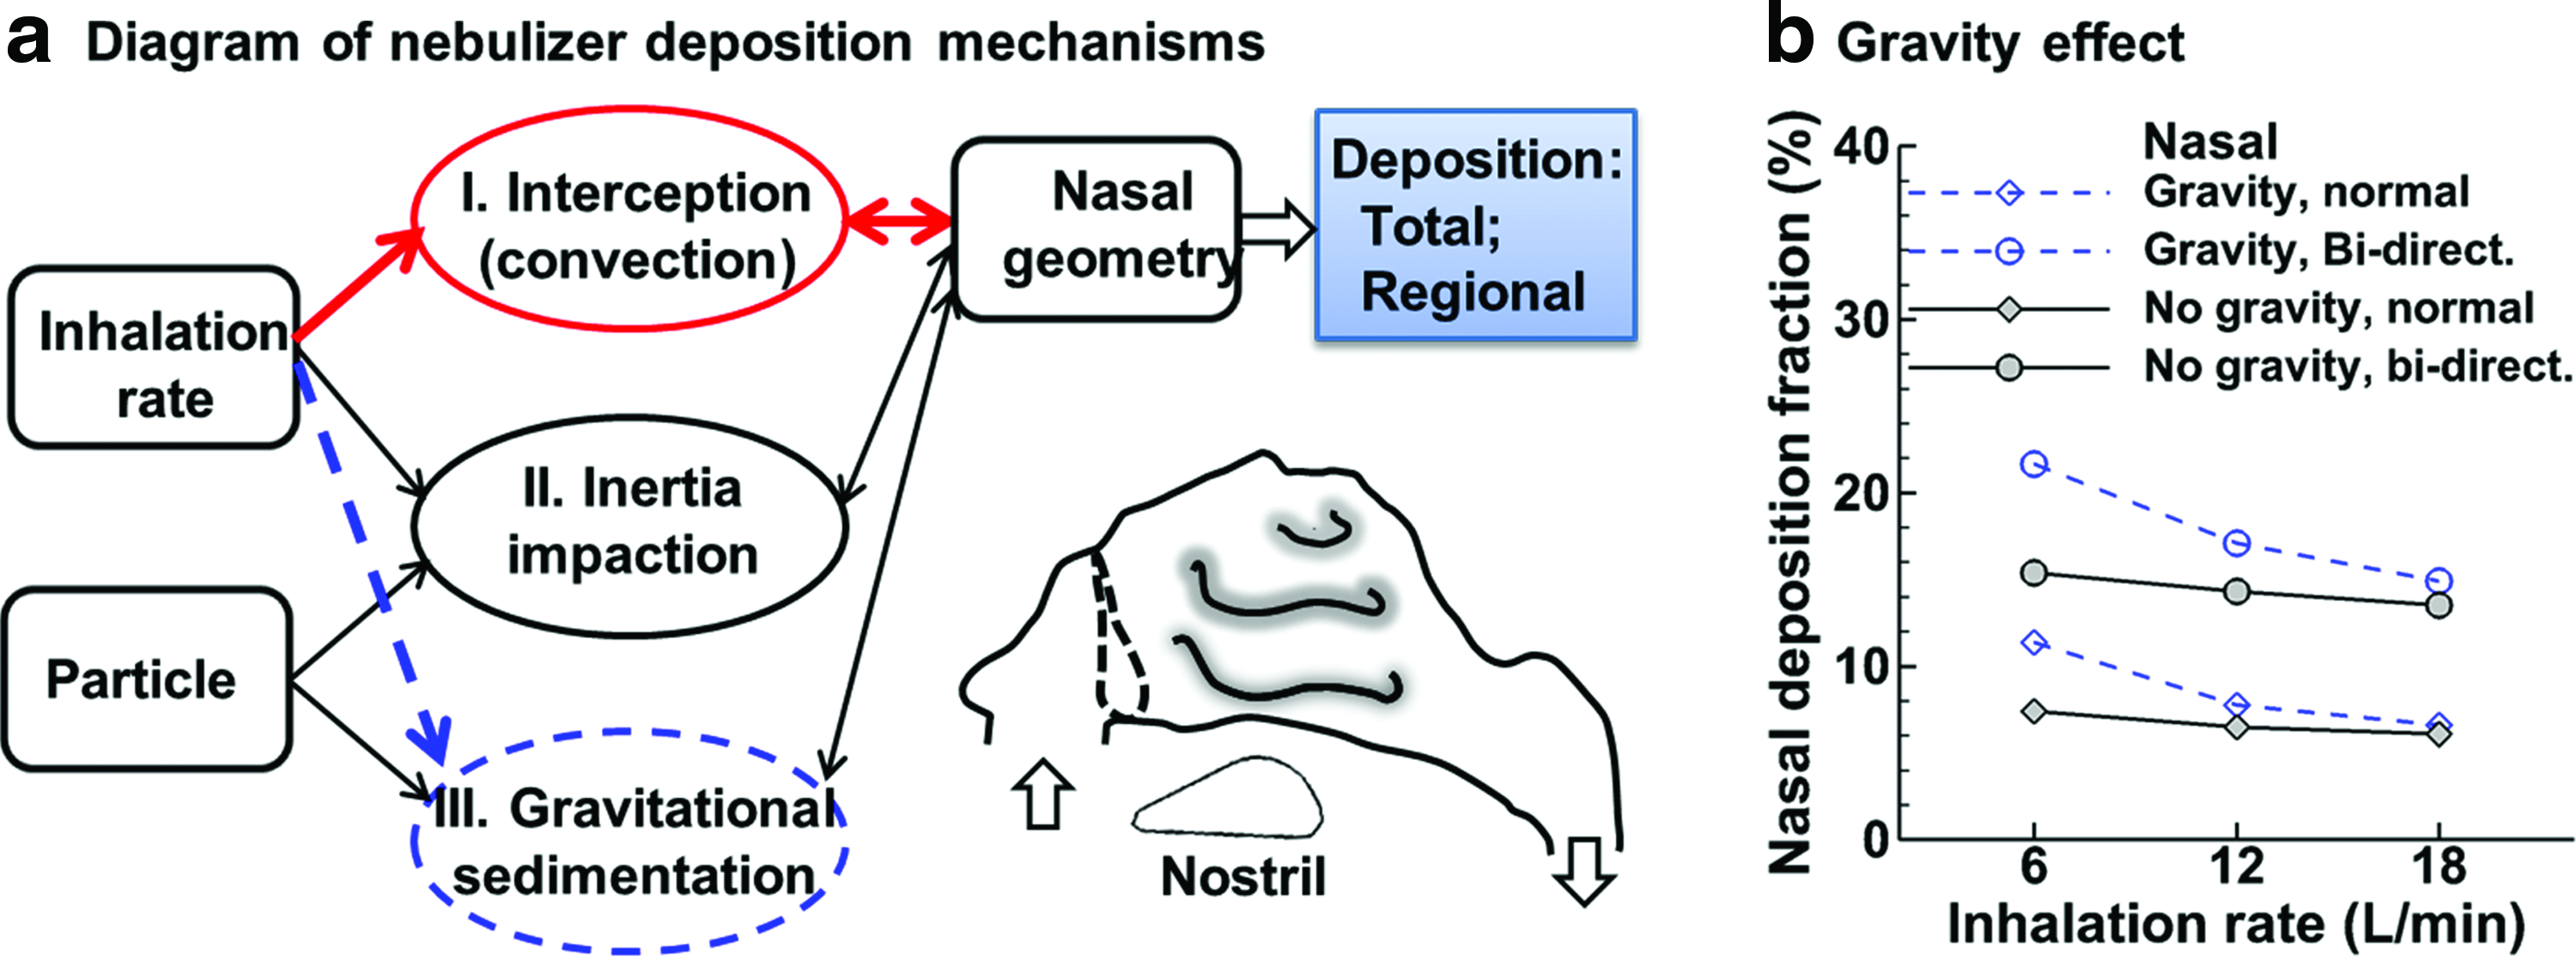
Deposition mechanisms for nebulized aerosols.
In this study, it is important to understand the difference between inertia impaction and interception. Inertia impaction occurs when particles, due to large inertia, cannot follow the abrupt changes of streamlines, depart from these streamlines, and impact on the surface. In contrast, interception occurs when particles do not depart from the streamlines and the inertia of particles can be small. Particles following the streamlines arrive at the wall surfaces and will be captured, or intercepted, there. When particles were inhaled into the nose, interception of particles will be relatively independent of the inhalation flow rate due to the complexity of nasal cavity with narrow passages. However, as the inhalation flow rate decreases, gravitational sedimentation becomes more significant (Fig. 11b), leading to higher deposition rates in the nose at lower inhalation rates. Furthermore, the nasopharynx, which has the shape of a 90° bend and is expected to be affected by inertial impaction the most, was excluded from the deposition quantification in this study.
The reason for higher deposition in the olfactory region at higher flow rates is speculated as follows. At a higher flow rate, a particle acquires higher inertia and is more likely to deviate from the streamline of the main flow. Particles entering the nostril base (the lower nostril) have a higher chance to settle to the nasal floor. For particles entering the front nostril (nostril tip) with a 60° upward orientation, they are more likely to escape the entrainment of the inhaled airflow, keep their upward motion, and penetrate into the olfactory region. As a result, increasing the inhalation flow rate leads to a decrease in gravitational sedimentation in the nasal floor, but an increase in inertia impaction in the dorsal region. Considering that more particles enter the nostril base than the nostril tip, increasing the inhalation rates can reduce the total deposition rate in the nose, while can enhance the regional deposition in the olfactory region.
To reliably quantify the total and olfactory deposition rates, it is desirable to use a shell-like nasal cast as implemented in this study (Fig. 1), as opposed to the conventional block-type casts. In most previous studies, nasal airway cast replicas were developed by subtracting a block with the nasal airway to obtain the airway space within the solid block.(22,43–47) Figure 12a shows an example of the block-type cast that was prepared from the nasal airway of a 5-year-old boy.(48) The weights of such block-type casts are typically close to or beyond the capacity of high-precision laboratory scales. For instance, the maximum weight capacity of the scale used in this study (Sartorius R160P, 0.01 mg precision) is 160 g. A low precision (1 mg and above) scale cannot reliably measure the differential weight before and after the nebulizer administration due to the low deposition. This requirement is more pronounced when measuring the regional deposition rate, such as the olfactory deposition, with a range of 0.5–2 mg for 20-second aerosol administration.
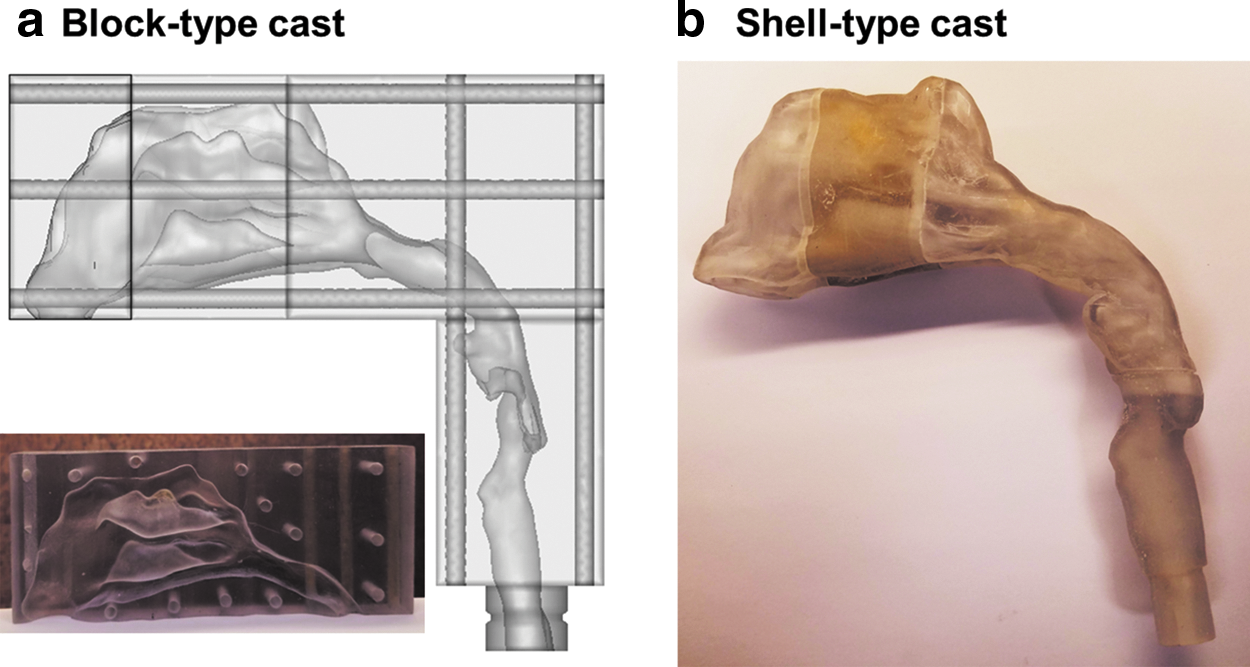
Illustration of a
To alleviate this problem, a shell-like cast model is preferred, which can be less weighted than an equivalent block-type cast. Figure 12b shows a shell-like cast developed from the same child nasal airway as in Figure 12a. In this cast, a 2-mm-thick layer was added onto the outer surface along its normal direction. In this sense, much less 3D printing material was needed and the cast is much lighter. Another issue to quantify regional deposition is that the measurement of such small quantities can be affected by the slightest variations in the surrounding, such as noise, vibration, breeze, magnetic field, temperature, and humidity. Care was taken in this study to minimize such influences. The measurements were conducted in a quiet room free from noise and vibration. After each experiment, the nasal casts were washed, dried in the oven to remove moistures, and left in the laboratory for an additional hour before the next use to let the cast surface reach equilibrium with the environment (Fig. 2). These procedures were found to be essential to minimize the complications from the temperature and humidity when measuring the aerosol deposition; large fluctuations had been observed otherwise due to droplet absorption or evaporation.
In vitro experiments and numerical modeling can complement each other in designing and refining inhalation drug delivery. Both approaches are consistent in revealing the deposition pattern that the vestibule-turbinate deposition increases with decreasing inhalation rates, while that of olfactory deposition decreases as the inhalation rate decreases. This deposition pattern is reasonable considering that a slower breath allows the small particles to stay longer for more depositions, while eliciting a downward shift of particle deposition distribution due to the increasing relative gravitational effects. As the olfactory region is located at the top of the nasal cavity, a downward shift in deposition pattern leads to a lower olfactory deposition. The in vitro numerical cross-validation instills further assurance into the results of this study.
The numerical simulations also predicted an enhanced deposition in the middle meatus. This result corroborates the finding by Moller et al.(23) and Djupesland et al.,(41) who reported enhanced air and aerosol penetration into the middle and superior meatuses. It is also noted that simulations in this study predicted overall low DF in the right turbinate, leading to substantial drug waste and possible adverse side effects. Novel delivery techniques are needed to achieve targeted delivery to the olfactory region. The advantages of complementing in vitro tests with numerical modeling can be multifaceted.
First, it can be more time and cost efficient in the design process. Second, numerical modeling can disclose great details in flow and particle behaviors in the nose, which are difficult to observe experimentally and yet are crucial to the performance of the delivery system. The insights gained through numerical simulations can be implemented to refine the delivery system. Limitations exist in numerical modeling too. Considering the ubiquitous uncertainty and complexity in variables related to drug particles, device, and patient, fully simulating the delivery process is still impractical.
Other assumptions that may limit the realism of this study include steady flows, rigid nose cast, nose replicas based on one subject, and various sources of input uncertainties. Previous studies have emphasized the effect upon the airflow and aerosol dynamics from tidal breathing(11) and compliant walls.(49) Under the normal intranasal delivery, aerosols are administered into the nostrils during inhalation and are exhaled either from the mouth or nostrils, which can cause additional upper airway deposition. Djupesland et al.(50) suggested that the nasal passage, especially the nasal valve, will expand due to the positive pressure during the bidirectional delivery, which, in principle, should give further improved deposition to the olfactory region.
However, the degree of expected improvements warrants further experimental tests. The nose replicas were developed from one subject only and did not account for discrepancies due to age, gender, race, weight, or height. High variability of deposition rates in the vestibular-turbinate region and olfactory region was observed in this study. Such variability can arise from various sources, such as aerosol generation, administration angle, device–nostril distance, and unsteady airflow, just to mention a few.(51–53) These sources of uncertainty may be difficult to control and can impact the drug delivery efficiency at varying degrees. Probabilistic analysis can quantify the sensitivity levels of input parameters, as well as the output uncertainties, and should be considered in future studies. Complementary numerical studies with more extensive and physiologically realistic test conditions are needed to gain further insights into bidirectional nasal deliveries and improve the drug delivery system for olfactory targeting.
Footnotes
Acknowledgments
This study was funded by Central Michigan University Innovative Research Grant P421071 and Early Career Award P622911. LinLin Zhao at Rutgers University and Biwei Cao at Georgetown University were gratefully acknowledged for reviewing the article.
Author Disclosure Statement
No competing financial interests exist.