




Abstract
Abstract
Background:
A key issue in pulmonary drug delivery is improvement of the delivery device for effective and targeted treatment. Pressurized metered dose inhalers (pMDIs) are the most popular aerosol therapy device for treating lung diseases. This article studies the effect of spray characteristics: injection velocity, spray cone angle, particle size distribution (PSD), and its mass median aerodynamic diameter (MMAD) on drug delivery.
Methods:
An idealized oral airway geometry, extending from mouth to the main bronchus, was connected to a pMDI device. Inhalation flow rates of 15, 30, and 60 L/min were used and drug particle tracking was a one-way coupled Lagrangian model.
Results:
The results showed that most particles deposited in the pharynx, where the airway has a reduced cross-sectional area. Particle deposition generally decreased with initial spray velocity and with increased spray cone angle for 30 and 60 L/min flow rates. However, for 15 L/min flow rate, the deposition increased slightly with an increase in the spray velocity and cone angle. The effect of spray cone angle was more significant than the initial spray velocity on particle deposition. When the MMAD of a PSD was reduced, the deposition efficiency also reduces, suggesting greater rates of particle entry into the lung. The deposition rate showed negligible change when the MMAD was more than 8 μm.
Conclusion:
Spray injection angle and velocity change the drug delivery efficacy; however, the efficiency shows more sensitivity to the injection angle. The 30 L/min airflow rate delivers spray particles to the lung more efficiently than 15 and 60 L/min airflow rate, and reducing MMAD can help increase drug delivery to the lung.
Introduction
P
In a pMDI, the drug formulation is mixed with a liquid propellant (usually chlorofluorocarbon [CFC] or hydrofluoroalkane [HFA]) and is stored in a canister (normally 15–30 mL) at a pressure of 2–5 bar. Actuation of the device triggers the release of single metered dose of atomized drug particles.(9) Despite its widespread use, drug delivery to the lungs on average reaches only 5%–20%.(10–12) This is primarily caused by large drug particles produced at high velocities depositing in undesired locations in the airway. This leads to unwanted side effects and a reduction in effectiveness.(13,14)
The pMDI device parameters include propellant composition, device configuration, and the canister pressure and volume, which all significantly affect the atomized spray properties. For example, the number of particles produced during atomization can change in the range of
Versteeg et al.(16) used computational fluid dynamic (CFD) to predict steady-state airflow through an experimental MDI package. However, the authors acknowledged that because of computational limitations at the time, only qualitative agreement between the CFD model and experiment could be achieved. Cheng et al.(12) measured CFC-pMDI and HFA-pMDI drug delivery efficiency in a human airway replica, including the oropharyngeal cavity, larynx, trachea, and nine bronchus generation. The mass median aerodynamic diameter (MMAD) and geometric standard deviation were 2.33 μm (σg = 1.79) and 2.21 μm (σg = 1.76) for the in-house CFC and Proventil HFA formulations, respectively. The results showed that for an inhalation flow rate of 30 L/min, the CFC-pMDI produced 78% deposition in the oropharyngeal airway and 16% deposition in the lung, whereas the HFA-pMDI produced 56% deposition in the oropharyngeal airway and 24% in the lung.
Hochrainer et al.(17) studied the effect of velocity and spray duration on the performance of CFC-pMDI and HFA-pMDI in comparison with a new propellant-free inhaler Respimat® Soft Mist™ Inhaler (SMI). The pMDI used in this study had conventional nozzles that produced initial particles in the order of the nozzle orifice diameter 200–500 μm, whereas Respimat SMI produced particles <1 μm in median diameter within a short distance of the nozzle.
The spray plume mean velocity by Respimat SMI measured 0.8 m/s at 10 cm distance from the nozzle, which was 2.5 to 10.5 times slower than those produced by the pMDIs. The spray duration was 1.5 seconds for Respimat SMI and 0.15–0.36 seconds for the pMDIs. These differences significantly contributed to the Respimat SMI's increased drug delivery effectiveness to the lung. Smyth et al.(18) reported that the pMDI spray plume pattern is affected by propellant formulation, sump depth, and orifice length and size.
Kleinstreuer et al.(19) numerically studied drug delivery efficiency of HFA-pMDIs and CFC-pMDIs in an oral airway model. A total of 2000 particles were introduced at an initial velocity of 150 m/s, cone angle 35°, and with a size distribution obtained from Dunbar et al.(20,21) Results showed that 47% of the inhaled droplets reached the lung for a HFA134a-pMDI and 23% for a CFC-pMDI. In addition, the pMDI nozzle diameter effect on drug delivery was studied, showing that the bigger nozzle is less efficient. CFC-pMDI with a 0.5 mm nozzle delivers 5.6% of the medication to the lung, whereas a 0.25 mm nozzle delivers 23.3% of the medication.
Brambilla et al.(22) experimentally measured the pMDI spray temperature for variety of device properties such as propellant formulation, metering volume, and actuator orifice diameter. These authors observed that the plume temperatures were to be lowest in the proximity of the actuator mouthpiece where rapid flashing and evaporation of the propellant cause cooling. They found the minimum plume temperature for different experimental setups in the range of −54°C to +4°C.
Tamura(23) studied spray velocity and plume pattern of seven HFA-pMDIs in addition to one Respimat SMI, using particle image velocimetry (PIV) technique. Results showed pMDIs spray velocity changes in the range of 2.5 to 9 m/s at 80 mm distance from the end of the nozzle; however, this value reaches 0.84 m/s for Respimat SMI.
As discussed, design features and propellant formulation can affect the pMDI spray characteristics, including the particles size distribution, particles injection velocity, and the spray cone angle. Cheng et al.(12) reported the spray angle for both HFA-134a and CFC to be 35°; however, Oliveira et al.(24) measured this angle as 10° and 17° for HFA-pMDI.(25)
Dunbar et al.(21) measured the spray jet velocity and drop size distribution at different distances from the pMDI nozzle. They showed that the volume mean spray drop size varies with radial distance from 5.2 to 10.8 μm for HFA-134a and from 7.5 to 16.5 μm for CFC-based pMDI (measurement point 25 mm far from the pMDI nozzle).
Crosland et al.(26) studied the spray velocity of the different pMDIs using PIV. They observed that the velocity magnitudes were much lower than published data from instantaneous single point measurements. The spray plume peak velocity was found to be on average 60 m/s at 2.5 mm distance from the nozzle and 40 msec after the pMDI actuation. The spray cone angle was also shown to be unsteady, varying up to 8°, during the first 100 msec of the transient spray event.
As already reviewed, there is a significant discrepancy in measuring the pMDI spray cone angle and spray emitting velocity. However, it is believed that most of these differences are because of experimental setup and the precision of measurement tools and techniques. Regarding that spray injection angle and velocity can alter the efficiency of pMDIs in delivering drug to the lung, better understanding of the significance of these factors on the drug delivery and particle deposition pattern in the human lung is necessary.
This study aims to be a CFD investigation of the spray angle and velocity effect on drug delivery efficiency to the lung. The authors present a general criterion for efficiency of pMDI drug delivery to the lung with regard to particle velocity and injection angle. To do so, a commercial pMDI model attached to an idealized mouth–throat model developed by Cheng et al.(27) is employed in this study (Fig. 1). The spray particle distribution from an experimental data is used to reflect the real pMDI spray properties.
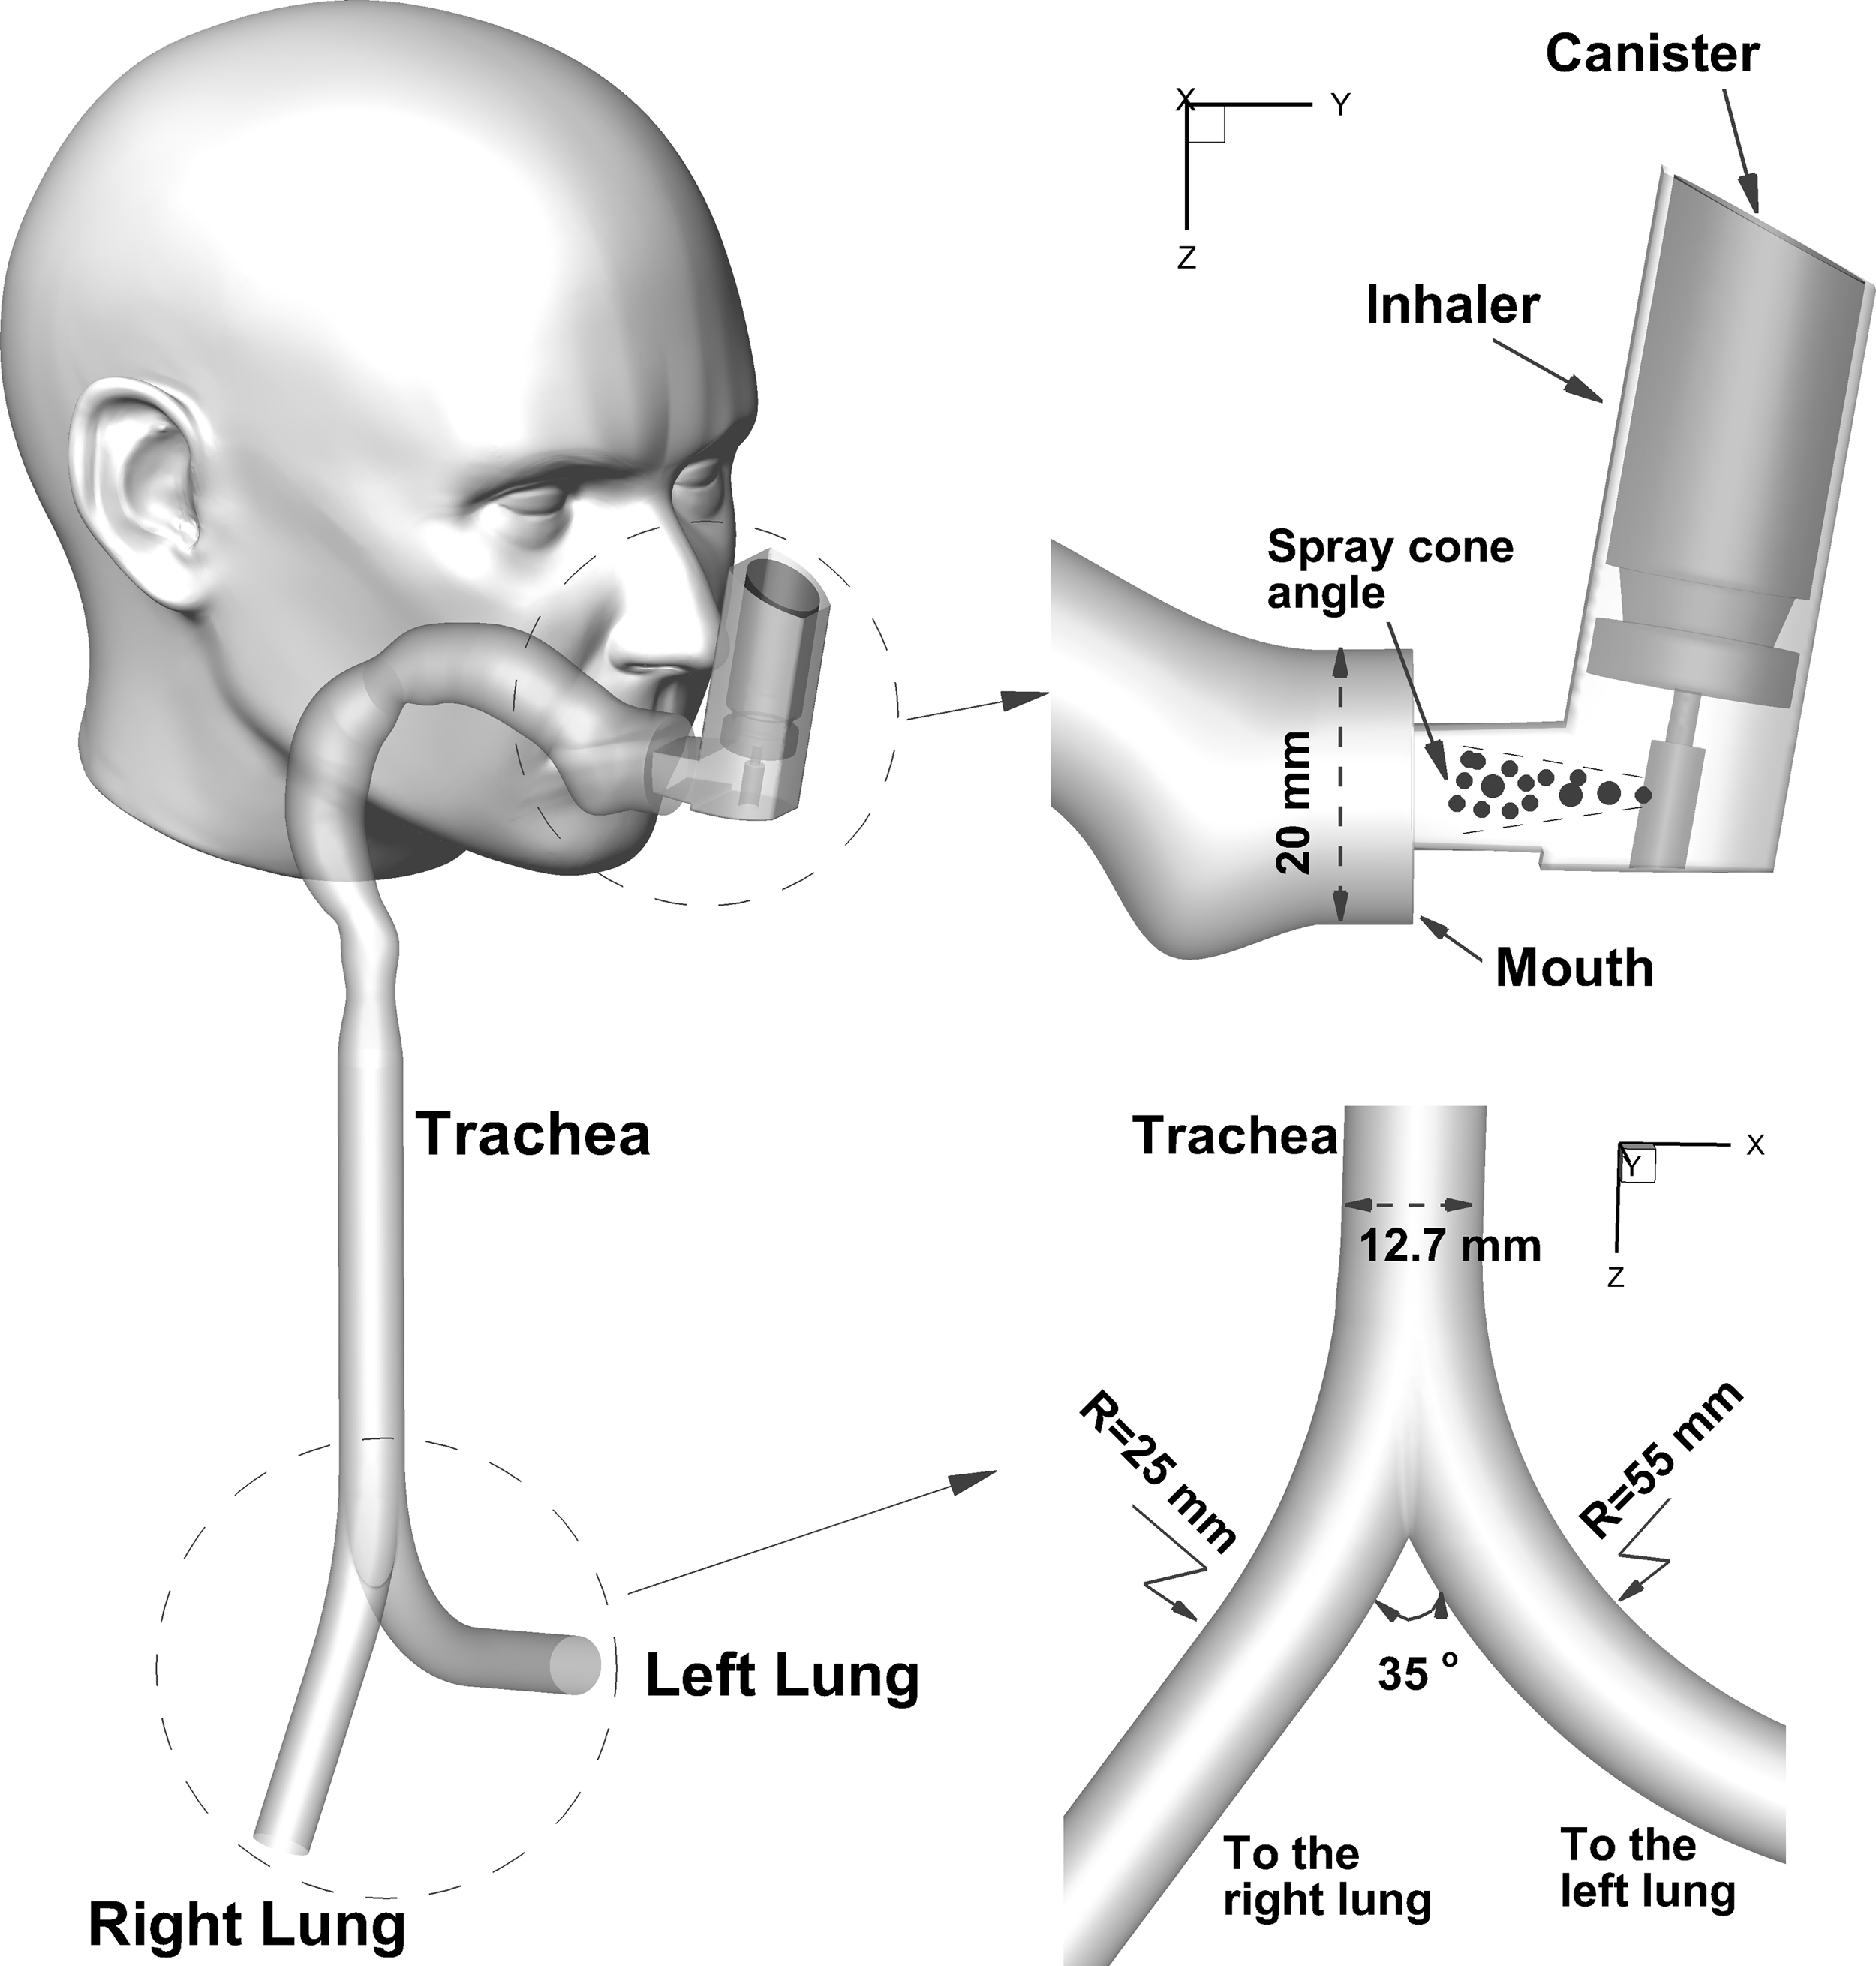
A typical pMDI attached to the oral airway. pMDI, pressurized metered dose inhaler.
Materials and Methods
Computational geometry and mesh
The geometry used in this work was adopted from Cheng et al.(27) (Fig. 2). This geometry has been widely used in studies of particle transport and deposition in the upper airway.(19,28–34) Other upper airway models include the idealized mouth–throat replica (U-of-A replica) developed by Stapleton et al.(35) and the Lovelace Respiratory Research Institute (LRRI) cast model. Although the upper airway geometry exhibits intersubject variability, and even varies in a single person with age, there are common gross geometrical features that are persistent among all airway models, which dominate the flow field. This includes the arch in the oral cavity, the 90° bend into the pharynx, and the converging–diverging cross-sectional area at the larynx.
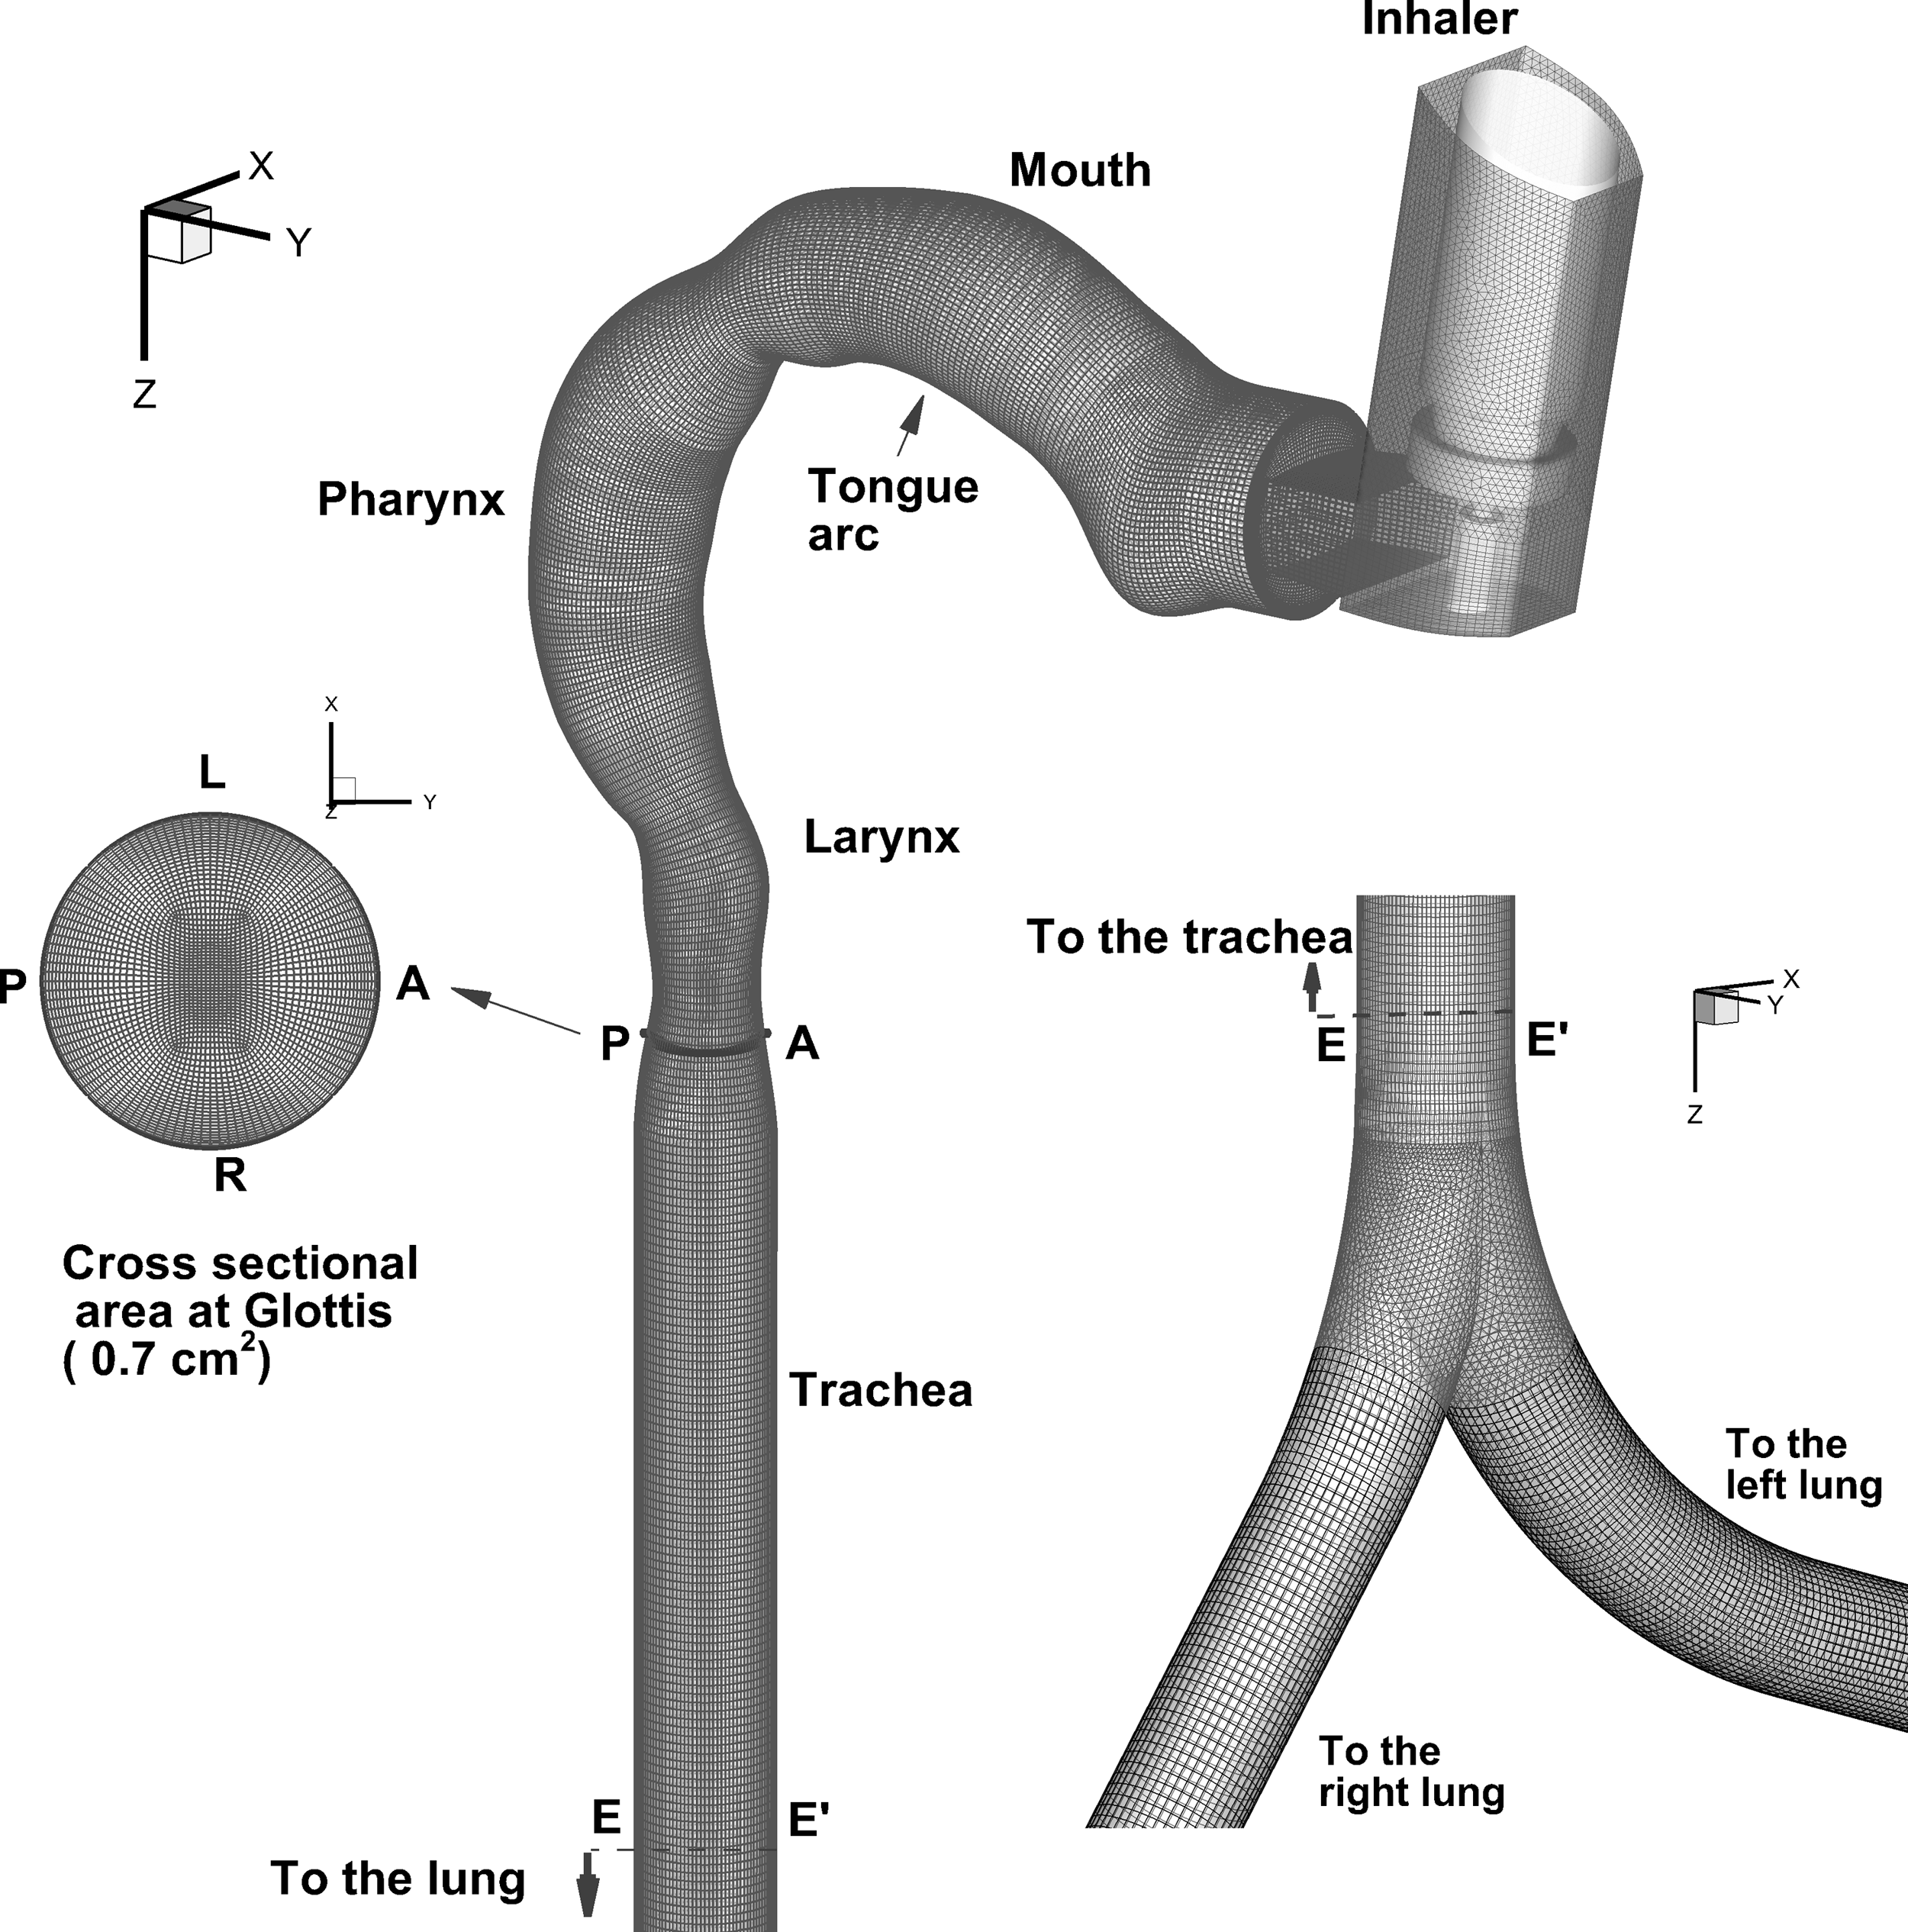
Computational model of the oral–pharynx–larynx–trachea airway adopted from Cheng et al.(27) with a block-structured mesh airway model applied to it.
The mouth–throat model by Cheng et al.(27) uses a variable circular cross-section throughout the model. The model was based on hydraulic diameters measured from a replicate cast of a healthy male adult with an approximately 50% full mouth inlet that is 2 cm in diameter. Although our model is simplified, it does contain relevant and key features that affect the fluid flow dynamics. The airway varies in cross-sectional size, to capture (i) the expansion from mouth to pharynx region, (ii) the decrease in airway geometry at the larynx, and (iii) the minimum cross-sectional area at the epiglottis to produce the laryngeal jet production downstream of the epiglottis. Although using a simplified model indeed lacks detailed anatomical variations, it allows us to focus on the airflow and particle behavior in a well-known and quantifiable geometry.
The computational mesh consisted of block-structured cells with near wall refinements, so that the first grid point from the wall was within the viscous sublayer (e.g., y+ < 5). A grid independence study was performed in the upper airway geometry, plus bronchi using three grid sizes of 1,055,965, 1,361,590, and 2,003,470 computational cells (Supplementary Fig. S1; Supplementary Data are available online at www.liebertpub.com/jamp), and a model with 1,361,590 cells was used in this study, which was approximately 20 cells/mm3 in the model.
Airflow field equations and assumptions
The Reynolds number in an idealized extrathoracic airway was determined experimentally by Johnstone et al.(36) as 650–13,000 for 10–120 L/min airflow rate. In this article, three inhalation rates 15, 30, and 60 L/min were used. Although the Reynolds number may exhibit a laminar flow in a smooth regular pipe, the irregular and complex shape of the oral–pharyngeal airway produces separation and recirculation flow dynamics, which can lead to earlier onset of turbulence. The flow is, therefore, expected to exhibit some form of transition from laminar to turbulence even at an inhalation flow rate of 15 L/min.(37,38)
The
where ui is time-averaged velocity, p the time-averaged static pressure,
where k and
where I is the upstream turbulence intensity,
The segregated solver in Ansys-Fluent 14.5 was used with the SIMPLEC algorithm for pressure–velocity coupling and the discretization scheme was second-order upwind. The solution was assumed converged based on a residual convergence criterion of
Particle tracking simulation
The Lagrangian discrete phase model (DPM) in ANSYS FLUENT 14.5 follows the Euler–Lagrange approach. The fluid phase was treated as a continuum phase. A fundamental assumption made in DPM is that the dispersed second phase occupies a low volume fraction, even though high mass loading (
One-way coupling is assumed between the particle and air flow fields, and the interaction between particles is also neglected because the particle flow is dilute (i.e., the volume fraction of the particle is <0.1%). In the upper and large airways, the gravitational force on micron particles is negligible in comparison with the particle drag term.(44) The general form of the trajectory equation for a single particle with constant mass is given as


where
where
A one-way turbulent dispersion on the particle was performed using the Discrete Random Walk or “eddy interaction model” inside Ansys-Fluent. This approach assumes that a particle interacts with a succession of random discrete turbulent eddies, with each eddy defined by a lifetime, length, and velocity scale. The velocity scale was determined by a velocity fluctuation
with the eddy lifetime interaction maintained constant as
pMDI particle conditions
The initial particle conditions were based on atomization of Ventolin HFA (albuterol sulfate), a drug formulation commonly used to treat asthma. Measured experimental data from Oliveira et al.(25) were used to determine the particle initial conditions (summarized in Table 1). Their results produced a bimodal particle distribution, from laser diffraction measurements at 100 mm from the nozzle of a commercial pMDI device.
HFA, hydrofluoroalkane.
We note that the mean diameter is between 12 and 25 μm that is more larger than results by Dunbar and Hickey,(53) which showed a mean in the order of 2 to 6 μm. A number of factors can influence the particle size distribution (PSD) measurement. It can be affected by the distance of the measurement point from the inhaler injector, atomizer, propellant, drug formulation, and actuation pressure. The way a patient activates the inhaler can also affect the PSD.
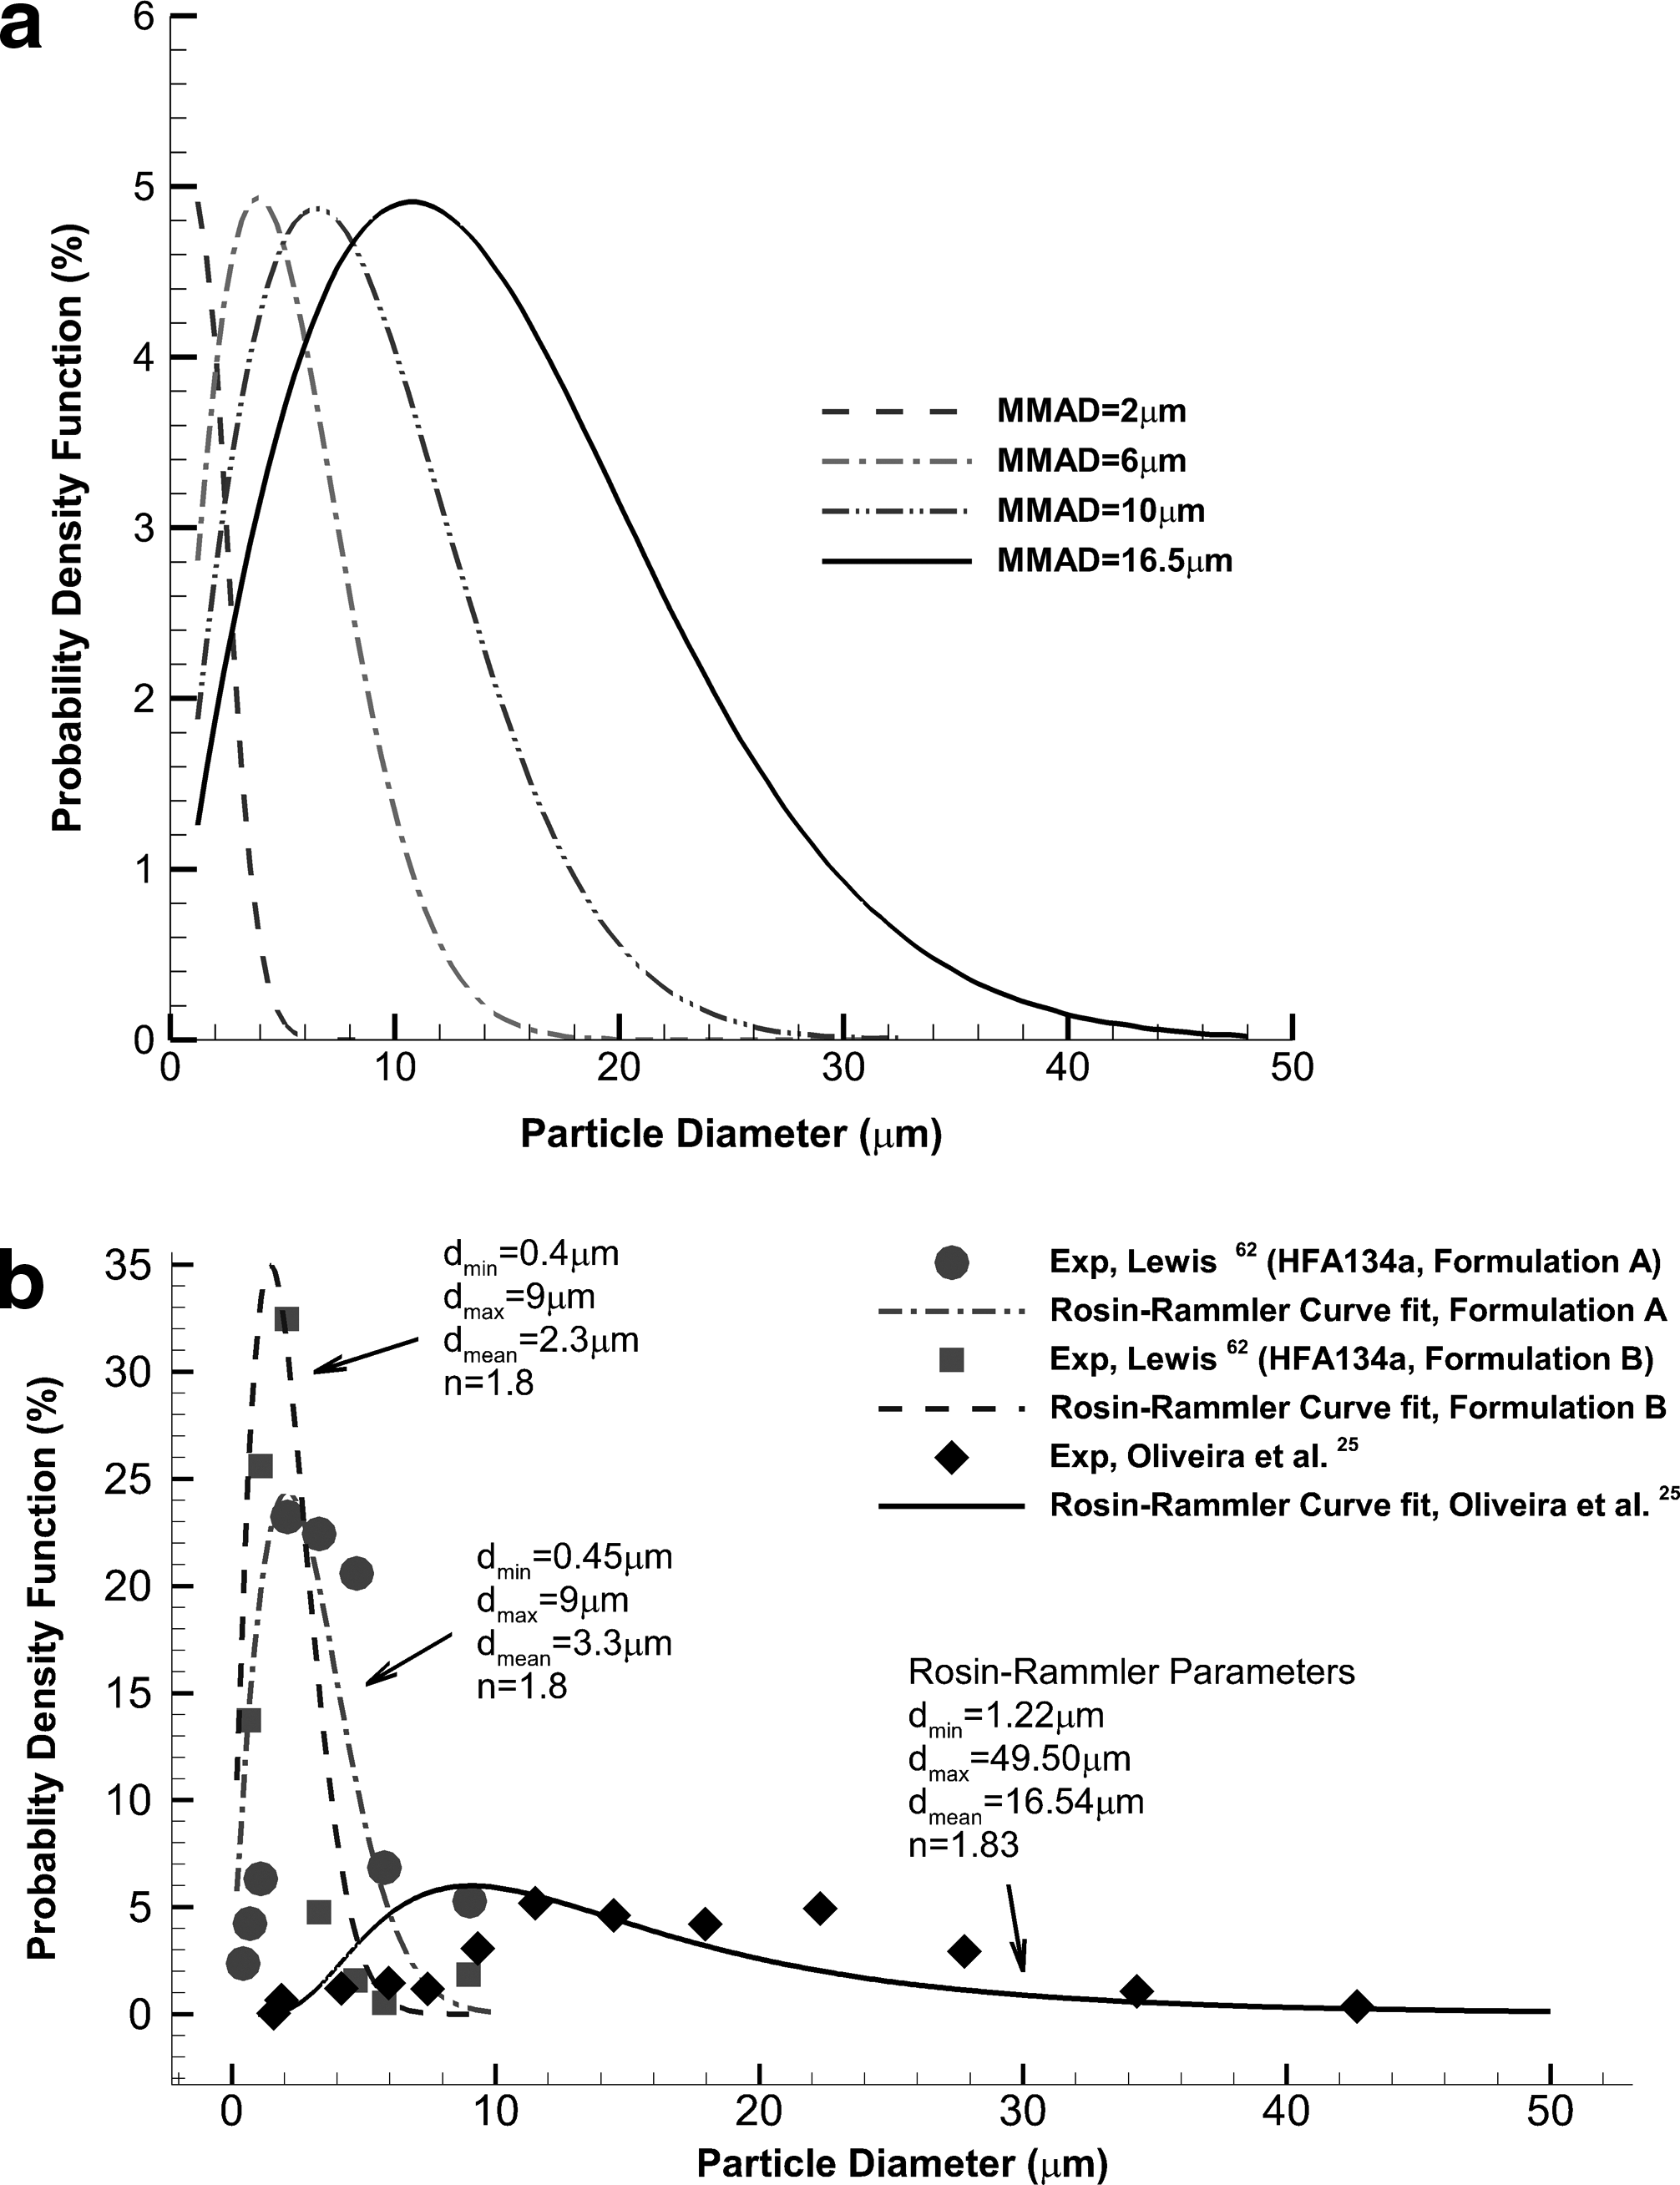
In our CFD model, we simplified the size distribution and used a single-modal distribution represented by a Rosin–Rammler function (Fig. 3). The simplification overestimates the particle size fraction for <10 μm, which means there is potential for an overall underestimation of particle deposition in the simulations. The number of particles tracked was checked for statistical independence because the turbulent dispersion modeling is a stochastic process. The Rosin–Rammler distribution was used with number of particles of 10,000, 20,000, 40,000, and 80,000. The particles were introduced at a single point at the inlet with a spray cone angle of 10° and velocities of 100 and 120 m/s based on Oliveira et al's(25) measurement data (Table 1).
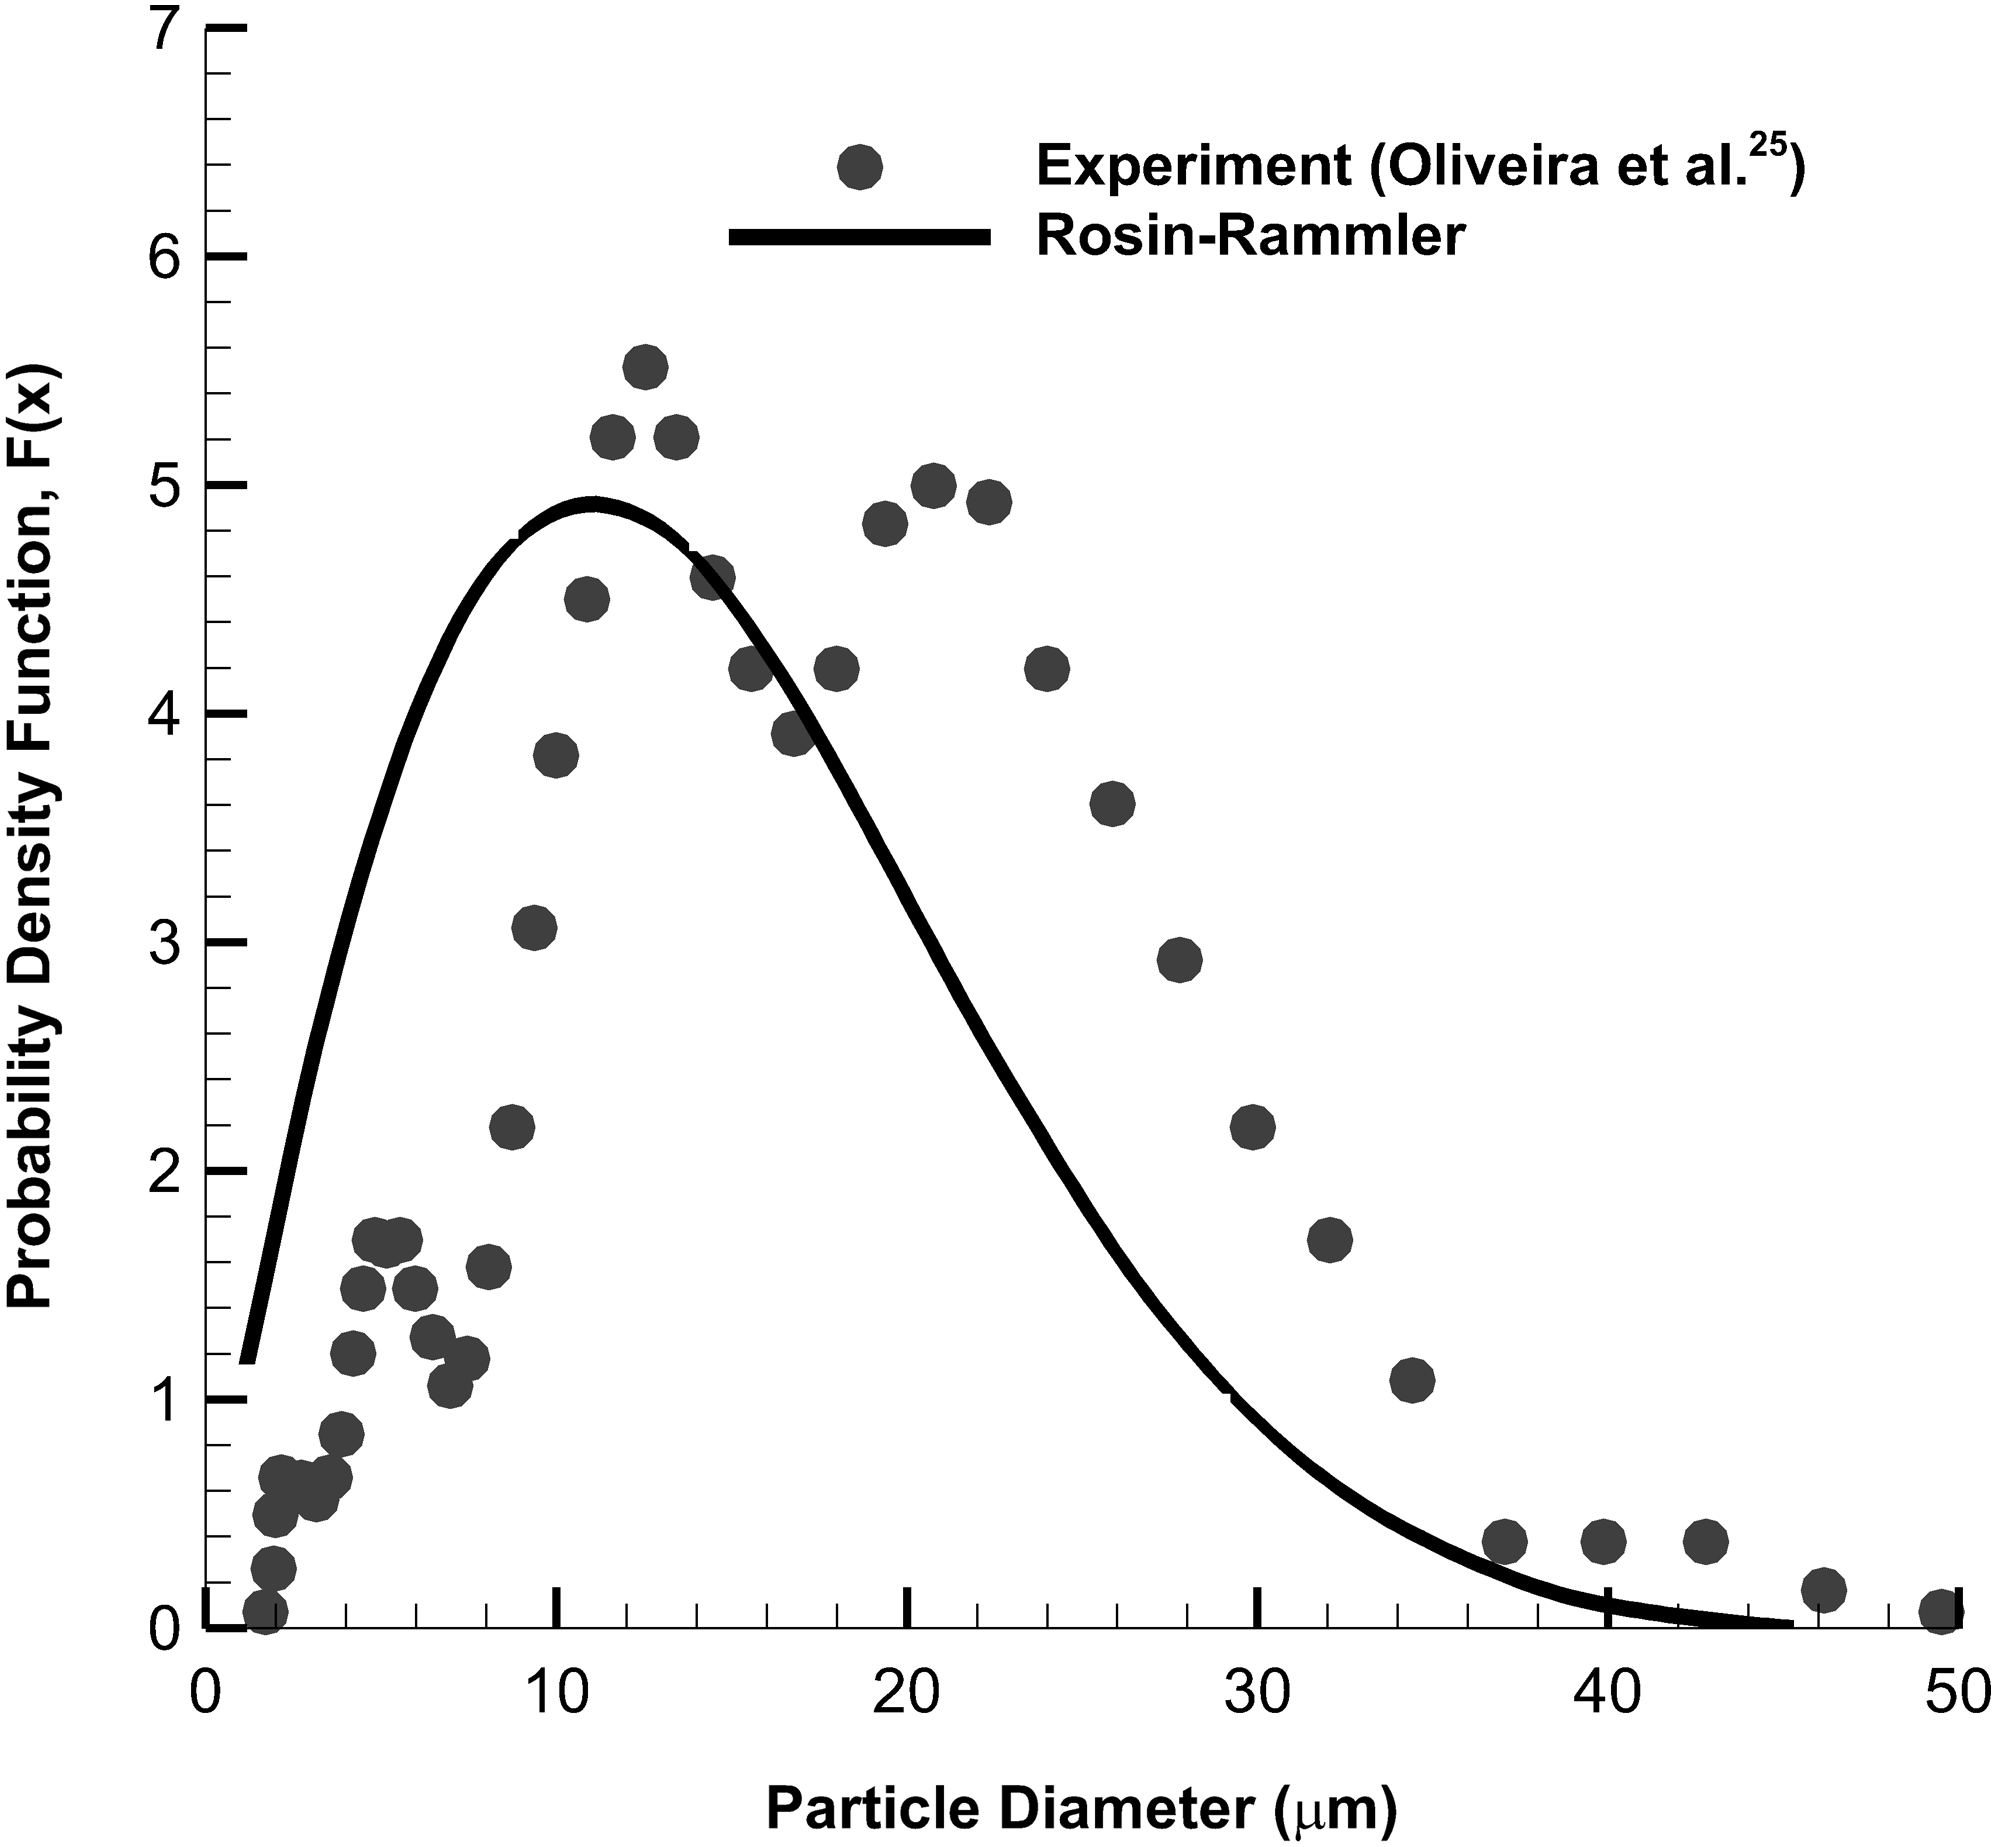
Graphical representation of the pMDI HFA-134a salbutamol experimental data and the curve fitting for the Rosin–Rammler model. Measurements have been obtained at 100 mm from the laser beams of Oliveira et al.(25) HFA, hydrofluoroalkane.
Particle deposition was assumed when it hit the airway surface (which is covered by a mucus layer) and hence no rebounding was considered. Independence was achieved for 40,000 particles, whereby an increase to 80,000 particles yielded a difference of 0.1% in deposition efficiency (Supplementary Fig. S2). Particle tracking results independency was statistically studied for all simulations in this study. Since the drag is the main dominant force on microparticles in the upper airways, results showed less than 1% variation for different tracking calculations. The pMDI design properties such as nozzle, canister pressure, and propellant on spray atomization were not included in this study, and only the initial spray particle conditions based on experimental data were applied at the injection point.
Results
Airflow field
The flow field was analyzed as it serves as a carrier for transporting the particles through the airway. It is, therefore, a strong indicator for identifying potential deposition sites in the airway. Figure 4 shows a velocity magnitude contour in the midsagittal plane for a flow rate of 30 L/min (the contours for flow rates 15 and 60 L/min are given in Supplementary Fig. S3).
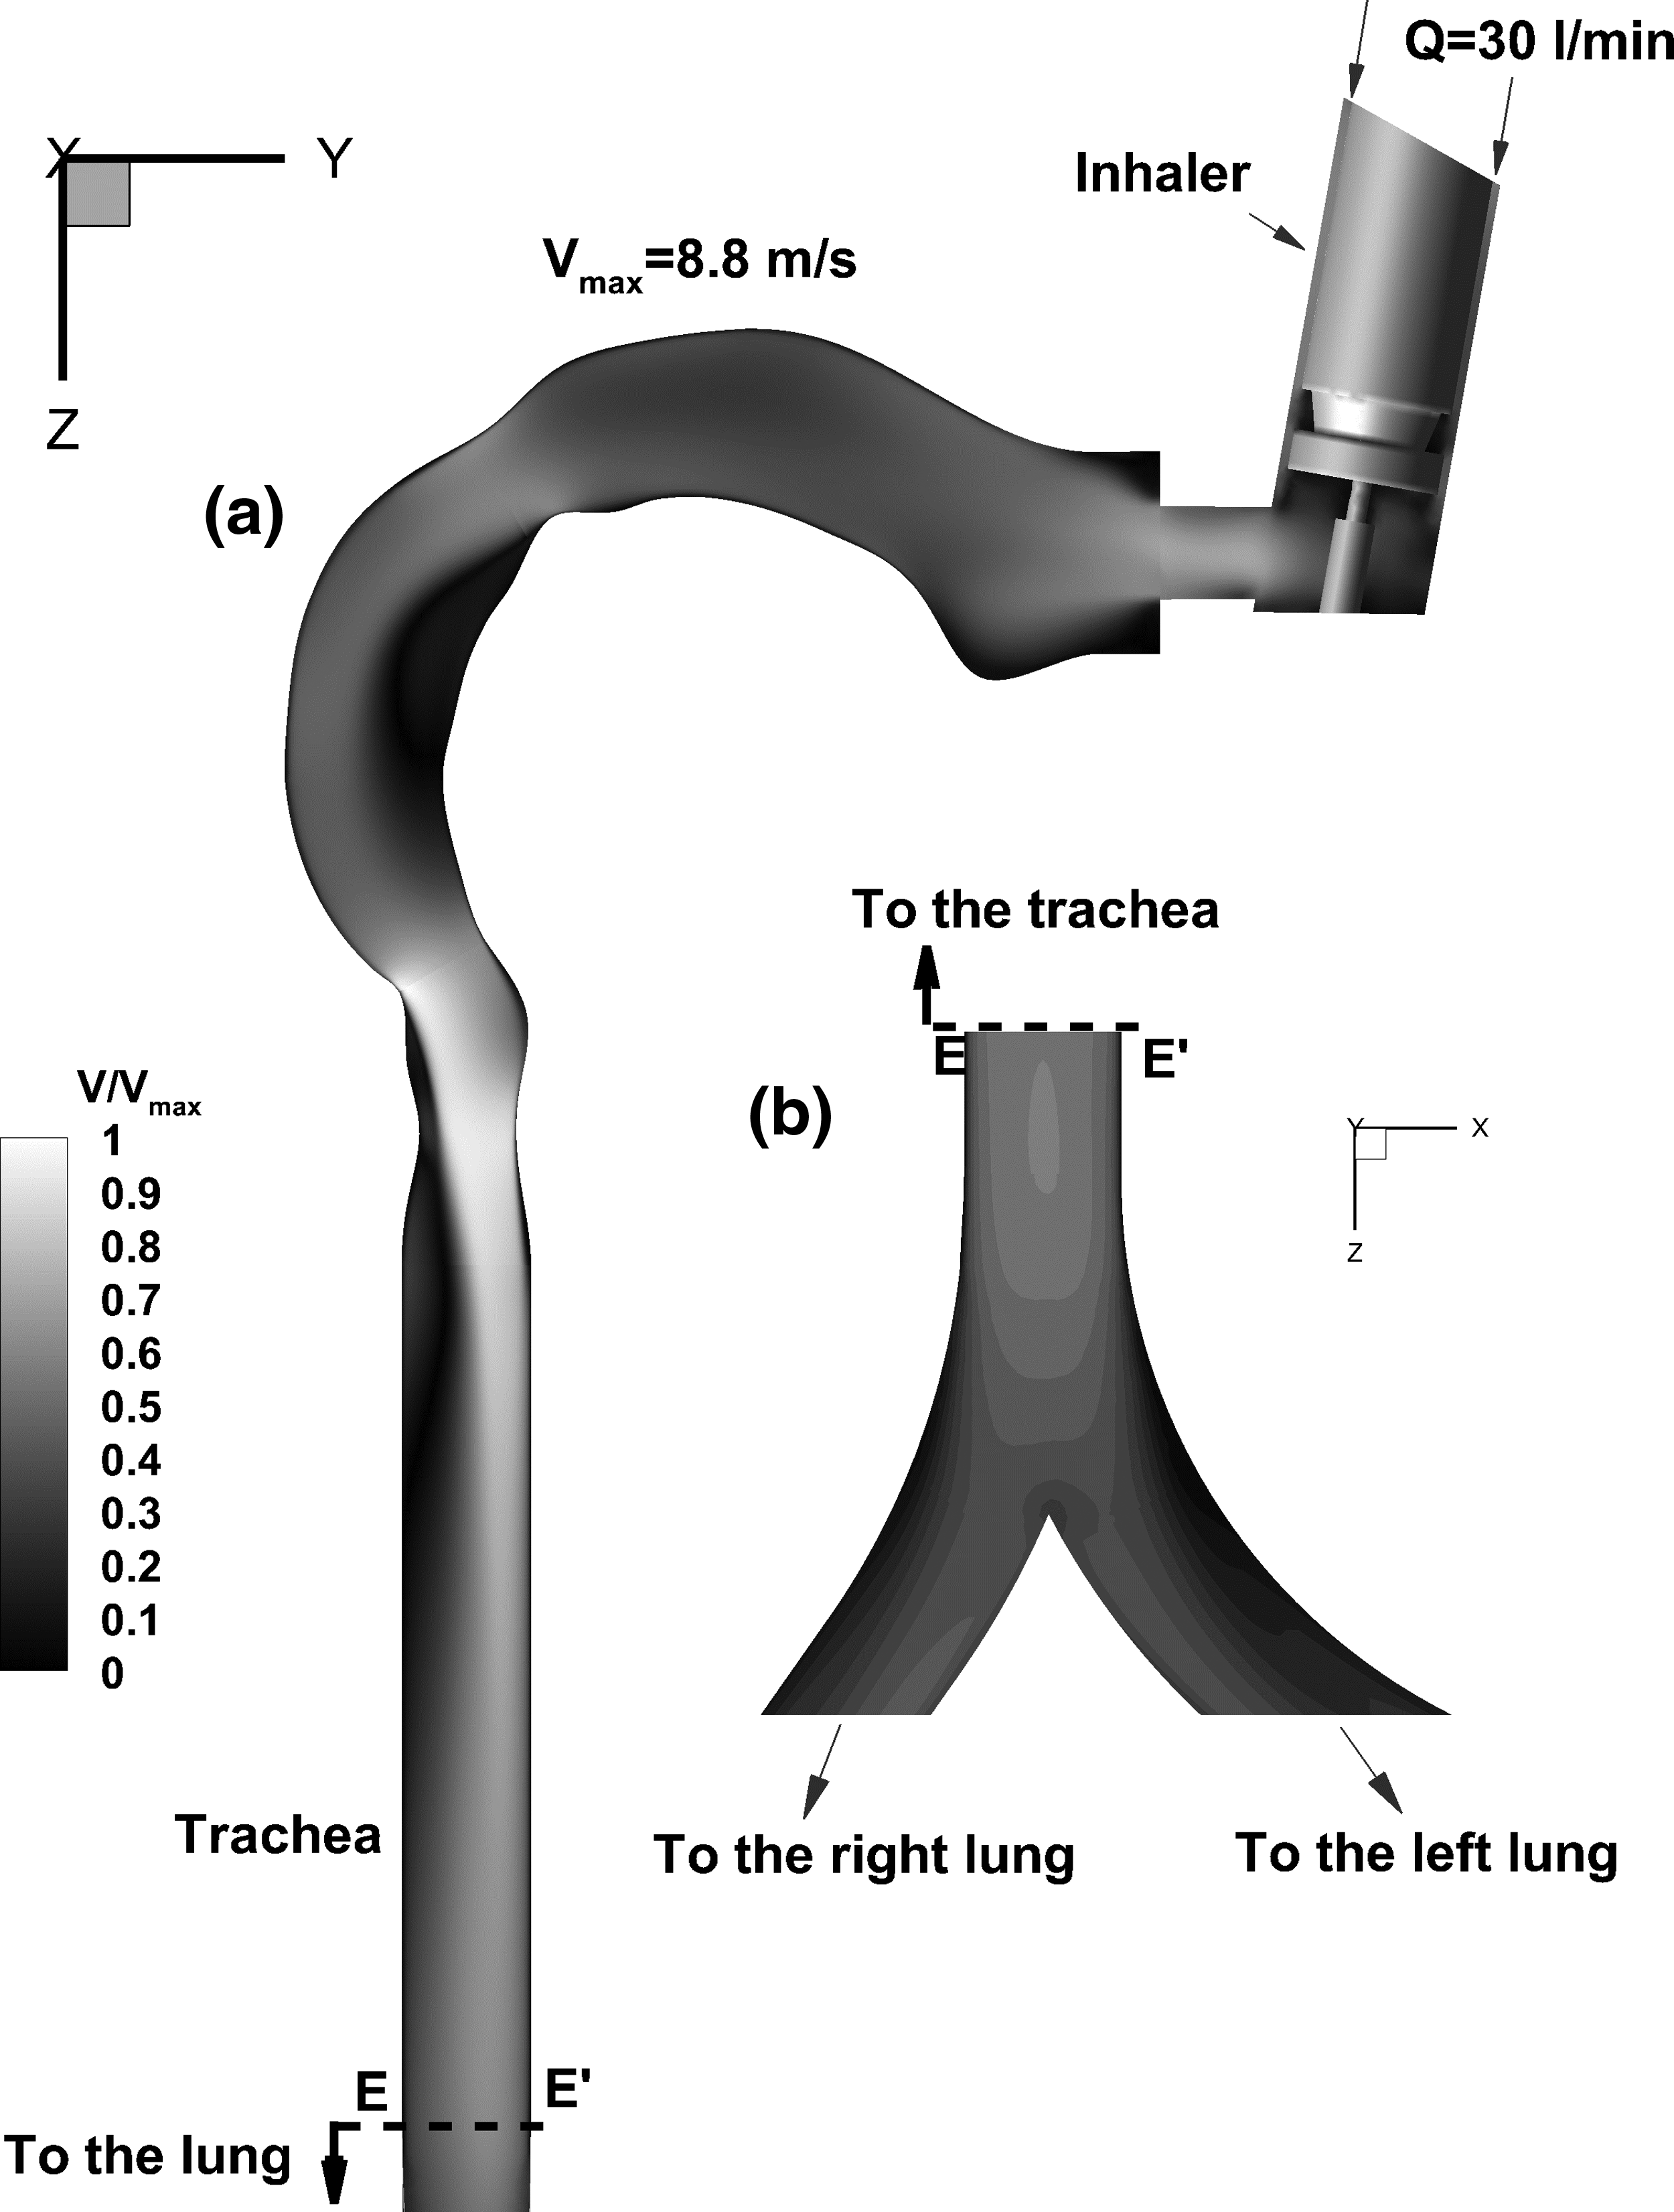
Velocity magnitude contours normalized by maximum local velocity taken at the mid-sagittal plane.
The velocity was normalized by its maximum local velocity, so that the velocity scale is from 0 to 1. Air enters the inhaler through an annulus surrounding the canister. It moves down to get to the lower part of the inhaler body and accelerates through the nozzle where the cross-section area has reduced. This causes an initially high-velocity flow entry at the mouth. The presence of the tongue creates an arch in the oral cavity, which pushes the airflow superiorly, enhancing particle deposition in the upper oral cavity. As the airflow moves from the oral cavity to the pharynx, there is a 90° bend and flow separation occurs. Flow is accelerated toward the back of the throat on the outer wall, whereas a low-velocity recirculating region forms near the inner pharynx wall. It is expected that the outer pharynx wall will be a preferential site for particle deposition.
The airflow is then directed toward the inner larynx wall. The change in flow direction from pharynx to larynx is not as severe as the transition from mouth to pharynx. This leads to a smaller region of low velocity recirculating flow on the outer larynx wall than the recirculating region in the glottis. The velocity reaches its maximum and forms the laryngeal jet(54) at the minimum cross-section at the larynx and remains in the center of the airway with a little tendency to move toward the inner wall. A recirculating region forms next to the trachea outer wall, which covers almost one-third of the trachea caused by the airway expansion from larynx to trachea that reduces the laryngeal jet.
Model validation
Preliminary particle deposition model validation tests were performed by introducing particles ranging from 1 to 10 μm into the oral–pharynx cavity. This particle size range was used as it replicates the experimental work by Cheng et al.(55) allowing a direct comparison. Furthermore, the particles were introduced uniformly over the circular cross-section of the mouth and tracked down to the trachea, which is a simulation different to the sprayed particles from the pMDI. To account for the different particle diameters and inhalation flow rates, the set of results were collapsed into one data set by using the impaction parameter
Results obtained from Cheng et al.(55) are the best curve fit for oral deposition in the replica, whereas Zhou et al.(56) measure the particle deposition in U-of-A and LRRI models. While measurements were performed on different geometries, a similar trend was found among the different models
Figure 5 shows the deposition efficiency curve for the three flow rates. The model results show reasonable agreement, although there is a slight over prediction for IP < 400 and IP > 7000. This discrepancy between the experimental results and simulation may be caused by a few issues. First, there is a difference in the airway surface representation. In the CFD simulations, the surface is treated as a perfectly smooth surface, whereas in the experiments there would exist some form of micro roughness on the surface, affecting the near wall fluid and particle interaction and behavior.

Validation of particle deposition efficiency in the human oral airway models. LRRI, Lovelace Respiratory Research Institute.
Second, the use of Reynolds averaged Navier-Stokes (RANS) turbulence models can never be perfect, particularly complex geometries that exhibit significant pressure gradients, flow separation, and recirculations are some uncertainties with RANS-based turbulence models that we have used. Higher order turbulence models such as large eddy simulations provide more accurate flow field results but are very computationally intensive and prohibitive in many cases. In terms of a compromise, we have an RANS turbulence model that has been adopted in the literature and proven to perform well (but not necessarily perfect).
Particle deposition pattern
Figure 6 shows particle deposition pattern along the airway for 30 L/min, spray cone angle of 10°, and spray initial velocity of 110 m/s. Because the airflow is pushed up after being blocked by the lower part of the inhaler, it is expected that some particles would be deposited on the upper part of the inhaler nozzle. Inertial impaction is the most dominant factor in microparticle deposition in the upper airway.(40,57) Larger particles suspended in the fluid have less time to adjust to sudden changes in the airflow streamlines. Thus, larger particles have more possibility to be deposited on curved boundaries. The presence of tongue blocks particles' path and as a result the large particles cannot adapt their path to the airflow new streamlines, consequently they are deposited on the mouth wall.

Particles' transport and deposition pattern on the airway for 30 L/min airflow rate, spray cone angle of 10°, and spray initial velocity of 110 m/s.
The obtained results indicated that in all cases for different injection velocities and spray cone angles, most particles enter the right lung. For example, for 30 L/min airflow rate and the spray injection velocity of 110 m/s and spray cone angle of
The major portion of the trachea also lies to the left of the carina of the first bifurcation that provides greater preference to the left lung. In our study, a simplified representative geometry based on the work of Cheng et al.(55) was used. Another difference in the modeling includes that Lambert et al.(58) use a parabolic velocity inlet at the mouth for 20 L/min, whereas in this study, the air was drawn to the mouth through the pMDI annular space for 15, 30, and 60 L/min.
Figure 7 shows the particle deposition pattern for different ranges of particle sizes with an initial spray velocity of 110 m/s, injection cone angle of 10°, and airflow rate of 30 L/min for properties of particles given in Table 1. In general, increasing the particle size range causes more particles to be deposited on the airway wall. Only 12.1% of the total deposited particles (91.8%) belongs to the range of 1.22–10 μm. This value increases to 18.75% for the 10–20 μm range and then reaches 21% and 40% for 20–30 μm and 30–45.6 μm ranges, respectively.
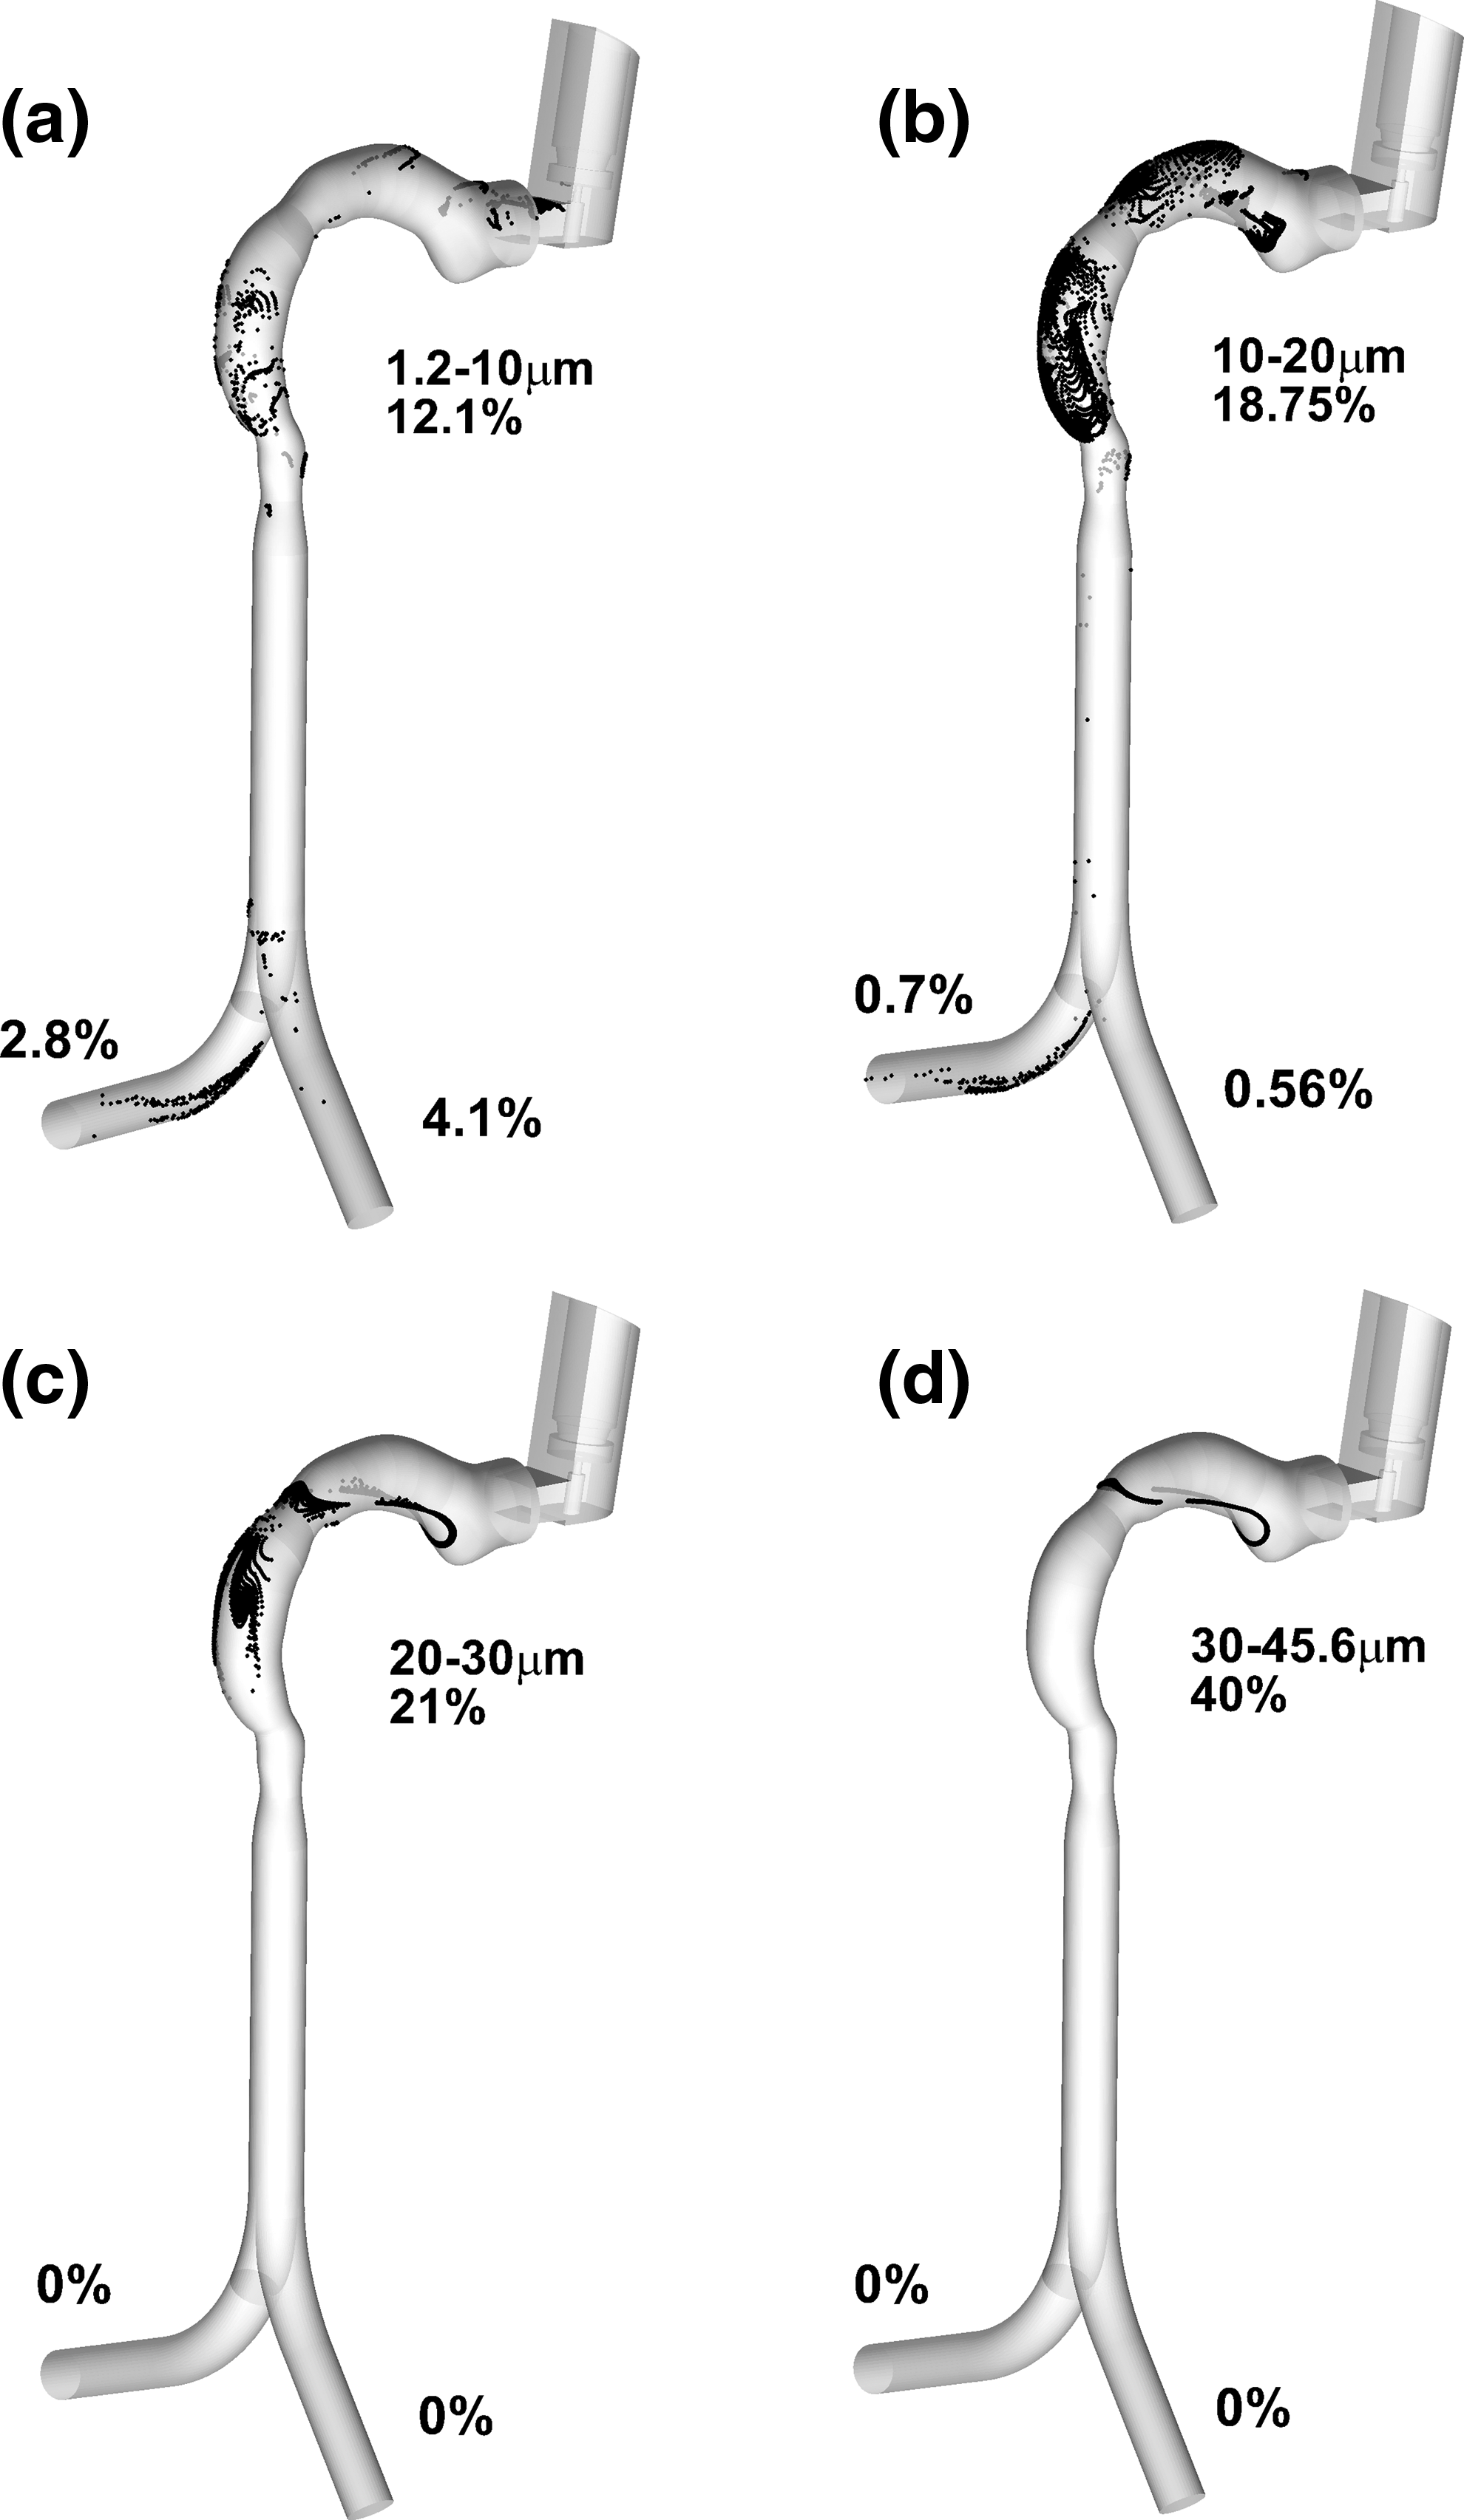
Spray deposition pattern in the upper airway for different size ranges.
Particles mostly deposit on the pharynx and only particles less than 20 μm have chance to get to the lung. This leaves 2.8% of the 1.2–10 μm range particles delivered to the left lung and 4.1% to the right lung, whereas 0.7% of the 10–20 μm range particles was delivered to the left lung and 0.6% to the right lung. The particles in the range of 20–30 μm and 30–46 μm were all deposited on the airway wall. If we convert the number of particles into its mass, then the total mass of particles entering the left and right lungs was nearly an equal distribution of almost 2.5% of the total mass of particles for each lung. The average particle size delivered to the right lung was 6.7 μm and that delivered to the left lung was 8.8 μm.
Particles less than 10 μm have more scattered deposition pattern, whereas 10–20 μm particles are mostly deposited on the pharynx, larynx, and left bronchus. However, the deposition rate of 30–46.5 μm particles is the maximum, they almost are totally deposited in the mouth cavity on a determined deposition site.
Effect of spray injection velocity
The results show that increasing the spray injection velocity over the range of 100–150 m/s decreases the deposition rate in general. For all three flow rates, the delivery efficiency is less than 10%, which is in a good agreement with the literature(10,11,59) (91.8% deposition rate for 30 L/min, injection velocity 110 m/s, and injection angle

Effect of spray injection velocity on overall deposition efficiency.
Figure 8 shows the effect of spray injection velocity on the three inspiration flow regimes. The deposition rate for all injection velocities for 30 L/min is obviously lower than for 15 and 60 L/min, whereas the 15 and 60 L/min deposition curves have surprisingly identical trend. The 30 L/min airflow rate shows about 5% improvement on average in drug delivery to the lung compared with 15 and 60 L/min airflow rates.
The injection velocity does not show a significant effect on the deposition rate. Changing the spray initial velocity from 100 to 150 m/s decreases the deposition rate by 1% and 1.5% for 30 and 60 L/min, respectively, whereas for 15 L/min it is less than 1%. In brief, increasing the spray velocity in the range of 100–150 m/s increases the inhaler efficiency; however, this improvement is not very considerable.
Calculating the particle stopping distance can give us a more deep understanding of the effect of spray injection velocity on the deposition rate. Particle stopping distance is a path that a particle travels with its initial inertial force, and then the drag force from the fluid flow would be the main driving force. The stopping distance for a spherical particle in micron scale can be calculated as
In comparison with the scale of the upper airway (the diameter of the mouth inlet is 20 mm), these stopping distance values guarantee deposition of most particles in the airway walls. However, changing the initial velocity from 100 to 150 m/s does not make much difference in the particle deposition rates. For the dp = 1.22 μm particles, which is the minimum particle diameter in the spray, the stopping distance reaches
Effect of spray injection angle
Spray cone angle effect on inhaler performance is investigated over the range of 2°–10° (Fig. 9). We chose to analyze the angle range based on experimental data, showing values typically in the range of 0°–14° spray cone angles.(26,60) For all spray cone angles, the deposition rate for 30 L/min is lower than that for 15 and 60 L/min. The deposition efficiency for 30 and 60 L/min decreases when the spray cone angle increases. However, for 15 L/min, the spray cone angle does not show remarkable effect on the deposition curve. The 30 L/min curve shows more sensitivity to the spray angle so that

Effect of spray cone angle on overall deposition efficiency.
However, very high injection angle will direct particles to the inhaler nozzle and mouth cavity boundaries, which in turn can increase the deposition rate and lower the efficiency.
Effect of PSD
Variations in the PSD can be caused by many factors such as atomizer nozzle design, propellant, drug formulation, and actuation pressure. The way a patient activates the inhaler can also affect the PSD. A range of PSDs were created by changing the MMAD value of the initial Rosin–Rammler distribution shown in Figure 5. The resulting PSDs are shown in Figure 10a, whereby smaller MMADs shifted the distribution to the left and hence a smaller size range of particles are formed. We also replicated measured PSD data from Lewis(61) using the Rosin–Rammler distribution function. The distribution is given in Figure 10b.
The effect of decreasing the MMAD on a PSD decreases the deposition efficiency (Fig. 11); however, this effect is not substantial until the MMAD is sufficiently small. The results show that decreasing MMAD from the original value of 16.5 to 10 μm had negligible effect, with the deposition efficiencies overlapping. A further decrease of MMAD of 6 μm showed a small decrease in the deposition efficiency, and it required the MMAD to reach 2 μm for the deposition efficiency to decrease to as low as 70% (at spray cone angle of 10o). The deposition pattern for MMAD of 2 and 6 μm is shown in Figure 12, whereby deposition remains dominantly in the oropharynx region.
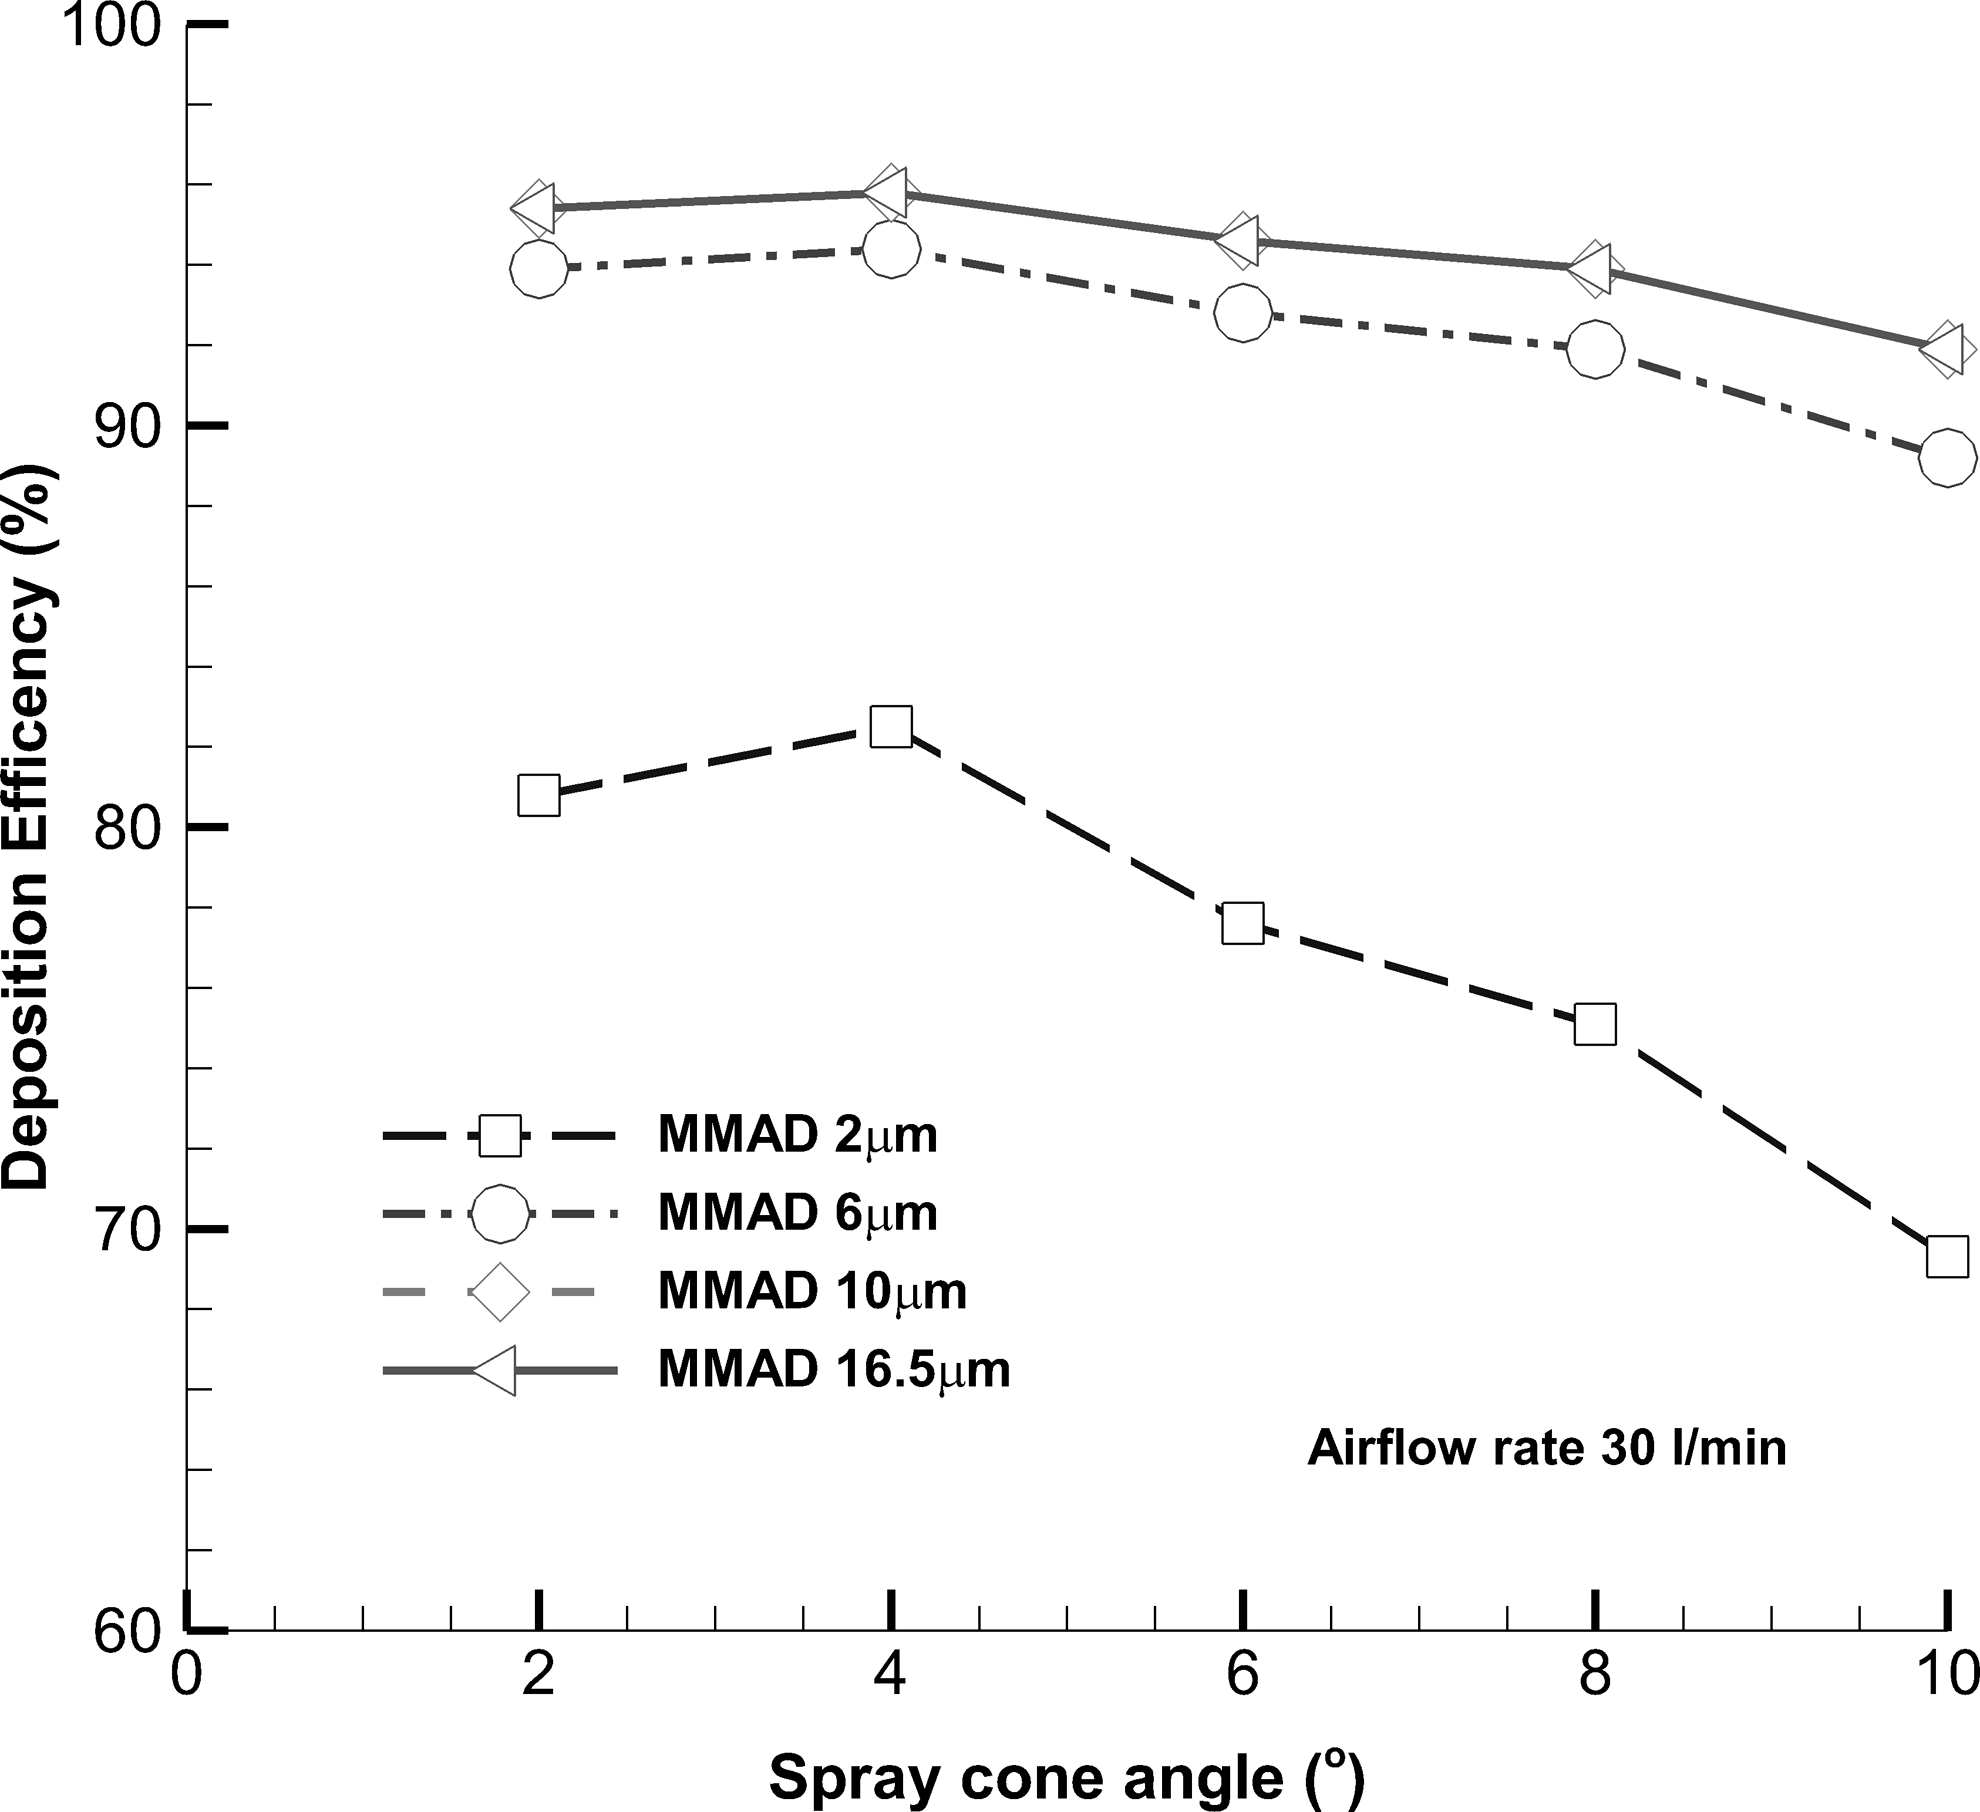
Deposition efficiency with particle size distributions with different MMADs for all spray cone angles. Airflow rate of 30 L/min.
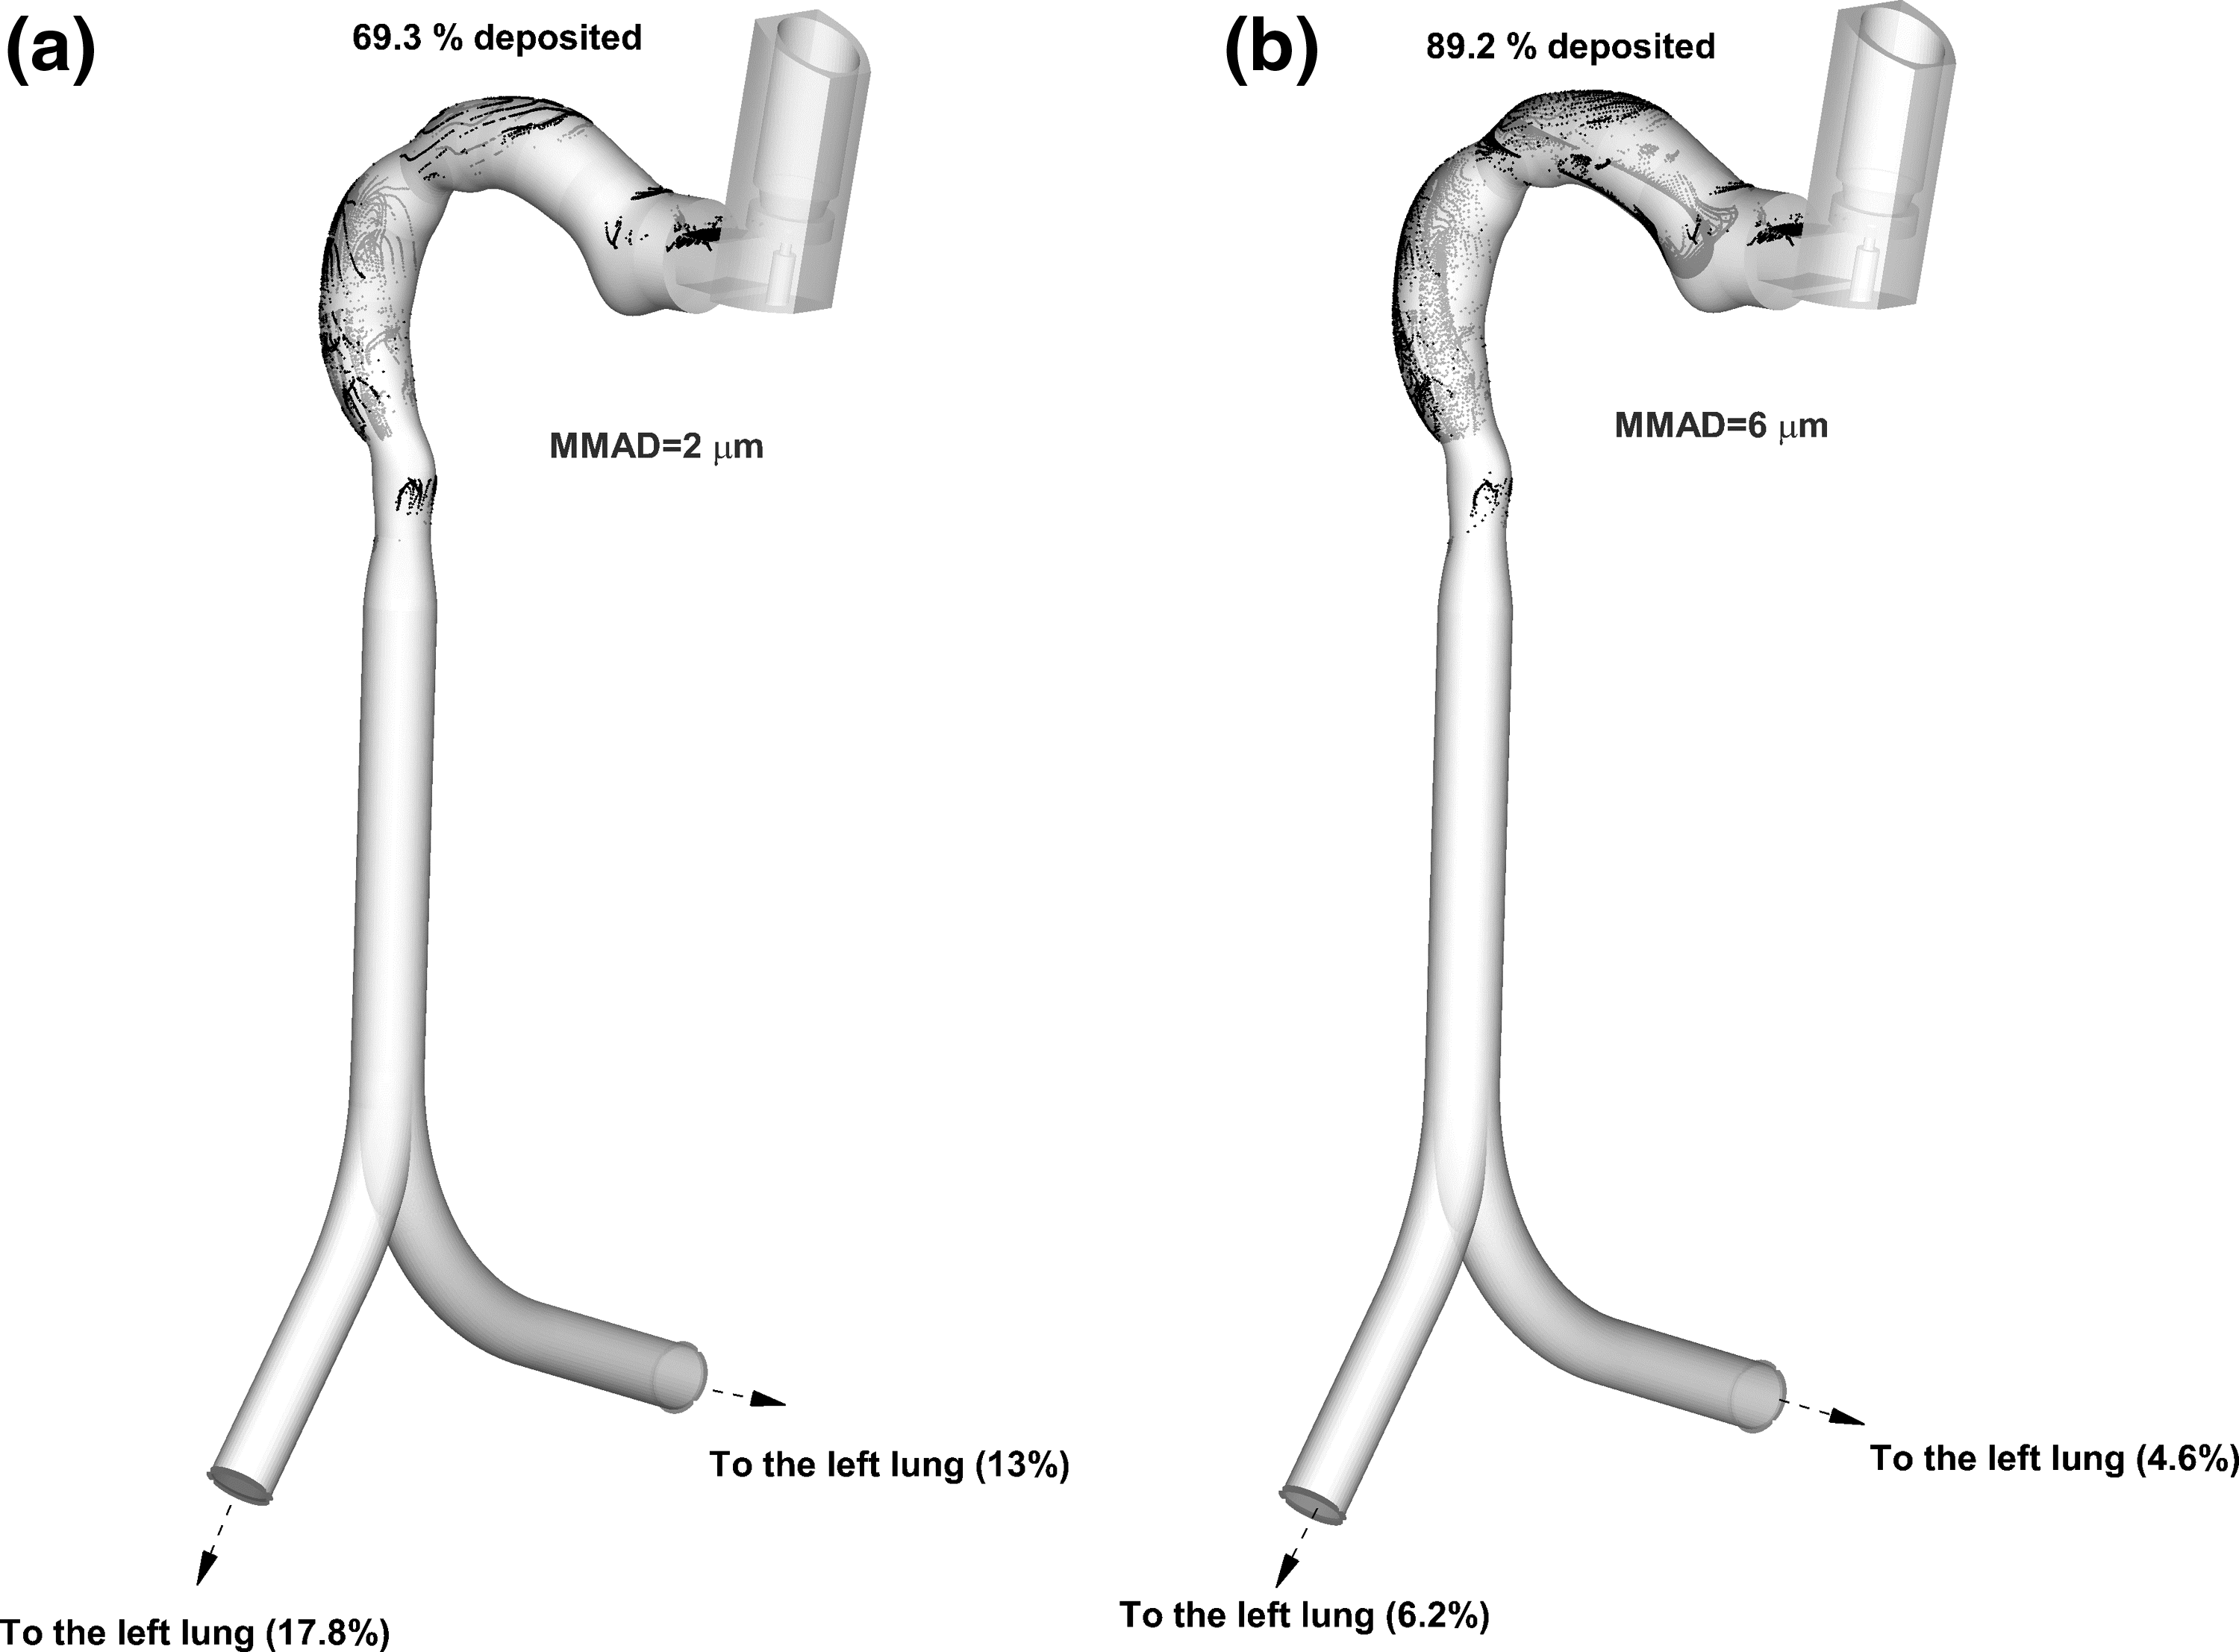
Particle deposition pattern for different MMADs, for airflow rate 30 L/min (size distribution by Oliveira et al.(25)).
This suggests that the fraction of larger particles continue to be deposited in the oropharynx region. There is negligible deposition in the trachea, which suggests that the smaller sized particles (and, therefore, lower inertial particles) are able to navigate through the airway geometry. Consequently, there is an increase in the fraction of particles that enter both left and right lungs.
The deposition efficiency for the PSDs by Lewis(61) is compared with the original profile obtained by Oliveira et al.(24), shown in Figures 13 and 14. There is a very large difference whereby the PSDs from Lewis(61) show a much smaller deposition efficiency. The lowest deposition occurs for the highest spray cone angle tested that was 10o and the highest initial spray velocity tested that was 150 m/s. The MMAD values used in the Lewis(61) PSDs were 2.3 and 3.3 μm and both distributions produced approximately 66% deposition efficiency for a spray cone angle of 10o. Comparatively, the PSD by Oliveira et al.(24) with an MMAD of 2 μm yielded a deposition efficiency of 70% for a spray cone angle of 10°.
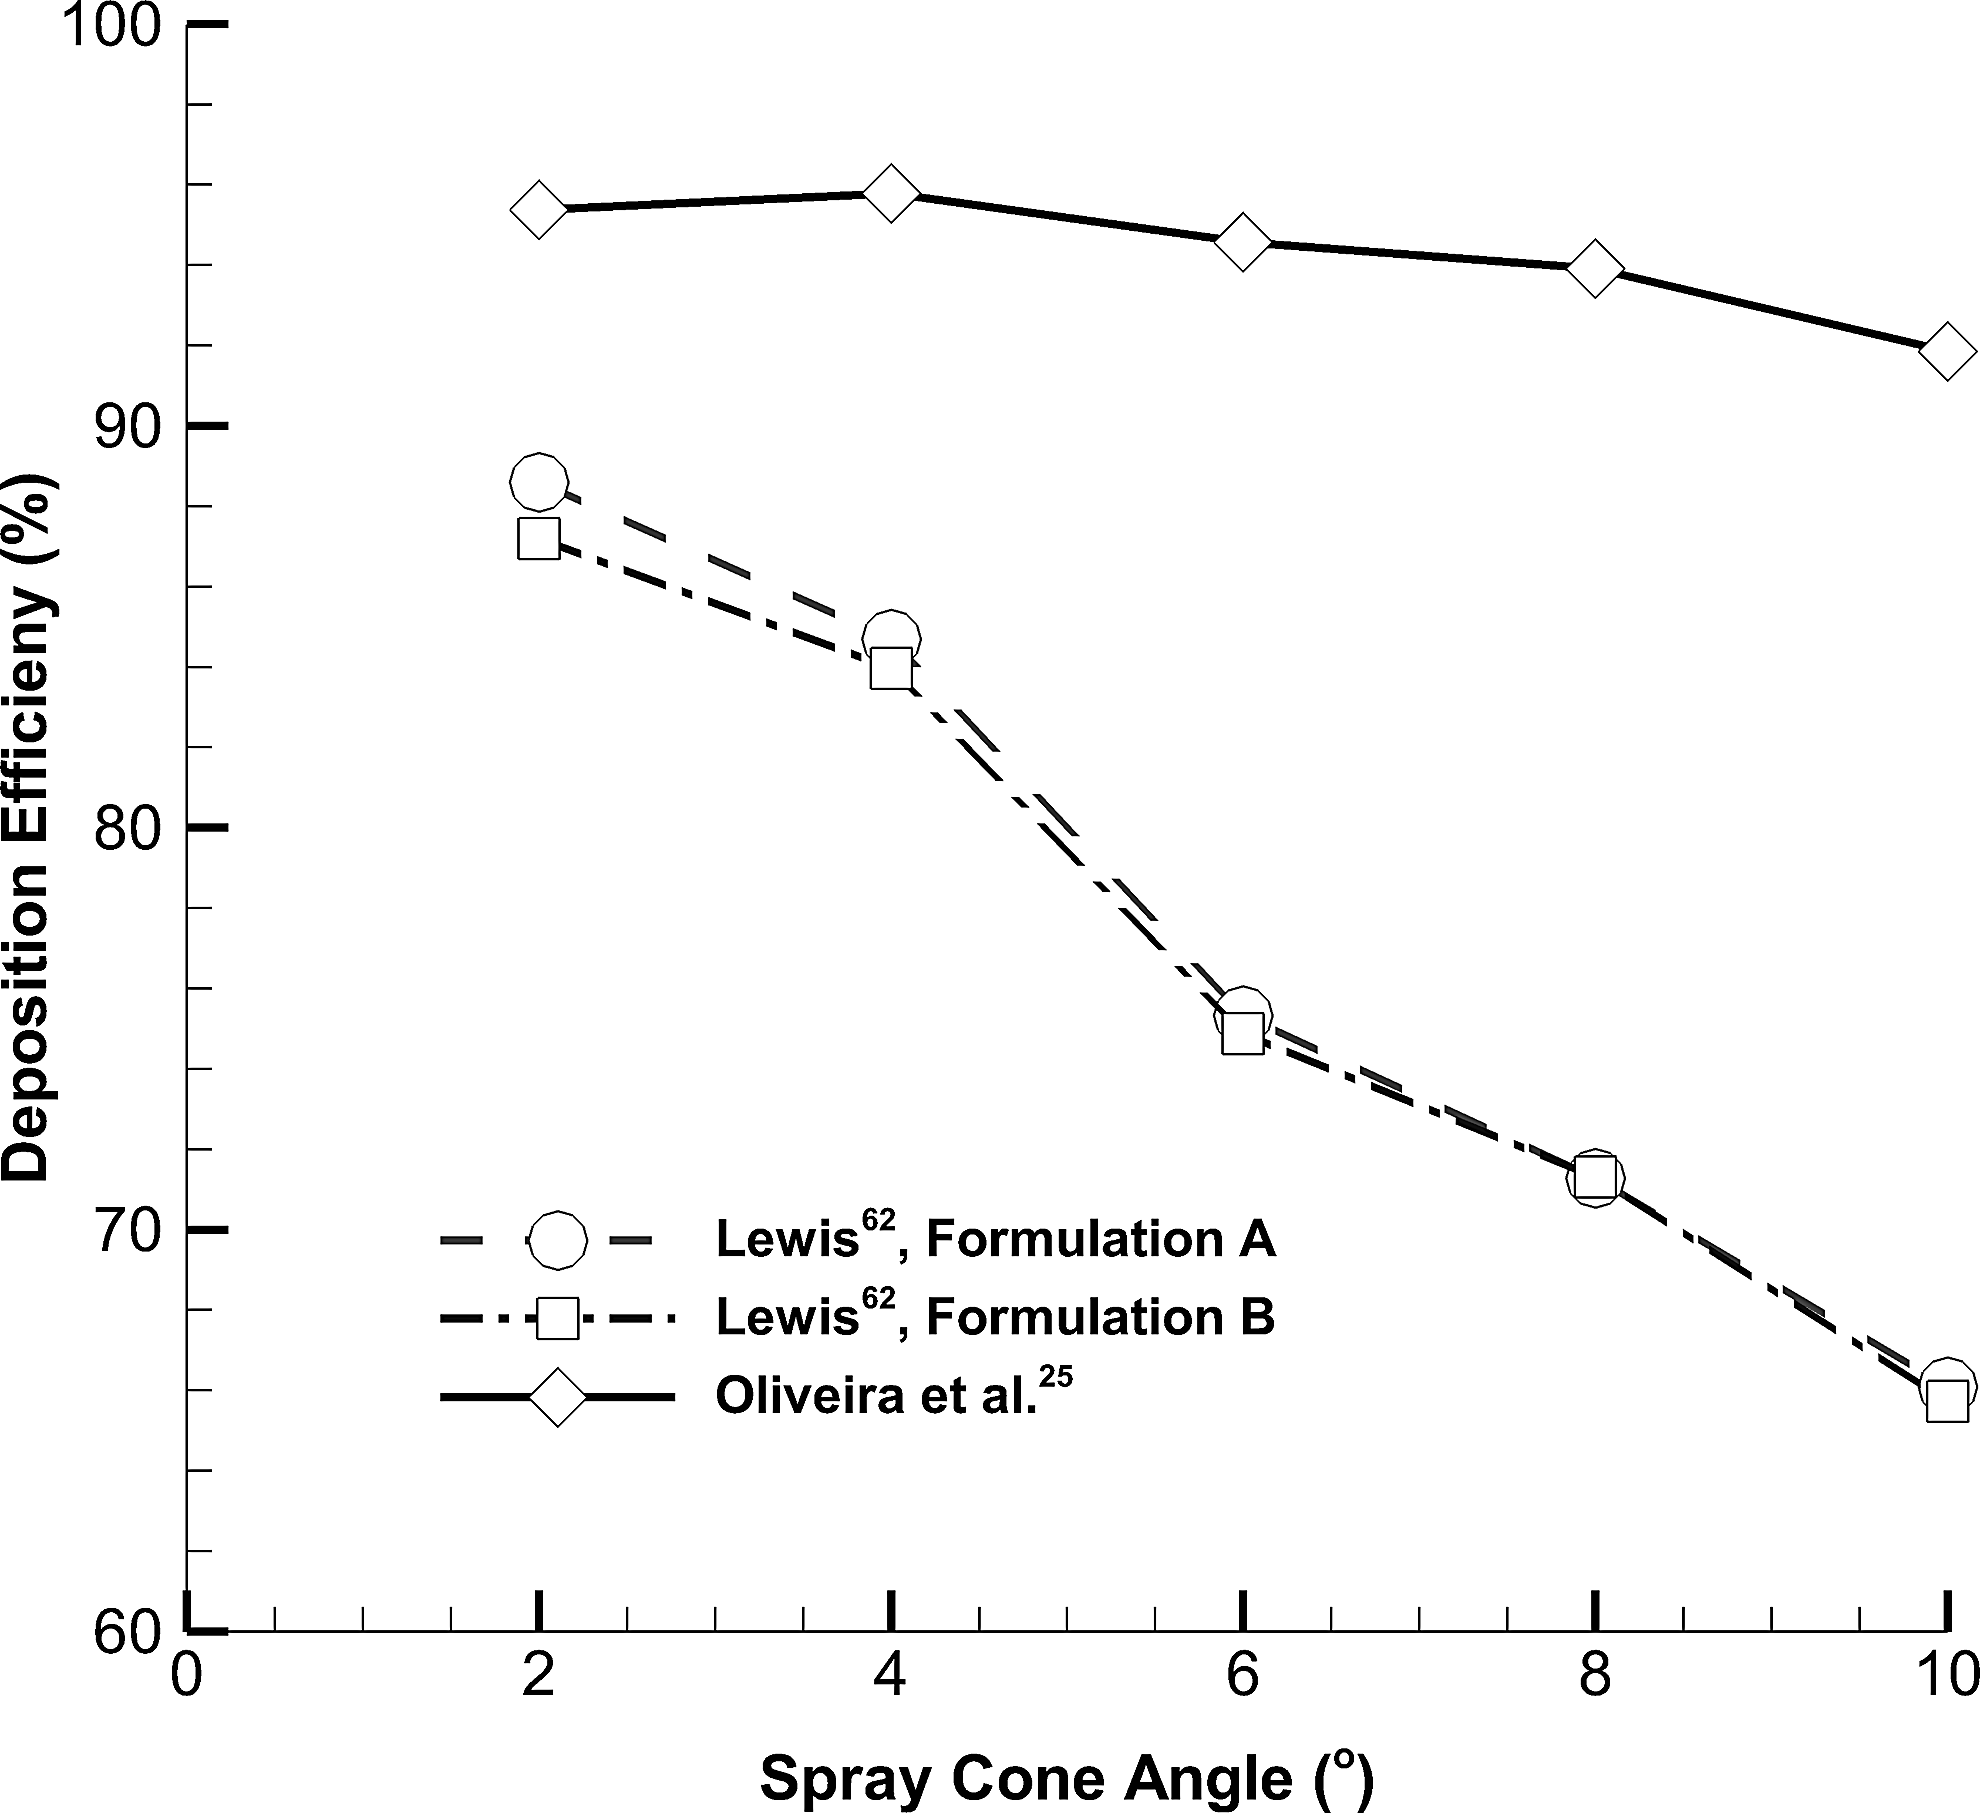
Spray cone angle change effect on particle deposition in the upper airway for different spray size distributions
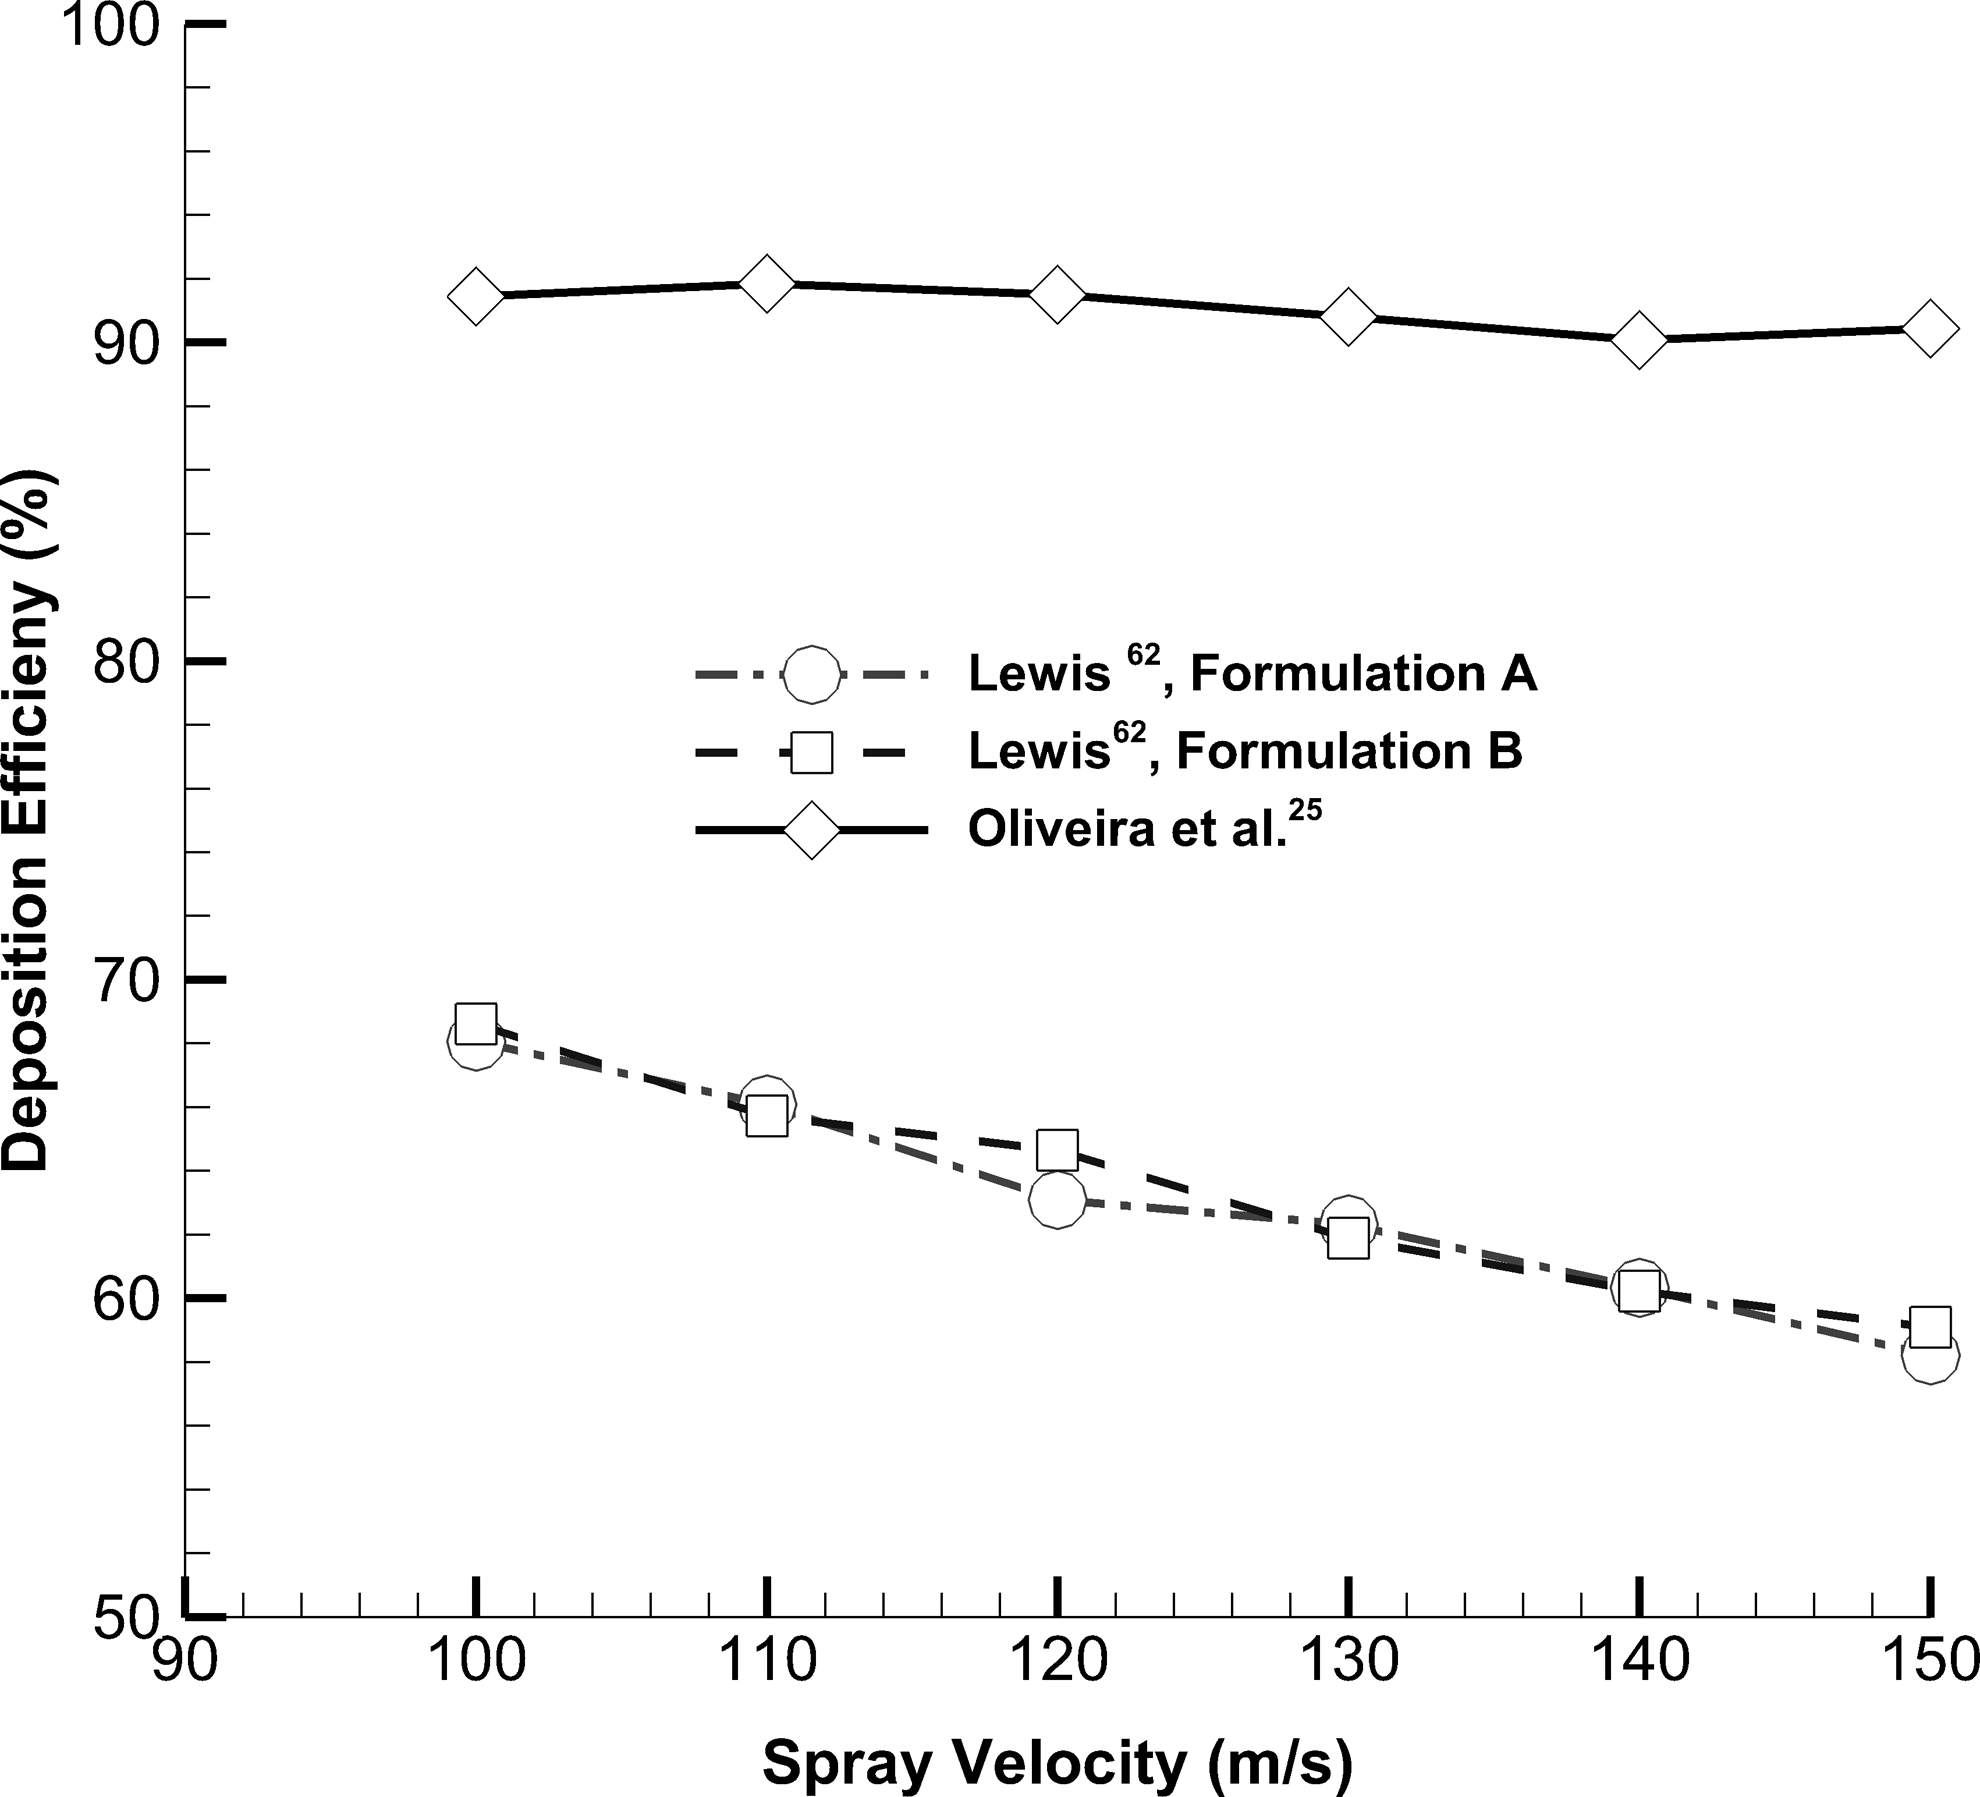
Spray injection velocity change effect on particle deposition in the upper airway for different spray size distributions
This suggests that there is some consistency in predicting the deposition efficiency from different distribution curves with the same or similar MMAD values despite the PSDs being obtained independently from each other (PSDs by Oliveira et al.(24) and Lewis(61)).
Discussion
Spray injection velocity and the cone angle are investigated in an idealized upper airway extending from mouth to the main bronchus. The air flow structure for all three main flow rates 15, 30, and 60 L/min reproduced the same characteristics. The first high velocity region occurred at pMDI nozzle, but as the air enters the mouth, the airway expands leading to a decelerated flow in the mouth. The flow patterns show a second high velocity region at the transition from the oral cavity to the pharynx and the airway experiences a 90° bend. A third high velocity region is found at the glottis, where the minimum cross-section in the airway is found. These gross airflow structures are consistent with the flow patterns reported by Xi and Longest(62) for simplified and realistic models of oral airway.
Particle deposition results by Kleinstreuer et al.(19) showed that at a flow rate of 30 L/min, deposition in the upper airway for HFA-pMDI and CFC-pMDI reached 53.4% and 94.8%, respectively. However, in this study deposition rate for a HFA-pMDI falls in the range of 90%–92% for 30 L/min and with an injection angle of 10°. The main reason for this difference is (i) the distance of the particle injection location and the oral cavity shape and (ii) the spray size distribution that was obtained from different experimental data sets (5.2–10.8 μm for HFA-134a and 7.5–16.5 μm for CFC-based pMDI).
Zhang et al.(63) experimentally studied the deposition in three mouth–throat models with Qvar® inhaler (pMDI). Their results showed deposition rates of 25.8% ± 4.2%, 24.9% ± 2.8%, and 12.2% ± 2.7% for the idealized, highly idealized, and USP mouth–throat models, respectively. These values are significantly different from the deposition rate obtained in this study, which was generally ≥90%. The main reason for this considerable discrepancy is because of the PSD. The MMAD of Qvar inhaler is in the range of 0.9–1.1 μm,(64) whereas the MMAD of Ventolin® pMDI-HFA134a used in this study is 16.5 μm.(60,65) Our PSD (Fig. 3) shows a range of 1–50 μm and a modal point at 10 μm.
Smaller particles show more scattered deposition pattern. For all three airflow regimes, increasing the spray initial velocity over the range of 100–150 m/s and spray angle over the range 2°–10° decreases the deposition rate. The 30 L/min airflow rate shows a better performance in the delivery of drug particles to the lung than the 15 and 60 L/min airflow rates. The high airflow rate increases particles' inertial force, resulting in higher deposition in the upper airway. The lower airflow rate probably does not produce enough drag force to conduct the particles through the upper airway and particles may separate from the main air stream and deposit on the airway wall. Therefore, 30 L/min is the optimum airflow rate that carries drug particles more efficiently to the lung.
The deposition rate shows more dependency on spray injection angle than the injection velocity. The PSD characteristics changes with the inhaler type, the measurement distance from the nozzle, the measurement method, and the time delay after inhaler actuation. Cheng et al.(12) showed that HFA-based pMDI produced lower deposition in the upper airway than a CFC-based propellant. This was attributed to the HFA-propellant producing a lower initial spray velocity, initial droplet evaporation rate, and possibly initial droplet. However, our results showed that spray injection velocity had little effect on the deposition rate than the spray cone angle and inhalation rate.
Different PSDs were simulated using the same conditions. The results showed that the deposition efficiency was dependent on the particle MMAD. When a similar MMAD particle size was used but a different distribution curve was produced, a very similar deposition efficiency curve was found. The deposition curve was insensitive to PSD curves when the MMAD is high enough (≥8 μm). It should be noted that aerosolization of pressurized medication through inhaler produces particles with electrostatic charge.(66)
The effect of electrostatic charge has not been investigated in this study, which might have an influence on the results. Moreover, the evaporation and agglomeration of aerosolized medication have not been considered in this study. In addition, a single idealized geometry is used that does not represent all features of a real upper airway. Further study is required to tackle these issues.
Footnotes
Acknowledgments
We would like to acknowledge support of this work from Australian Government Research Training Program Scholarship, the financial support provided by the Australian Research Council (Project ID: DP160101953), and the resources provided at the NCI National Facility Systems at the Australian National University through the National Computational Merit Allocation Scheme supported by the Australian Government.
Author Disclosure Statement
No competing financial interests exist.
References
Supplementary Material
Please find the following supplemental material available below.
For Open Access articles published under a Creative Commons License, all supplemental material carries the same license as the article it is associated with.
For non-Open Access articles published, all supplemental material carries a non-exclusive license, and permission requests for re-use of supplemental material or any part of supplemental material shall be sent directly to the copyright owner as specified in the copyright notice associated with the article.
