




Abstract
Abstract
Background:
Exposure following oral inhalation depends on the deposition pattern of the inhaled aerosol, the extent and rate of oral and pulmonary absorption, as well as systemic distribution and clearance. For lipophilic inhaled compounds with low water solubility and high permeability, the extent and rate of pulmonary absorption can be assumed dependent on deposition pattern as well as dissolution rate.
Materials and Methods:
A mechanistic model of airway deposition, mucociliary clearance, dissolution, absorption, and dissipation was applied to simulate systemic exposure of the novel selective glucocorticoid receptor modulator, AZD5423, when dosed to healthy volunteers using two different nebulizers and two different dry powder inhalers in combination with two different primary particle size distributions. Results from simulations were compared with observed pharmacokinetic data.
Results:
Variations in systemic exposure (plasma concentration profile, AUC, and Cmax) resulting from variations in dose, deposition pattern, and dissolution rate could not be predicted solely from variations in delivered dose or predicted lung dose (as assessed using an anatomical mouth–throat model), suggesting incomplete pulmonary bioavailability. However, simulated systemic exposure well predicted observed systemic exposures for all tested formulations and devices. Furthermore, simulations of airway tissue exposure suggested that it was not directly linked to systemic exposure.
Conclusions:
Results support the initial hypothesis that systemic exposure of poorly soluble inhaled drugs is a complex but predictable function of dose, deposition pattern, and rate of dissolution. Furthermore, simulations indicate that local exposure for these types of drugs is not well correlated with systemic exposure. Hence, equivalence with respect to local exposure, and thus with respect to pharmacodynamic effect, cannot be fully inferred from systemic pharmacokinetic equivalence alone.
Introduction
I
In ciliated airways, dissolution is in kinetic competition with mucociliary clearance and slowly dissolving drug is thus likely to be, to a significant extent, removed from the lung by the mucociliary escalator, resulting in low pulmonary bioavailability.(1,2) Hence, local and systemic exposure can (for this class of compounds) be assumed to vary not only with total lung dose but also with initial deposition pattern. In addition, material properties such as solubility and specific surface area (primary particle size), as well as luminal compound concentration (extent of sink condition), can be assumed to impact the rate and extent of compound absorption from the lung. Finally, disease-related changes, not only to initial deposition pattern but also (which may be less obvious) to mucociliary clearance rates as well as mucus composition, are known to exist and may also contribute to variability in exposure.(7)
The lack of a clear-cut causal relationship between key dosing properties of an inhaled product, such as the delivered dose and the particle size distribution, and the resulting clinical performance is reflected in the regulatory landscape. Regulatory guidelines in key markets(8–10) frequently demand that claims of clinical equivalence are supported by in vitro data on product performance as well as by in vivo data, demonstrating safety based on equivalent pharmacokinetics and efficacy based on equivalent pharmacodynamics. This has obvious implications on both development of new products and generic replacement of products on the market.
In the former case, the demand for equivalence results in a significant frontloading of development efforts, compared with, for example, oral products, as all pivotal clinical studies must be conducted using essentially the same device and formulation which is intended to be marketed. In the latter case, generic replacement is potentially delayed as it requires expensive clinical programs. Hence, there are strong drivers to develop new science and novel experimental and computational methods that could enable identification and assessment of key inhaled product performance attributes and their causal relationship to both systemic and local exposure following inhalation.(6,11,12)
Recently, mechanistic in silico models have been developed to simulate gastrointestinal absorption profiles after oral dosing, and now also pulmonary absorption profiles after oral inhalation.(13–15) The latter build on and integrate the computational lung deposition models pioneered in the environmental sciences to predict lung burdens of pollutants based on aerosol physics, aerosol properties, airway morphology, and breathing patterns.(16,17) In addition, the integrated deposition models are adapted to bolus aerosols(18) with bimodal particle size distributions in nonideal clouds(19) inhaled through a mouthpiece.(20)
Mechanistic models also simulate parallel postdeposition events such as dissolution, clearance from lung through the mucociliary escalator, absorption through airway mucosa, and systemic distribution and disposition. This combination of a computational deposition model with a mechanistic model simulating postdeposition events enables simulation of systemic as well as local exposure profiles after inhalation, taking into account how several key product attributes interact to shape the absorption profile. However, although promising in theory, the practical clinical relevance of simulations made using mechanistic models is still unclear given that a very limited dataset is available comparing clinical data and simulations.
Given that the impact of postdeposition events such as dissolution and clearance is most pronounced for inhaled compounds with low water solubility (as discussed above), we decided to test the clinical relevance of simulated exposure profiles on a lipophilic nonsteroidal selective glucocorticosteroid receptor modulator (SGRM), AZD5423. Clinical exposure data and key product performance characteristics were obtained from two recently published studies on AZD5423,(21) where AZD5423 was administered using six different investigational products with significant differences in initial deposition patterns and release rate (as predicted from differences in primary particle size).
In addition, each study contained a separate intravenous (iv) and per oral (po) administration enabling independent assessment of oral bioavailability of the swallowed part of the dose and systemic distribution and disposition following absorption into the central systemic circulation. Furthermore, the observed systemic exposure following inhalation of this compound demonstrated sufficient variation between the studies and between the different investigational products to suggest that correlations between observed and simulated exposure could reflect the ability of key product attributes to meaningfully inform the model.
To test the validity of the selected mechanistic model (Gastroplus™, ver 9.0, Simulations Plus, Inc., Lancaster CA), we compared simulated results with the clinically observed average systemic exposure (AUC, Cmax, and plasma concentration–time profile) for each test formulation/device. Furthermore, we compared how well-simulated exposure correlated with observed exposure in relation to other potential predictive measures: delivered dose, lung dose, and computed peripheral dose.
Materials and Methods
Test compound
The test compound, AZD5423, was a small molecule nonsteroidal SGRM with low water solubility.
Characterization of the test compound
Solubility was measured in phosphate-buffered saline (PBS) at pH 7.4 and in fasted state simulated intestinal fluid version 2 (FASSIFv2) using the shake flask method previously described.(22) Lipophilicity was determined using reversed-phase liquid chromatography. Apparent transepithelial permeability, Papp (A–B), was obtained essentially as described in Hubatch et al.(23) Plasma protein binding (measured as Fup) was determined using equilibrium dialysis over a cellulose membrane (MWCO ∼6–8 kD) shaken 20 hours at 37°C to allow for equilibration of compound between plasma and 1 M PBS, pH 7.0. Blood–plasma partitioning was determined after incubation of compound with whole blood and plasma at 7°C. Following incubation, samples were centrifuged to remove red blood cells; remaining plasma proteins were removed by cold acetonitrile before LC-MS analysis.
Primary particle size distribution after particle size reduction in an air jet mill was measured on water suspensions of micronized material using a Mastersizer 2000 (Malvern Instruments Ltd., United Kingdom). Data were fitted to a log-normal distribution to estimate the mass median diameter (MMD) and the geometric standard deviation (GSD).
Investigational products and administrations
The test compound was formulated as the following investigational products for studies 1 and 2:
• Solution for intravenous infusion containing 10 μg/mL AZD5423, infused at a constant rate of 1 mL/min over 25 minutes, resulting in a total dose of 250 μg. The formulation contained cyclodextrin and ethanol to increase solubility. • Suspension for oral administration containing 0.54 mg/mL micronized AZD5423 given as a 2.2 mL dose containing 1200 μg active compound. The measuring cup was rinsed with a total fluid volume of 240 mL. • Spira nebulizer suspension for inhalation containing 2.2 mg/g micronized AZD5423 administered through Spira Electra 2™ (Respiratory Care Center Haamenlinna, Finland), a dosimetric nebulizer, to a total delivered dose of 450 μg (study 1) and 523 μg (study 2) over ∼1–2 minutes. Test subjects were instructed to inhale a predetermined number of breaths by monitored slow tidal breathing (inhaled flow rate about 18 L/min to a volume of >1 L and free exhalation). • I-neb™ nebulizer—suspension for inhalation containing 1.6 mg/g micronized AZD5423 administered through I-neb AAD (Philips Respironics, Murrysville, PA), a handheld, vibrating mesh nebulizer containing a nominal premetered dose of 0.25 mL to a total delivered dose of 420 μg (study 1) and 405 μg (study 2). Test subjects were instructed to inhale until the device signaled that the dose was delivered. The mean peak inspiratory flow was recorded for each treatment (inhaled peak flow rate about 42 L/min). • New DPI—an ordered mixture, dry powder formulation, containing micronized AZD5423 and lactose delivered in a novel premetered dry powder inhaler at a dose of 332 μg (study 2 only). The test subjects were instructed to inhale deeply (inhaled flow rate about 60 L/min). • Turbuhaler™ DPI—micronized AZD5423 and lactose in a dry powder formulation delivered through the Turbuhaler, a multidose reservoir inhaler, to an average total dose of 456 μg (study 2 only). The test subjects were instructed to inhale deeply and forcefully (inhaled flow rate about 60 L/min).
Two separate batches of micronized AZD5423 were used to formulate the investigational products for studies 1 and 2, respectively. The batches were of the same polymorphic form, but differed in primary particle size (see Table 1 below).
A shape factor of 0.1 was applied to account for the needle-like morphology of the AZD5423 crystal.
FASSIFv2, fasted state simulated intestinal fluid version 2; GSD, geometric standard deviation; MMD, mass median diameter; PBS, phosphate-buffered saline.
Characterization of the investigational products
All investigational products for inhalation were characterized with respect to delivered doses, particle size distribution, and ex-MTM dose. The delivered dose was measured as the amount delivered from the mouthpiece to a filter using a relevant flow rate for each device.
The aerodynamic particle size distribution was measured using the next generation impactor with an uncoated USP induction port. The nebulizers were assessed using a chilled impactor at 15 L/min.(24) The DPIs were assessed essentially using the pharmacopeial method using coated stage plates at 60 L/min (∼4 kPa under pressure) (USP). Untransformed impactor data were fitted to a bimodal distribution using Thiel's method of nonlinear regression.(19) The lower mode (smaller particles) was assumed to be log-normally distributed and characterized by a mass median aerodynamic diameter (MMAD) and a GSD.
The upper mode was assumed to contain larger particles and characterized solely by its mass fraction (Coarse fraction). For the nebulizers, the Coarse fraction was the actual fraction deposited in the induction port. For the DPIs, the Coarse fraction was the actual fraction deposited in the induction port plus a fitted part of the material deposited on stage 1. The part of stage 1 deposition thus moved from the lower mode to the upper mode was based on minimizing the residual squares of the log-normal fit of the lower mode.(19) This model thus assumes that for the DPIs, stage 1 deposition may consist of both particles belonging to the log-normal distribution of the lower mode and particles belonging to the upper mode that have bounced through the induction port. In the present case, Thiel's method was used to improve the estimation of MMAD and GSD of the lower mode. The value of the Coarse fraction was not used in any further calculations.
The predicted initial lung deposited dose was determined in vitro as the ex-MTM dose according to the method described by Olsson et al. (denoted ex-cast dose therein) using the medium MTM and medium flow profiles.(4)
In vivo data
Pharmacokinetic data on AZD5423 were obtained from two open-label, part-randomized, single-dose crossover studies conducted in healthy volunteers and patients with mild allergic asthma (Study 1) and in healthy volunteers (Study 2), respectively [See Melin et al. (21) for a complete description of the study designs and the pharmacokinetic evaluation]. Both studies were conducted in accordance with the provisions of the Declaration of Helsinki (1996) and the Good Clinical Practice guidelines (1996). All study participants provided written informed consent. Study protocols were reviewed and approved by ethics committees.
In study 1, six healthy male volunteers and six male patients with mild asthma were given a total of four single doses of AZD5423 administered as Intravenous infusion; Oral administration; Spira nebulizer inhalation treatment; and I-neb nebulizer inhalation treatment. The intravenous infusion was fixed as the first treatment and the oral administration as the last treatment. The two inhalation treatments were randomized.
In study 2, 18 healthy male volunteers were given a total of 6 single doses of AZD5423 as Intravenous infusion; Oral administration; Spira nebulizer inhalation treatment; I-neb nebulizer inhalation treatment; New DPI inhalation treatment; and Turbuhaler DPI inhalation treatment. The intravenous infusion was fixed as the first treatment and the oral administration as the second treatment. The four inhalation treatments were randomized.
Plasma concentrations of AZD5423 were sampled for up to 96 hours after treatment and analyzed using validated bioanalytical methods based on liquid chromatography and mass spectrometry (LC-MS/MS), with a lower limit of quantification at 10.0 pmol/L.(21)
Pharmacokinetic evaluations were performed as described in Melin et al.(21) Since no significant differences in the pharmacokinetic data were observed between healthy volunteers and mild asthmatic patients in study 1, pooled results were used for evaluation of this study in this work.
Computer-based simulations
Computational modeling of aerosol transport and deposition in the lung was used to estimate the extent of deposition in the tracheobronchial region (BB, generation 0–8), the bronchiolar region (bb, generation 9–15), and the alveolar-interstitial region (AI, generation 16–23), as well as exhaled fraction (EX) for the nebulized treatments (for the DPIs, the predicted EX fraction was added to AI since experience shows very small exhaled fractions for DPIs). The mouth–throat deposition (ET = extrathoracic) was set equal to one minus the ex-MTM dose fraction. The computed peripheral dose was equated to AI.
The lung structure and airway dimensions were from the Weibel A model,(25) as modified by Yu and Diu,(26) and uniformly scaled to a functional residual capacity of 3301 mL standard volume for adult male according to ICRP.(16) The transport and deposition model was a one-dimensional algebraic model based on NCRP(17) [in turn based on the Yeh and Schum model(27)], modified to accept aerosol boluses smaller than the inhaled volume.(18)
The model was informed by aerosol properties (bolus volume, MMAD, GSD) and assumed inhalation maneuver (inhalation volume, flow rate, breath hold time) appropriate for each device (Table 2). For the DPIs, these were based on our previous experience with similar studies using Turbuhaler. For Spira, flow rate and inhaled volume were monitored by the study nurse to comply with protocol. For I-neb, the device logged inhalation data for each dose.
The rate and extent of absorption of the test compound from the respiratory and gastrointestinal tracts were simulated using a commercial mechanistic computer-based model (Gastroplus, ver 9.0, Simulations Plus, Inc. Lancaster CA). A detailed description of the mechanistic model is out of scope of this work and can be obtained from Simulations Plus, Inc.
Essentially, starting from a fixed deposition pattern at time zero (a batch-dependent input parameter computed as described above), the Gastroplus model computes kinetically competing processes of mucociliary clearance and swallowing (from ET region), dissolution of solid material calculated based on geometric particle size distribution (batch dependent), and solubility in water (compound dependent). Dissolution rate in the gastrointestinal tract is calculated in the same way, but here based on solubility in FASSIFv2.
In parallel with dissolution and clearance, the model computes the permeation rate of dissolved compound based on concentration difference between lumen and lung tissue using an alveolar permeability calculated based on molecular weight, which is scaled for the bb and BB regions based on literature data for increase in epithelial thickness (default model). Permeability in the gastrointestinal tract is measured in a Caco-2 cell model. As compound enters the systemic circulation, resulting plasma concentration levels are computed based on rate of absorption and a 3-compartment pharmacokinetic model (obtained from pooled iv data from studies 1 and 2).
Hence, input data to the model can be divided into batch-independent parameters and batch-dependent parameters. The batch-independent parameters are data on lung and gastrointestinal physiology (the default physiology model for an 18-year-old male was used herein); compound-specific physico-chemical data on solubility in water and in simulated fluids, molecular weight, lipophilicity, membrane permeability, and protein binding (as listed in Table 1 below); and the compound-specific in vivo pharmacokinetic model (cf. Table 4 below). The batch (or test product)-dependent parameters are delivered dose, deposition pattern (from the lung deposition model), and primary particle size distribution as listed in Table 2 below.
MMAD, mass median aerodynamic diameter; MTM, mouth–throat model.
Results
Characteristics of the test compound
The SGRM test compound (AZD5423) used in studies 1 and 2 was characterized with respect to physicochemical properties as shown in Table 1. As can be seen, the compound is a small, neutral, very lipophilic poorly water-soluble molecule with a high propensity for protein binding. The water solubility is somewhat higher than that of fluticasone propionate and similar to that of mometasone furoate, two lipophilic corticosteroids with prolonged pulmonary retention by means of slow dissolution in situ.(6) A difference in primary particle size after micronization (MMD) was observed between the batch used to formulate investigational products for study 1 and that used to formulate the investigational products for study 2.
Characteristics of the investigational products used in studies A and B
Characteristics of the investigational products used in studies 1 and 2 are listed in Table 2.
It is noteworthy that the computed deposition pattern differs significantly between the investigational products, as outlined in Figure 1A, B. As shown, the Turbuhaler and the New DPI are predicted to have a more peripheral deposition profile of the lung deposited fraction than the two nebulizers, especially the I-neb.
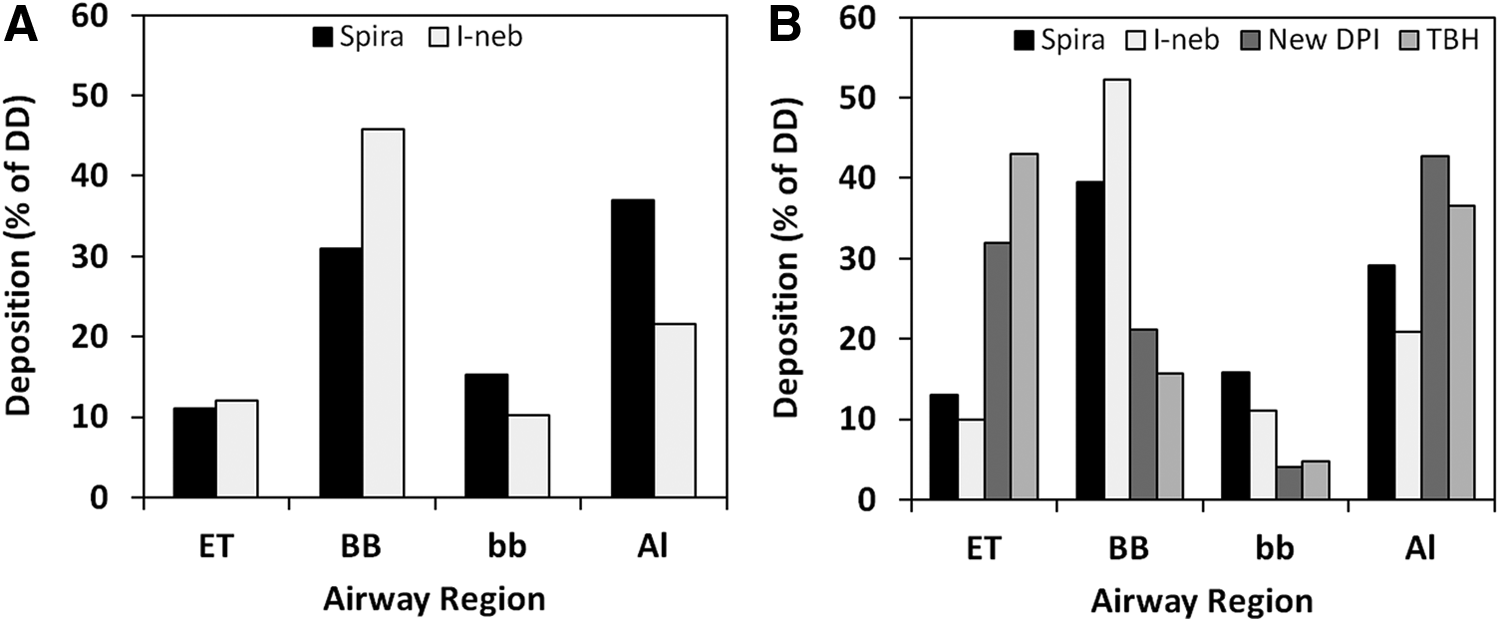
Simulated deposition profile of the four inhalation products studied in study 1
In vivo exposure data
The systemic exposure observed after inhalation of AZD5423 in studies 1 and 2 is listed in Table 3. Oral bioavailability was found to be low, 3.5% ± 0.6% (SD) and 4.4% ± 0.9% (SD), in studies 1 and 2, respectively. For a more complete description and discussion of in vivo data, please refer to Melin et al.(21)
Values expressed as geometric mean (SD) unless specified otherwise.
Values in study 1 represent pooled data from healthy volunteers (HV, n = 6) and mild asthmatics (MA, n = 6) except for total bioavailability (F).
AUC, area under the plasma concentration–time curve from time zero to infinity; Cmax, maximum observed plasma concentration.
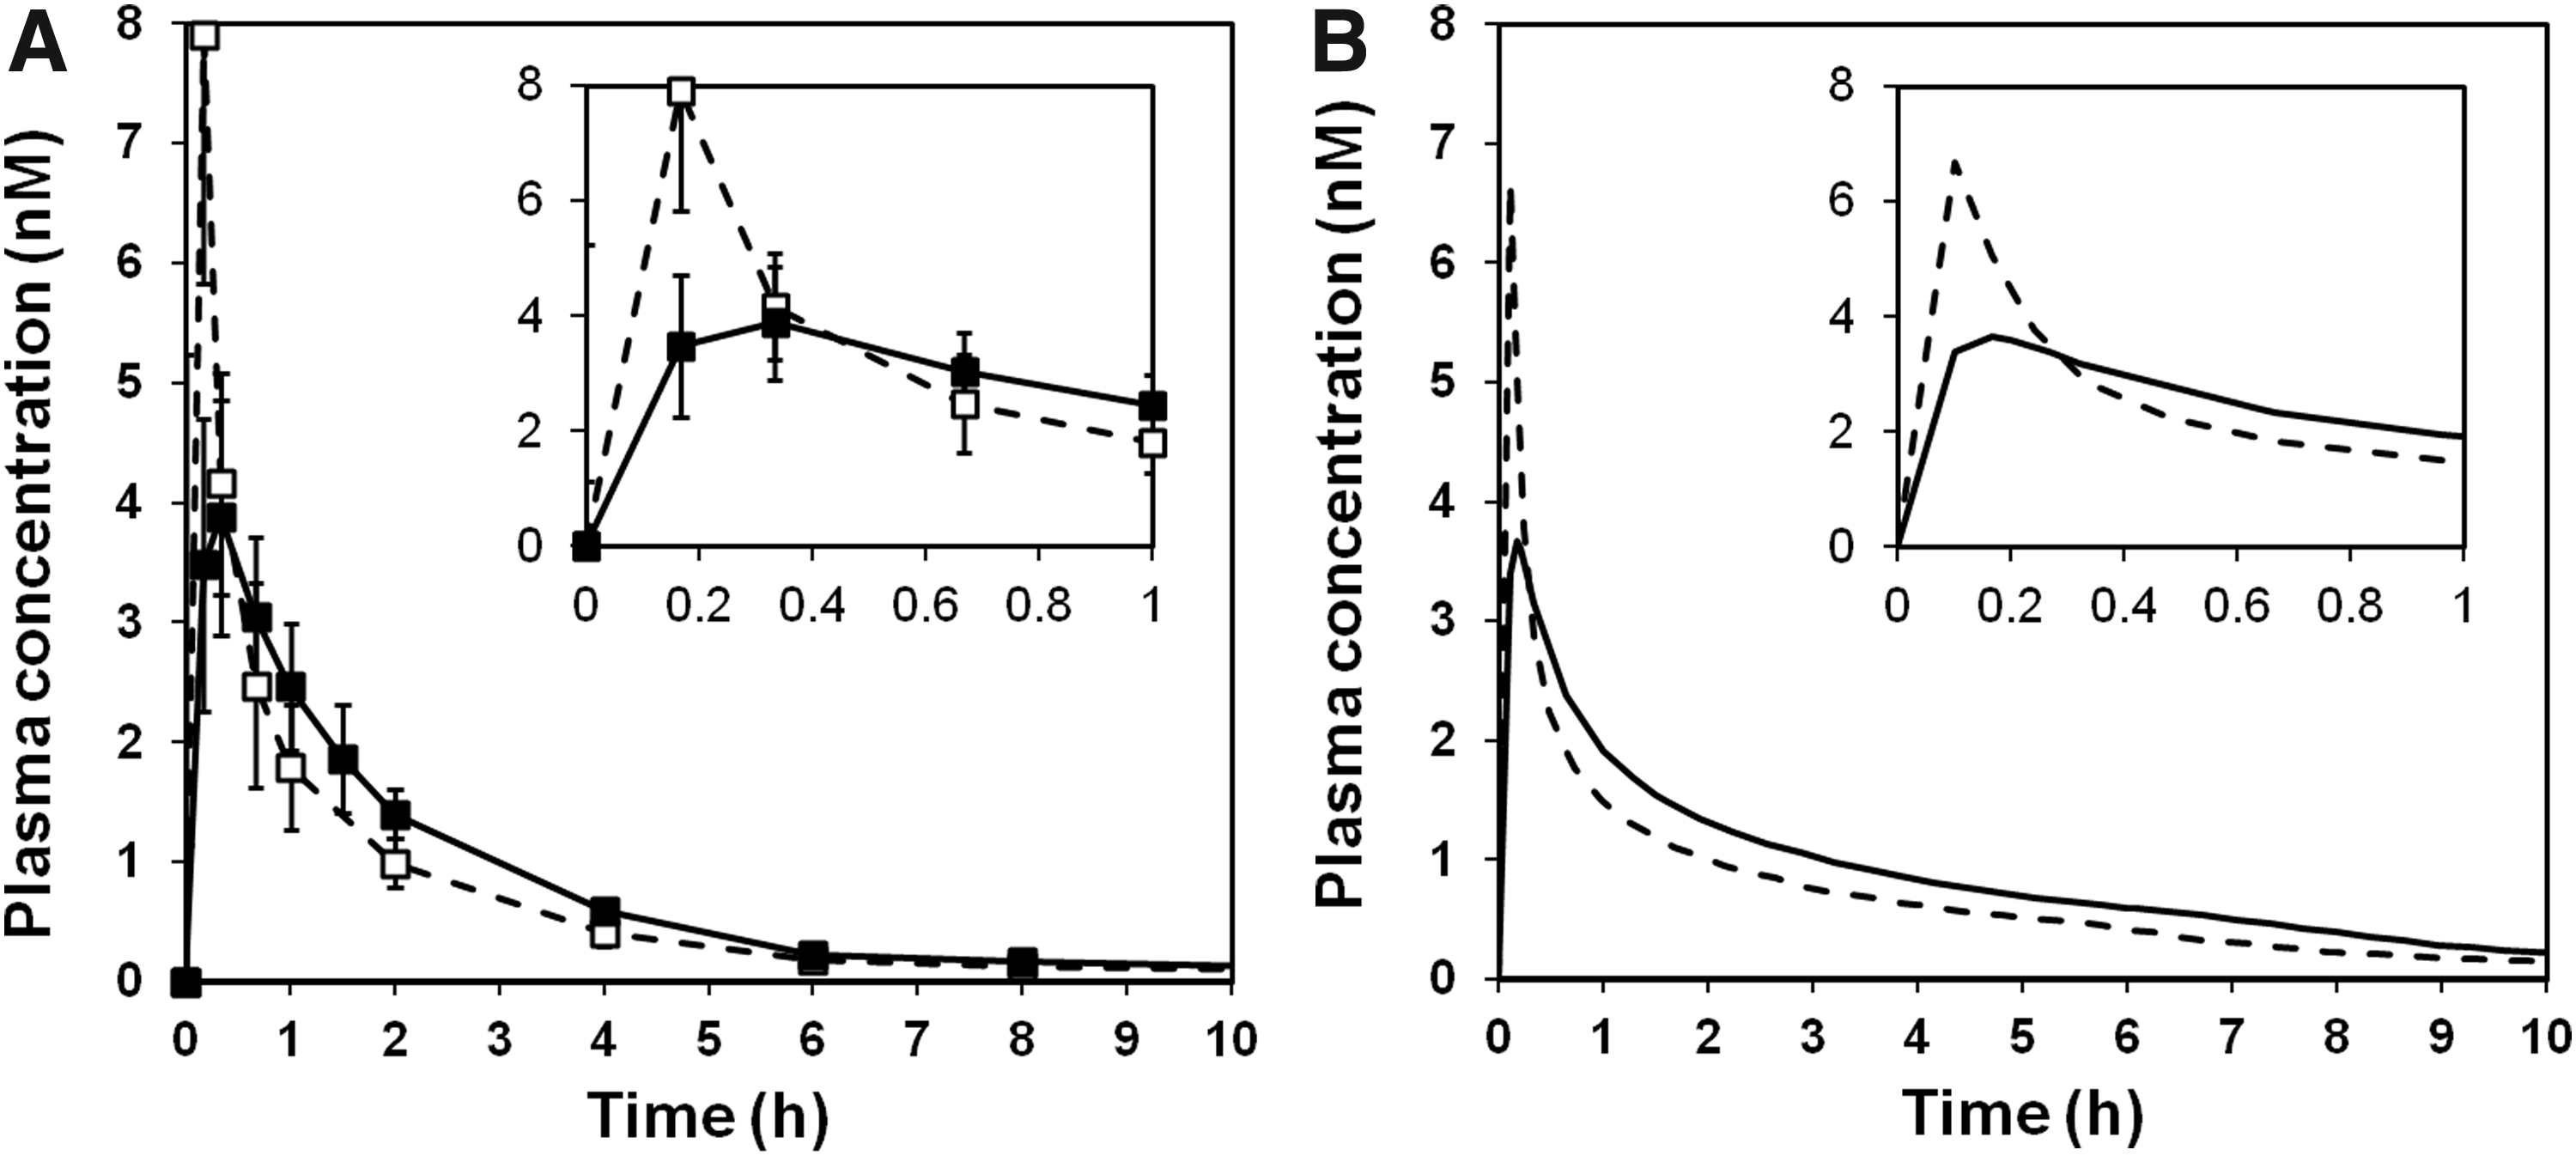
Figure 2A, B depicts dose-normalized geometric mean plasma concentrations during the absorption phase after administration of the test compound through inhalation in studies 1 and 2, respectively [see Melin et al.(21) for a full description of the plasma profile].
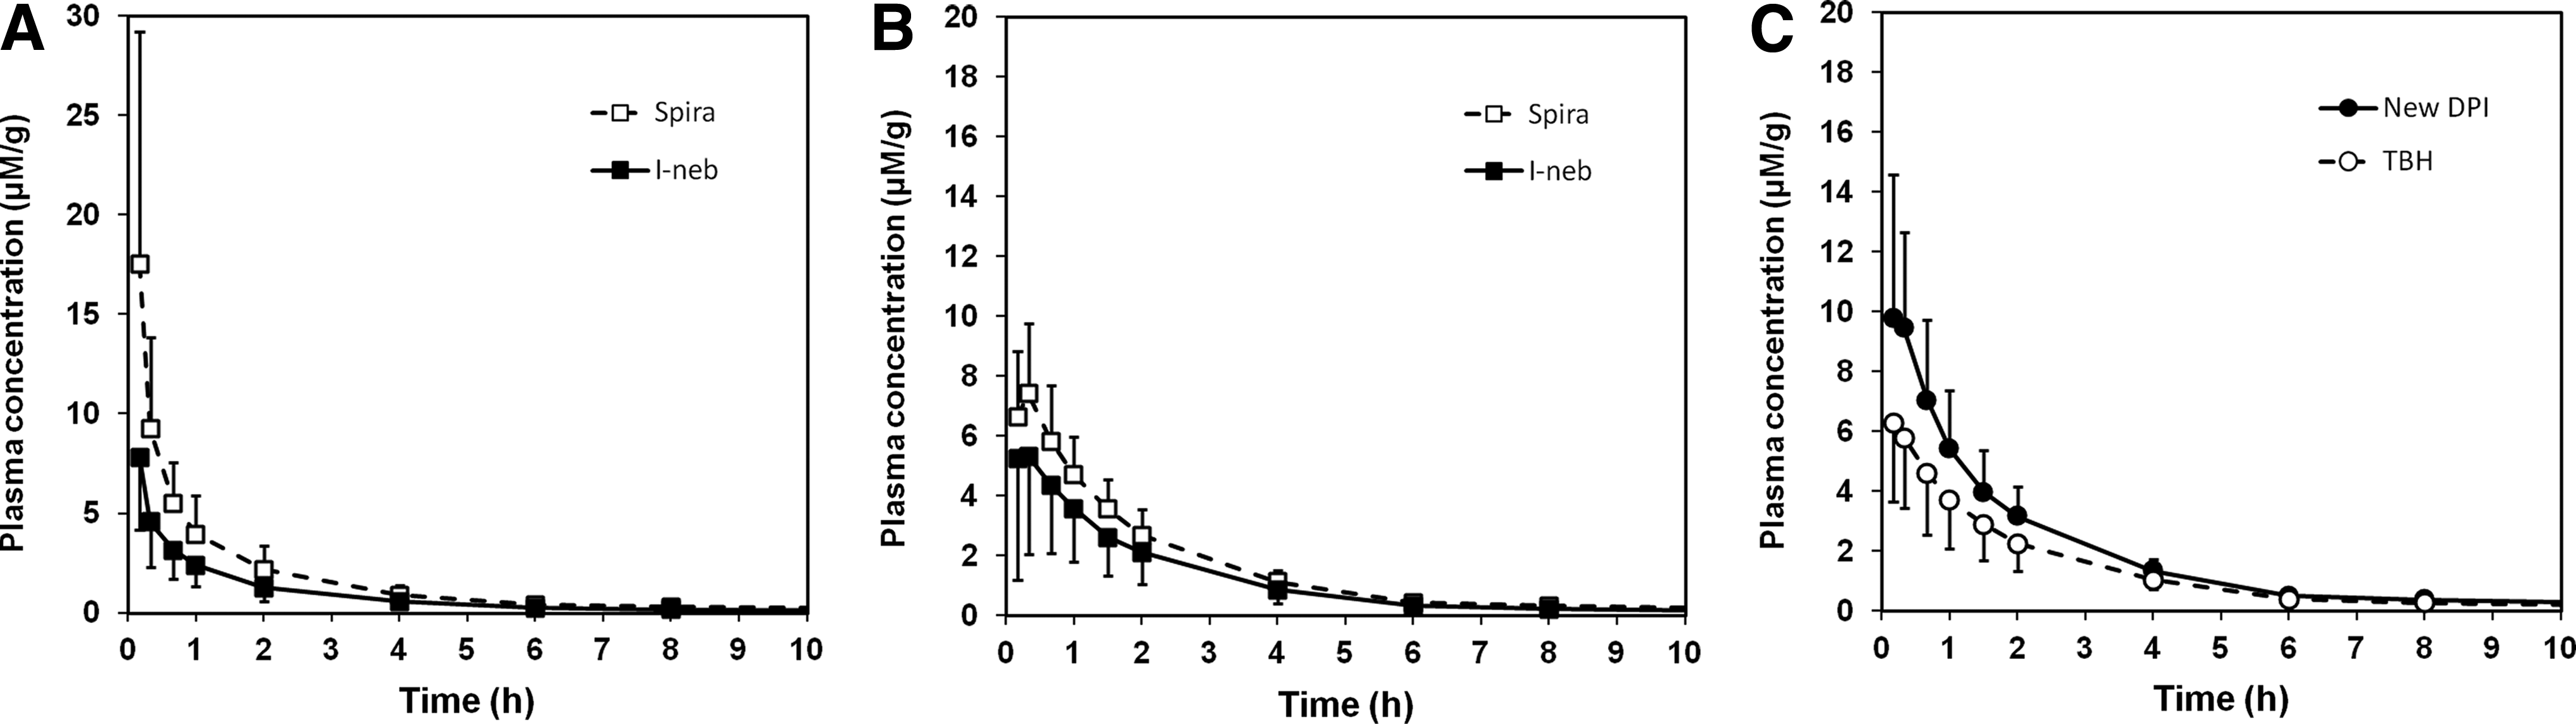
It is quite clear from an examination of the data in Table 3 and the profiles in Figure 2 that (i) there is significant variability in AUC and Cmax, which is not directly related to the delivered dose, and (ii) for the nebulizers used in both studies, the test compound seems to be absorbed faster (shorter tmax and higher Cmax) in study 1 than in study 2. Given that the primary particle size was significantly smaller in study 1 than in study 2, the latter indicates that the absorption rate from the lung is probably influenced by the rate of dissolution (a decrease in particle size is expected to increase the specific surface area and hence increase the dissolution rate).
Correlation between observed exposure, dose, and deposition
To explore potential causes for the observed variation in systemic exposure between the different inhalation treatments explored in studies 1 and 2, the observed systemic exposure (AUC) was correlated with three different dose measures as shown in Figure 3A–C: delivered dose (A); Ex-MTM dose (B); and computed peripheral dose (C). Delivered dose and ex-MTM dose correlate very poorly with the observed AUC, whereas the correlation is somewhat better between observed AUC and computed peripheral dose. The poor correlation between ex-MTM dose and systemic exposure contrasts with recently published data showing excellent correlations between systemic exposure of moderately (budesonide) and highly (AZD4818) water-soluble compounds and the measured ex-MTM dose.(4) However, as previously discussed, the lack of correlation for this compound may be related to its low water solubility.(5)
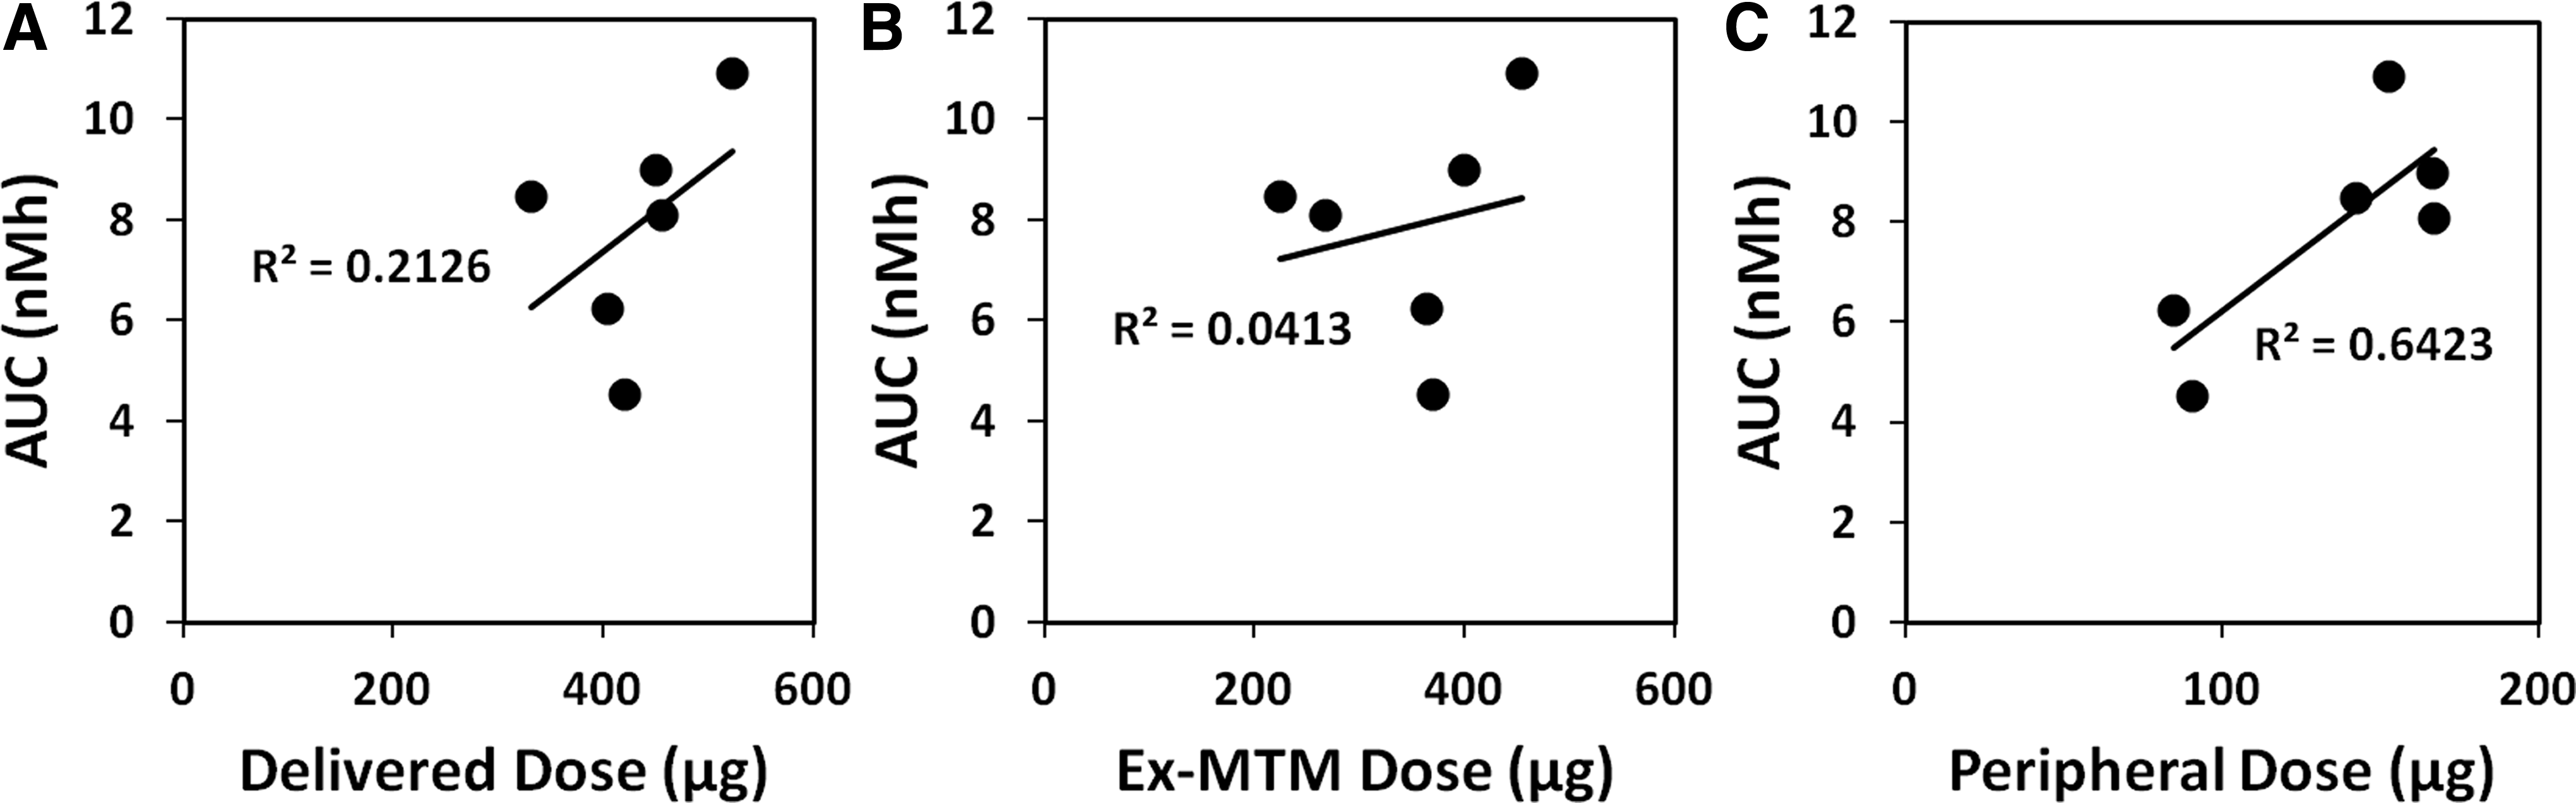
Obviously none of the measured and computed differences in dose and dose deposition can fully explain the observed variation in systemic exposure. The observation that the best predictor of systemic exposure was not the delivered dose or the lung dose, but rather the computed peripheral dose, points in the direction that systemic bioavailability of this compound can be expected to vary depending on the lung deposition pattern, probably as a result of extensive mucociliary clearance of slowly dissolving solid particles from the airways. However, the relatively poor correlation between exposure and computed peripheral dose could also indicate that using a single-dose deposition measure to predict the systemic bioavailability of this compound is too simplistic an approach. An alternative explanation is obviously imperfections in the in vitro data that may obscure a correlation.
Correlations between observed and simulated exposure
To further explore the underlying causes for variability in exposure, a computer-based mechanistic model of gastrointestinal and pulmonary absorption was used to simulate postdeposition events such as dissolution, mucociliary clearance, and absorption (Gastroplus, ver 9.0, Simulations Plus, Inc. Lancaster CA). To enable simulation of the absorption profile, the model was informed by the compound characteristics listed in Table 1 and the deposition patterns shown in Figure 1.
To enable simulated systemic plasma concentration–time profiles based on these absorption profiles, the model was further informed by a 3-compartment systemic pharmacokinetic model obtained from pooled iv data from studies 1 and 2 (Table 4, Johanna Melin, data on file). The systemic plasma clearance (CL) was 47.2 L/h in study A and 38.1 L/h in study 2. This is likely equal to the hepatic extraction rate, which, given the blood plasma ratio of 0.58, corresponds to a first-pass hepatic extraction of >80% of the expected liver blood flow. First-pass extraction is thus a major contributor to the observed low oral bioavailability.
Figure 4 shows a comparison between observed and simulated Cmax values (panel A) as well as observed and simulated AUC values (panel B). The dotted line represents unity. It is quite obvious from a comparison between Figures 4B and 3A–C that the mechanistic model (Gastroplus ADR v 9.0, Simulations Plus, Inc. Lancaster, CA) simulated AUC is a better predictor of observed systemic exposure (AUC) than any of the tested dose measures alone.
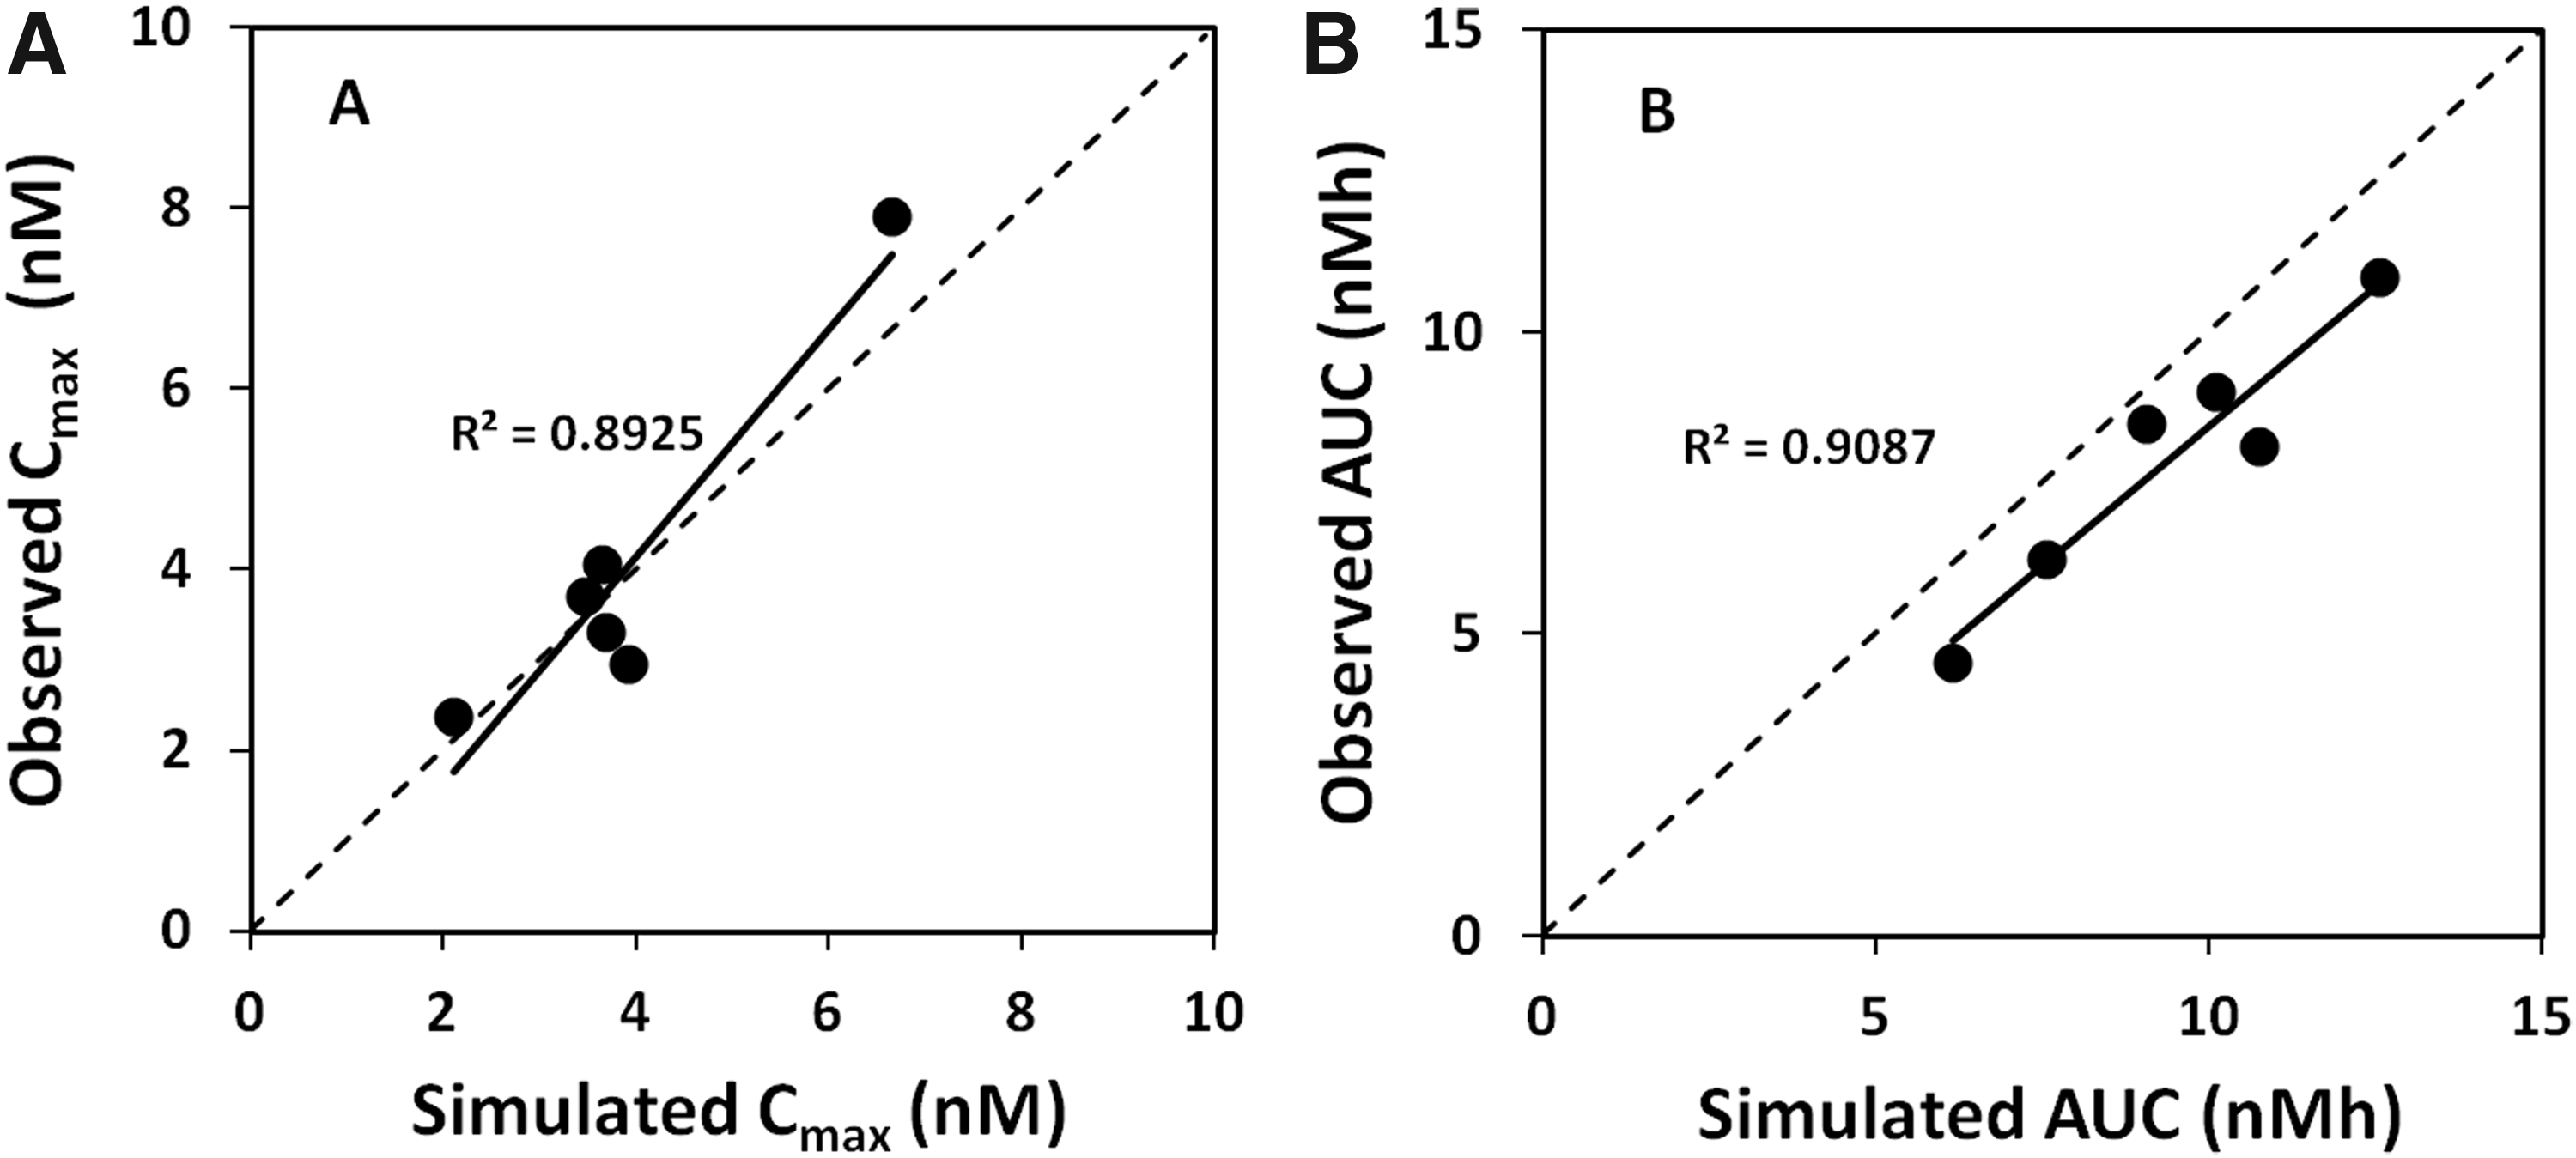
Observed and systemic Cmax also correlate reasonably well. In addition, the change in plasma profile between studies A and B is accurately simulated, as illustrated in Figure 5 showing observed (A) and simulated (B) plasma concentration–time profiles after inhalation from the Spira nebulizer. This strongly indicates that the observed differences in systemic exposure between and within studies are driven by differences between the test products (the most obvious in this particular case being the change in geometric primary particle size from 1.3 μm in study 1 to 3.1 μm in study 2, cf. Table 1).
Observed
Discussion
The current case study was designed to evaluate the capability of experimental dose measures and computational mechanistic models to predict systemic exposure after inhalation of a lipophilic compound with low water solubility and low oral bioavailability using different devices and formulations.
Neither variations in delivered dose nor in lung dose (as predicted using a clinically validated MTM method)(4) could explain and rationalize the observed variation in total exposure (AUC, cf. Fig. 3A, B) resulting from differences in deposition pattern and formulation. This is perhaps not surprising as compounds in this solubility class can be anticipated to have low bioavailability in central airways as a result of slow dissolution in combination with rapid mucociliary clearance.(1,2,15) This notion is supported by the somewhat better correlation between the computed peripheral dose and the observed AUC (Fig. 3C).
However, neither the experimental dose measures nor the computed peripheral dose demonstrated a useful predictive capability in this case. The excellent correlation previously observed between predicted lung dose and systemic exposure for more soluble compounds(4) may therefore be valid only for compounds with close to complete pulmonary bioavailability. If a single-dose measure should be used to predict systemic exposure of a compound with slow release rate (and low oral bioavailability), these findings suggest that it should be a measure reflecting the dose initially depositing in the alveolar region (AI, generations 17–23). That would, however, not be a very sensible measure of clinical equivalence, at least not for a compound with pharmacodynamic activity outside this region.
In contrast, the more holistic mechanistic model, using only three batch-dependent parameters (delivered dose, deposition pattern, and geometric particle size distribution), simulated the observed AUC significantly better than total dose, lung dose, or computed peripheral dose alone (cf. Figs. 3 and 4B). In addition, the computational model simulated peak exposure (Cmax) and the shape of the plasma concentration–time profile well, both as initial deposition pattern varied with a constant release rate (geometric particle size kept constant within studies1 and 2, respectively) and as release rate varied with a similar deposition pattern (geometric particle size distribution varied between studies using same inhalation device cf. Fig. 5). Hence, the assumptions that systemic exposure of this compound is a function of variations in both deposition pattern and release rate (dissolution) and that this model accurately could simulate the impact of these batch-dependent parameters were supported by the current experimental data set.
These results suggest that computer-based mechanistic models indeed have a use as research tools to predict and understand the expected variation in systemic exposure when clinical test products are varied during development and to minimize the risk of failed clinical equivalence tests between products. It is also quite clear that the key feature of the tested predictive model is that it is capable of integrating the parallel and kinetically competing processes of dissolution, permeation, and mucociliary clearance that take place after deposition. It should be noted, however, to our knowledge, this kind of model has not yet been tested for compounds retained by other means, such as sequestration in lung tissue.(28)
Underpinning the experimentally validated simulation of systemic exposure are, as discussed above, mechanistic simulations of initial deposition pattern as well as time-dependent processes such as solid compound in lumen and dissolved compound concentrations in lumen and airway tissue. Given that the simulated systemic exposure fits well with experimental observations, it is prudent to also explore the simulated predictions of the unobserved local exposure. Simulations of local exposure may potentially give new insights into how regional differences, for example, in clearance and transepithelial permeability, may alter local disposition of the compound after deposition. In addition, simulated local exposure could also address the validity of the European practice to use observed equivalence in systemic exposure as stand-alone criteria for clinical equivalence.
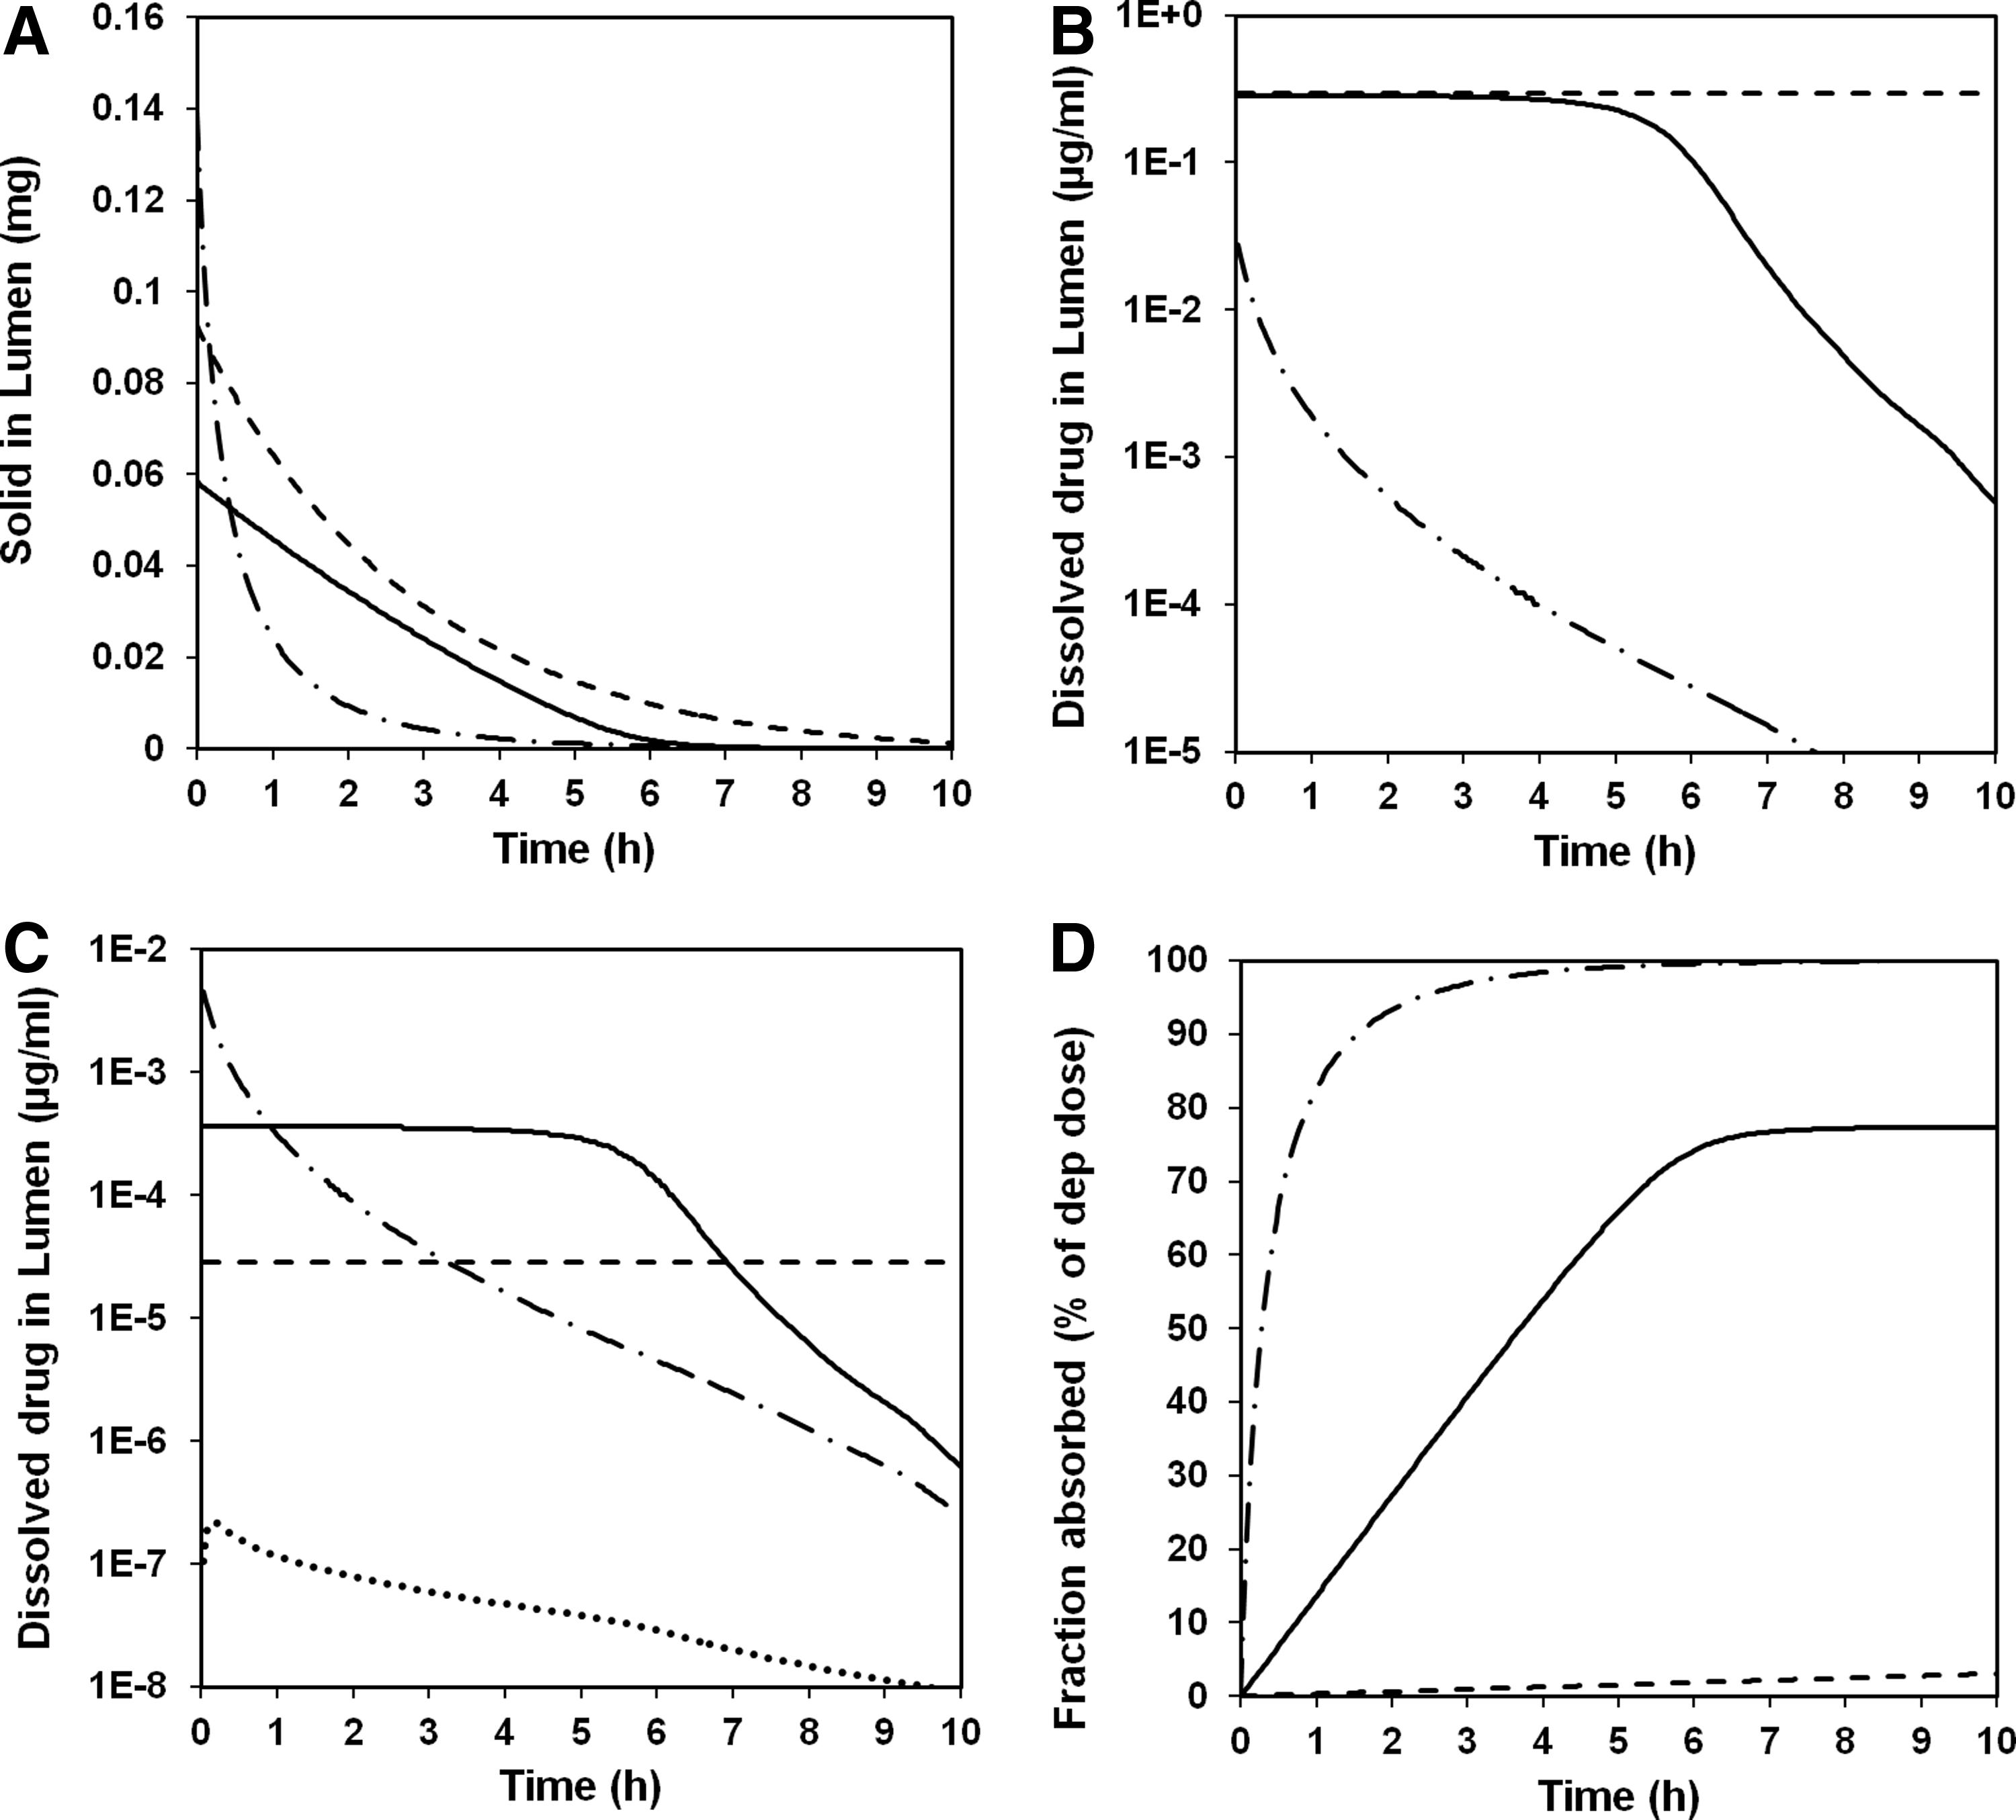
An example of simulated local exposure is shown in Figure 6 where predicted amount of solid (A), dissolved concentration in airway lining fluid (B) and lung tissue (C), as well as absorbed amount (D), are shown for large airways (BB), small airways (bb), and the alveolar-interstitial region (AI) after dosing using the Spira nebulizer in study 2.
Predictions of solid drug in lumen
Several observations can be made based on the simulated data in Figure 6. First of all, solid drug in airway lumen decreases as could be expected with time. In the alveolar-interstitial region (AI), this is simulated as a result of dissolution and absorption into the system. In the airway regions (BB and bb), it is simulated as the combined result of mucociliary clearance, absorption, and dissolution.
The simulated half-life of solid matter is shorter in the alveolar-interstitial region than in the airway regions. This simulation fits well with pharmacokinetic modeling results, which suggest multicompartmental lung absorption with both a short and a long absorption half-life.(21)
Second, the simulated kinetic competition between dissolution and absorption results in luminal concentrations of dissolved compound that in the alveolar-interstitial region (AI) are always well below solubility (due to faster absorption than dissolution), whereas in the large airways (BB), concentrations are simulated to remain at solubility for an extended time period (several hours). The latter seems to some extent to be true also for the small airways (bb). This simulated steady-state situation is a consequence of a decrease in transepithelial permeability (which is modeled to be inversely related to epithelial thickness) from the AI to the BB region causing a change in the rate-limiting process from dissolution (in AI) to permeation (in BB and to some extent in bb). Assuming (as we have) that mucociliary clearance is a first-order process, the duration of the simulated steady state will be dependent on deposited dose and solubility and to a lesser degree on particle size (see also Bäckman and Olsson.(15)
Third, the simulated tissue concentration curves (Fig. 6C) are linearly related to the simulated luminal concentration curves (Fig. 6B) as the permeability is modeled to be concentration and time independent for all regions. Clearly, the simulated time–concentration profiles in airway tissue (and to a lesser degree in alveolar interstitium) differ significantly from the observed and predicted free concentrations in plasma.
Finally, the simulated regional bioavailability varies from 100% in the alveolar-interstitial region to a few percent in the large airway region. The latter is attributable in the model to slow dissolution combined with extensive mucociliary clearance. The low bioavailability of this class of compounds in the large airways will, if simulations are predictive of in vivo situation, mask any differences between local and systemic exposure as the bulk of the systemically available compound will be absorbed from the alveolar-interstitial region.
In summary, simulations of systemic and local exposure for AZD5423 suggest that (i) computer-based mechanistic models can well predict total systemic exposure (AUC and Cmax) as well as the shape of the concentration–time profile in plasma and (ii) regional differences in bioavailability could, in combination with a relatively peripheral deposition pattern, effectively mask any regional variations in local drug levels resulting from differences in rate-limiting processes (here permeation vs. dissolution), rendering systemic concentration–time profiles relevant only for the most well-perfused peripheral tissue. Hence, equivalence in systemic exposure is not necessarily equal to equivalence in local exposure and hence clinical equivalence. This could cast some doubt on the European practice of allowing equivalence in systemic exposure to override in vitro differences, at least for compounds with less than complete pulmonary absorption.
Footnotes
Author Disclosure Statement
Authors were employed at AstraZeneca during the compilation of this work.