
Abstract
Abstract
Background:
The aim of this work is to use an experimental design approach to identify and study influential formulation and delivery device properties, which can be controlled by final product manufacturer, to establish design space, within which desired in vitro performance can be reached.
Methods:
Combining three factors, viscosity of suspension, nozzle orifice diameter (OD), and shot weight (SW), at three levels resulted in D-optimal experimental design with 20 runs. Responses within this study were droplet size distribution (DSD) and spray pattern (SP) in vitro tests. In addition, the amount of mechanical work needed for actuation was integrated from force profiles and used as a response. Results were fit to quadratic model by regression, which allowed also for determination of second-order and interaction effects between factors. Models were further optimized by keeping significant terms only. Optimized models were used to create response surfaces and design space with confidence levels.
Results:
Viscosity has a dominant effect on DSD and modest effect on SP, with lower viscosities related to generation of smaller DSD and larger SP. Orifice diameter was found to have the highest impact on SP, with larger diameter resulting in larger SP. This effect was additionally confirmed by results of Plume Geometry in vitro test. Shot weight factor exerts significant influence on all tested metrics. Work, however, did not vary greatly with suspension viscosity or orifice diameter. Shot weight is the most dominant factor for work and important for DSD having a positive effect on both responses. In the case of SP, its relationship with shot weight is described by second-order polynomial fit. Inspection of raw data revealed that density of droplets within SP area is different for different shot weights.
Conclusion:
Presented study elucidated an inherent relationship between factors and responses and established mathematical models (response surfaces) for predictive purposes to target specific in vitro performance of nasal sprays by appropriate specification of factors, taking into account control space with included risk and uncertainty analysis.
Introduction
D
The importance of suitable control of these important aspects is also recognized by world health regulatory administrations such as US Food and Drug Administration (FDA),(2–5) European Medicines Agency (EMA),(6,7) Australian Therapeutic Goods Administration (TGA),(8) Health Canada (HC),(9) and Brazil National Health Surveillance Agency (ANVISA).(10) A common approach by regulators is definition of in vitro tests, which are either part of in vitro equivalence testing between test and reference or are prescribed as pharmaceutical quality tools as a part of chemistry, manufacturing, and control documentation.
Most relevant in vitro tests for nasal deposition are DSD, Spray Pattern (SP), and Plume Geometry (PG). DSD is a sizing technique using laser diffraction. SP is a horizontal cross-sectional profile of droplet distribution in plume at specified distance, while PG measures the vertical cross-sectional profile. For SP measurements, typically noncontact laser sheet projection techniques are used.
While predicting power and correlation of in vitro tests with in vivo results is questionable,(11) the battery of in vitro tests listed above still remains industry gold standard to assess performance and quality of nasal spray products. In vitro methods are well established, fast, robust, and reproducible, allow comparison between laboratories, and are easy to standardize and quantify.
Several published studies used these methods as formulation development tools. Dayal et al.(12) evaluated the impact of actuation mode, formulation properties, and different nasal spray delivery devices on DSD and SP. Pennington et al.(13) recognized SP and DSD as additional tools to evaluate and understand viscosities at actual spray nozzle conditions during formulation development. In vitro performance of different nasal solution formulations was characterized by Pu et al.(14) They used SP, DSD, and PG tests and complemented them with in vitro nasal cast deposition measurements. They concluded that in vitro methods were able to provide discrimination between tested formulations.
The effect of actuation parameters on in vitro performance of nasal spray products is presented in several studies.(15–17) Common conclusion of all studies is that stroke length and actuation velocity are major factors impacting DSD, SP, and PG and even shot weight (SW) as a consequence of incomplete actuation. Actuation parameters should be set in a way to reflect and mimic manual actuation performed by the patient in a reproducible way. This emphasizes the importance of having proper and relevant actuation parameters developed and validated to avoid bias or potential misuse to obtain desired in vitro performance by modifying actuation parameters.
Current EMA(18) and FDA(19) position is that one should not assure quality only by control and testing of final drug product, implying Quality by Control approach, but should rather use a systematic and scientific approach within pharmaceutical development with which quality is built in and assured by design, so-called Quality by Design (QbD) approach, following ICH recommendations from guidelines Q8, Q9, and Q10.(20–22)
One of the most powerful tools of QbD is Design of Experiments (DoE). DoE can be used to systematically study impact of factors, which can be either critical material attributes (CMAs) or critical process parameters (CPPs), on responses, which represent critical quality attributes (CQAs). Within determined design space, one obtains an understanding on how performance changes with variation in main factors. With this knowledge, one can select control space and set control strategy of CMAs and CPPs by setting proper limits, which will assure desired performance of CQAs.
Several examples of studies where DoE was applied to development of nasal spray products are known in the area. Dayal et al.(23) used Box–Behnken design to investigate the impact of formulation composition-related variation on DSD and physicochemical properties such as viscosity and dynamic surface tension. They successfully established response surface model to predict in vitro performance. Delivery device aspect was limited to a single design. Variability originating from delivery device CMAs was not specifically taken into the account.
In another study, Guo et al.(24) performed DoE using four factors (actuation stroke length, actuation velocity, concentration of gelling agent, and concentration of surfactant) to elucidate influence on shot weight, DSD, SP, and PG. A three-level, four-factor Box–Behnken design was used, resulting in a set of 27 experimental conditions. Optimized models showed that actuation stroke length has a major influence on shot weight, which is expected to an extent, considering the design of delivery device. Actuation velocity and concentration of gelling agent had significant effects on DSD, SP, and PG, while concentration of surfactant did not result in significant influence on performance.
Although DoE provided better insights into sources of variability in performance, variability of a device design (top-down actuated device, manufactured by Aptar Pharma, Eigeltingen, Germany) was not considered and effects of delivery device CMAs were completely randomized also within this study.
DoE can also be used to optimize nasal spray performance analytical methods, as presented by Shah et al.(25) In vitro nasal cast method was established following a systematic DoE approach, starting with exploratory and half-factorial screening to identify most important method parameters contributing to variability. Parameters were then optimized and validated using repeatability and reproducibility experiments. The primary focus was not to obtain knowledge on nasal performance (nasal deposition) in the sense of targeted performance, but rather to use it as a tool to establish an effective method, demonstrating the power of DoE, when systematically used.
Evaluation of delivery device in studies presented above is limited either to use of the single delivery device design, for which variability is not controlled with any of device CMA characteristics, or completely different device designs allowing only direct comparison between designs, but missing an understanding on what are key CMAs related to single device. Such studies are very useful in early development phases when one wishes to obtain general knowledge or to select formulation properties and delivery device, which best match desired performance. Once formulation and delivery device are selected, further understanding of the impact of both formulation and delivery device-related CMAs and specifications on CQAs is needed to allow control of quality and assure desired performance.
The aim of this work is to use DoE to study both formulation and delivery device properties, which are possible to be controlled by final product manufacturer, to establish design space within which control space can be defined to assure desired performance.
Combining three factors, viscosity of suspension, nozzle orifice diameter (OD), and shot weight, at three levels using the DoE approach of D-optimal design model resulted in 20 runs. Responses within this study were DSD and SP in vitro tests. In addition, the amount of work needed for specific actuation was integrated from force–displacement profiles and used as response in DoE.
Results were fit to quadratic model by regression, which allowed determination of second-order and interaction effects between factors. Models were further optimized by keeping significant terms only. Optimized models were used to create response surfaces. Practical application of response surfaces was demonstrated by definition of optimal levels of factors based on desired performance, that is, demonstrating a route for rational selection of specification limits of such pharmaceutical product.
Figure 1 summarizes overall experimental setup.
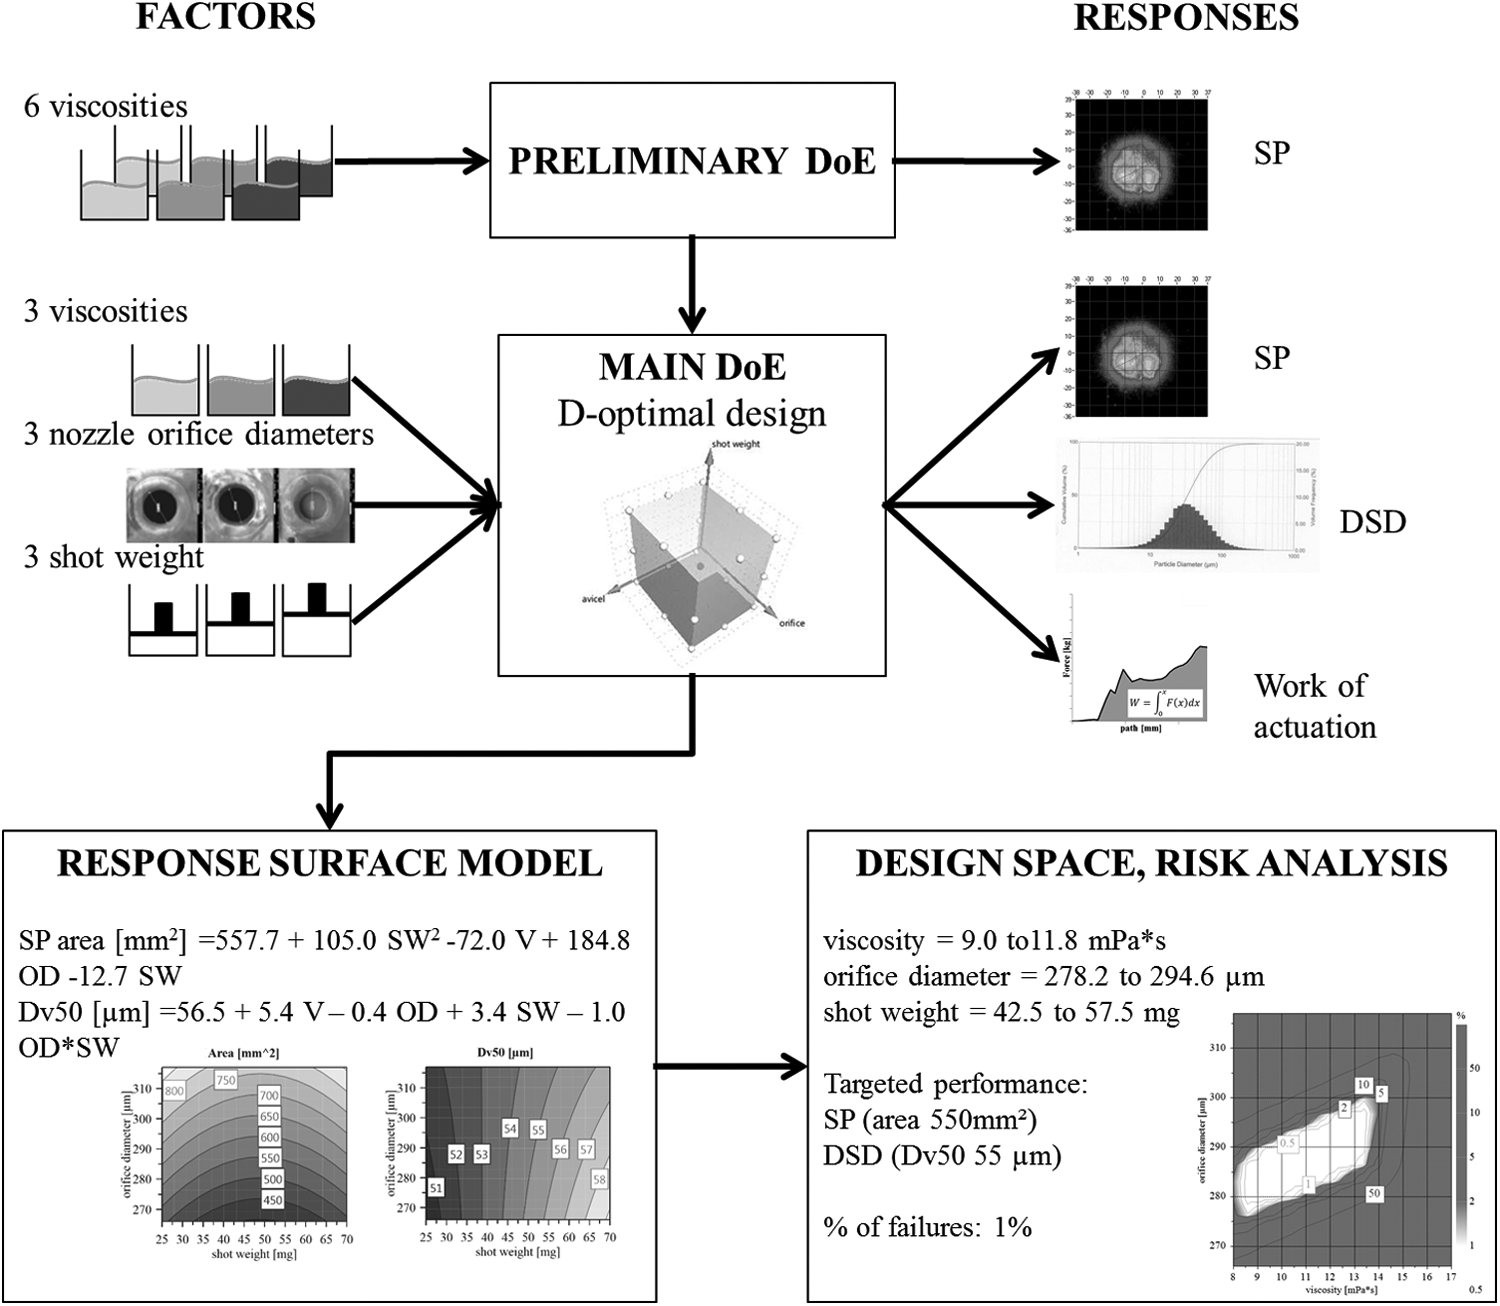
Overall experimental setup.
Materials and Methods
Formulation
Six placebo aqueous-based suspension formulations containing 0.5%, 1.0%, 1.5%, 2.0%, 2.5%, and 3.0% (wt./wt.) of Avicel® RC-591 (FMC, US) were prepared in the laboratory to obtain a range of samples with different viscosities. Avicel RC-591 is a commercially available mixture of microcrystalline cellulose and carboxymethyl cellulose, commonly used as a suspension-forming agent for nasal spray products. All six formulations contained the same amount of following excipients: benzalkonium chloride (0.015% wt./wt.), glucose (5.0% wt./wt.), edetate disodium (0.015% wt./wt.), polysorbate 80 (0.025% wt./wt.), and purified water (ad 100.0% wt./wt.).
Following manufacturing steps were carried out: glucose and edetate disodium were dissolved in a part of water, then Avicel RC-591was dispersed using rotor–stator homogenizer at homogenizing speed of 12,000 rpm for 30 minutes. Separately, polysorbate 80 was dissolved in a part of water and added to the main suspension. Similarly, benzalkonium chloride was dissolved in a part of water and added to the main suspension, which was then mixed to form a homogeneous suspension.
Suspension formulations were filled into a glass container, crimped with a pump with specified shot weight, and assembled with housing components, selecting a nozzle with specified orifice diameter, according to experimental plan.
Delivery device
Delivery device used in this study is a commercially available nasal spray pump VP7 with Latitude® housing (both manufactured by Aptar Pharma, Le Vaudreuil, France), which features an integrated side actuation mechanism. Delivery device and its components are fully depicted in Figure 2. Key properties of delivery device, which can be directly controlled in terms of targeted performance, are shot weight on nasal spray pump and orifice diameter of nozzle on housing.

Components of delivery device:
Shot weight is a function of a volume of a metering chamber inside the pump and determines the amount of suspension, which is pushed through the pump and atomized into droplets after exiting the nozzle orifice. Three different shot weights were considered in this study with targeted delivery mass of 25, 50, and 70 mg (in terms of water as reference medium) labeled in further text as low, central, and high shot weight samples, respectively.
The nozzle is directly involved in the droplet atomization process and formation of a plume. While there are other components and dimensional characteristics constituting the nozzle, orifice diameter can be directly controlled and measured using light or scanning electron microscopy (SEM) methods. Latitude housing with three different orifice diameters having average diameter of 266, 294, and 317 μm was manufactured and kindly provided by Aptar Pharma. Levels of factor, orifice diameter, were defined to cover expected variability originating from the plastic molding manufacturing process.
Viscosity measurements
All formulations were analyzed at 23°C by two protocols using rheometer Haake RS 75 and double-cone titanium measuring system with 60 mm diameter and 2° angle. The first protocol was done as a rotational test with up-ramp with shear rate from 0 to 50 s−1 for 60 seconds and immediate down-ramp with shear rate from 50 to 0 s−1 for 60 seconds. The viscosity result was determined at 40 s−1 of down-ramp.
In the second protocol, maximum shear rate considering limitation of rotational rheometer was used. Up-ramp from 0 to 1520 s−1 in 60 seconds was done and viscosity determined at 1500 s−1, similar to parameters used by Pennington et al.(13) (rotational rheometer measurements done at 1000 s−1).
Suspension formulations were kept in a glass container with a wide neck, which enables simple sampling. The suspension was sampled by spoon to not destroy its structure and transferred directly to a rheological cup. After reaching a defined distance between measuring plate and measuring cone of 0.092 mm, the sample was left to rest for 5 minutes, then the protocol was started.
Actuation parameters
Automated actuation parameters for velocity-controlled SSX side actuator (Proveris Scientific Corporation, Marlborough, MA, USA) were first derived for a sample with all three factors set at central level of DoE (viscosity at 11 mPa × s, shot weight at 50 mg, and orifice diameter at 294 μm) to best mimic adult manual actuation. Ten volunteers manually actuated nasal spray samples into Malvern Spraytec to determine DSD.
Four different settings (steady-state velocity set at 50, 70, 90, and 110 mm/s while keeping acceleration at 6000 mm/s2) for automated actuation profile were used to actuate the same nasal spray samples and obtain DSD. Results for DSD from manual actuation were correlated with results from automated actuation profiles to find the best and most reproducible fit with given actuation parameters. In addition, samples from high and low levels of factor viscosity (8 and 17 mPa × s) and factor shot weight (25 and 70 mg) were further evaluated to correlate results from manual actuation with results using actuation parameters derived above.
Once determined, actuation parameters (90 mm/s and 6000 mm/s2) were fixed throughout the whole DoE study.
Profile curves as a function of position of press button versus time during hand actuation were constructed with motion analysis by recording a video of manual actuation at 600 frames per second using a high-speed camera system and tracking software TEMA 3.8 LITE with Correlation tracker (Image Systems AB, Sweden).
Sample preparation and priming
Before each measurement, the sample was shaken manually with 10 strokes in a horizontal plane. First, actuation was always performed manually to check any potential physical blocking of the sample. Each sample was then inserted into SSX side actuator, actuated for stroke length characterization (∼8.6 mm), and further actuated four times using automated actuation parameters (all together accounting for six priming actuations). After this procedure, each sample was considered to be fully primed, next actuations (starting with seventh actuation) were used to measure metrics according to DoE plan.
SP measurements
SP measurements were performed on Sprayview® instrument using Viota® software (Proveris Scientific Corporation) at 3.8 cm distance from the tip of the nozzle. All measurements were conducted at room temperature, 23°C, and at relative humidity ranging from 58% to 62%. Three measurements of SP were repeated for each sample and averaged to determine SP area (mm2).
DSD measurements
DSD measurements were performed on Malvern Spraytec instrument (Malvern Instruments, Malvern, United Kingdom) at 3 cm distance from the tip of the nozzle. All measurements were executed at room temperature, 23°C, and at relative humidity ranging from 58% to 62%. Three measurements of DSD during fully developed plume were done for each sample and averaged to determine following DoE responses for each sample: Dv10 (μm), Dv50 (μm), Dv90 (μm), and span, which is calculated by Equation (1):
Nasal cast studies
The same method as originally developed by Kundoor and Dalby(26) was used. Nasal cast (Koken Co. Ltd., Japan) was coated with indicator Sar-Gel® (Sartomer Company, Inc., West Chester, PA, USA), which changes color from white to purple upon contact with water.
Following adjustments were done. For all experiments, the nasal cast was tilted 30° from the horizontal position and nasal spray was inserted into the nostril in a vertical position. After manual actuation, color change was captured within 30 seconds using a digital camera and images were processed with imaging software Clemex Vision Professional (version 6.0.010P; Clemex Technologies, Inc., Quebec, Canada). To normalize calculated areas of all samples, a standardized green-colored metal plate with known and physically measured area was used as the reference standard.
Work measurements
For each performed actuation, SSX side actuator records force as a function of path (position of a press button during actuation from 0 to fully pressed position as characterized under stroke length, in mm) and time point (in milliseconds, duration of actuation). An example of typical force profile as a function of path is presented in Figure 3. Area under force–displacement profile curve reflects mechanical work introduced by the side actuator. Using the trapezoidal integration approach on given data scatter, work was quantified (in unit [J]) and used as response in DoE.
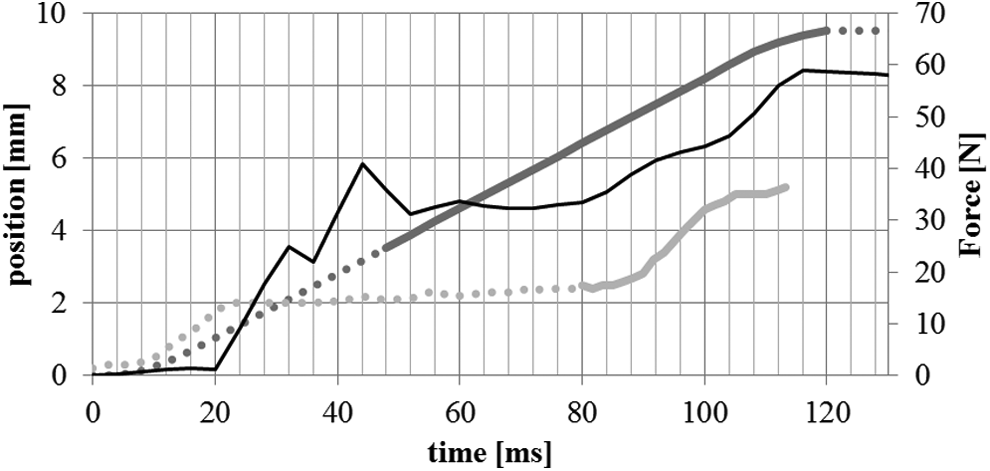
Representative displacement curve profiles of press button in mm for manual (light gray curve, left axis) and automated (dark gray curve, left axis) actuation with corresponding force profile (black curve, right axis) recorded during automated actuation. Solid line in both displacement profile curves presents phase of actuation with active spray formation.
Preliminary experiments
To define an intrinsic relationship between factor viscosity and responses, six different levels were considered for SP and viscosity measurements, while holding other two factors at the central level. Based on both SP and viscosity results, three levels for factor viscosity were selected for final response surface DoE (Table 1).
Response surface DoE
D-optimal design was employed to create response surface polynomial quadratic model. D-optimal design is a computer-aided design, where depending on a selected criterion and a given number of design runs, the best experimental design is created by a selection process to maximize the information in the selected set of experimental runs with respect to a stated model.(27) Dedicated DoE software such as Modde® 10.1 (Umetrics AB) features the creation of such designs and was used in this study.
Twenty design runs were selected for creation of D-Optimal design to allow multiple linear regression and fit into polynomial quadratic model, including complete squared, linear, and interaction terms for three factors, as presented by Equation (2):
where Y is measured dependent response; V, OD, and SW are independent factors, viscosity, orifice diameter, and shot weight, respectively; b0 is scaled estimate of regression constant; b1 to b10 are scaled estimates of regression coefficients; and e is error term.
Initial model presented above would then be optimized by elimination of all nonsignificant terms, where probability values (p) above 0.05 were considered as statistically not significant.
Criterion for selection of proposed D-optimal designs was on first-tier highest D-efficiency (9.44 in selected design) and on second-tier highest G-efficiency (83.51 in selected design). Design matrix summarizing all 20 design runs with nonscaled and scaled levels of all three factors is presented in Table 2.
For each design run, factors and corresponding nonscaled and scaled levels (in parentheses) together with average values for responses with standard deviation (in parentheses) are presented.
DSD, droplet size distribution; SP, spray pattern.
For SP and work of actuation, each design run was measured in four replicates. For DSD, each design run was measured in six replicates.
Practical application of response surface model
Specific control space for viscosity and orifice diameter was performed using Optimizer and Setpoint analysis tools in MODDE. In the first step, Optimizer performs Monte Carlo simulations by random factor settings and uses a desirability function that searches for the best possible combination of factor settings, that is, setpoint, which predicts results inside the response specifications and as close as possible to the targets. To find the setpoint, 100.000 Monte Carlo simulations were executed under Optimizer, taking into account response surface model error.
Setpoint analysis takes the setpoint from the previous step and performs an additional set of Monte Carlo simulations first to search for an acceptable range for the factors around the setpoint. These ranges are then used in another round of Monte Carlo simulations for final prediction of responses to validate that determined factor values assure targeted in vitro performance. For both rounds, 100.000 Monte Carlo simulations were performed, taking into account response surface model error.
Results
Results of screening experiments are summarized in Figure 4, with both viscosity and SP measurements of samples with different concentrations of Avicel RC-591.

Viscosity and SP area at 3.8 cm measurements of samples with different concentration of Avicel® RC-591 in increments of 0.5% from 1.0% to 3.0%. Results of viscosity method at 40 s−1 shown with dotted line (left vertical axis), results (V) of viscosity method at 1500 s−1 shown with dashed line (right vertical axis). Results of SP presented as individual points (circles) and corresponding values (third axis of SP not shown).
Results of DoE testing are presented in Table 2, as average value and standard deviation of measured responses, together with corresponding nonscaled and scaled levels of factors for each design run. Initial models were optimized with elimination of nonsignificant terms. Effects of all factors of optimized models are presented in Figure 5. Scaled and centered coefficients and corresponding confidence intervals with p-values for significant terms are presented in Table 3 for all DoE responses. Furthermore, goodness of fit of optimized models was evaluated with following measures: residual standard deviation, p-value for regression, p-value for lack of fit, Q2 statistics to present model predictive power, R2 statistics to present fit of regression, and R2adj statistics, which also measures fit of regression, which is adjusted for degrees of freedom.
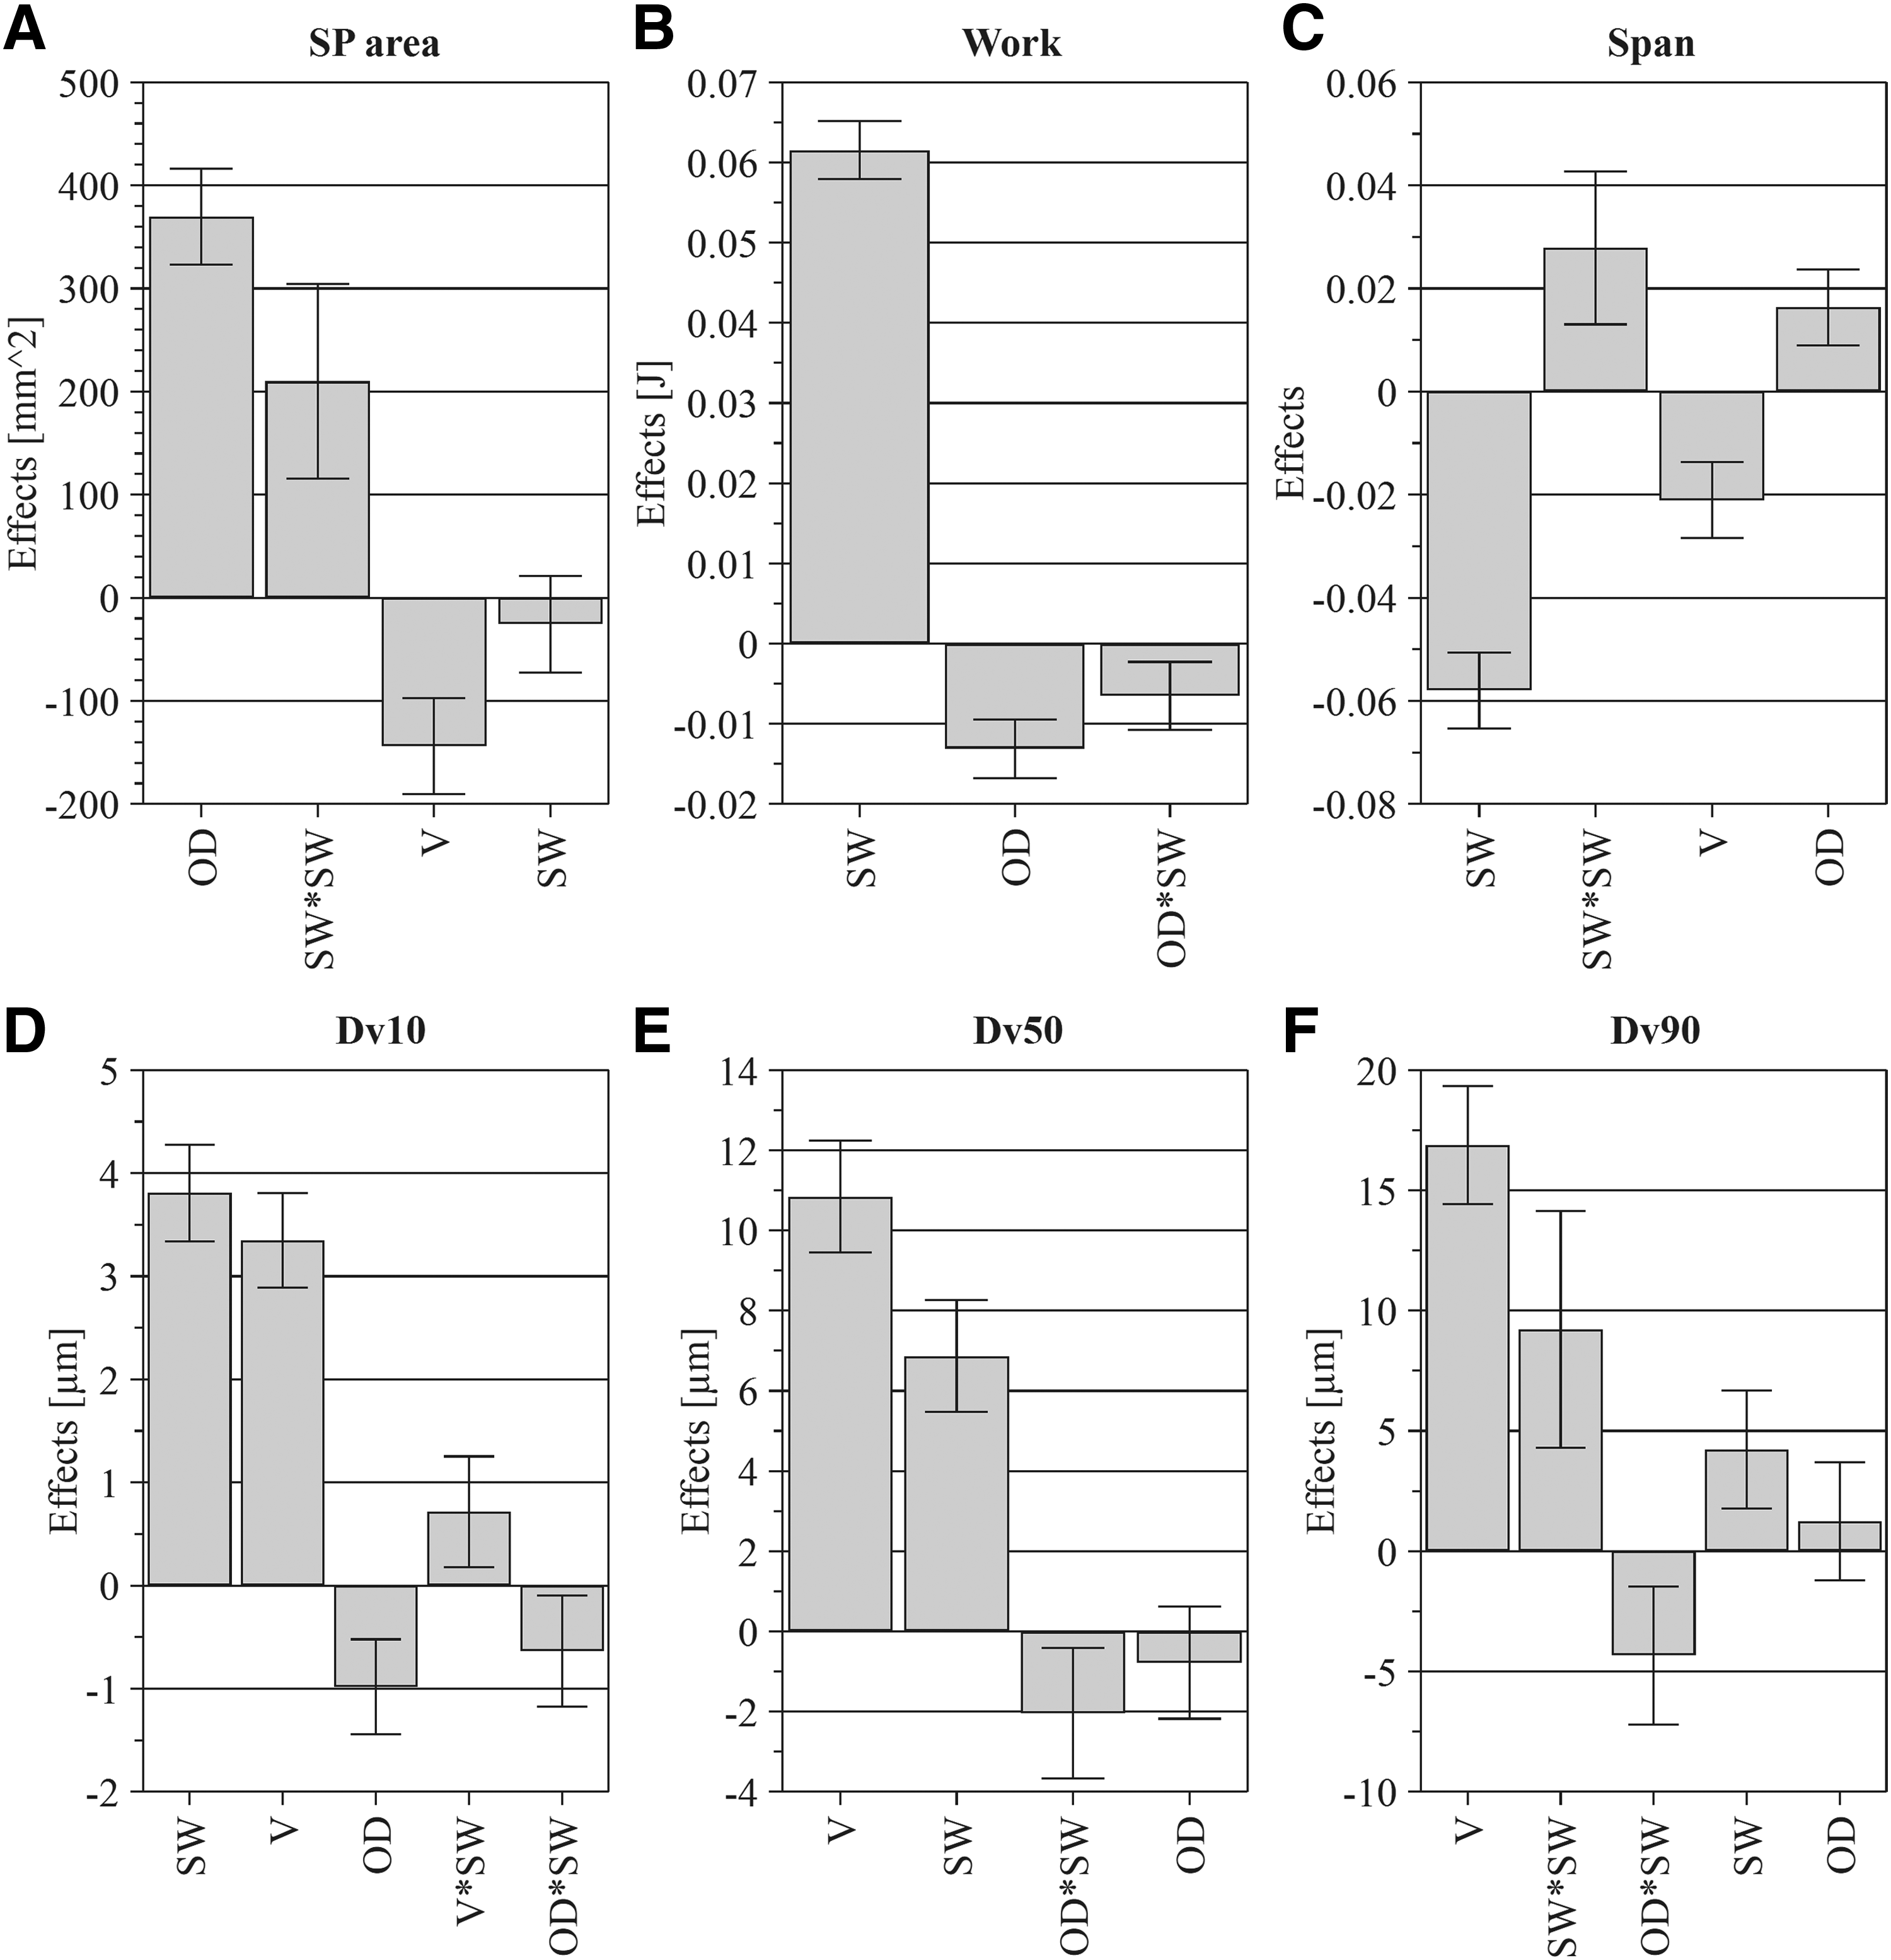
Effects for significant terms from optimized models with corresponding 95% confidence intervals.
Nonsignificant terms are labeled with nst. For each model, goodness of fit is presented with RSD, p-value for regression, p-value for lack of fit, Q2 statistics, R2 statistics, and R2adj statistics.
RSD, residual standard deviation.
Contour plots were constructed using optimized models, with varying two factors on two axes while holding the third factor at central level for each contour plot. Contour plots are presented in Figure 6.
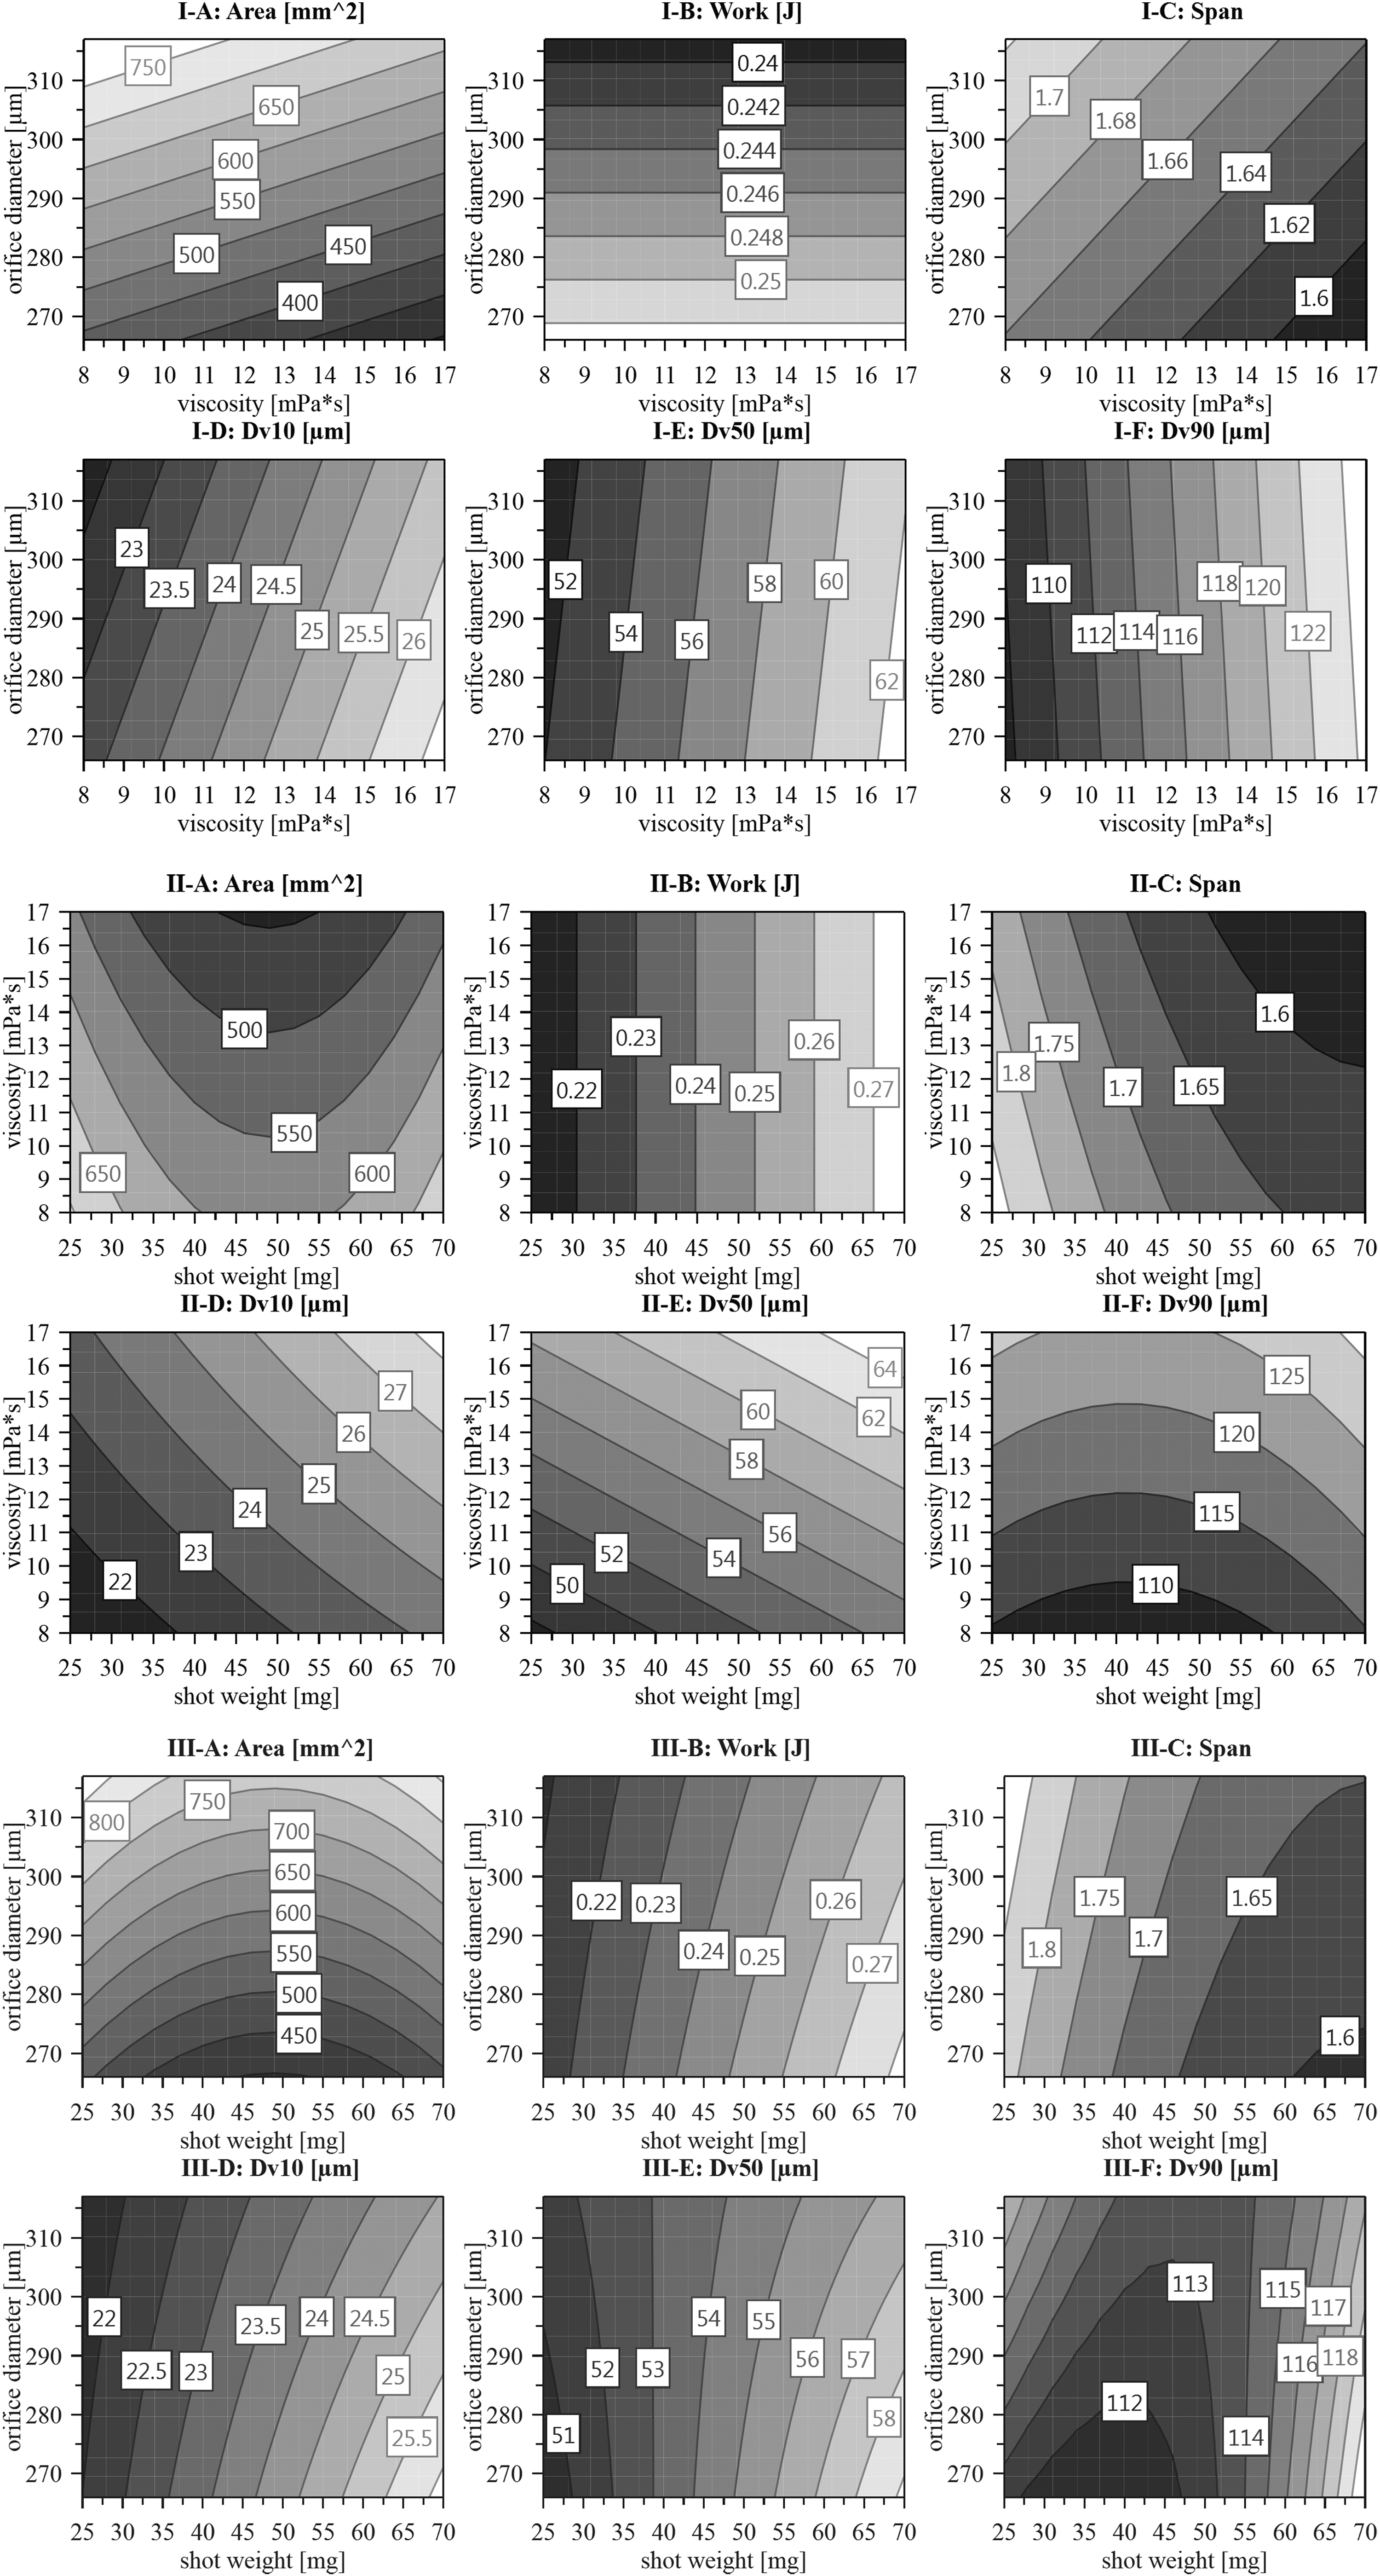
Contour plots for two factors from optimized models. Dark color presents smaller values; light color presents larger values. For each contour plot, third factor, which is not presented, is set at central level.
Discussion
Actuation parameters
In the side actuated Latitude device, the user pushes the press button horizontally, which then causes a mechanism to compress the VP7 pump inside housing in a vertical upward motion and form a spray. Transition of work generated by a horizontal force on the press button into vertical movement is a more complex process compared with actuation of classical top-down nasal spray device.
To obtain an understanding of delivery device behavior during actuation, manual actuation was recorded with a high-speed camera. Typical displacement curve profile of press button in mm compared with starting position is presented in Figure 3 with light gray curve. In the first 20 milliseconds of actuation, there is ∼2 mm change in position, followed by a plateau phase, which lasts up to 80 milliseconds with no significant movement of press button. The user continued to push and felt resistance from the device and needed to apply additional force to continue movement. At 80 milliseconds, force exerted on the press button overcomes force originating from the nasal spray device in the opposite direction, resulting in further movement of press button. At the same time, spray of droplets starts to form at the orifice nozzle. In next 30 milliseconds (solid light gray line), further 3 mm change in press button position was observed, with active spray formation.
Further changes in press button position could not be observed accurately; however, on video, spray formation lasted for additional 15 milliseconds. It can be concluded that active spray formation during manual actuation lasts for ∼45 milliseconds, with estimated averaged velocity of 100 mm/s in first 30 milliseconds.
Typical velocity profile of automated actuation (velocity set at 90 mm/s and acceleration set at 6000 mm/s2) is presented in Figure 3 with a dark gray curve. Initial 10 milliseconds are the acceleration phase, followed by steady velocity phase from 10 to 115 milliseconds, which ended by deceleration phase from 115 to 125 milliseconds. From ∼50 to 120 milliseconds (solid dark gray line), SP was detected by camera, representing active spray formation. Corresponding force profile generated during automated actuation is presented with a solid black line. Peak in force observed at ∼45 milliseconds collides with start of spray formation, with change in press button position of ∼3 mm. This point is analogous to manual actuation point at 80 milliseconds where force from the finger exerts additional force coming from the device in the opposite direction, which results in start of spray formation.
The main differences between manual and automatic actuation dynamics are in the absence of plateau region in automatic profile and intermediate accelerations and decelerations specific only to manual actuation.
Direct mimic of manual actuation is not possible using the automated actuation system due to limitation of instrument where you can set only initial acceleration, target velocity, and final deceleration, of which velocity is the main contributor to active phase as explained above. Therefore, the indirect approach using correlation of DSD between manual and automated actuation can be used to find the best match. The best settings were found to be with velocity set at 90 mm/s and acceleration set at 6000 mm/s2, for which comparative data are presented in Table 4. Good correlation using both central and border DoE samples was shown for DSD parameters Dv10 (R2 = 0.864), Dv50 (R2 = 0.979), and Dv90 (R2 = 0.841), demonstrating suitability of automated actuation parameters for the whole design space of DoE. These settings are in good agreement with those from evaluation of manual actuation with observed velocity at 100 mm/s during active spray formation.
Preliminary experiments
During sample preparation and priming of samples for viscosity and SP measurements, it was noted that sample with Avicel RC-591 concentration of 0.5% did not form stable suspension. Even after immediate shaking, insoluble particles of Avicel RC-591 settled down. Since suspension in this 0.5% concentration sample was not homogeneous and to avoid introduction of uncontrolled factor of particle sedimentation, it was not used in the rest of preliminary testing. Visual observation of samples with Avicel RC-591 concentration of 2.5% and 3.0% suggested that very thick gel with solid consistence was formed, exerting poor flow properties compared with samples in the concentration range from 1.0% to 2.0%. Nevertheless, suspension was stable and both high concentration samples were further used in preliminary testing.
Evaluation of viscosities (Fig. 4) revealed increasing viscosity trend through the whole range of tested Avicel RC-591 concentrations, using both methods at 50 and 1500 s−1. As already suggested by Pennington et al.,(13) high-shear forces involved in atomization of droplets could be related and simulated with higher shear rates applied during viscosity measurements. Shear rate applied to the suspension during actuation was approximated even at 105−106 s−1. In their study, they simulated these shear rates by using capillary rheometer measurements at 400.000 s−1. They further performed measurements using rotational rheometer at 1000 s−1. Although viscosities measured with both approaches were numerically different due to shear-thinning nature of a suspension, a linear relationship between results of both approaches can be concluded on Avicel samples at 1%, 2%, and 3% (wt./wt.).
This validates the use of either of both approaches to be taken to set levels for factor viscosity to describe properties of suspension at a given concentration of Avicel RC-591, and motivated authors of this study to use viscosities measured at shear rate of 1500 s−1 in further DoE.
Comparison of SP data presented a trend toward decreasing SP area as the concentration of Avicel RC-591 was increased within the range from 1.0% to 2.5%. However, the trend was inverted at Avicel RC-591 concentration of 3.0% where, interestingly, significant increase in SP area was observed. Inspection of SP area raw data and actuation force profiles did not reveal any unusual behavior or provide an explanation, which would correlate with observed inverted trend at 3.0%. To further investigate, shot weight was measured on all tested samples. For samples with concentration from 1.0% to 2.0%, it was found to be within the expected range and variability around targeted value of 50 mg.
On the other hand, samples with Avicel RC-591 concentrations 2.5% and 3.0% showed significant inconsistency. Determined masses ranged in random manner for consecutive actuations from 30 to 50 mg. Possible explanation of this unexpected deviation could be in too thick nature of suspension due to which the pump could not intake suspension into the metering chamber in a reproducible manner. It should also be noted that the producer(28)-recommended usage level of this suspension-stabilizing agent is in the range from 1.0% to 2.0%.
Based on findings of preliminary experiments and following the recommendation from the producer, samples with Avicel RC-591concentrations of 1.0%, 1.5%, and 2.0% were selected for final DoE plan, with corresponding measured viscosities (at 1500 s−1) of 8, 11, and 17 mPa × s, entered as factor levels in DoE.
Response surface DoE
Actuation work
Patients have an active role in creation of dose with actuation process. One of the important aspects related to patient experience with nasal spray is also resistance force created by the nasal spray during actuation. Resistance force could be attributed to many factors, among them construction of the device and mode of actuation, resistance of the pump, properties of the suspension, and others. Force–displacement–time profile is measured during each actuation as the opposing force translating from press button to actuator.
Force profile can be interpreted in many ways. One way to describe force is to take a single point from entire force profile, either maximum value or value at a specific time point, to characterize and quantify resistance force. With this approach, one may either lose too much information or selection be set too subjective. Alternative approach to indirectly measure resistance force is through determination of work introduced during actuation, which could be obtained by integration of whole force profile over changes in position of a press button. With this approach, complete force profile and significant higher degree of information is taken into consideration. Potential changes in resistance force could also be reflected in changes of work done during actuation.
Throughout the whole DoE, values for work ranged from 0.20 to 0.28 J, with average of 0.24 J. As presented in Figure 5 (graph B), by far, the most important effect which influences work is shot weight with small variability and high confidence. Clear correlation is established, higher shot weight will result in higher amount of work needed to perform actuation. Since more suspension needs to be expelled through the nozzle orifice with higher shot weight, more work to do it seems to be the logical conclusion.
Another significant factor is orifice diameter, which was found to be inversely related to the amount of work. This effect is several times smaller compared with the effect of shot weight. Possible explanation of this finding is that expelling suspension through a smaller orifice creates increased shear rate and stress, which at constant viscosity and shot weight means increased pressure drop at the nozzle outlet and therefore requires higher amount of work during the atomization process, and vice versa. Since observed system is slightly shear thinning above yield value, it could be expected that viscosity of the system is reduced when shear rate increases due to orifice diameter decrease and therefore slightly compensates for the pressure drop increase.
Interaction between both shot weight and orifice diameter is also observed to be significant, but with relatively higher variability. Nevertheless, interaction term was included in the final optimized model (Table 3). Contour plots are presented in Figure 6 (graphs I-B, II-B, and III-B).
Response surface model is presented in Equation (3):
Interestingly, strong negative correlation between response activation work and DSD with R = 0.918 has been identified. Practical consequence of this observation is that when increased amount of work is introduced during actuation, better atomization of droplets can be expected with all DSD parameters moving toward smaller values, with the most significant effect on Dv90. Considering Equation (1), we can expect narrower spread of droplet distribution, regardless of the shot weight increase.
It should be pointed out that all observed values of mechanical work done during actuation from executed DoE are within ±20% of average value. These differences in applied work were not observed by the analyst during preparation of samples and manual priming process of each sample. Assuming that most probably patients would not observe these small differences during actuation as well, confirms suitability and interchangeability of tested pumps with different nominal shot weight values.
SP area
SP area values observed in DoE are spanning from ∼300 to 1000 mm2, with average of 550 mm2 (Table 2). Contour plots are presented in Figure 6 (graphs I-A, II-A, and III-A).
All three factors were found to have a significant effect on SP area (Fig. 5, graph A). Orifice diameter is a dominating factor and is positively correlated with SP area. One working hypothesis to explain this behavior was that larger orifice diameter translates into larger exiting angle of formed plume, resulting in larger SP area. To confirm this, measurements of PG were performed on few selected samples by using same analytical method parameters as set for SP, the only difference was in camera position, which was set perpendicular to vertical laser sheet plane. Typical result is presented in Figure 7 for four samples, where levels of orifice diameter and viscosity were combined at low and high level, while shot weight was held constant at 50 mg.
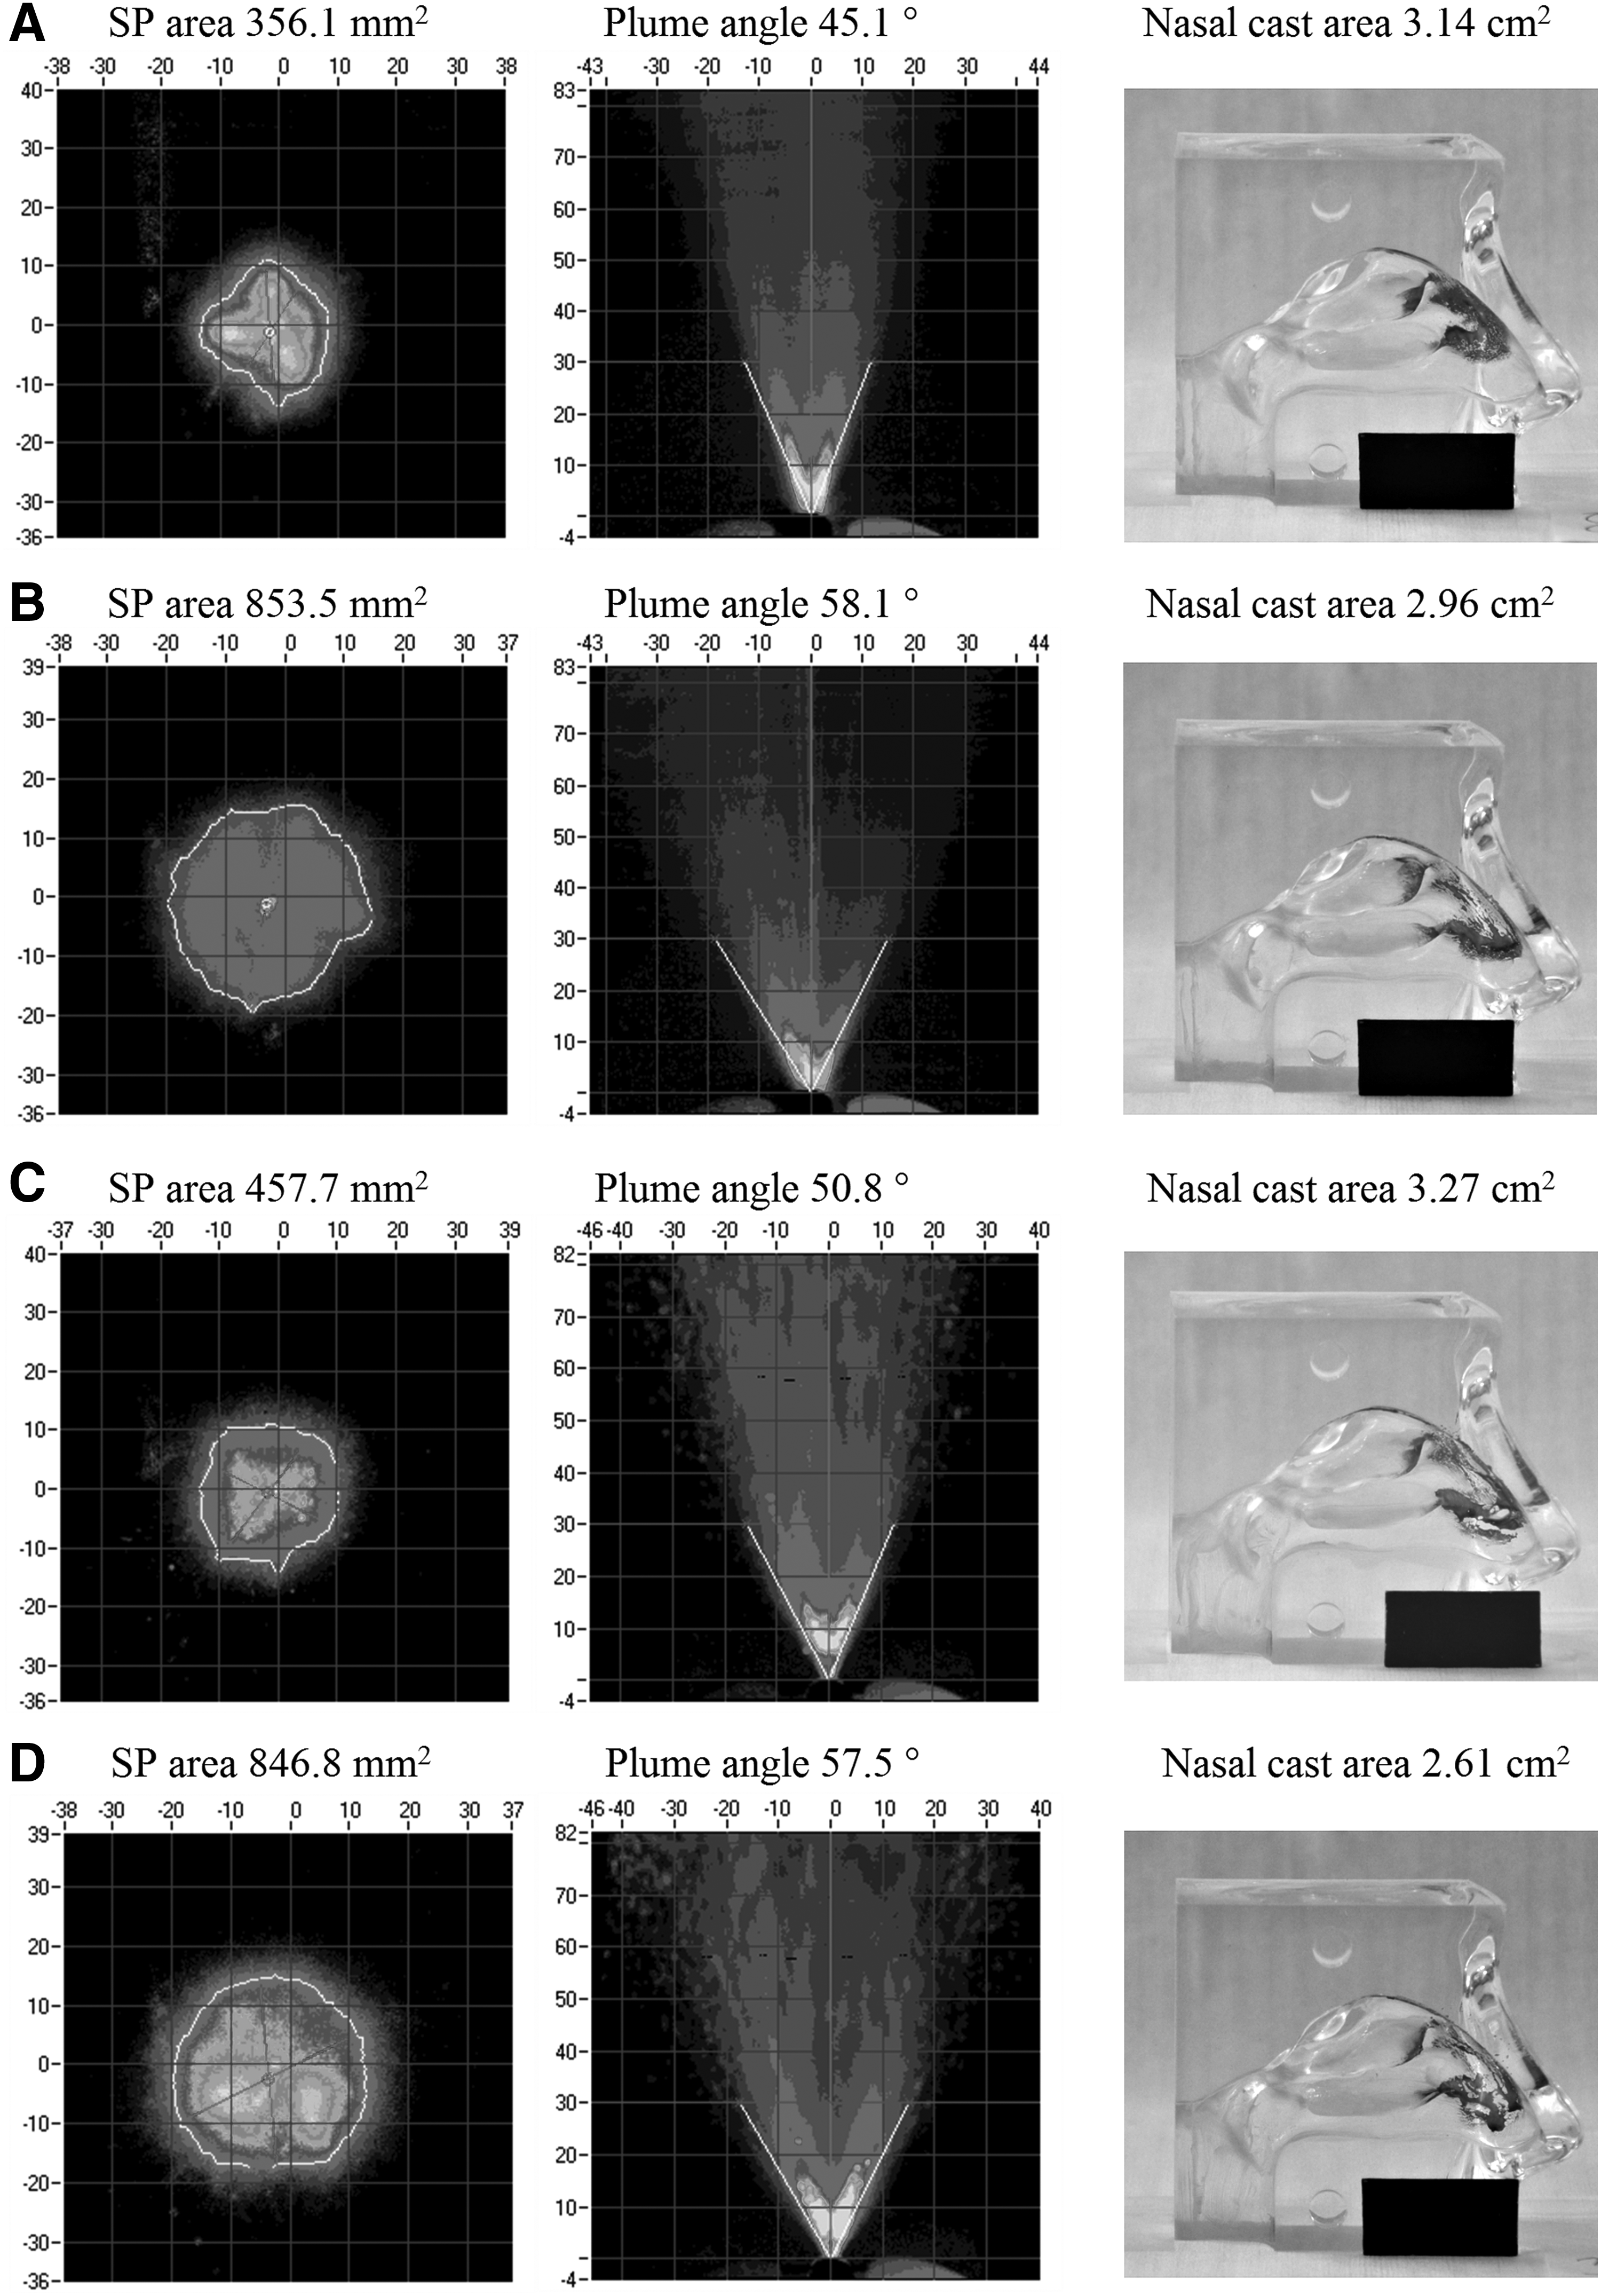
Comparison of SP area and plume angle measurement at 3.8 cm distance and nasal cast study for samples with high viscosity and small orifice diameter
Both visual inspection and measured values confirmed working hypothesis. Major observation of this comparison was that large differences in SP area are translated in detectable differences in PG plume angle. When SP differences were smaller, differentiation in PG became less significant. This confirms SP parameter as much more sensitive parameter to describe plume characteristics over PG. Additional disadvantage of PG parameter is that the operator manually determines both arms of plume angle, contrary to SP where determination of area is automatically evaluated by an algorithm.
Another significant factor that was found is the quadratic term for shot weight, where a parabolic relationship with SP area was observed, while linear component was not significant. Minimum values for responses are observed on central level of shot weight, while on lower and higher levels, larger values for responses are observed. To find an explanation for this phenomenon, further visual examination of raw data for SP was done. To demonstrate these differences, two examples showing SP area from DoE are presented in Figure 8 where shot weight varied on all three levels, while orifice diameter and viscosity are held constant.
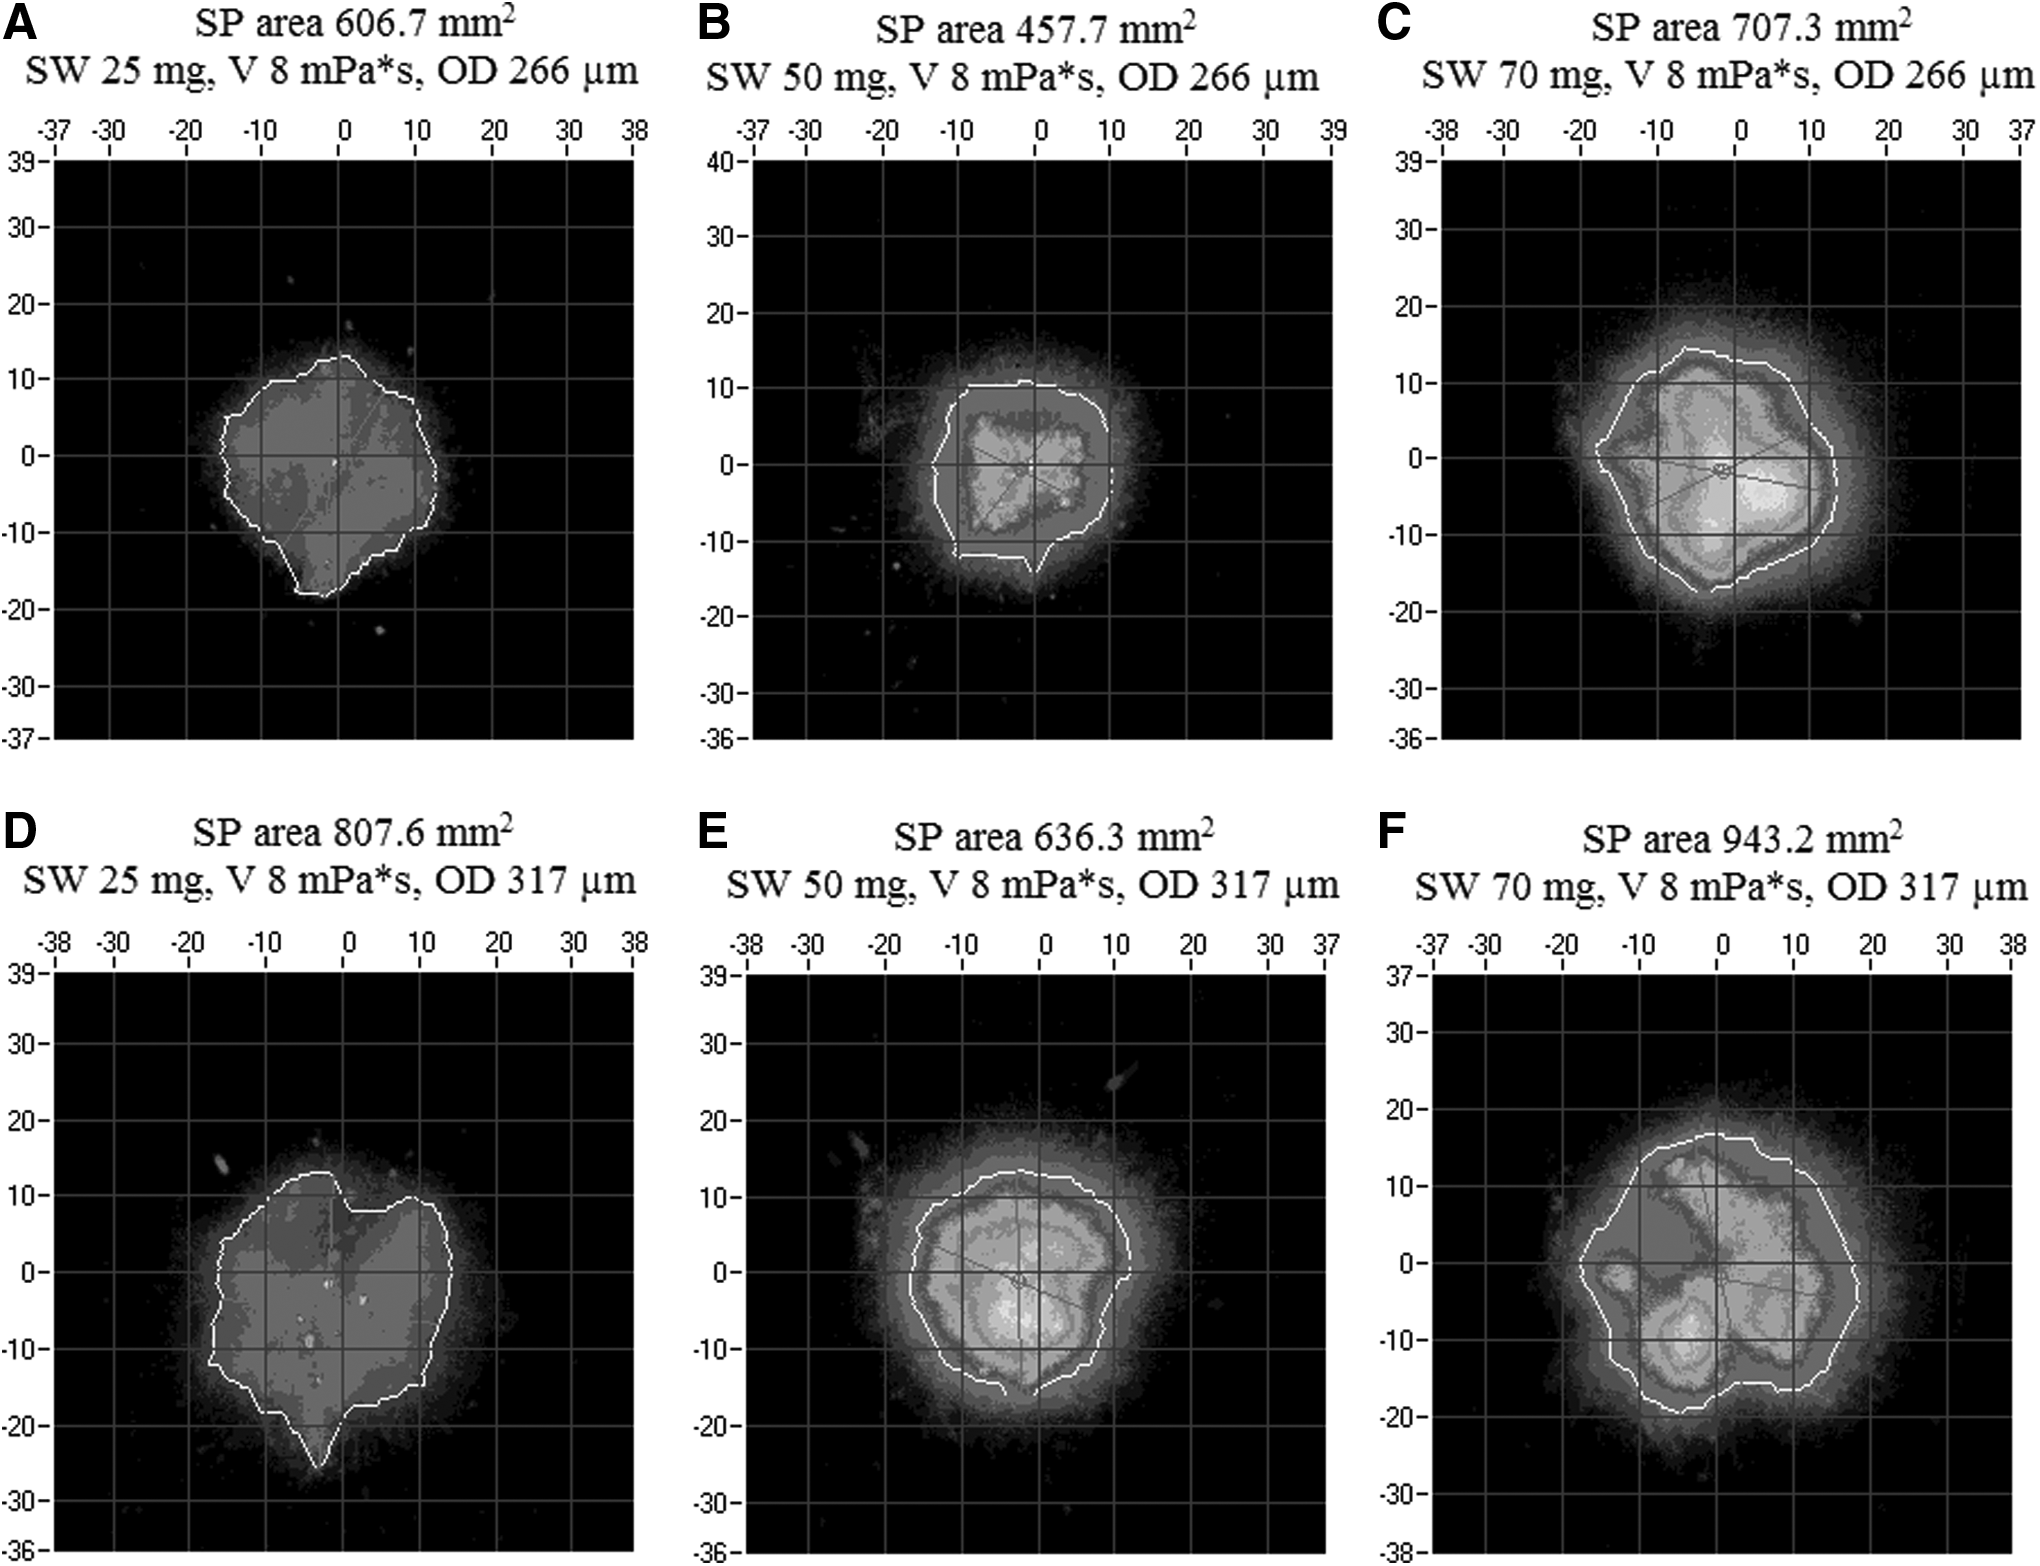
Two examples of SP area raw data measured at 3.8 cm distance, where SW is varied on all three levels, while OD and V are held constant. White line borders 95% of total droplet density of SP area. OD, orifice diameter; SW, shot weight; V, viscosity.
Interestingly, droplet density distribution within SP area (defined as area of 95% of droplet intensity integrated over measurement time) was found to be dependent on shot weight. In general, samples on low level have relatively homogeneous distribution of droplet density within the whole spray, with a thin ring of droplets outside the white line, which is fitted to encompass 95% of overall droplet density, which in turn defines SP area. For central and high shot weight level samples, higher density of droplets is observed in the middle of the spray with relatively large area of low-density droplets outside SP area border. Increase of SP area seems to be linear and could be related to higher mass of expelled suspension. On the contrary, differences in SP area at low-level samples can be explained by different distribution of droplets compared with central and high-level samples.
While quadratic term for shot weight was found to be significant, variability is still relatively large and further experimental investigation should be done to fully elucidate this parabolic effect. On the other hand, this exercise in manual inspection of SP graphical overall data clearly reveals that more information could be extracted using same SP experimental setup if dynamic droplet intensity data would be stored per time sequence and analyzed for the droplet density distribution pattern, which could have physiological significance for droplet deposition when targeted deposition of the dose is required within the nose cavity.
Viscosity was found to be negatively correlated with SP area on a significant level. As concluded under the Actuation work section, viscosity did not have significant impact on applied mechanical work (95% confidence intervals for work are 0.232–0.252, 0.227–0.253, and 0.231–0.255 J at samples with 8, 11, and 17 mPa × s, respectively). It can be further deduced that in average throughout the whole DoE, the amount of work done at different levels of viscosity was not significantly different. With the same amount of work provided during droplet atomization process per shot weight, a less viscous sample would be better atomized and would result in larger SP area compared with more viscous sample. Similar behavior was identified in other studies,(12–14,24) where higher concentration of gelling agent resulted in higher viscosity and smaller SP area.
Response surface model is presented in Equation (4):
Droplet size distribution
DSD values for Dv10, Dv50, and Dv90 were determined in ranges of 21–29, 47–68, and 105–135 μm and averages of 24, 57, and 116 μm, respectively (Table 2). Contour plots of DSD metrics, constructed from models, are presented in Figure 6 (graphs I-C to I-F, II-C to II-F, and III-C to III-F).
In general, model terms related to viscosity and shot weight have highest impact on all DSD response metrics, while orifice diameter has little if any significant effect (Fig. 5, graphs C–F).
To explain the effect of viscosity, similar rationale as for SP area could be applied for DSD. Better atomization of less viscous sample per same work applied would result in development of smaller droplets, and vice versa. This is in line with general findings from other studies,(12–14,24) where samples with higher viscosities are related to formation of larger droplets.
To explain the effect of shot weight, the relationship to applied actuation work might be used as well. At higher shot weight, more work is applied and more energy is used during the atomization process. One might expect that droplet size would remain in similar ranges regardless of the level of shot weight. This would minimize the effect of this factor. Contrary to this, positive impact was observed in example that at higher shot weight also droplet size is larger, and vice versa. Differences in work applied during actuation observed at different shot weights are apparently not high enough and do not translate into similarly intense atomization, which would keep droplet size on the same level.
For Dv10, both shot weight and viscosity are predominant factors. Smaller but still significant effect is observed for orifice diameter, and two interaction terms are found to be right on the limit of significance. Response surface model is presented in Equation (5):
For Dv50, viscosity has the strongest effect, followed by shot weight. Small interaction between orifice diameter and shot weight is observed, while orifice diameter itself has no significant effect, but is kept to preserve hierarchy of the model. Response surface model is presented in Equation (6):
Viscosity is also the most important factor for Dv90. Approximately twofold smaller effect is exerted by quadratic term of shot weight, which is found to be relatively variable with wide confidence intervals, but still significant. Other significant terms are linear term of shot weight and interaction between shot weight and orifice diameter. Orifice diameter itself has no significant effect. Response surface model is presented in Equation (7):
Span is not measured, but calculated value of Dv10, Dv50, and Dv90, which describes relative distribution width. The smaller the number, the less variation there is between the sizes of droplets. Shot weight and viscosity are inversely related to span. Related to effects that shot weight and viscosity have on individual DSD measures, it seems that samples with smaller DSD values will have larger span. Interestingly, quadratic term for shot weight also appears to be significant, which can be related to individual model for Dv90. Response surface model is presented in Equation (8):
Nasal cast studies
A simple visualization technique developed by Kundoor and Dalby(26) was used to assess deposition pattern within artificial nasal cast, providing an indication of local drug availability at the site(s) of action. Samples used in nasal cast studies were selected from all tested samples from DoE in a manner that combination of low–high DSD crossed with low–high SP samples was assessed. Shot weight for all samples was set at central level of 50 mg to avoid impact of different suspension volumes. Selected levels for viscosity and orifice diameter are reported in Table 5 together with results. Comparative images are presented in Figure 7.
General conclusion is that all tested samples delivered dose in the anterior region of nasal cavity, regardless of DSD and SP properties. Findings are consistent with work by Kundoor and Dalby(26) with similar region and range of deposition pattern areas observed. In a study by Pu et al.,(14) 1% and 2% Avicel formulation using a different pump (VP3, manufactured by Aptar, Congers, NY) with a dosing volume of 100 μL, deposition patterns were primarily observed in the anterior region. By visual comparison, deposition patterns are larger compared with those observed in our study, most probably due to two times larger dosing volume. A correlation between SP, corresponding plume angle, and deposition area can be identified from presented results (Table 5). Narrower plume covers greater area of nasal cast in its anterior region.
Furthermore, Suman et al.(11,29) demonstrated in their work that the nasal spray pump deposited in the anterior region of the nasal cavity using gamma scintigraphy in human volunteers. In further studies, they also concluded that differences observed in in vitro performance did not lead to different in vivo behavior, suggesting that tests might not be clinically relevant. Other explanation of this outcome might be that in vitro tests are simply overdiscriminatory.
It should be noted that limitation of performed nasal cast study is that it only measures two-dimensional projection of deposited pattern, without taking into account three-dimensional surface of nasal cavity or different density of deposition. Furthermore, the amount of deposited drug is not quantified; therefore, the method is not specific for actual dose. In addition, limited number of samples was tested. As such, nasal cast results should only be used as indication; nevertheless, general impression is that in vitro methods such as SP and DSD seem to be more discriminatory (larger relative differences in case of SP) compared with deposition patterns within nasal cast study. From this perspective, use of these in vitro methods certainly seems to be an appropriate measure for product quality control, and setting limits on these parameters within tested samples would assure reproducible in vivo behavior.
Practical application of response surface model
Practical application of response surface model can be exemplified using the following case. One would like to set control space in terms of 95% confidence intervals of factor levels to achieve targeted in vitro performance. Expectation for Dv50 is to be in range from 50 to 60 μm with target value of 55 μm and for SP area is to be in range from 450 to 650 mm2 with target value of 550 mm2. Tolerance for performance of these ranges/failure is set at 1%. Furthermore, one can vary factors, viscosity and orifice diameter, within knowledge space, while shot weight factor is limited by choice of pump design and fixed at value of 50 mg in this case. According to regulatory requirements,(30) maximum allowed deviation for shot weight is ±15% from claimed value, which translates into allowed range of ±7.5 mg around target value.
Setpoint and 95% confidence intervals of factor levels together with final prediction of responses as determined in Optimizer and Setpoint analysis simulations are shown in Table 6. If one uses selected pump design, which predefines shot weight (50 ± 7.5 mg), to achieve targeted in vitro performance, viscosity must be set to 10.4 mPa × s and controlled within range from 9.0 to 11.8 mPa × s and orifice diameter must be set to 286.4 μm and controlled within range from 278.2 to 294.6 μm. With these settings, average value for Dv50 would be 54.5 μm and for SP area 551.1 mm2. Total percent of failures on these two in vitro parameters would be 0.97%. Other predicted values for Dv10, Dv90, Span, and work would be 23.8 μm, 112.5 μm, 1.66 J, and 0.247 J, respectively.
SD, standard deviation.
Other acceptable combinations of both viscosity and orifice diameter factors, so-called Design space, are shown in Figure 9 where different contours are associated with percent of failures. White area is reflective of factor combinations with 1% failure level.

Design space for factors, OD and V, at fixed 50 mg SW value. Contours are associated with percent of failures (values on graph).
To validate response surface model, experimental sample was prepared where orifice diameter and viscosity were set at extremes of defined control space, 279 μm and 12.0 mPa × s, respectively. Shot weight was kept at 50 mg. Predictions for average value of SP area and Dv50 from response surface model using Equations (3) and (5) were 470.9 mm2 and 56.5 μm, while actual results for average from tested 15 units were 493.0 ± 74.0 mm2 and 54.7 ± 3.7 μm, respectively. Difference between predicted and actual values is <5%.
Conclusion
To conclude, presented study elucidated effects of three factors related to both formulation and delivery device properties on in vitro performance of nasal sprays through utilization of D-optimal DoE. While factor viscosity was already evaluated in several other studies, to the best knowledge of authors for the first time, this study introduced insights into factors—orifice diameter and shot weight—and their impact on responses (CQA).
Conclusions for viscosity are similar to those from other studies. Most dominant effect is observed on DSD and modest effect is observed on SP area, with lower viscosity related to better atomization of a suspension, resulting in smaller DSD and larger SP area. Orifice diameter has by far the highest impact on SP area; with larger diameter also SP area gets larger. This phenomenon was related to larger exiting plume angle and confirmed with PG testing. Shot weight factor exerts significant influence on all tested metrics.
Shot weight is the most dominant factor for work where larger shot weight is responsible for higher amount of work done during actuation. Shot weight is also important for DSD where larger values are related with larger DSD. Interestingly, in case of SP, relationship with shot weight is described by second-order polynomial fit. Inspection of raw data revealed that density of droplets within SP area is different for different shot weight values. To understand this phenomenon, further studies with inclusion of additional levels of shot weight are proposed, where not only SP area but also differences in density distribution of droplets should be quantified and considered in evaluation.
An alternative approach introduced into in vitro testing within the presented study is analysis of amount of work applied during actuation. It was demonstrated that evaluation of amount of work can provide good insight into understanding how changes in different factors affect performance and was found to be a sensitive tool. It was also found that work correlates negatively with DSD span value.
Since constraints of nasal cavity play an important role, nasal cast studies were performed, which confirmed that deposition area correlates with SP and its corresponding plume angle and that in vitro methods such as SP and DSD possess more discriminatory power compared with deposition studies. This provides validation proof that these in vitro methods seems to be appropriate measure for quality control.
Further advantage of systematic DoE is not only to understand the inherent relationship between factors and responses but also to establish mathematical models (response surfaces) for predictive purposes to target specific in vitro performance of nasal sprays by setting appropriate specifications to factors, as shown and validated by one experimental example.
Footnotes
Acknowledgments
Authors would like to thank Aptar Pharma for providing customized delivery devices. Gratitude goes to fellow researcher Helena Šuklje Debeljak for fruitful brainstorming while preparing DoE. Experimental work would not have been conducted so successfully without the help and vast amount of practical experience from technician Elena Arsova.
Author Disclosure Statement
At the time of writing the article, J.G., R.I., K.S., and D.B. are employees of Lek Pharmaceuticals d.d. (Ljubljana, Slovenia). R.D. is an employee of Faculty of Pharmacy, University of Ljubljana (Ljubljana, Slovenia).