
Abstract
Abstract
Background:
The measurement of aerosol flow rates without obscuration of the flow is of particular concern with in vivo lung deposition studies, where precise knowledge of aerosol particle size distributions is a necessary requirement for the development of predictive correlations. This study examines the utility of an ultrasonic flow meter for such measurements and determines if a valved system can be attached to the flow meter for sampling exhaled aerosols.
Methods:
The flow rate across a D-30 flow meter was compared with and without nebulization of 0.9% saline aerosols from a PARI LC Sprint nebulizer. Particle size distributions of the nebulized aerosol before and after adding the D-30 flow meter and duckbill valve were measured using a Spraytec laser diffraction system. Finally, the ability of the Thor D-30 to capture a realistic breathing profile was assessed.
Results:
The mean ± standard error flow rates measured by the D-30 flow meter with and without nebulization were 10.4 ± 0.1 versus 10.4 ± 0.1 L/min, 66.4 ± 0.1 versus 67.2 ± 0.1 L/min, and 89.9 ± 0.1 versus 91.4 ± 0.1 L/min. The D-30 flow meter did not considerably affect the volumetric median diameter (VMD) of the aerosols, while the VMD reduced slightly by 0.65 μm at 10 L/min and 0.69 μm at 72 L/min upon the inclusion of a duckbill valve. Time-weighted average inhalation flow rates measured by D-30 flow meters placed upstream and downstream of the one-way valve agreed well, 31.9 versus 32.6 L/min, respectively.
Conclusions:
The D-30 flow meter can be used to accurately measure inhalation flow rates of nebulized aerosols without significantly impacting particle size distributions, and one-way duckbill valves can be used to isolate the inhalation portion of a breathing pattern to facilitate collection of exhaled doses.
Introduction
I
Many of the existing techniques for assessing inhalation parameters can influence the size distribution of an aerosol delivered to a subject. With the pneumotachograph, particles can be lost to impaction against the capillary tubing of the device, leading to shifts in size distributions of inhaled aerosols and reductions in aerosol concentrations. Further losses in the dead-space volume of the pneumotachograph can cause additional errors in the measurements of exhaled aerosols, complicating the accurate calculation of inhaled dose and airway deposition fractions. Alternatively, inductive plethysmography does not interfere with the aerosol flow path, but measurements by inductive plethysmography are sensitive to the location of placement, and require subject-specific calibrations for accurate use.(8)
Given the limitations associated with current methods of monitoring inhalation flow rates, a new method allowing for accurate measurements of flow rate without affecting an aerosol's particle size distribution would be useful. One potential solution may lie in the use of ultrasonic flow meters, like the Thor D-30 gas flow meter, which use ultrasonic waveforms and multiple sensors to measure the airflow rate through a tube. Unlike other flow sensor designs, such as orifice plates or thermal mass flow meters, ultrasonic flow meters are designed such that no obstructions are placed in the path of the gas in question, reducing losses of particles to impaction within the metering device itself.
However, such a flow meter has not yet been used for monitoring the inhalation flow rate of aerosols in a research or clinical setting. It is unknown if the sudden change in the cross-sectional area between the inlet and the flow tube of the flow meter can affect the aerosol particle size distribution or if the ultrasonic signal itself can alter the aerosol in a notable manner, that is, by acoustic agglomeration.(9) It is also uncertain if aerosols can interfere with the accuracy of the flow meter measurement, since sound speeds can be altered by volume fractions in multiphase flows.(10) These questions are discussed in more detail below and must be addressed before the suitability of ultrasonic flow meters like the Thor D-30 in measuring aerosol flow rates can be established.
In the context of in vivo deposition studies, an ideal flow meter would allow for accurate measurement of inhalation flow rates, while minimizing dead space volume, which complicates the determination of the exhaled dose, the total delivered dose, and airway deposition fractions. One method to reduce dead space volumes while isolating the exhaled dose is through passive one-way (or duckbill) valves,(11) such that nebulized aerosol is delivered to the subject only during inhalation. During exhalation, the one-way valve closes, thereby limiting the instances of noninhaled nebulized aerosol mixing with exhaled particles that otherwise lead to biased measurements of the exhaled dose. The use of one-way duckbill valves is not without concern; one study on mannitol delivered through dry powder inhaler reported that, as much as 20% of the administrated aerosol can deposit on the duckbill valve.(12) However, there have been no studies that have systematically investigated the effect of one-way duckbill valves on the particle size distributions of nebulized aerosols.
The aim of this study is, thus, to assess the practicality and suitability of an ultrasonic flow meter, the Thor D-30, to serve as a new method for monitoring aerosol inhalation flow rates, while also quantifying the effect of one-way duckbill valves on particle size distributions of nebulized aerosols.
Materials and Methods
Flow rate measurement
Inhalation flow rates were measured using a D-30 ultrasonic flow meter (Thor Laboratories, Budapest, Hungary). A modified version of the manufacturer's Thor D-30 LabVIEW (National Instruments, Sydney, NSW, Australia) application was developed for data logging and analysis.
Nebulization of aerosols
2.5 mL of 0.9% saline was nebulized from a PARI LC Sprint nebulizer using a PARI BOY SX compressor (PARI GmbH, Starnberg, Germany). To minimize evaporation of the nebulized aerosol droplets, makeup air was humidified using a humidification chamber heated to 60°C (MR290; Fisher & Paykel, Auckland, New Zealand).
Particle size measurement
The particle size distribution of the nebulized 0.9% saline (Pfizer, New York, NY, USA) aerosol was measured by laser diffraction (Spraytec; Malvern Instruments, Worcestershire, UK) through an inhalation cell. The mouth piece of the nebulizer setup was adjoined directly with the inhalation cell inlet. Nebulized aerosols were sampled at 1-second intervals over a total of 90 seconds at constant flow rates, controlled by a proportional valve connected to a vacuum pump.
Parameters to consider in using an ultrasonic flow meter to measure aerosol flow rates
Dispersion and attenuation of sound in aerosols
The D-30 flow meter, as a time-of-transit ultrasonic flow meter, measures the time required for an ultrasonic pulse to travel a given distance both with and against the predominant direction of fluid flow through the device. The measured difference in transit time for signals travelling with and against the direction of flow correlates linearly with the flow velocity, allowing for the simultaneous calculation of the flow rate and the speed of sound.(10,13) As the sound speed is calculated and not assumed, flow rate measurements from the Thor D-30 are likely immune to changes in the dispersion and attenuation of sound that occurs in multiphase flows, effects that are well documented in the literature,(14,15) although this has not been demonstrated with nebulized aerosols.
Acoustic coagulation
Sound waves travelling in a fluid medium are pressure fluctuations, and as such they can interact with and induce motion of suspended particles. Depending on a number of factors, including sound frequency and amplitude, and aerosol size, polydispersity, and concentration, sound waves can cause considerable agglomeration in aerosols.(9,16–18) Unfortunately, a full analysis of acoustic agglomeration based on the theory in the literature requires more information than is available in this work, but estimation of the importance of this phenomenon can be made as follows:
Following the arguments of Temkin,(15) the frequency of the ultrasonic signal emitted by the Thor D-30 is 200 kHz (G. Ferenczi, pers. comm., 2016), corresponds to an acoustic time scale of 0.005 ms. For the aerosol under consideration in this work, nebulized normal saline with particle sizes in the order of 1 to 10 μm in diameter, particle relaxation times are of a similar order of magnitude—a droplet of water with a diameter of 1 μm has a particle relaxation time of ∼0.003 ms, while a larger 4 μm diameter droplet has a relaxation time of roughly 0.05 ms. As these time scales are of a similar magnitude, sound wave propagation and interactions with particles can be treated as neither a relaxed nor a frozen equilibrium; theoretical considerations of acoustic interactions with particles therefore become considerably more complicated.(15) Nevertheless, smaller particles would be expected to adjust more rapidly to the transient conditions experienced in a pressure wave than larger particles, potentially leading to particle interceptions and agglomerations.
Experimental work has demonstrated considerable acoustic agglomeration with high-intensity ultrasonic sound waves (0.44–2.14 W/cm2 at 20.4 kHz) in aerosols with similar particle sizes, polydispersities, and concentrations as that used in this study.(18) While it is unlikely that the Thor D-30 emits such high field intensities, in the absence of additional information, the possibility that acoustic agglomeration may occur cannot be immediately dismissed.
Effect of nebulized aerosol on Thor D-30 flow rate measurements
To determine if nebulized aerosol can interfere with the flow rate measurement recorded by a Thor D-30 flow meter, a constant flow rate sampled without nebulization was initially measured for 30 seconds at a 16.7 Hz sampling rate by the D-30. This was followed immediately by the introduction of nebulized aerosol, with the flow rate again measured (Fig. 1) for 30 seconds. This allowed for the comparison of flow rates measured by the Thor D-30 with and without the presence of aerosols.
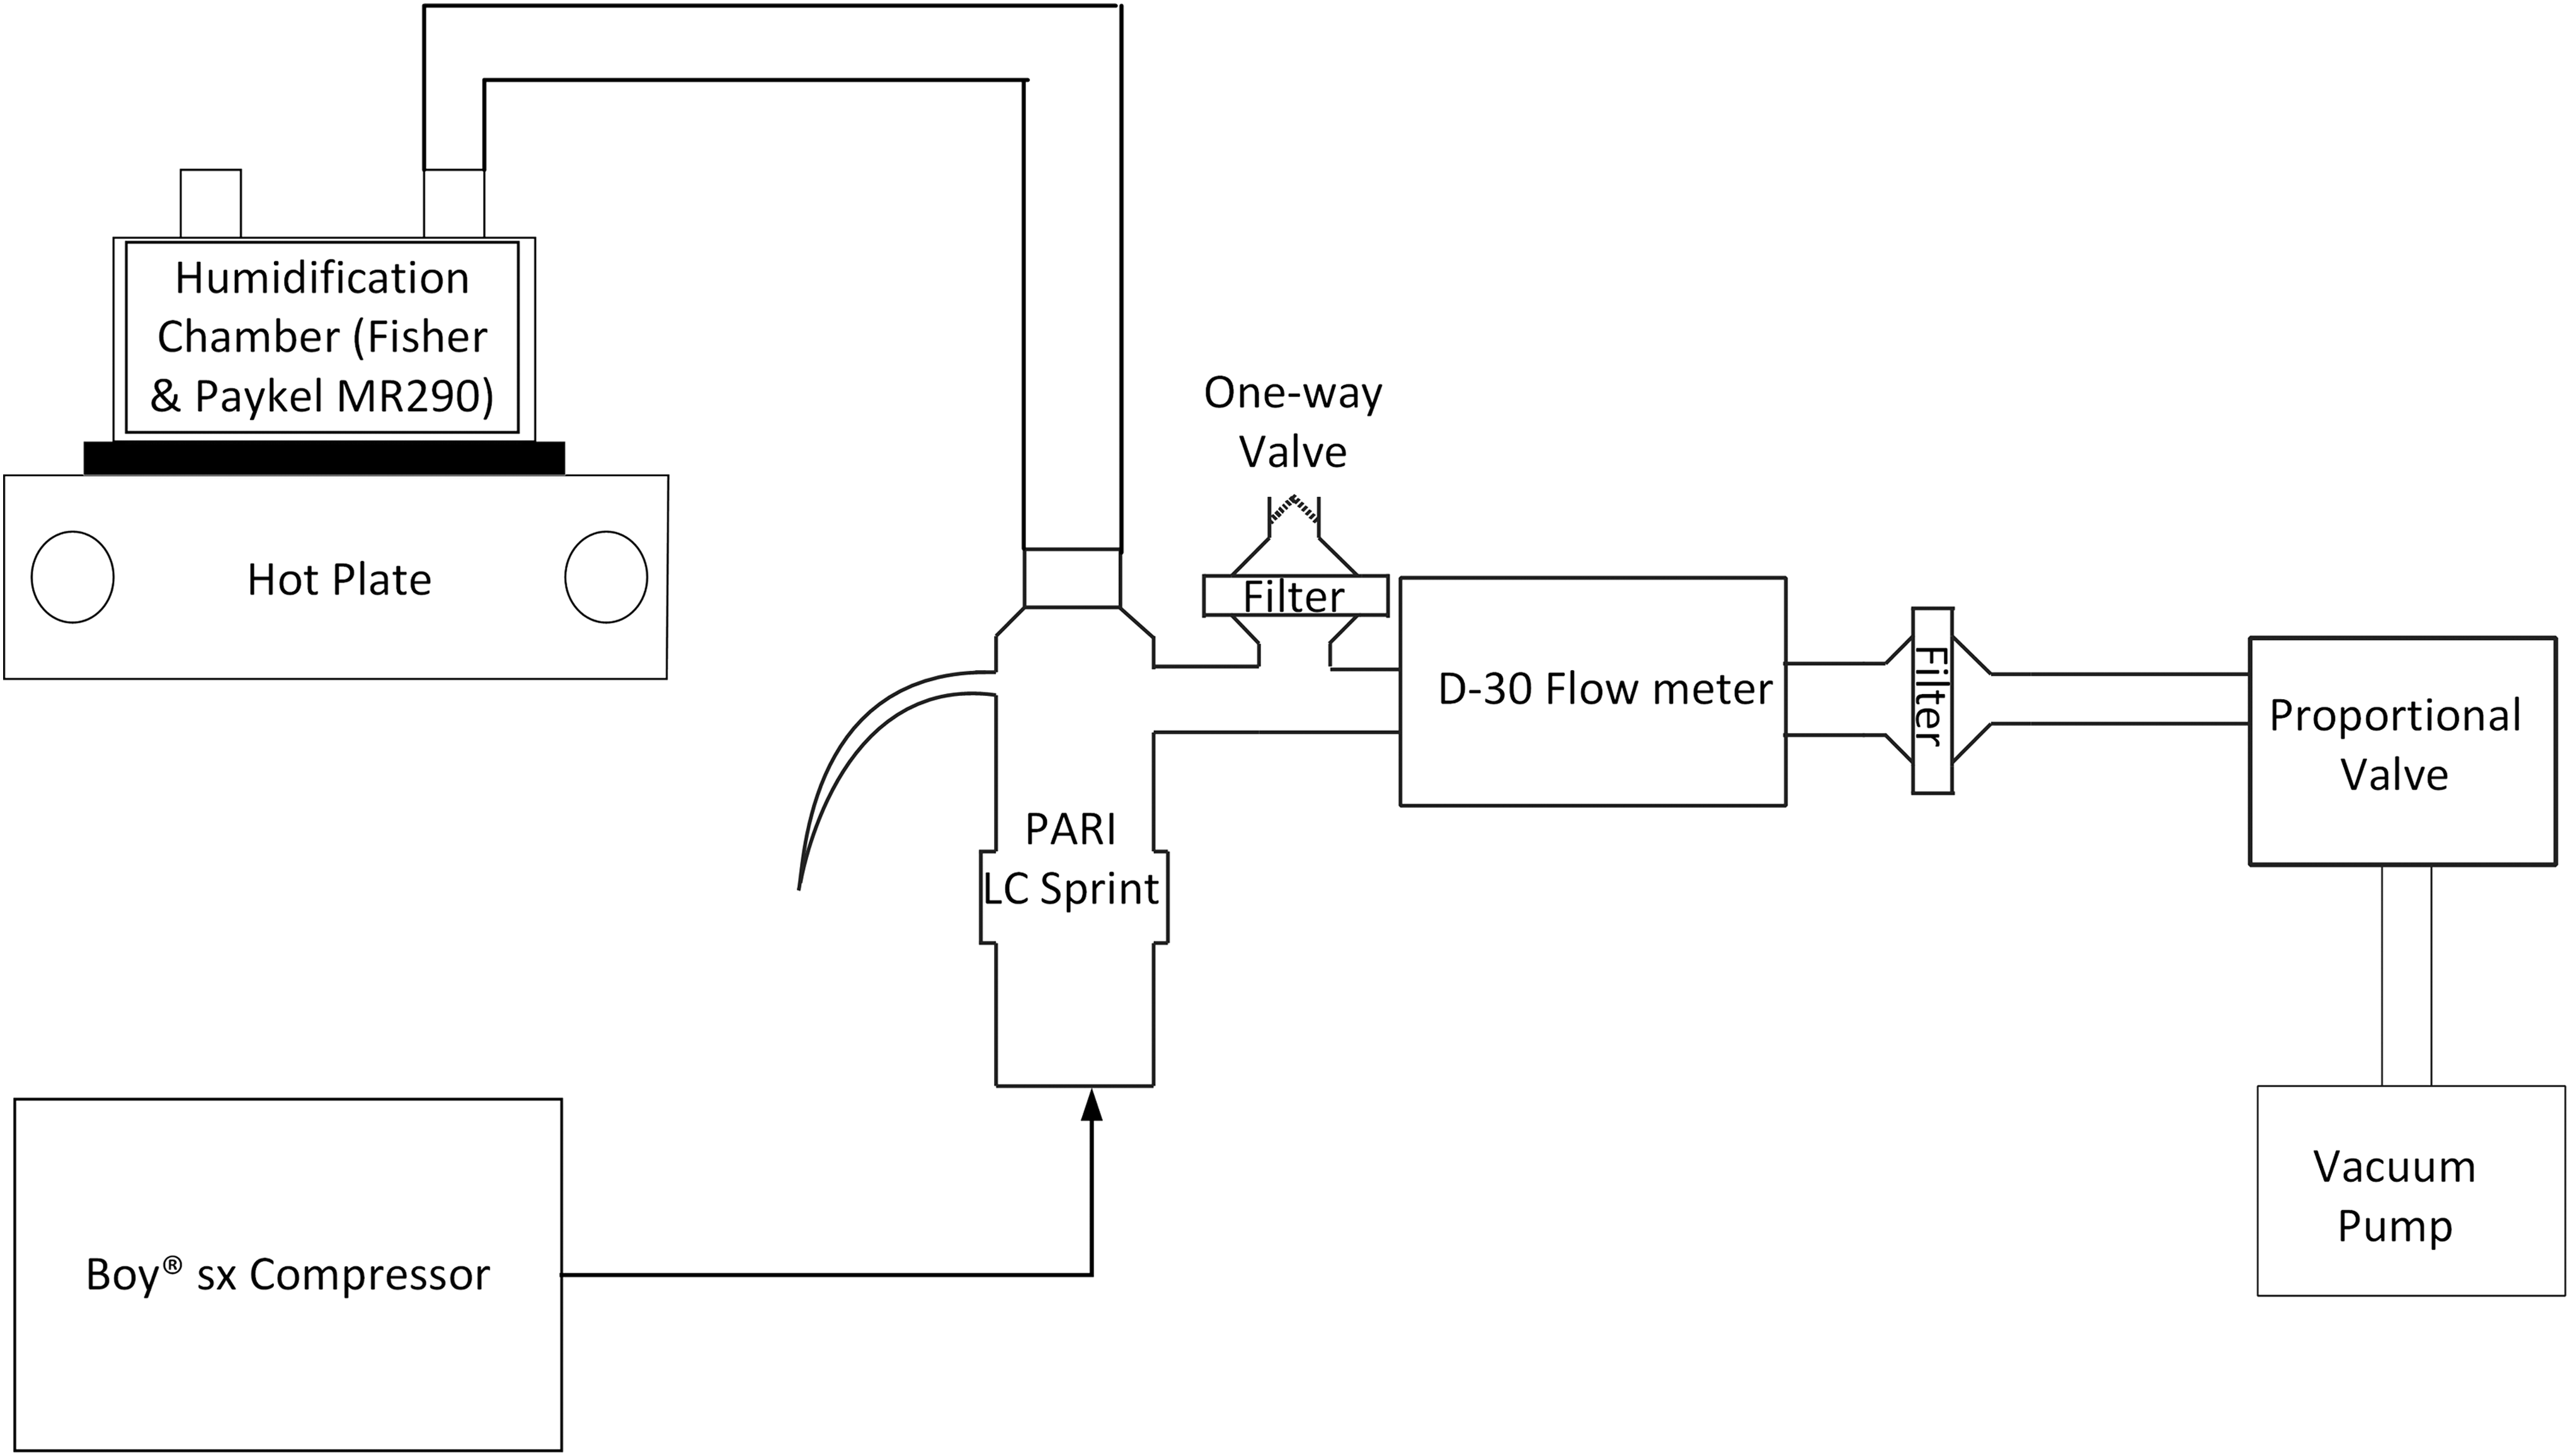
Setup i for determining the effect of nebulized aerosol on the flow rate measurement from the D-30 ultrasonic flow meter. A vacuum pump was used to generate a constant flow rate, which was controlled by a proportional valve.
Assessing the performance of the duckbill valve
A duckbill valve located inside a plastic housing (MHC 71006MA; Teleflex Medical Australia, Sydney, NSW, Australia) was attached to a Positive End Expiratory Pressure flow diverter with the exhalation port of the flow diverter blocked. To investigate the effect of the inlet diameter of the duckbill valve housing on particle size distributions, the original inlet diameter of the duckbill valve housing (0.56 cm) was expanded to 1 cm by a drill press, allowing for examination of particle size distributions obtained with both the original and large housing inlet sizes using setup ii c (Fig. 2). Particle size distributions were also measured at slow (10 L/min) and fast (72 L/min) inhalation flow rates using setups ii a–c (Fig. 2) to determine if the duckbill valve and connecting components significantly altered aerosol sizes in a flow rate-dependent manner.
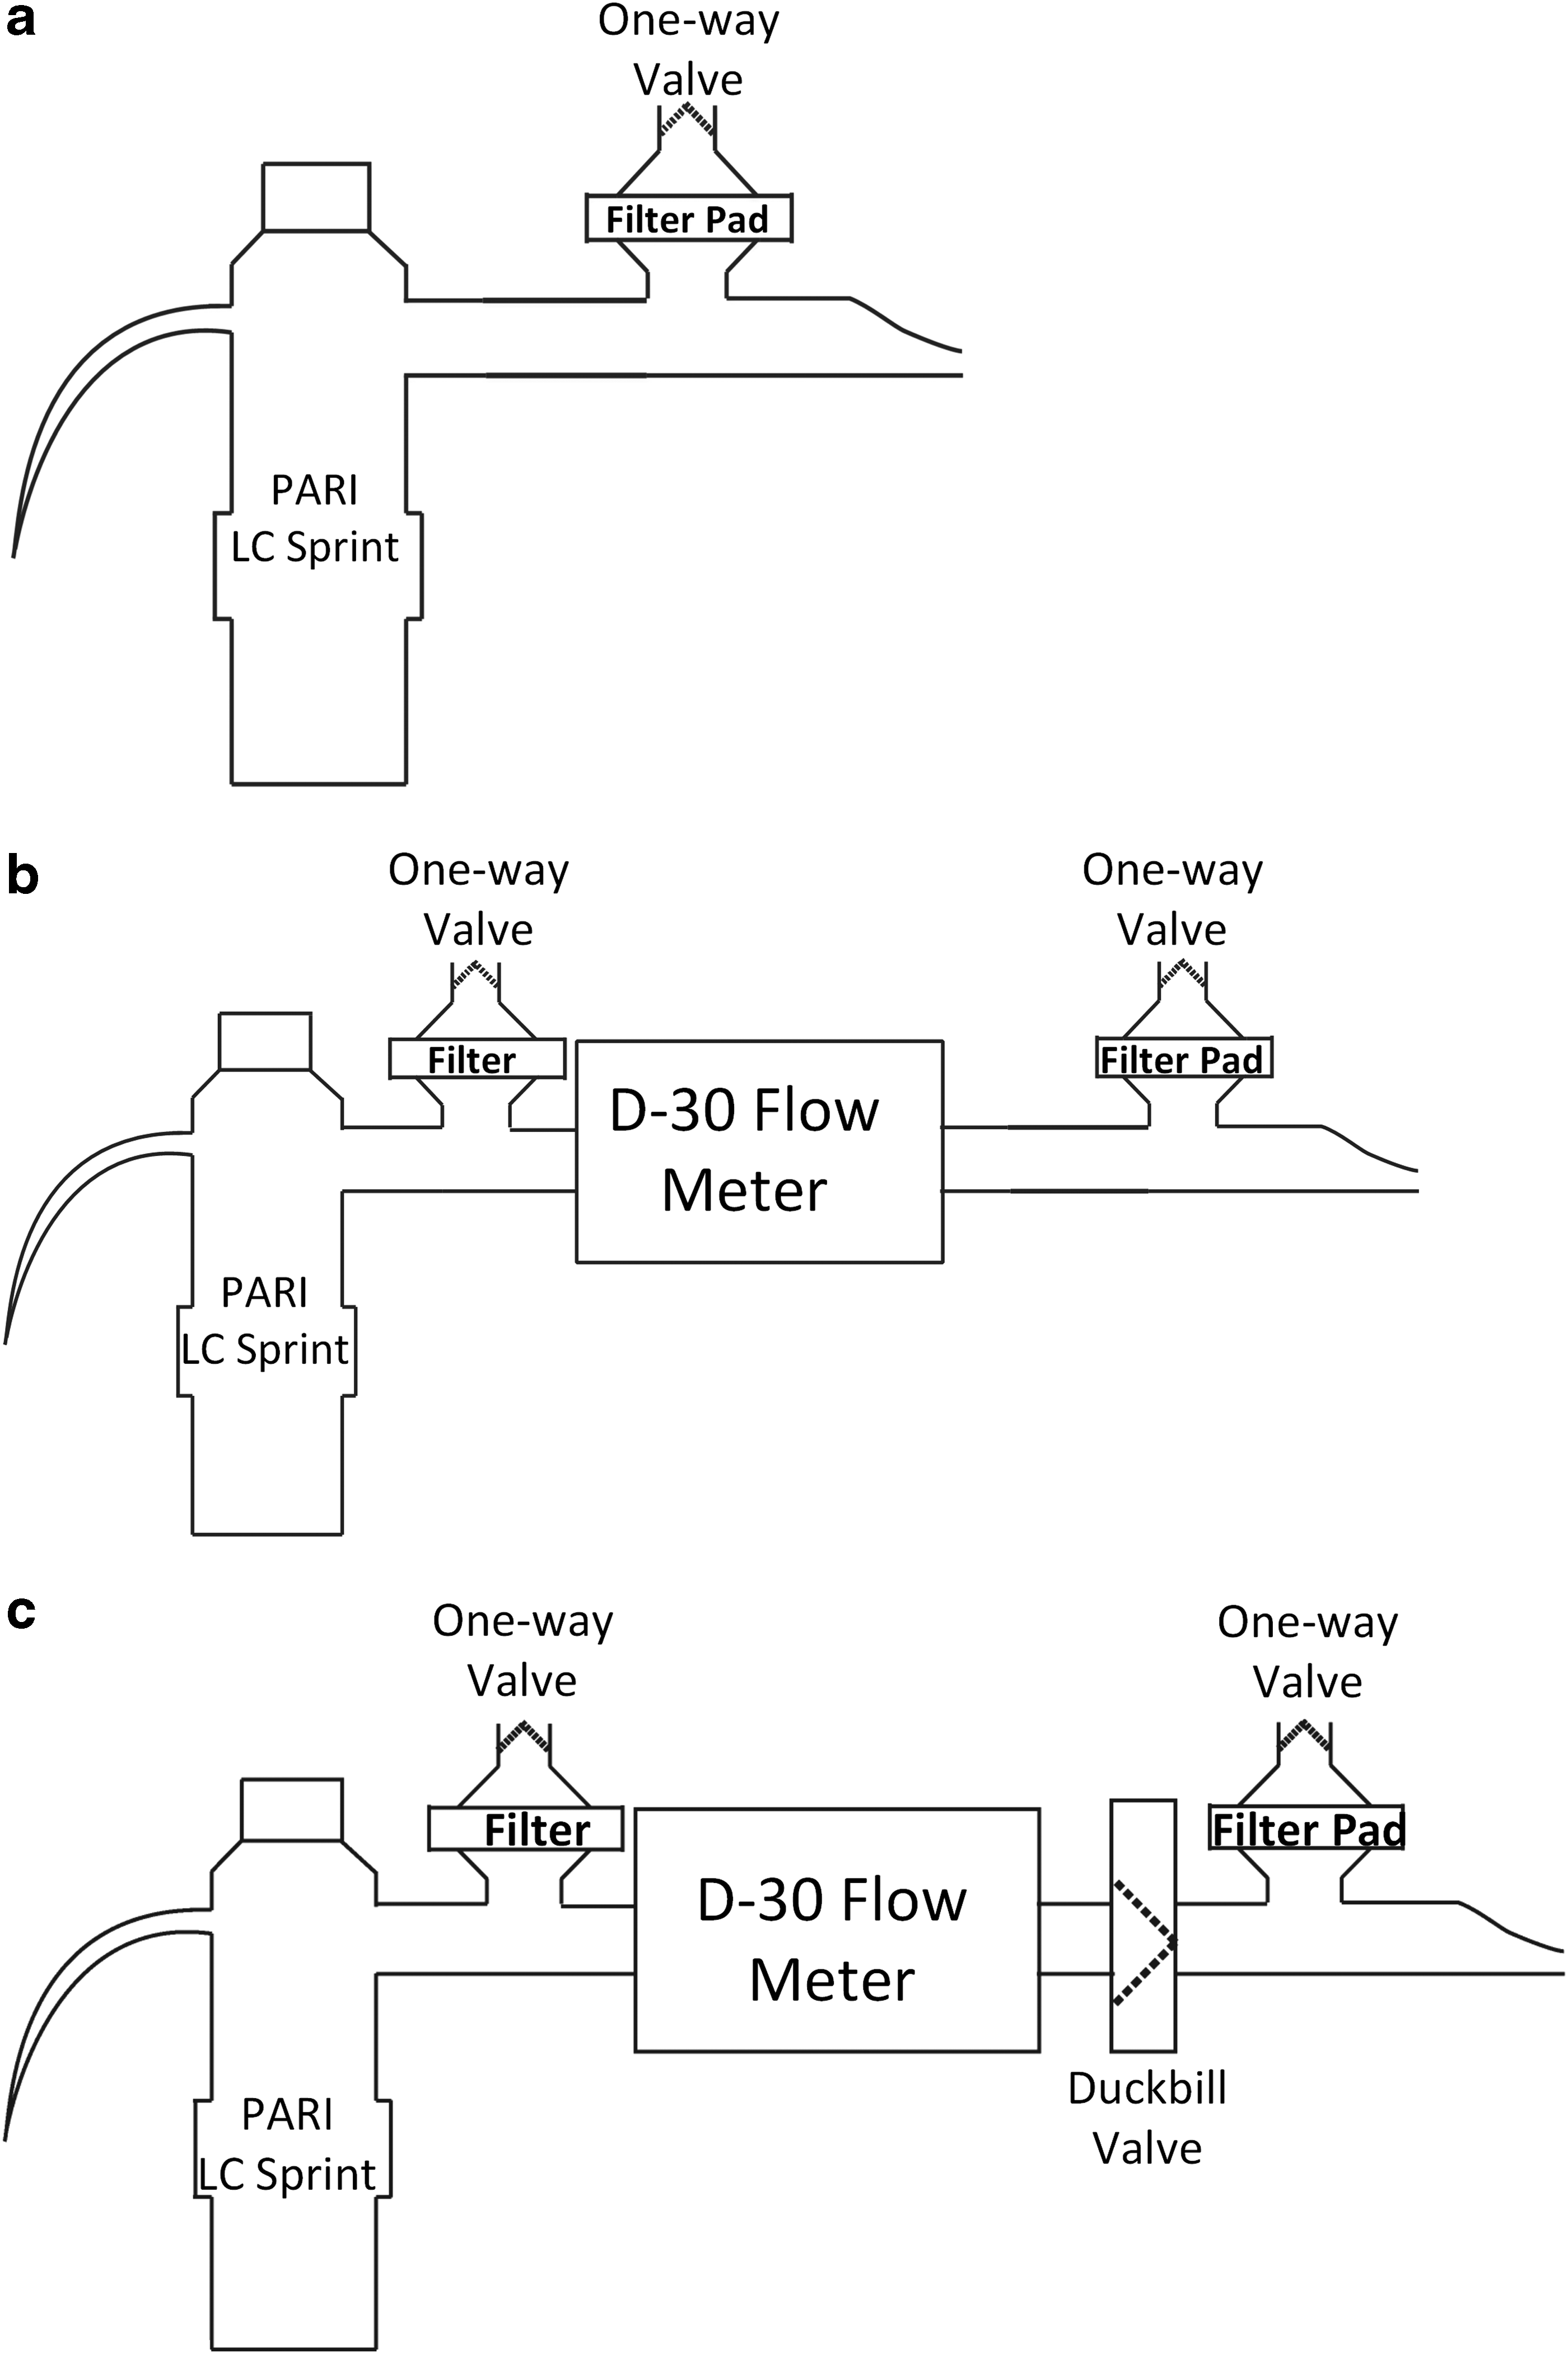
Setup ii a–c for determining particle size measurements of nebulized 0.9% saline aerosols delivered by LC Sprint nebulizers. Setup ii a, baseline particle size measurement using just the nebulizer. Setup ii b, particle size measurements incorporating a D-30 flow meter. Setup ii c, particle size measurements incorporating a Teleflex duckbill valve inside a plastic housing and a Positive End Expiratory Pressure valve diverter.
Assessing the accuracy of inhalation flow profile measured by the Thor D-30
Setup iii (Fig. 3) was used to examine the accuracy of the measured inhalation flow profile using a D-30 flow meter (labeled flow meter 1) placed before a duckbill valve by comparison to simultaneous measurements from a second D-30 (flow meter 2) placed downstream of the duckbill valve and proximal to a subject breathing naturally. During inhalation, the duckbill valve opens, allowing nebulized aerosol to be inhaled by a subject. During exhalation, positive pressure generated downstream of the duckbill valve causes it to close, thereby preventing nebulized aerosol from reaching the subject. Nonzero flow rates measured by flow meter 1 during the exhalation phase of a given breathing pattern therefore indicated either break-through leakage in the duckbill valve or recirculation of aerosol emitted by the nebulizer within the housing of the flow meter itself.
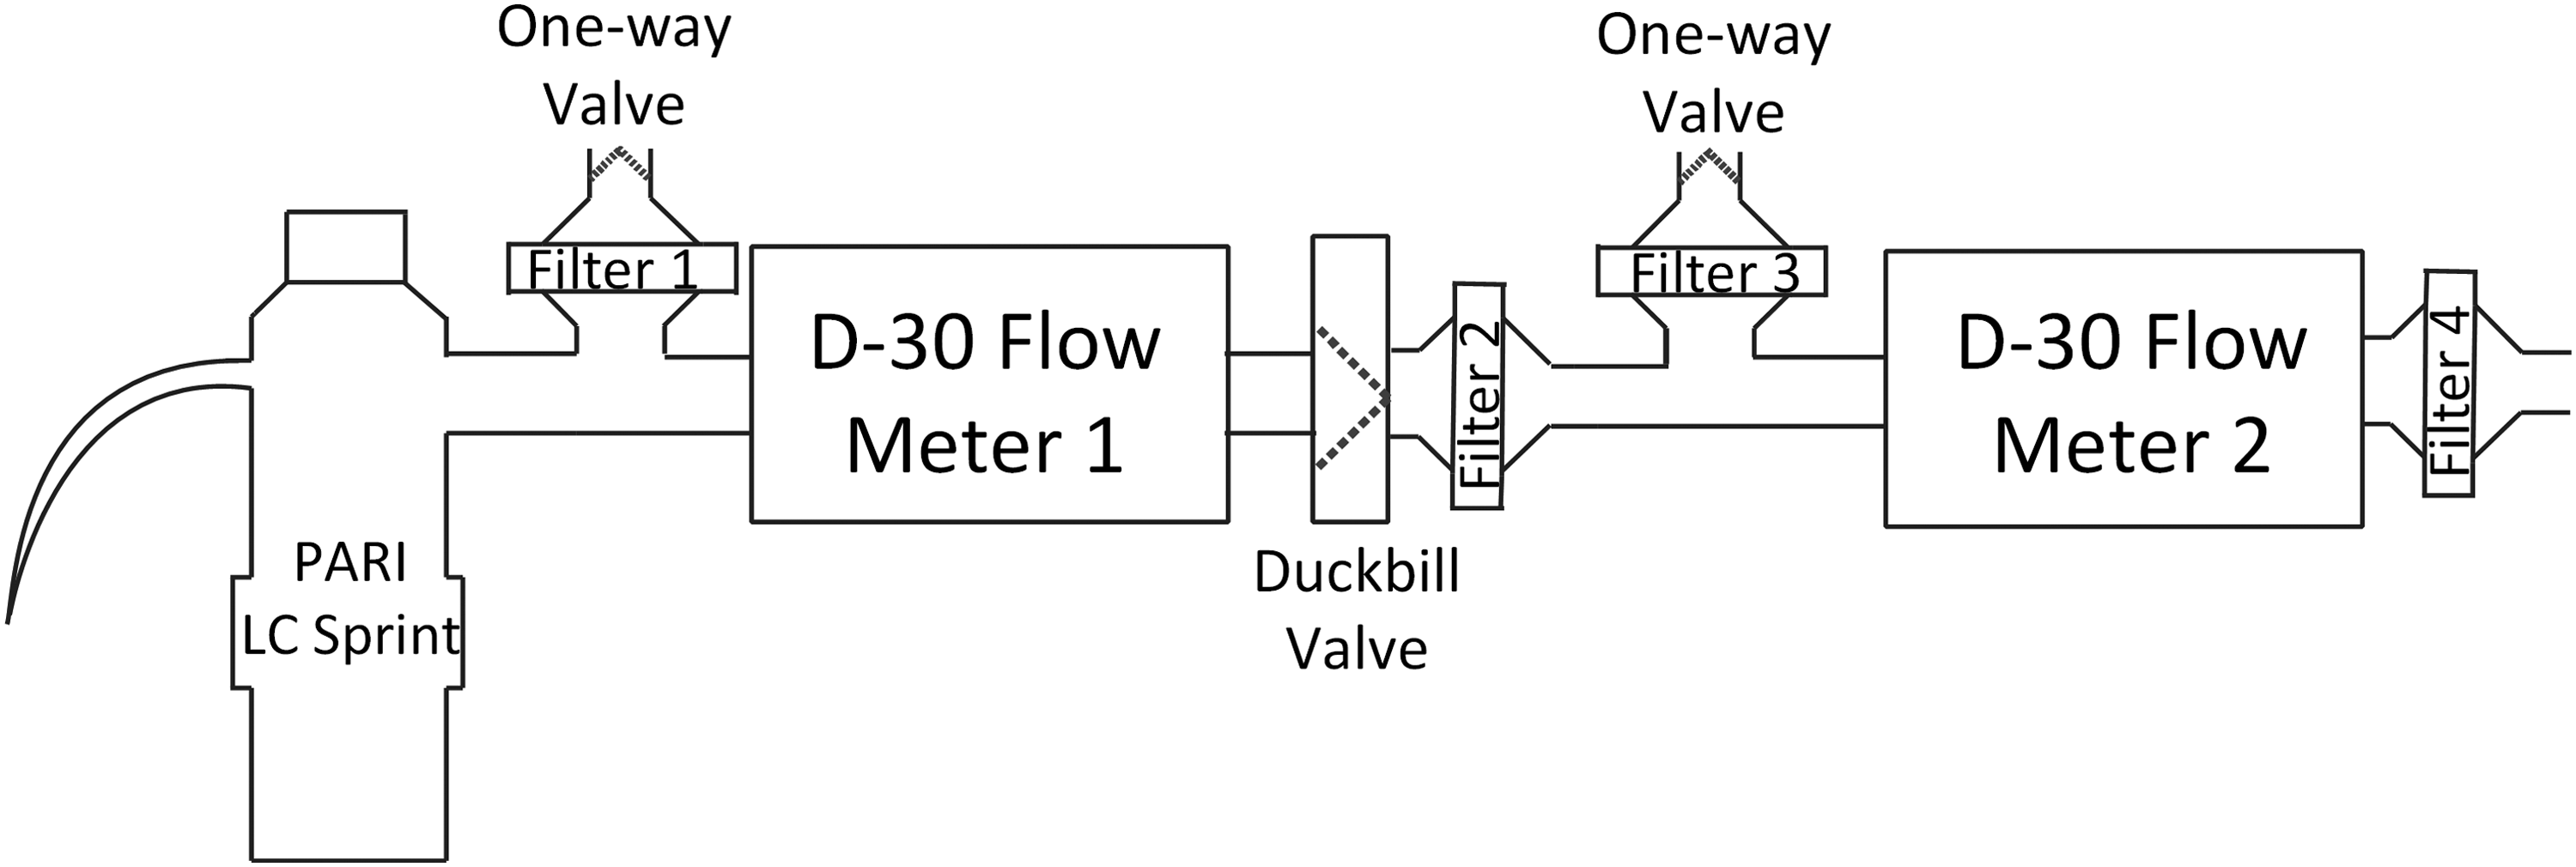
Setup iii for assessing the accuracy of inhalation flow rate measured by a D-30 flow meter located upstream of a duckbill valve. The duckbill valve aimed to allow only one-way airflow across flow meter 1. The subject inhaled tidally from Filter 4.
Filter 1 (Sureguard; Bird Healthcare, Melbourne, VIC, Australia) captured the nebulized aerosol emitted during subject exhalation when the duckbill valve remains closed, while exhaled air from the subject would normally be captured in Filter 3 in vivo. In this altered setup, additional filters, Filters 2 and 4, were placed immediately downstream of the duckbill valve and between the subject and flow meter 2 to prevent the aerosols from being inhaled. Using this setup, flow meter 2 nominally measured the entire breathing pattern from the subject, including inhalations and exhalations. All measurements were repeated in triplicate.
Calculation of average inhalation parameters
Aerosol administration using nebulizers typically requires several inhalations for a full dose to be delivered to a subject. Intrasubject variability between separate inhalations can demonstrate considerable differences in tidal volumes, durations of inhalations, and average inhalation flow rates. Rather than presenting data on each individual breath, it is perhaps more useful to have accurate measures of the average values of inhalation parameters over the course of an entire administration. With intrasubject variability among separate inhalations in mind, one method for calculating average parameters involves a time-weighted averaging of breath-specific parameter values xi (which can represent tidal volumes, average inhalation flow rates, etc., of a single inhalation), calculated as:
Here, ti is the duration of inhalation of each breath i, ttotal is the total duration of inhalations during aerosol administration, and xtotal is the overall average of parameter x.
Statistical analysis
Two-way analysis of variance (Prism GraphPad) was used to compare flow rates measured with setup iii. Results are expressed as mean and standard deviation unless specified otherwise. p-Value <0.05 was considered to be statistically significant. Median noise filtration was performed in R Studio.
Results and Discussion
Effect of nebulized aerosols on flow rate measurement accuracy: setup i
As seen in Figure 4, the presence of nebulized 0.9% saline aerosols from the PARI LC Sprint did not significantly affect the accuracy of flow rate measurements obtained using the Thor D-30. For baseline flow rates of 10.4, 67.2, and 91.4 L/min measured without nebulized aerosol, the respective changes in mean flow rate when the nebulized aerosol was introduced through the flow meter were 0.0, −0.6, and −1.7 L/min. These results indicate that acoustic modulations induced by the presence of an aerosol is not of concern under the conditions examined in this study.

Box plot on the effect of nebulized aerosols on flow rate measurements from a Thor D-30 flow meter obtained using setup i. Whiskers indicate minimal and maximum flow rates.
Effect of the flow meter and duckbill valve on the aerosol particle size distribution: setup ii
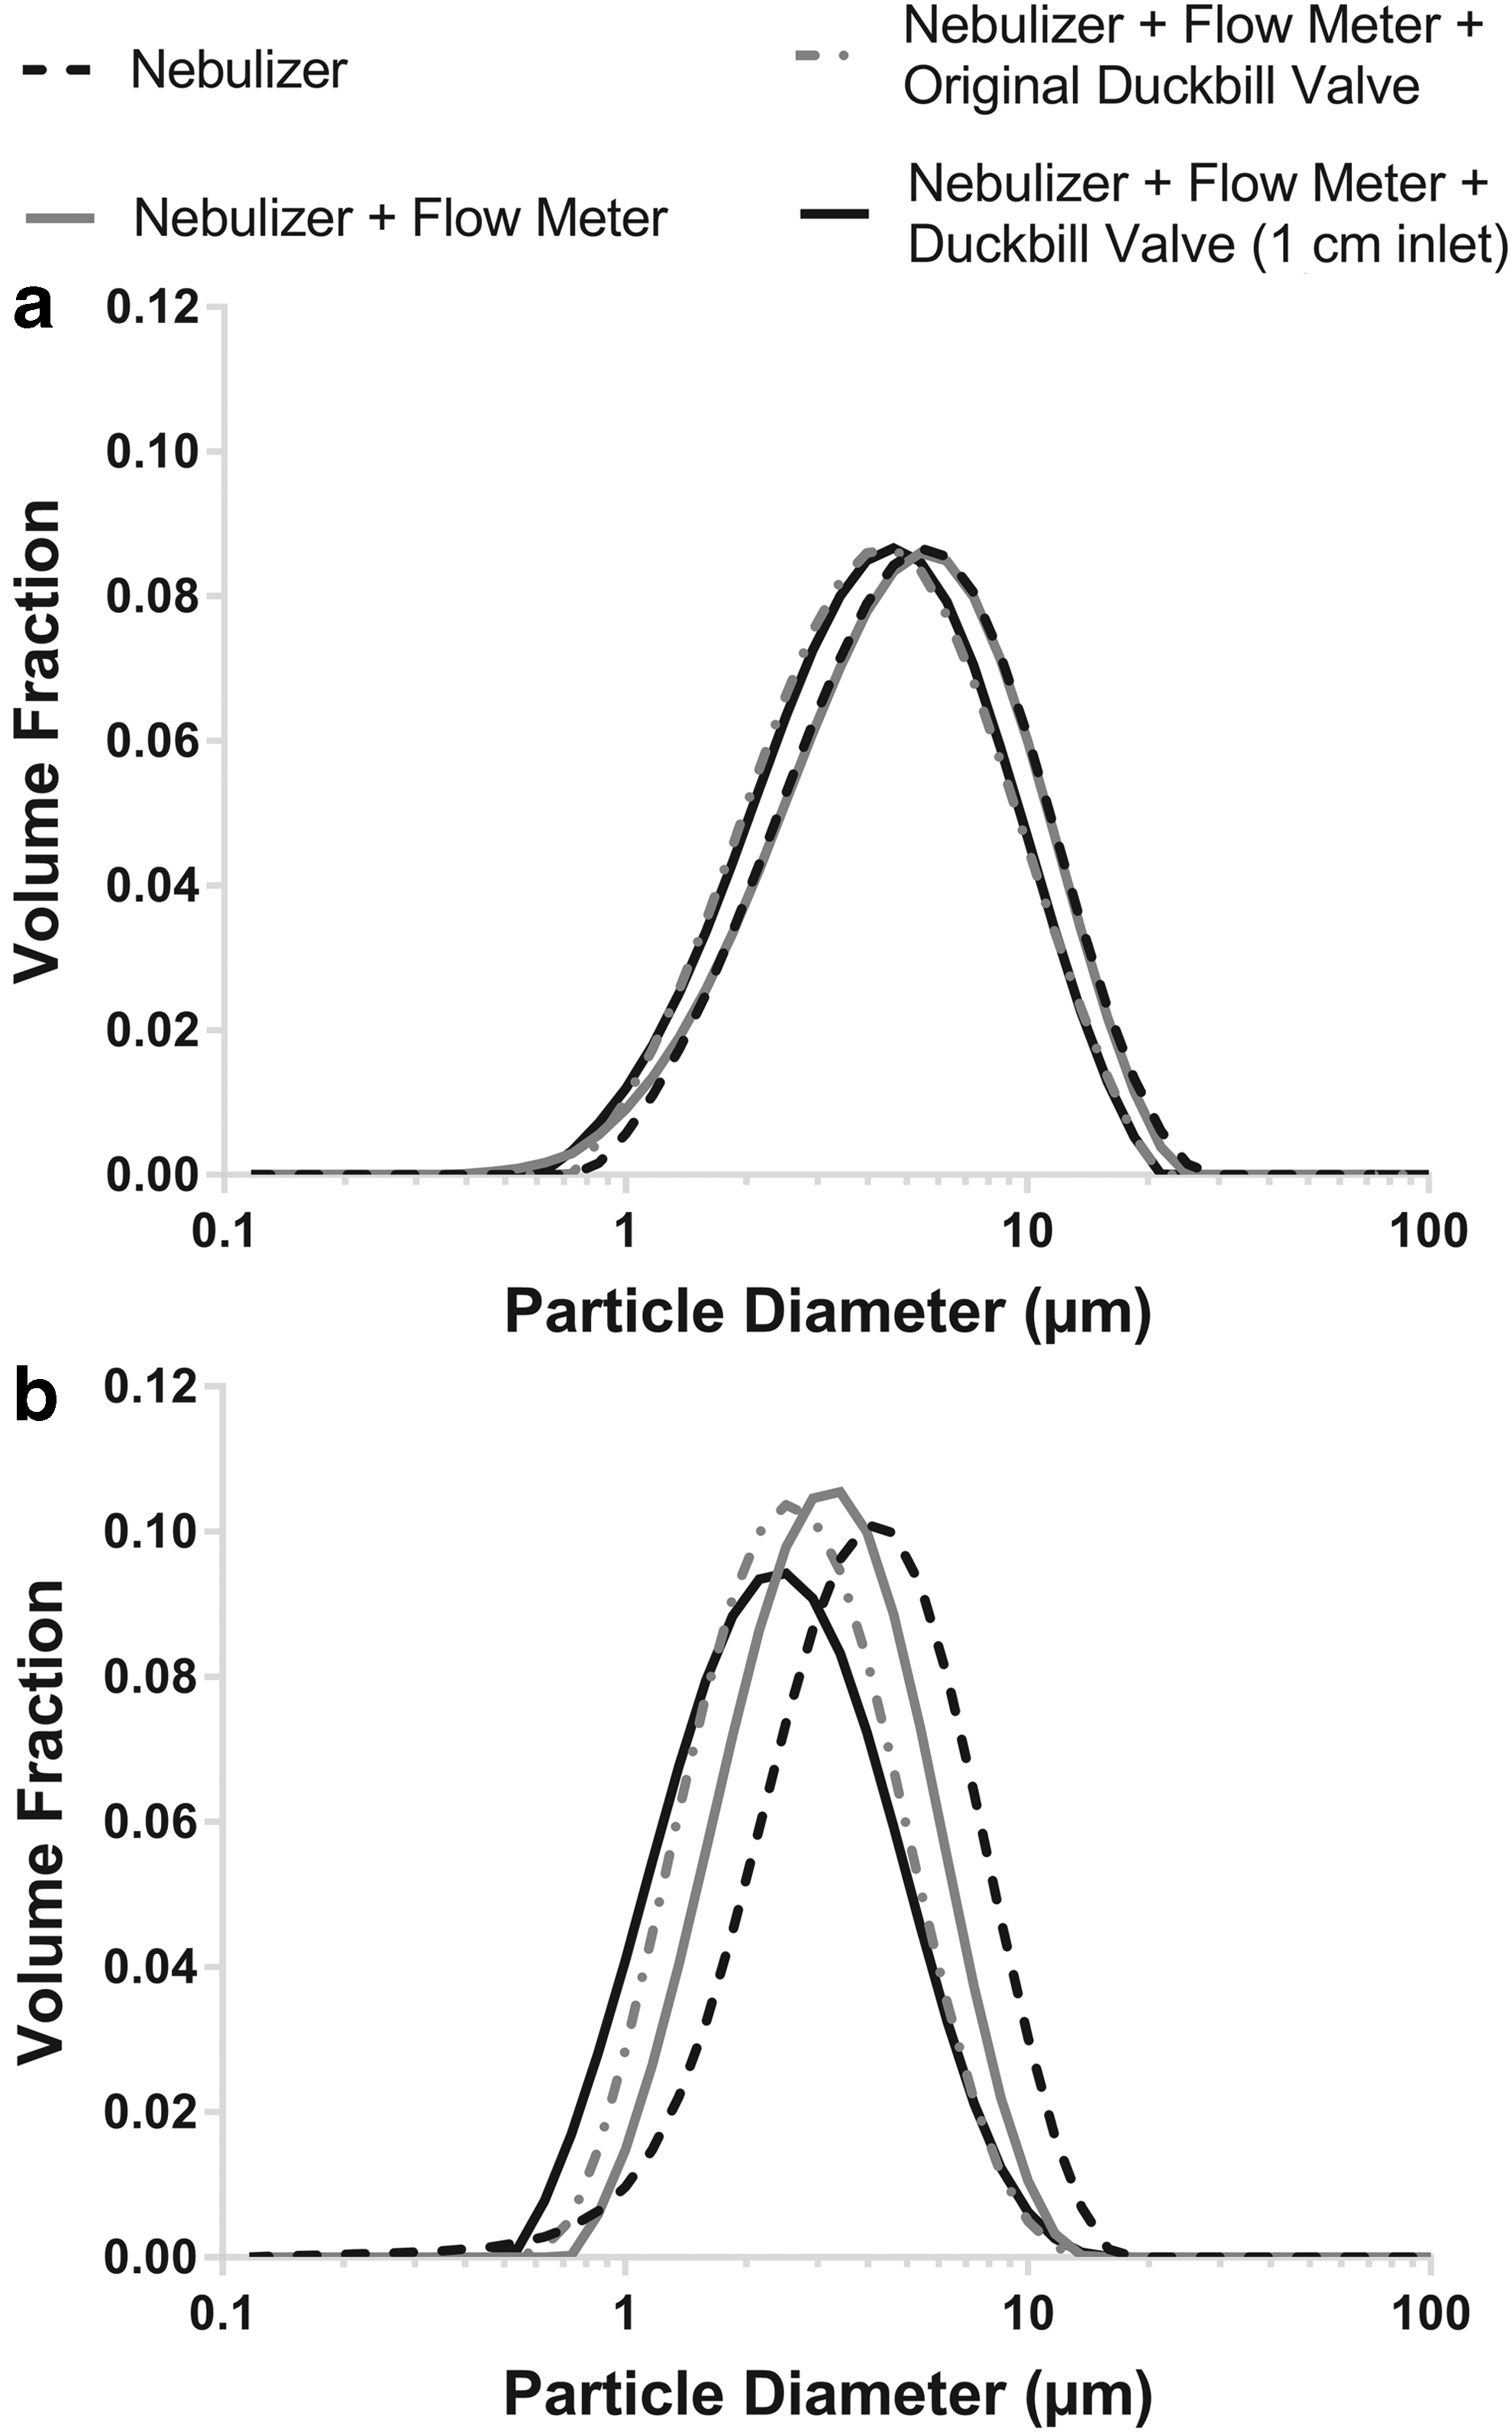
As shown in Figure 5, the Thor D-30 flow meter did not appear to alter particle size distributions of nebulized saline 0.9% aerosols significantly. The mean volumetric median diameters (VMDs) and geometric standard deviations (GSDs) measured with and without the D-30 in place in setup ii showed no noticeable difference at low flow rates of 10 L/min and a slight reduction at high flow rates of 72 L/min (Table 1). This suggests that an ultrasonic flow meter like the D-30 provides a simple method for measuring inhalation flow rates of nebulized aerosols without notably affecting particle size distributions, a key requirement for monitoring in vivo inhalation patterns in regional lung deposition studies of polydisperse aerosols.(4,7)
Mean particle size distribution (n = 3) of nebulized 0.9% saline aerosols with various components connected to the nebulizer as specified in setup ii, sampled at
GSD, geometric standard deviation; SD, standard deviation; VMD, volumetric median diameter.
The addition of the duckbill valve to the D-30 described in setup ii b and c caused inevitable interference to the aerosols flow path, causing the aerosol to deposit onto the valve. This was supported by both the laser transmission data and direct radioassay. The mean ± standard deviation laser transmission percentage of the nebulized aerosols at 10 L/min constant sampling flow rate was 62.6% ± 5.7% (without duckbill valve), 90.3% ± 1.6% (with original duckbill valve), and 78.6% ± 3.1% (with 1 cm inlet duckbill valve); the corresponding values for the 72 L/min constant sampling flow rate were 56.9 ± 3.2%, 91.2 ± 1.6%, and 74.7 ± 4.1%.
We did not assay the aerosol deposition on the valve for this study, but we managed to evaluate the valve deposition fraction from data obtained in another study conducted by our group where we employed the setup ii c (Fig. 2) to look at airway deposition of aerosols containing 99mTc-DTPA in 0.9% saline. Radioassay results from that study showed that for 14 human subjects investigated, the mean ± standard error valve deposition was 13.4% ± 1% of the total amount that entered the valve.
Despite the aerosol loss on the duckbill valve, VMD of nebulized saline 0.9% aerosol (Fig. 5) did not significantly change at low and high flow rates; at 10 L/min a 0.65 μm reduction in VMD was observed (4.65 μm without the duckbill valve, 4.00 μm with the duckbill valve attached), while at 72 L/min, the difference in VMD was 0.69 μm (2.23 μm VMD without the duckbill valve, 2.92 μm VMD with the duckbill valve attached). The air inlet size of the Teleflex duckbill valve housing was initially suspected to affect the aerosol particle size distribution. However, this was only evident at 10 L/min aerosol flow rate where the VMD was 4.00 μm for the normal duckbill valve housing inlet (0.69 cm inlet diameter) verses 3.63 μm for the 1 cm valve housing inlet diameter (0.37 μm difference in VMD between the two inlet sizes).
This difference in VMD became significantly smaller at 72 L/min with the normal duckbill valve housing inlet yielding VMD of 2.23 versus 2.34 μm with the larger inlet size (0.11 μm difference in VMD between the two inlet sizes). The cause of the small shift in VMD after adding a duckbill valve to the D-30 is likely due to the change in air flow behavior induced by the duckbill valve geometry. Despite the minor reduction in VMD caused by the duckbill valve, the overall mean GSD of the particle size distributions was not significantly changed at both low and high flow rates (Table 1). The addition of the duckbill valve after the ultrasonic flow meter can certainly be useful in isolating the exhaled aerosol dose that is critical in certain in vivo aerosol deposition study applications, and an improvement in valve design can further minimize aerosol interaction with the valve.
Effect of the flow meter and duckbill valve on the measurement of real inhalations: setup iii
Figure 6 shows the effectiveness of the duckbill valve in allowing only inhalation through the ultrasonic nebulizer. The placement of a duckbill valve downstream of the D-30 flow meter was posited to prevent the mixing of nebulized aerosol with any exhaled particles from the subject and thereby allowing for the isolation of the exhaled dose. Based on the flow profile measure by flow meter 1 in setup iii, the valve operated as expected by closing securely during expiration. Previous in vivo deposition studies using nebulizers have not separated exhaled aerosols from uninhaled nebulized aerosols during exhalation, potentially leading to an overestimation of the exhaled dose.(20–22) In this work, the duckbill valve was placed in between the Thor D-30 flow meter and the exhalation filter T-piece, minimizing the dead-space volumes and allowing for better isolation of the exhaled dose.
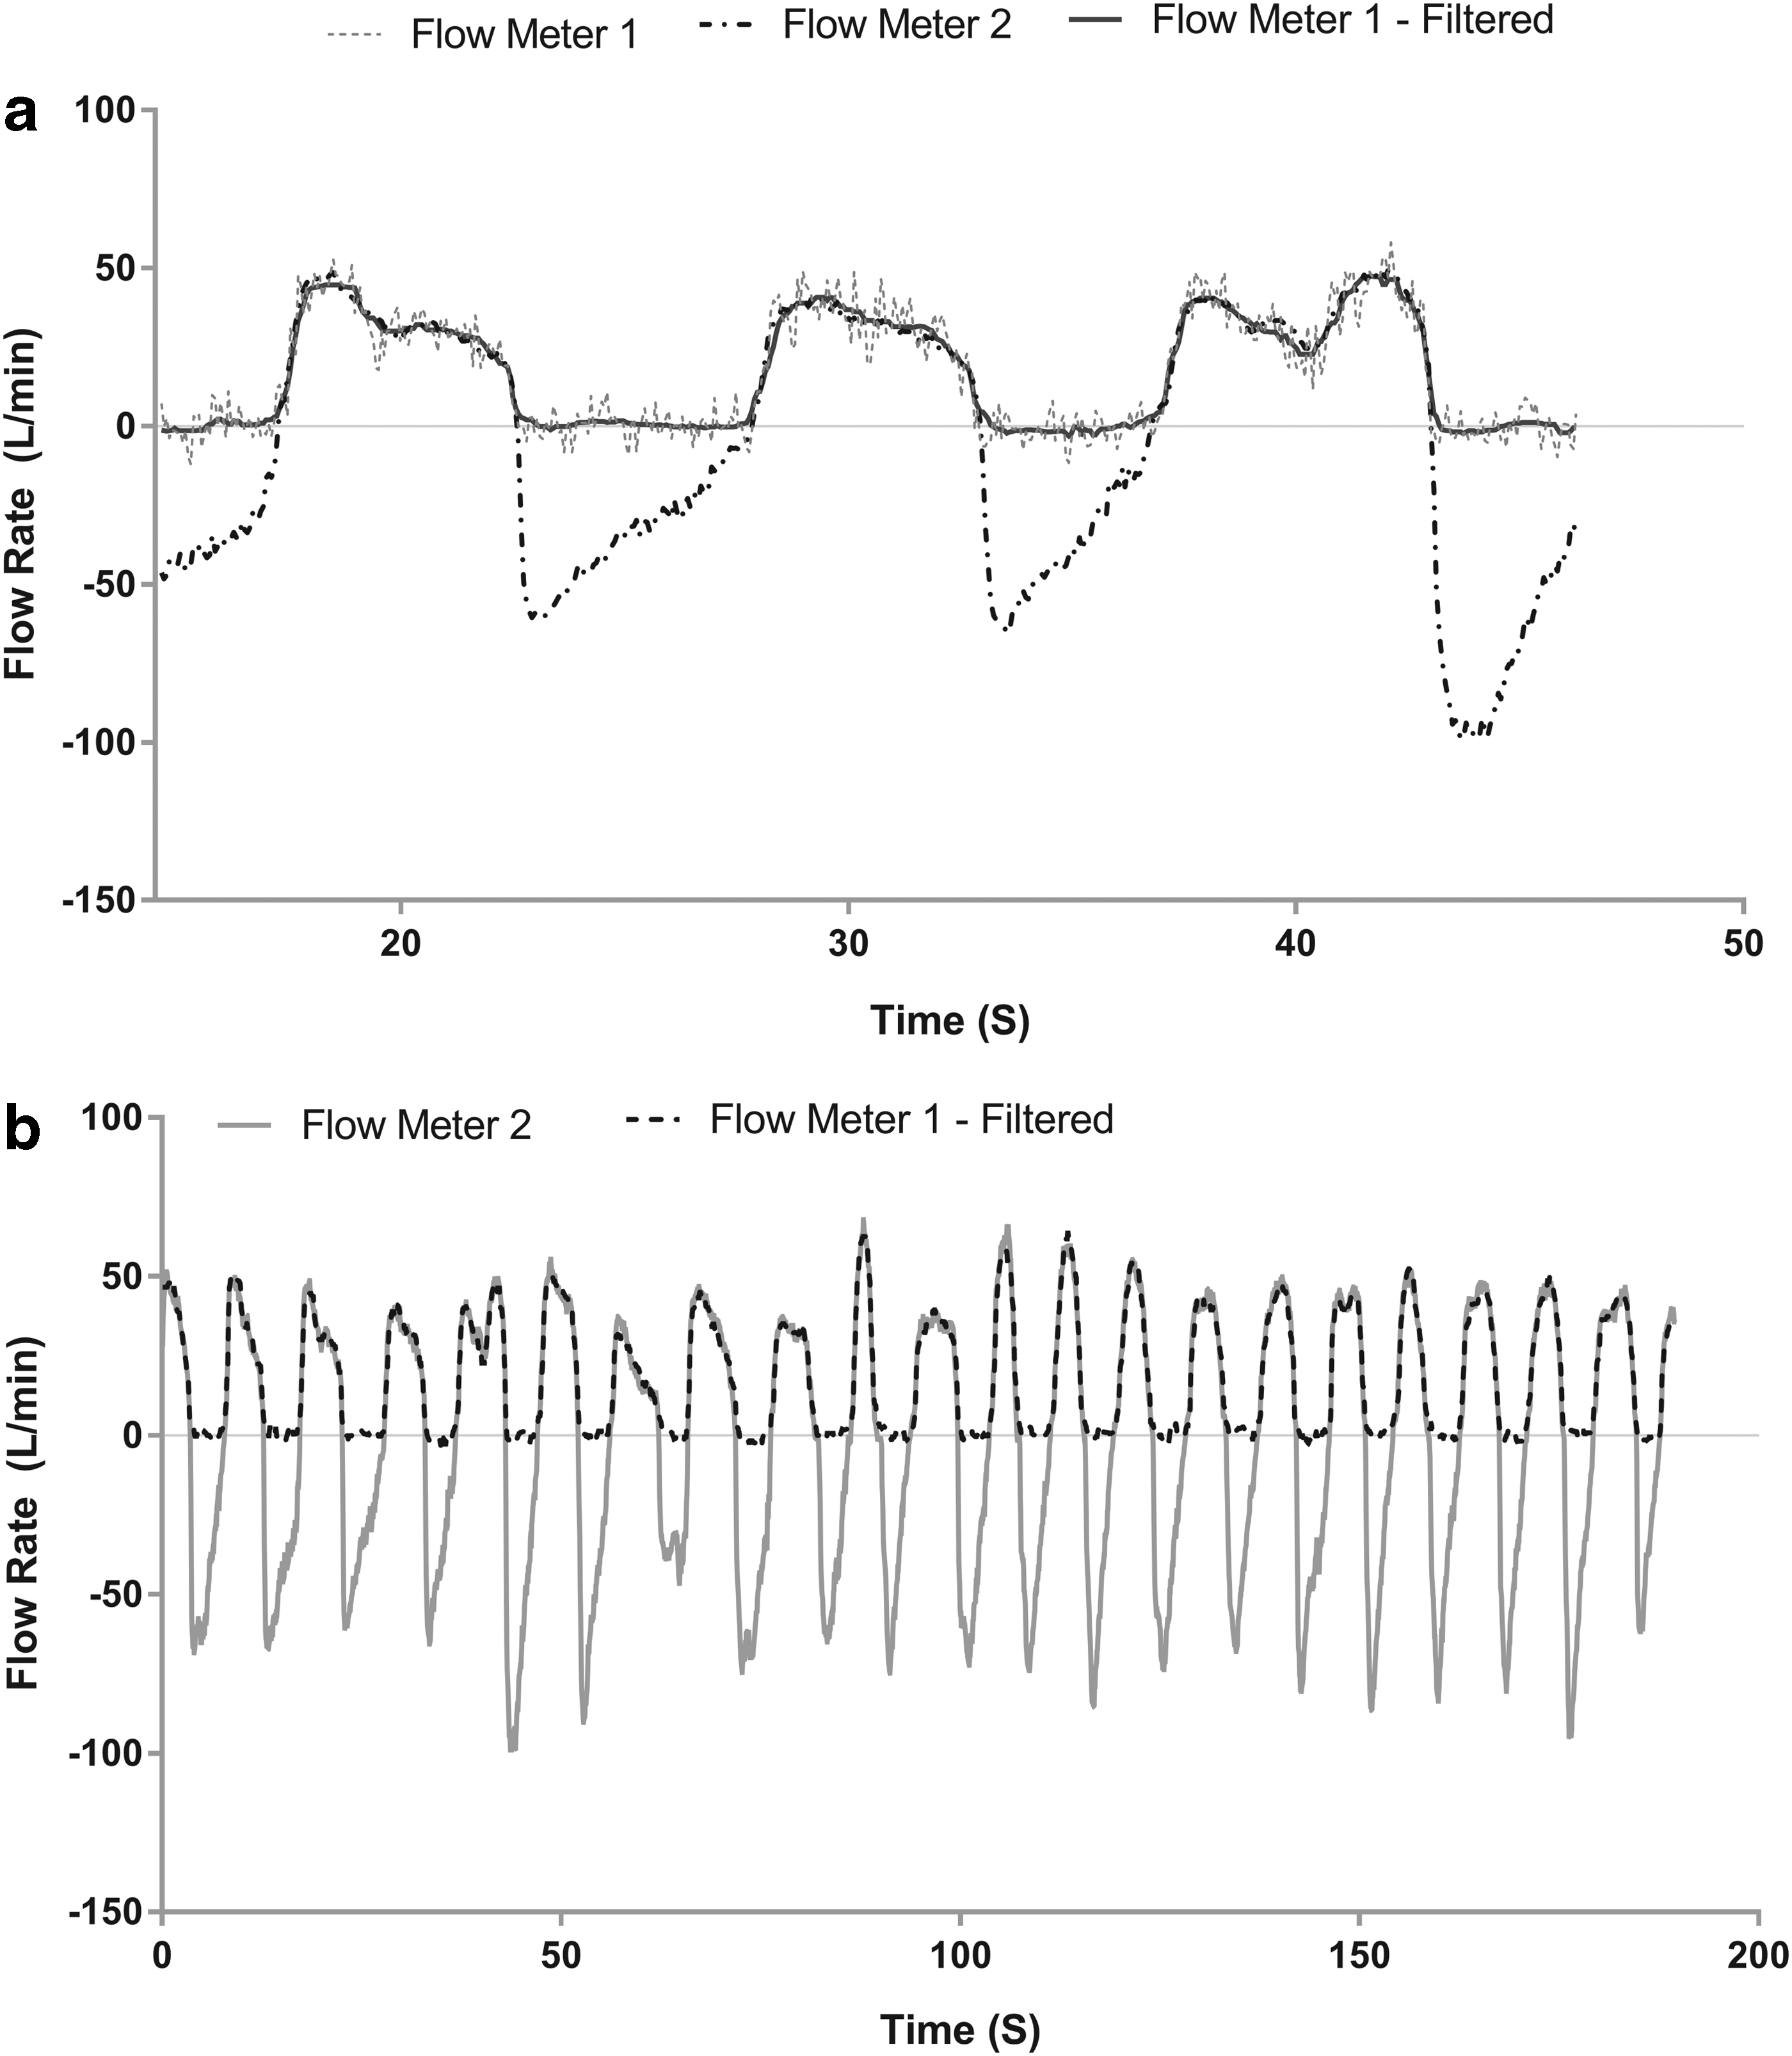
Simultaneous measurements of a subjects' breathing pattern from two D-30 flow meters using setup iii. Flow meter 1, located upstream of the duckbill valve, measured only inhalations. Flow meter 2, placed downstream of the duckbill valve and upstream of the subject, measured the full breathing pattern.
A considerable amount of signal noise was noted between inhalations (Fig. 6a), with notable deviations from the nominal 0 L/min that may be caused by either leakage through the valve, recirculation of nebulized aerosol within the housing of the flow meter itself before being diverted into Filter 1, or the pulsatile nature of the 5 L/min baseline nebulizer flow generated by the BOY SX compressor. During inhalations, pulsing flow from the compressor-driven nebulizer and transient flow behavior may have been sources of the observed noise in the flow rate signal. Application of a median noise filter across each inhalation appeared to resolve these issues and allowed for easier interpretation of the flow profile, while closely mirroring the inhalation profile measured with flow meter 2 (Fig. 6b).
Together with the results obtained using setup ii, these findings support the inclusion of a duckbill valve downstream of the ultrasonic flow meter to separate nebulized aerosols from exhaled particles, thereby yielding a more accurate estimate of the exhaled dose without altering particle size distributions during administration.
During the beginning and end of inhalations, inhalation profiles from flow meter 1 become difficult to interpret. Noise between inhalations and the dynamic nature of the duckbill valve, which requires a finite time to open and close, cause some deviation between the flow rate measured using flow meter 1 and the full profile recorded by flow meter 2, as shown in Figure 7.
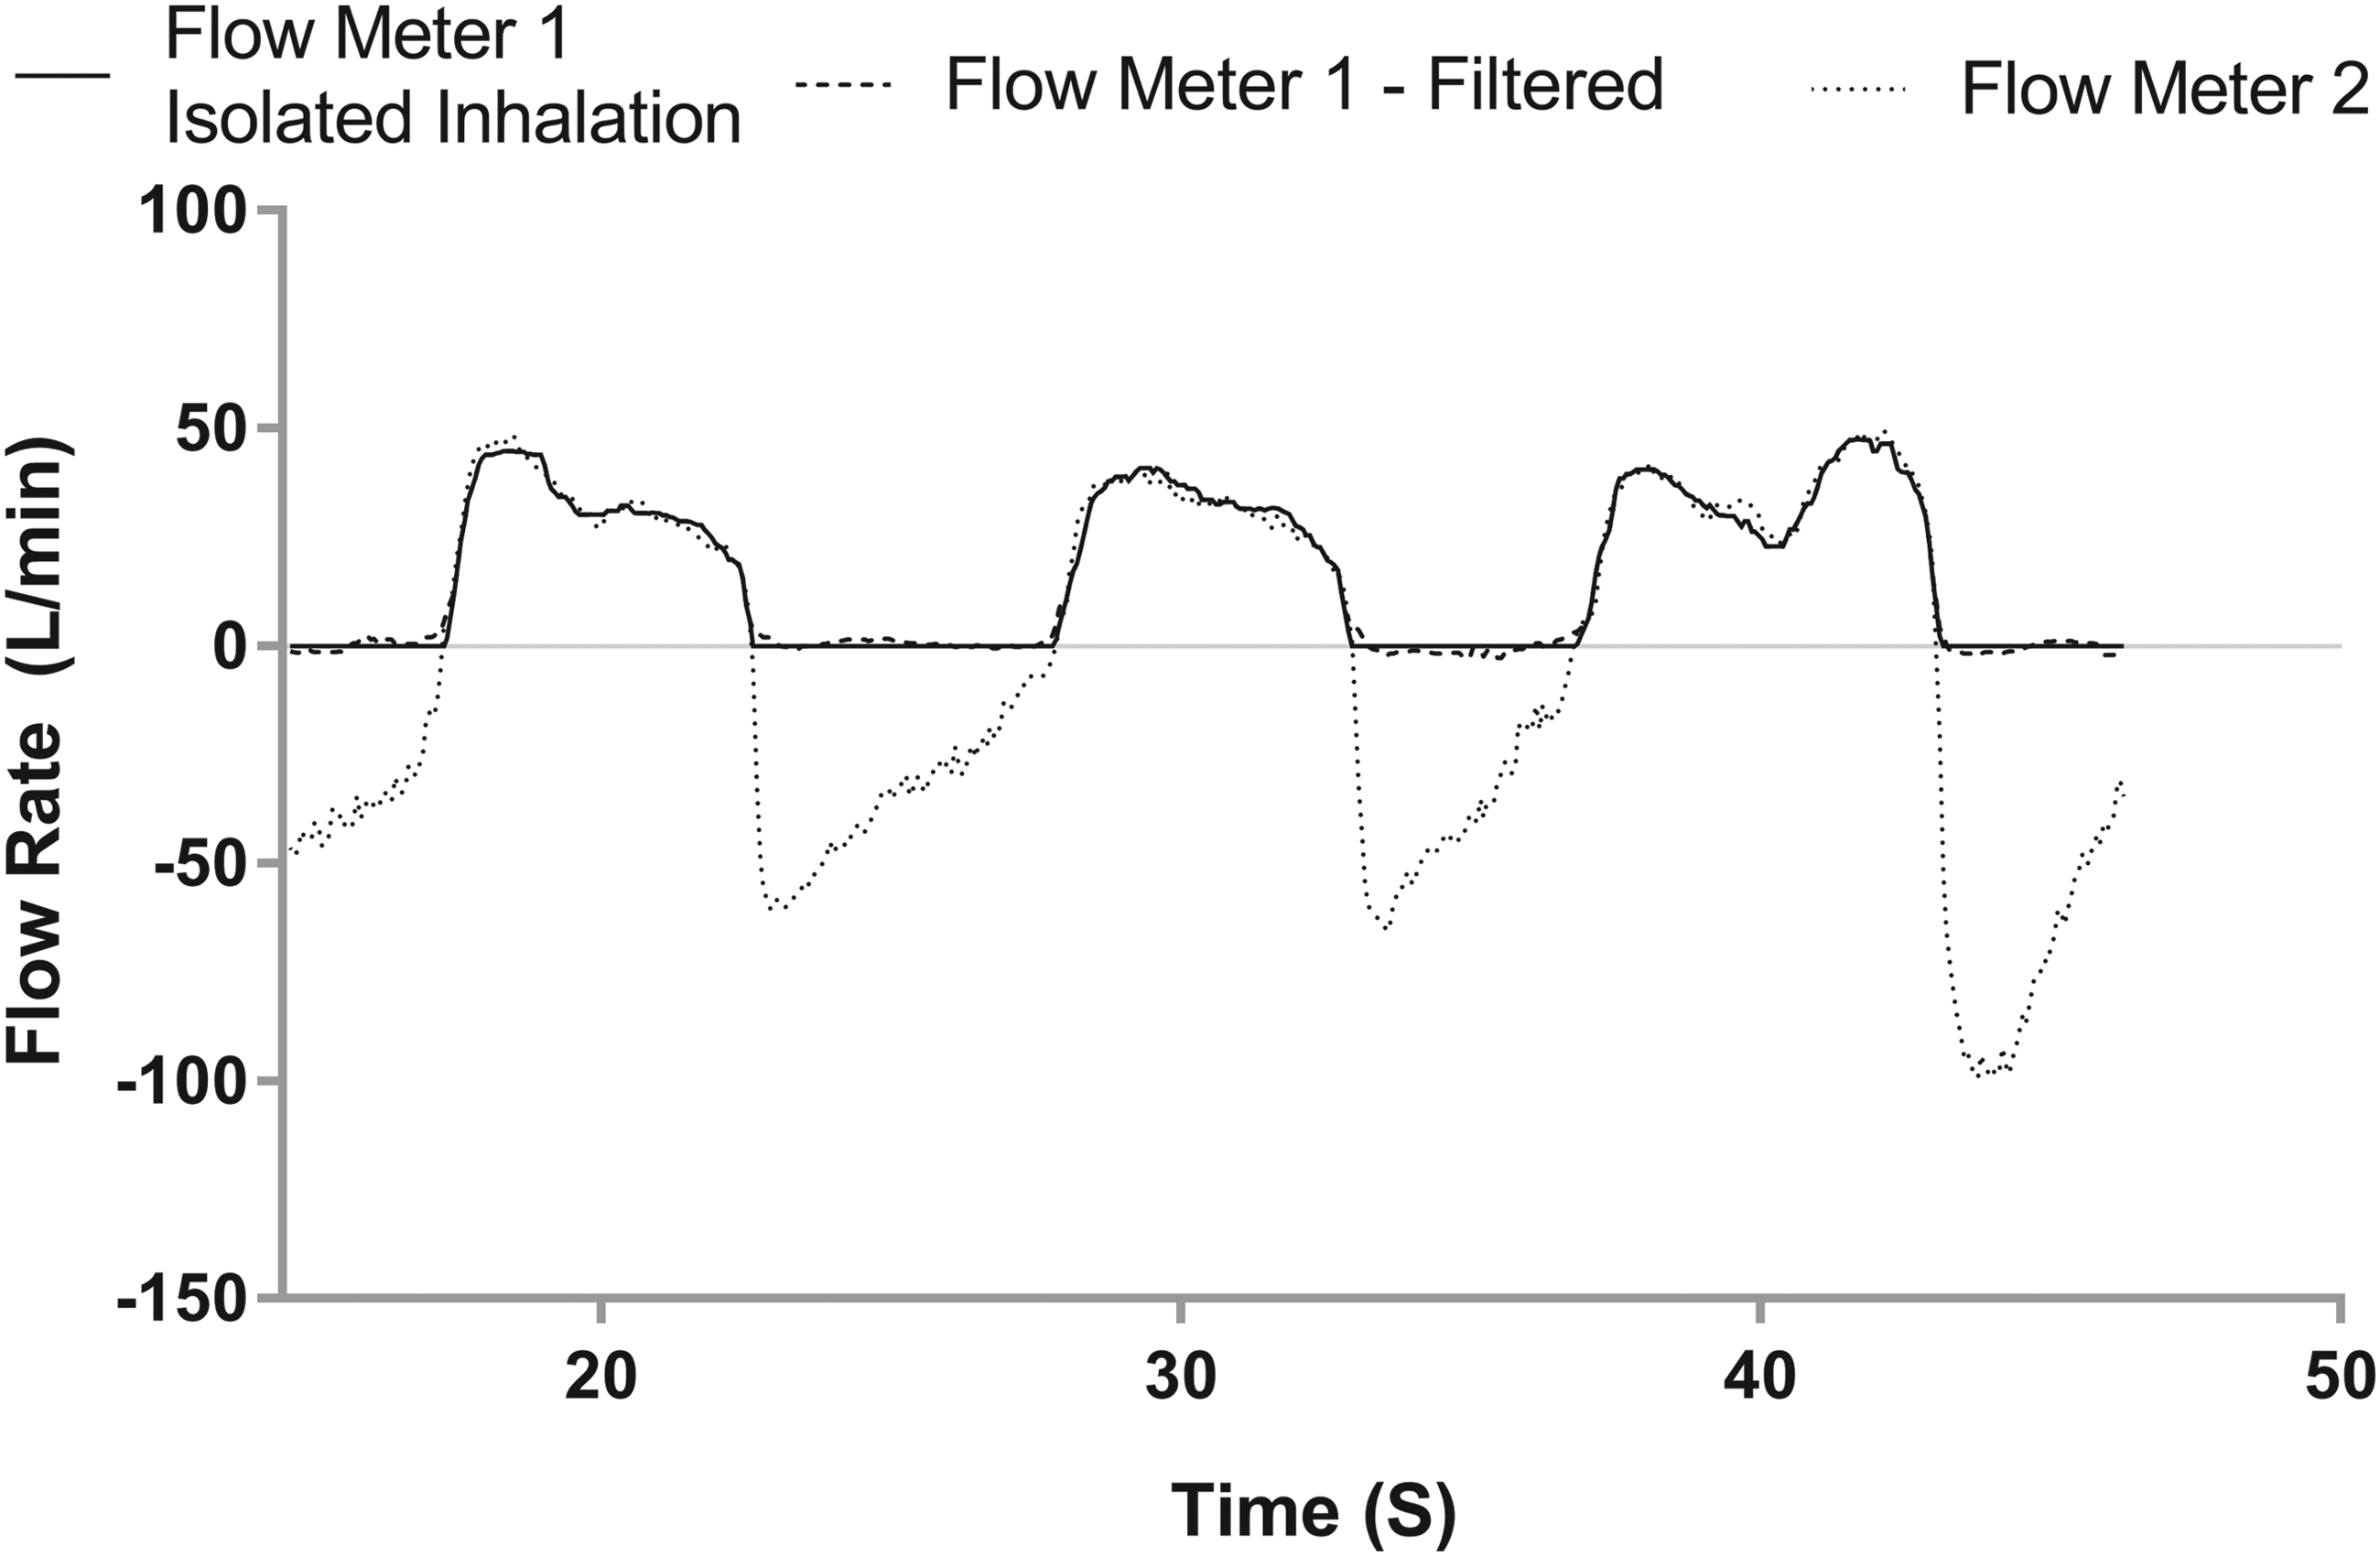
Zoomed-in view of a portion of the inhalation profile in Figure 6, incorporating isolated inhalations and median filtering of the signal measured by flow meter 1.
For the calculation of breathing parameters such as the tidal volume, average inhalation flow rate, and the duration of inhalation, these deviations from ideal measurements should be taken into account in a manner that does not bias parameter estimates toward either high or low values. The simplest method may be to identify the beginning and end of inhalations manually, discard data from periods between inhalations, and linearly extend the truncated beginning and end of the remaining inhalation signals to 0 L/min. An example of the resulting flow profile is shown in Figure 7. Calculations of average inhalation parameters over the entire breathing pattern can then be performed using the time-weighted averaging method. The results of these calculations for the full profile presented in Figure 6b are summarized in Table 2, showing that flow meter 1 is in excellent agreement with flow meter 2 regarding measurements of average inhalation flow rates, inhalation times, and inhalation volumes.
In conclusion, the Thor D-30 ultrasonic flow meter is unaffected by the presence of aerosol and does not itself alter the aerosol, during measurements of breath profiles for subjects inhaling nebulized aerosols, thereby providing a new method for measuring inhalation parameters in a direct manner in vivo without significantly affecting particle size distributions of inhaled aerosols. Inclusion of one-way duckbill valves did not significantly alter the measured aerosol size distributions, so future in vivo deposition studies of nebulized aerosols in conjunction with ultrasonic flow meters may further allow for improved isolation of exhaled doses without affecting particle size distributions.
Footnotes
Acknowledgments
The authors acknowledge The University of Sydney for their scientific and technical assistance. H.-K.C. is also grateful to Mr. Richard Stenlake for his generous financial support through a donation to the University. M.Y.Y. would like to thank George Ferenczi from Thor for providing the Thor D-30 technical specifications.
Author Disclosure Statement
No competing financial interests exist.