
Abstract
Abstract
Background:
The dose and aerodynamic particle size distribution (APSD) of drug aerosols' exiting models of the mouth and throat (MT) during a realistic inhalation profile (IP) may be estimated in vitro and designated Total Lung Dose, TLD in vitro , and APSDTLDin vitro, respectively. These aerosol characteristics likely define the drug's regional distribution in the lung.
Methods:
A general method was evaluated to enable the simultaneous determination of TLD in vitro and APSDTLDin vitro for budesonide aerosols' exiting small, medium and large VCU-MT models. Following calibration of the modified next generation pharmaceutical impactor (NGI) at 140 L/min, variations in aerosol dose and size exiting MT were determined from Budelin® Novolizer® across the IPs reported by Newman et al., who assessed drug deposition from this inhaler by scintigraphy.
Results:
Values for TLD in vitro from the test inhaler determined by the general method were found to be statistically comparable to those using a filter capture method. Using new stage cutoffs determined by calibration of the modified NGI at 140 L/min, APSDTLDin vitro profiles and mass median aerodynamic diameters at the MT exit (MMADTLDin vitro) were determined as functions of MT geometric size across Newman's IPs. The range of mean values (n ≥ 5) for TLD in vitro and MMADTLDin vitro for this inhaler extended from 6.2 to 103.0 μg (3.1%–51.5% of label claim) and from 1.7 to 3.6 μm, respectively.
Conclusions:
The method enables reliable determination of TLD in vitro and APSDTLDin vitro for aerosols likely to enter the trachea of test subjects in the clinic. By simulating realistic IPs and testing in different MT models, the effects of major variables on TLD in vitro and APSDTLDin vitro may be studied using the general method described in this study.
Introduction
I
Taken overall, the existing test methods may be used to improve the development process for inhalers by enabling the in vitro determination of the range of doses likely to deposit in the human lung, by testing inhalers using representative MT model–IP partnerships to estimate the range of drug doses exiting MT and comparing the likely upper and lower confidence limits for TLD in vitro across different inhalers. While quantifying doses likely to enter the trachea, however, the existing tests fail to characterize the range of aerodynamic particle size distributions (APSDs) leaving MT and it is the APSD of TLD in vitro (APSDTLDin vitro), along with the aerosol flow characteristics, that define the ultimate fate of drug entering the lung.(5,6)
In this article, we describe and evaluate a well-defined general method in which TLD in vitro and APSDTLDin vitro can be determined in a single test. While many aspects of this method were discussed previously by Olsson et al.,(7,8) details, modifications, and results for a designated inhaler across the complete range of likely inhaler-specific IPs have not been disclosed elsewhere; in part, this is because the method and equipment needed to perform the study required modification and calibration before use, especially when simulated IPs were studied with peak inspiratory flow rates (PIFRs) exceeding 100 L/min.
The method is described, illustrated, and compared with results from the clinic and our earlier publications by showing the results for TLD in vitro and APSDTLDin vitro for budesonide aerosols exiting MT from Budelin® Novolizer®, as functions of MT geometric size and the 95% confidence intervals of IPs described by Newman et al.(9) in their gamma scintigraphy study of deposition from a Budelin prototype. In this article, the term “training conditions” (“fast, moderate, and slow inhalation”) is used to describe the IPs reported by Newman et al.(9) that resulted from their efforts to have volunteers “target (different) peak inhalation flow rates.”
Materials and Methods
Budelin Novolizers (label claim 200 μg budesonide) were purchased from MEDA Pharmaceuticals, Hertfordshire, UK. Novolizers were batch 9D019E partnered with drug cartridges (batch 3L068A and 9D019D). Batches were tested within their labeled expiry dates. Primed single doses were withdrawn from inhalers in several randomized cross-over experiments to determine TLD in vitro and APSDTLDin vitro as functions of both IP and MT geometry. Three IP ranges (Fig. 1) that spanned the 95% confidence intervals for each of the training conditions designated in this study as fast, moderate, or slow inhalation, to mimic those of Newman et al. for this inhaler,(9) were simulated using the sinusoidal equations and inhalation parameters in Table 1, as described previously.(4) Those functions were used to program a high-capacity breath simulator (ASL 5000-XL; Ingmar Medical, Pittsburgh, PA, equipped with ASL 5000_SW 3.5 software, which programs the rate and volume of air withdrawn from the exit of MT for each IP) to generate the curves shown in Figure 1. MT geometry was varied in all tests with the test inhaler by using the VCU small, medium, and large models (VCU-MTS, VCU-MTM, and VCU-MTL) shown in Figure 2 with internal geometries defined online.(10) In each MT, the exit was centralized in the male “quickfit connection” to fit the Nephele Mixing Inlet III (NMI; RDD Online,(11) Richmond, VA).
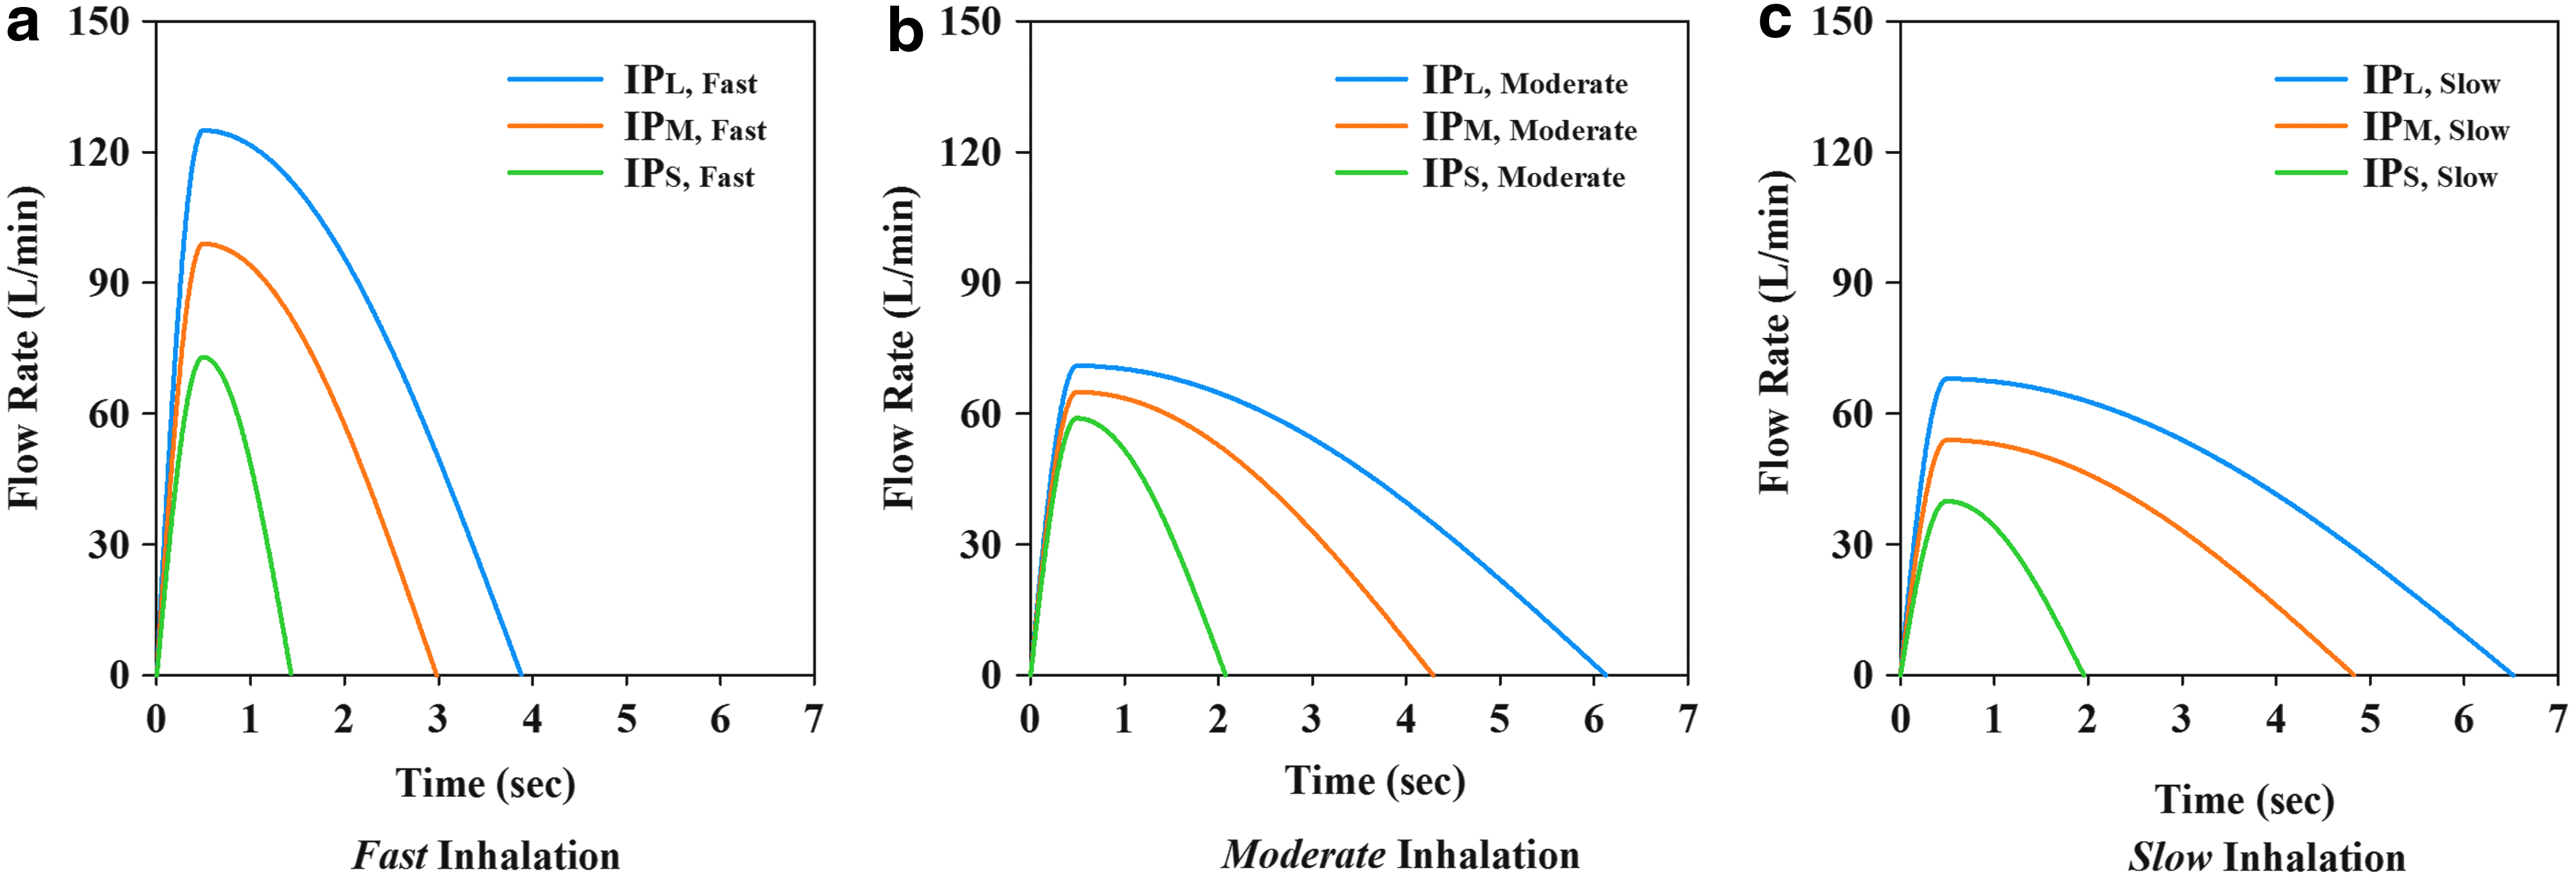
Small, medium, and large test IPs, showing the simulated mean and upper and lower 95% confidence intervals of the training conditions reported by Newman et al.(9) as

VCU-MT models(10) shown with Budelin atop the Nephele Mixing Inlet and the apparatus used to measure APSDTLDin vitro from Budelin Novolizer, the APSD of budesonide exiting the MT models under realistic inhalation conditions. Equipment details are described in the text. APSD, aerodynamic particle size distribution; MT, mouth and throat.
Small, medium, and large IPs are mean and the 95% confidence intervals (CI) reported for peak inhalation flow rate (PIFR) and inhaled volume (V) as “Novolizer training conditions.”(9) The right hand columns show the numerical results for TLD in vitro (mean ±SD) expressed as a percentage of the grand mean metered dose for this inhaler after testing with the General Method and the MMADTLDin vitro results at each flow rate. Budelin and Novolizer: Asta Medica device tested by Newman et al.(9) was the Budelin Novolizer prototype. Novolizer training conditions defined by Newman et al.(9); 95% CI estimated by adding/subtracting two standard deviations to/from the mean.
Values for PIFR and V were used to simulate(4) small, medium, and large IPs shown in Figure 1 for each Newman et al. training condition.(9)
MT-IP combination was tested at both 100 and 140 L/min NGI-W7 flow rates to validate measurements of APSDTLDin vitro at 140 L/min.
APSD, aerodynamic particle size distribution; IP, inhalation profile; MT, mouth-throat model; NGI, next generation pharmaceutical impactor; PIFR, peak inspiratory flow rate.
Two methods were employed to determine TLD in vitro : the Filter Method or the General Method. In the Filter Method, the breath simulator was attached directly to a low resistance filter (Pulmoguard II™; Queset Medical, North Easton, MA) capable of retaining all aerosolized drug passing from the exit of the selected VCU-MT model (Fig. 2). In the General Method, the equipment setup shown in Figure 2 was employed, with the same VCU-MT models connected directly to the NMI and a modified next generation pharmaceutical impactor (NGI-W7). In the Filter Method, budesonide aerosols were collected following a single simulated inhalation (Fig. 1). Drug retained in the inhaler mouthpiece, MT, and filter was recovered and analyzed as described previously.(1)
In the General Method, drug retained in the inhaler mouthpiece, MT, NMI, and the stages/filter of NGI-W7 was recovered and analyzed using the same high performance liquid chromatography (HPLC) method. In both methods, before each experiment or experimental replicate, the equipment and inhaler mouthpiece were cleaned and the internal MT surfaces were coated with silicone (Molykote® 316 Silicone Release Spray; Dow Corning Corp., Midland, MI) followed by solvent/propellant evaporation as described previously,(1) to prevent particle bounce and reentrainment. Electrostatic charge effects on budesonide capture in the MT models were avoided throughout by ensuring that each MT was minimally charged (baseline charge conditions; net MT charge in the range −30 to 0 nC, as defined by Huynh et al.(12)). Each experiment was performed and replicated (n ≥ 5) using single doses from the inhaler. The drug mass collected from inhaler mouthpiece, MT, the filter or the mixing inlet, and NGI-W7 was designated as the “metered dose”; the metered dose less the inhaler mouthpiece retention was the delivered dose (dd).
The experiments using the General Method were designed to evaluate the simultaneous determination of TLD in vitro and APSDTLDin vitro. To reduce the number of experimental options used with this method to manageable numbers (9 conditions were selected compared to the 27 used with the Filter Method), TLD in vitro and APSDTLDin vitro were determined by pairing VCU-MTS, VCU-MTM, and VCU-MTL with the small, medium, and large IPs, for each of Newman's inhalation training conditions(9) (Table 1); in this way, we were able to cover the variability of MT geometries and the range of values for TLD in vitro (1), as well as the inhalation maneuvers seen in the clinic.(9) The NGI (United States Pharmacopeia, USP <601> Apparatus 5) was modified by replacing the jet plate with a mensurated copy from the Westech W7 Cascade Impactor (Westech Scientific, Inc., Marietta, GA) from which individual jets can be removed. In all experiments, the micro-orifice collector (after stage 7), which precludes NGI flows of 140 L/min in the Westech jet plate, was replaced with a type A/E glass fiber filter (Pall Corporation, Port Washington, NY). The modified impactor was designated as the NGI-W7.
Experiments were conducted on the test inhaler with the NGI-W7 flow rate set at either 100 and/or 140 L/min using a three-phase DOERR vacuum pump LR22132 (Emerson Electric, St. Louis, MO) able to perform experiments with values for PIFR >100 L/min. The vacuum flow through NGI-W7 was adjusted (Table 1) following flow measurements at the MT inlet (with the NMI dilution air inlet sealed) using a low-pressure drop digital flow meter SFM3000 (Sensirion AG, Staefa, ZH, Switzerland, connected to Sensor Viewer software for flow rate recording). Subsequently, constant air flow rates were maintained in the NGI-W7 by balancing the flow withdrawn by the vacuum pump with a pressure- and flow-regulated compressed air source (arrows in Fig. 2) so that flow at the entrance to MT, in the absence of the inhaler, was held in the range 0 ± 2 L/min. The inhaler was actuated in each experiment using the secondary air withdrawn according to each programmed IP (Fig. 1 and Table 2) produced by the breath simulator. In dummy experiments performed before aerosol sampling, the programmed IP was checked against the recorded IP at the MT inlet.
MT-IP partners shown as bold were selected for study using the General Method.
The grand mean (SD) metered dose from all experiments was 218.6 (10.2) μg.
Calibration of NGI-W7 at 140 L/min
NGI-W7's stage cutpoints (D50 values(13)) at 140 L/min were determined using well-characterized polydisperse aerosols as described previously.(14) Specifically, the General Method was performed with the test inhaler at impactor flow rates of 100 and 140 L/min with the MT-IP combinations shown in Table 1 arranged in a randomized cross-over design. Thus, four different polydispersed aerosols exiting MT were tested twice and the experiments replicated (n = 5 at both 100 and 140 L/min; n = 20 in total). IP measurements were recorded at the MT inlet using SFM3000 flow meter at both impactor flow rates to ensure that the NGI-W7 flow had no effect on IP. Because NGI is presently calibrated only in the flow range of 15–100 L/min,(13,15,16) further calibration was needed to interpret the stage deposition results seen at 140 L/min. Therefore, the budesonide APSDTLDin vitro data from the aerosols collected at 100 L/min were analyzed in accord with USP's archival calibration.(13) Those data were then employed as four calibration standards to compare with the data collected at 140 L/min, by assuming that the same budesonide aerosol exits MT under the same IP/MT conditions. Briefly, the profiles of cumulative percent undersize (y) versus D50 (x) determined at the USP calibration condition (100 L/min) were fitted to the cumulative log-normal distribution function below (Eq. 1) to determine (a) goodness of fit and (b) the best estimates for MMAD and geometric standard deviation (GSD) for each aerosol.
In Equation (1), MEAN and σ are loge(MMAD) and loge(GSD) of the log-normally distributed data and ERF is the error function
The analysis was performed using MATLAB® R2012b (MathWorks, Natick, MA) without assigning weighting factors. Values (n = 5) for cumulative percent mass penetrating below each stage of NGI-W7 were then tabulated for the same four aerosols studied at 140 L/min. With MMAD and GSD for each aerosol fixed at their best estimates from experiments performed at 100 L/min, values for D50 for each stage at 140 L/min were solved using the cumulative log-normal distribution curves for each aerosol by setting the value for the cumulative percent undersize (y in Eq. 1) to its average experimentally determined value with NGI-W7 flow = 140 L/min. Equation (1) was then solved for x in Microsoft Excel 2013 (Microsoft Corporation, Redmond, WA) using the LOGNORM.INV function and the solution assigned to D50 for the selected stage and data set. Mean values (n = 20) for each D50 were then calculated and assigned to each stage of NGI-W7 at 140 L/min.
Data analysis and statistics
Budesonide doses collected from the exit of each MT model using the Filter Method or the General Method were designated TLD in vitro . Data for TLD in vitro between the Filter Method and General Method were compared across the tested MT models and IPs (Table 1), while also evaluating the results in comparison to those from the clinical gamma-scintigraphy experiments of Newman et al.(9) and the earlier in vitro results reported by Delvadia et al.,(1) who employed similar, but not identical, simulated test IPs to represent those used by Newman et al. in the clinic.(9) Statistical analysis was performed to evaluate the effects of the three in vitro test methods (Filter Method, General Method, and the method of Delvadia et al.(1)) on TLD in vitro . Data for TLDin vitro, expressed as a percentage of the grand mean metered dose, were pooled across test methods and Newman et al.'s training conditions,(9) and two-way analysis of variance (ANOVA) was used to evaluate the effects of “methods,” as well as the interaction of “methods” with “training conditions” on TLD in vitro . Normality of the residuals was tested using the Shapiro–Wilk W-test.
To further understand the effects of MT and IP on budesonide deposition from Budelin Novolizer, an analysis of covariance (ANCOVA) was used on both delivered doses (budesonide doses collected from the MT and filter) and TLD in vitro in the Filter Method, with MT as the categorical variable and PIFR and inhaled volume, V, as covariates. Data for TLD in vitro produced during the 140 L/min General Method calibration experiments were pooled across MT-IP combination and NGI-W7 flow conditions and compared using two-way ANOVA. All statistical tests were performed in JMP Pro 12 (SAS Institute, Cary, NC) at a significance level of 0.05.
Data for APSDTLDin vitro were compared between NGI-W7 flow rates by plotting cumulative percent drug mass undersize versus stage cutoff diameter, D50, at both flow rates. The USP archival calibration(13) was used for the 100 L/min NGI-W7 flow condition, while D50 at 140 L/min used the calibration values shown in Table 3. Those curves were analyzed for the mass median aerodynamic diameter of each aerosol exiting MT (MMADTLDin vitro) using linear–linear interpolation between the two data points that bracketed the 50 percentile of TLD in vitro . Results for MMADTLDin vitro and its relationship with PIFR were compared across the three MT models.
Values calculated assuming the validity of USP theory.(13)
95% confidence intervals as reported by Marple et al.(15)
No data; drug on filter and Stage 7 was <LOQ in all experiments (Fig. 4).
Results and Discussion
Because TLD in vitro and APSDTLDin vitro are in vitro estimates of the aerosol drug characteristics that likely define regional distribution in the lung, we wished to create a robust method able to determine both simultaneously, ultimately to evaluate the effects of variables such as MT geometry and inhaled flow rate versus time curves on these performance metrics from different powder inhalers. Because Newman et al.(9) had used the Budelin prototype for a series of gamma scintigraphic deposition experiments, we selected the marketed version of the same inhaler (a) to evaluate the method and (b) illustrate the performance of the marketed inhaler in realistic tests that explored the effects of MT geometric size and IP on the aerosol characteristics at the exit of the three MT models.
Table 2 shows the results for mean and standard deviation (SD) of the Budelin mouthpiece and MT model retention alongside TLD in vitro , the aerosol dose exiting MT expressed as a percentage of the grand mean metered dose, for each of 27 different experimental conditions (three MT models × three training conditions × three IPs per training condition that mimic the confidence intervals reported by Newman et al.(9); Fig. 1) using the Filter Method. This full-factorial experimental design allowed us to thoroughly examine the effects of variability in MT and IP on aerosol delivery when the inhaler was tested under clinically relevant conditions. Budelin showed no statistically significant differences in the total collected mass of budesonide (metered dose) across the tested MT-IP combinations (one-way ANOVA, p > 0.05). The grand mean (SD) metered dose of budesonide across all the experiments was 218.6 ± 10.2 μg (n = 137).
Notably, however, the 27 MT-IP combinations produced large variations in drug distribution properties, with overall mean percent metered dose values as a percentage of the grand mean metered dose and standard deviations of 22.8% ± 19.7%, 57.3% ± 13.9%, and 20.0% ± 9.4% for inhaler mouthpiece, MT retention, and TLD in vitro , respectively (n = 137). While the effects of MT and IP on Budelin's in vitro performance are discussed further below, we used these data to select nine MT-IP combinations that spanned the complete range of values for TLD in vitro across Newman et al.'s training conditions(9) (bolded in Table 2). Those nine MT-IP combinations, which covered the variability of MT geometries and inhalation maneuvers seen in the clinic,(1,9) were used to characterize drug aerosol properties at the trachea using the General Method.
The General Method
Figure 3 shows the results for TLD in vitro and in vivo, illustrating the consistency of the results collected in this study with those published earlier(1) and the clinical results of Newman et al.(9) To compare fairly the in vivo(9) and in vitro results, values in Figure 3 are presented as the median TLD and experimental range expressed as a percentage of the metered dose collected in individual experiments; this was analogous to the method used by Newman et al. when performing gamma scintigraphic experiments in the clinic.(9) The apparent correlation between the in vivo and in vitro results shows the IVIVC for the test inhaler irrespective of whether the Filter Method or the General Method was employed to determine this variable. Clearly, the in vitro results for TLD were associated with the inhaler test conditions as well as the VCU-MT models that were designed to span 95% of the range of airway sizes(1) (Fig. 2).

Median ± experimental range (error bars) for TLD in vivo(9) and in vitro from Budelin Novolizer using the MT-IP pairs shown in Table 1. Values are expressed as a percentage of the metered dose for each experiment, analogous to the method used by Newman et al.(9) Filter results from Delvadia et al.(1) are shown in comparison with those from the Filter Method (Table 2) and the General Method (NMI + NGI-W7 deposition) with impactor flow rate = 100 L/min with the exception of Fast Inhalation paired with Large IP (*) where impactor flow = 140 L/min.
While some of the clinical values fell outside the in vitro range and it is possible that the inhalers tested by Newman et al.(9) differed from those in this study, the overall similarity between lung deposition values reported by Newman et al.(9) and the in vitro estimates was remarkable. In addition, at least for this test inhaler, the method variations shown in Figure 3 failed to change the correlations with Newman et al.'s in vivo results.(9) The results for TLD in vitro collected from the General Method (budesonide deposition on NMI + NGI-W7; Table 1) were also statistically comparable with those from the Filter Method (Table 2) and those reported previously(1) when tested across Newman et al.'s training conditions(9) using two-way ANOVA (p > 0.05).
Calibration of the NGI-W7 at 140 L/min
Use of the W7 jet plate, whose mensuration parameters conform to those of the NGI original, enabled the NGI-W7 to be employed at flow rates >100 L/min. Moreover, it was impossible to distinguish between flow rate versus time curves (IPs) seen at the apparatus inlet from those shown in Figure 1 when digital records of the IPs from the MT inlet were compared at NGI-W7 flow rates of 100 and 140 L/min for the selected MT-IP combinations. Notably also, there were no significant differences in the values for TLD in vitro (% grand mean metered dose) for the selected MT-IP combinations between the two NGI-W7 flow conditions (two-way ANOVA, p > 0.05).
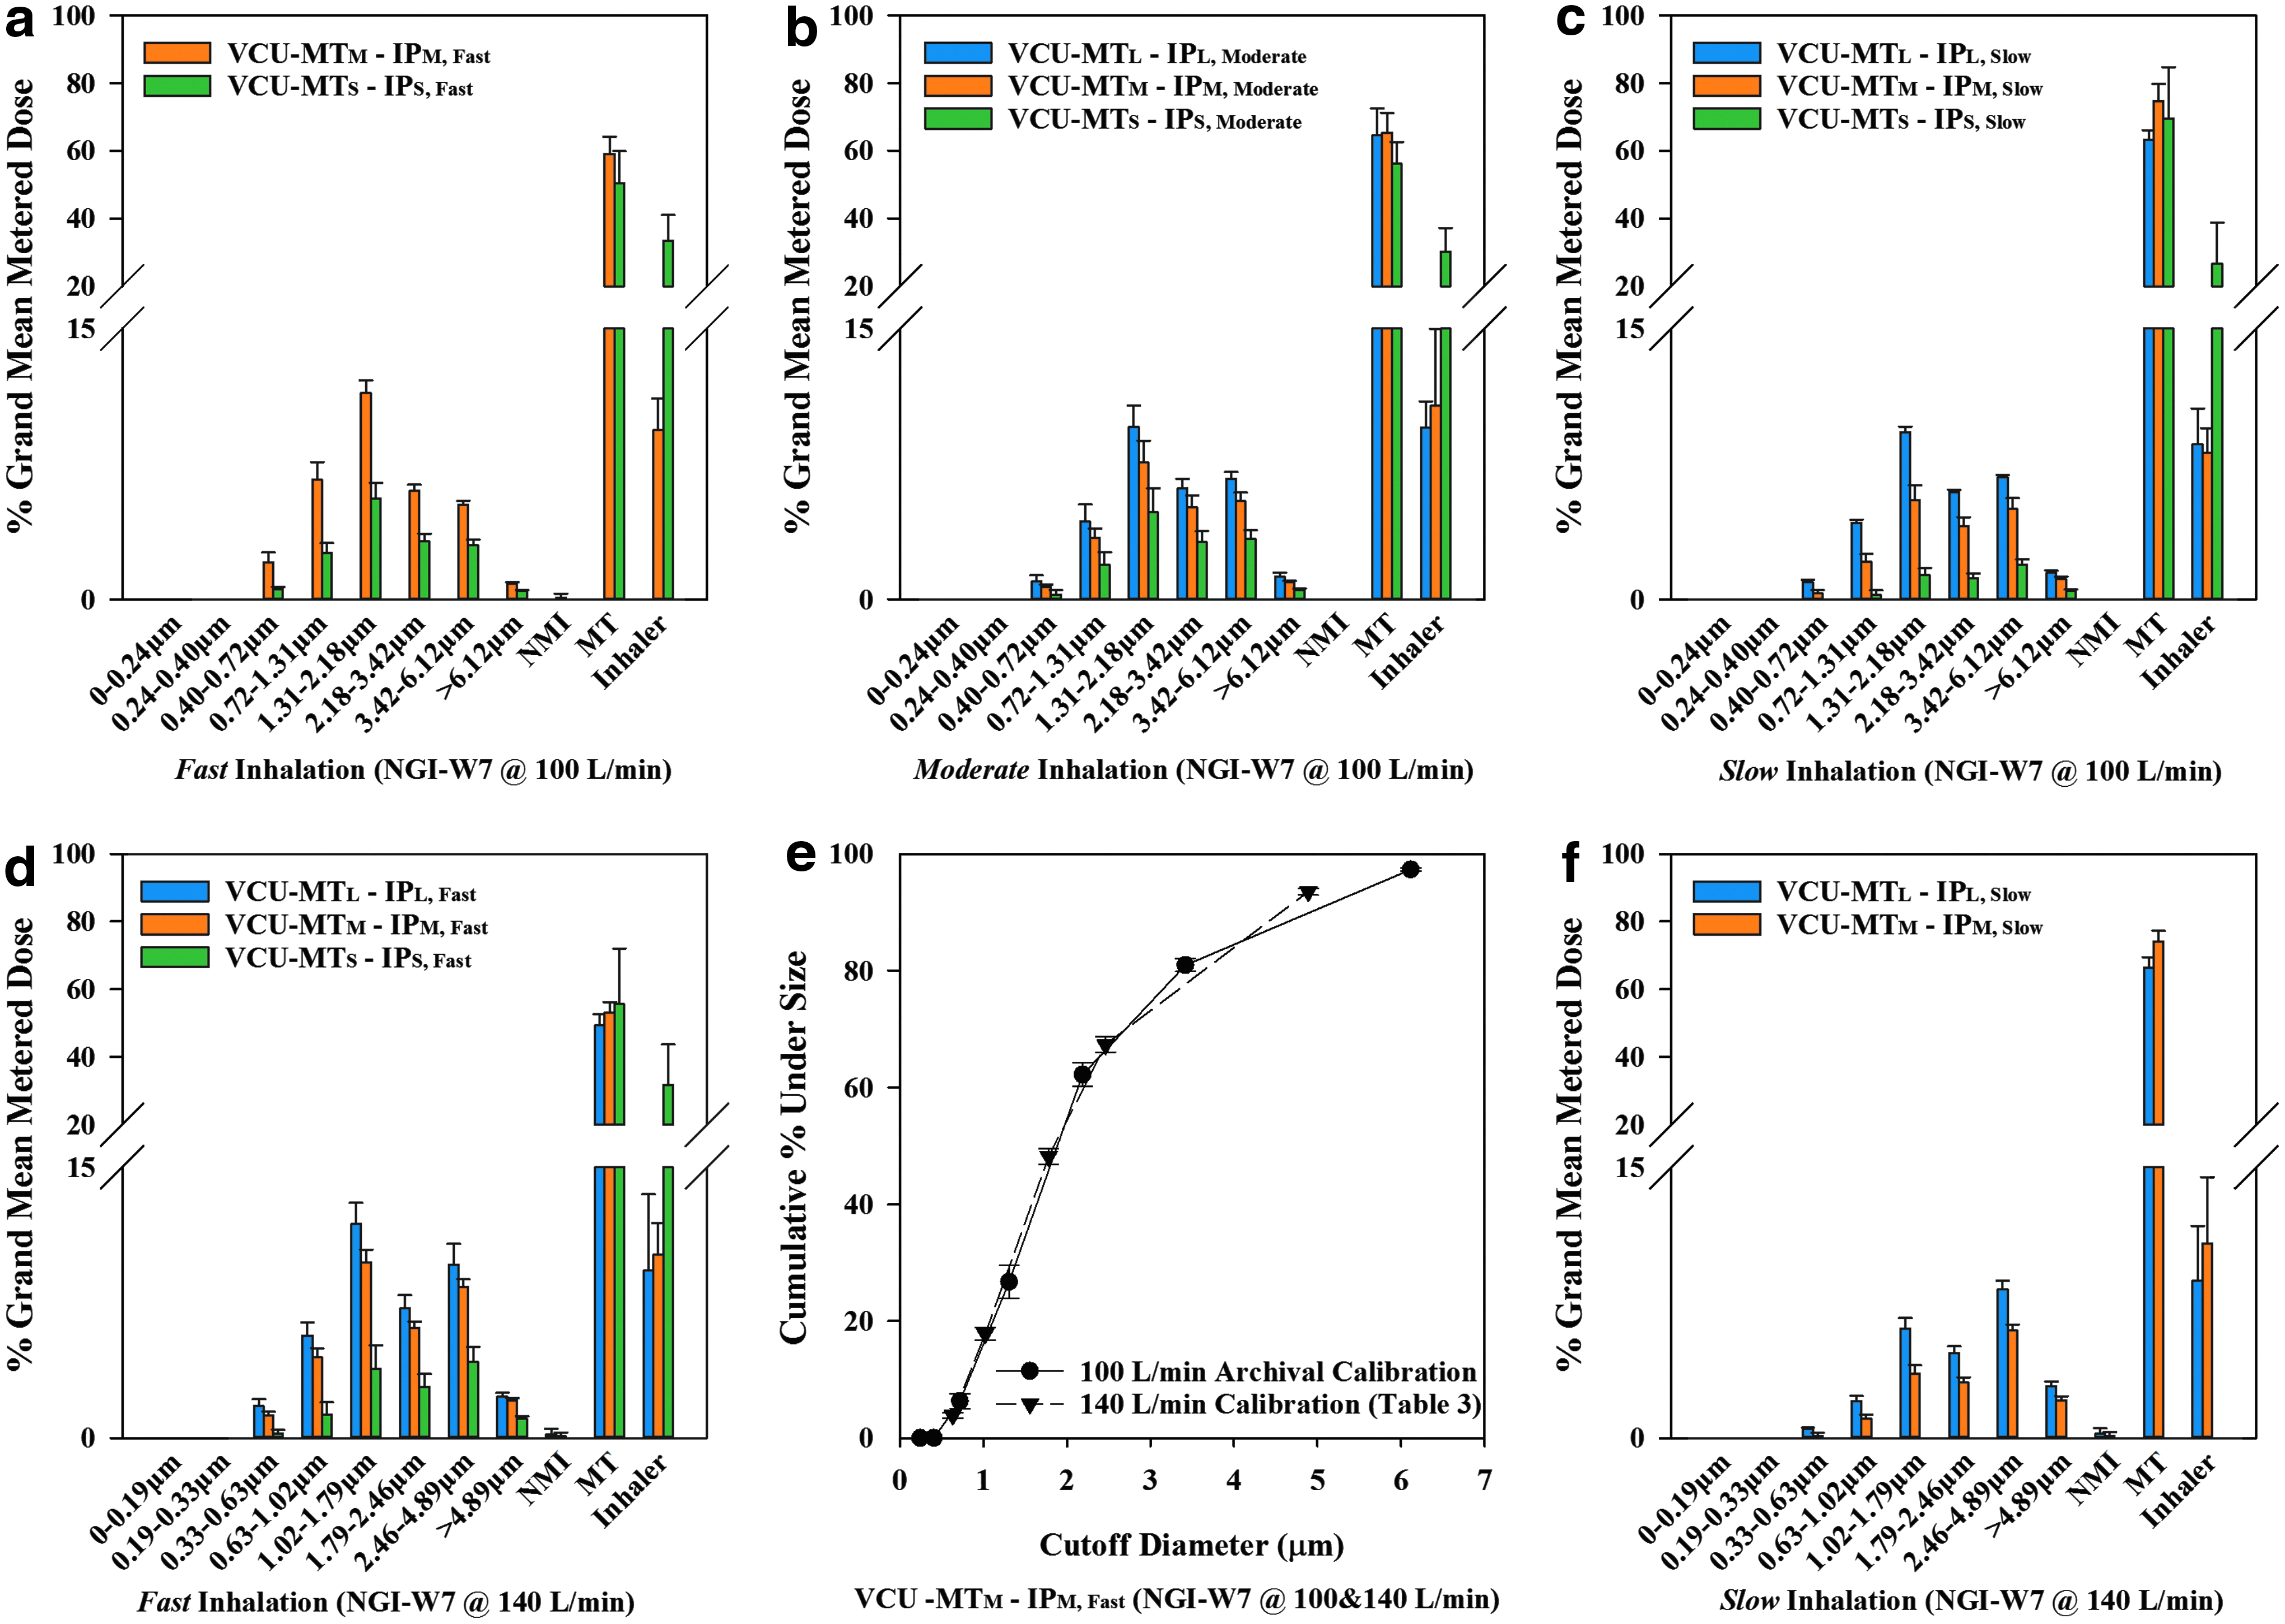
Table 3 shows the results for the stage cutoff aerodynamic diameters at 140 L/min in comparison to the archival values according to USP at 100 L/min and the calculated values according to USP, assuming that USP theory(13) could be extrapolated to 140 L/min. When the mean results from each MT-IP combination were plotted as cumulative percent drug mass undersize versus D50 and the cutpoints were calculated according to extrapolated USP theory (Column 2, Table 3), there were significant differences in the appearance of the curves at the 100 and 140 L/min NGI-W7 flow conditions (data not shown); at 140 L/min, those discrepancies indicated problems with the interpretation of the sizes attributed to deposition on stage 1, 2, and 3, stages that are associated with high Reynolds numbers and turbulent flow,(17) confirming the need for experimental calibration. When D50 values determined at 140 L/min were employed, mean results for APSDTLDin vitro at the two NGI-W7 flow conditions for each IP-MT combination were in agreement, as shown in the cumulative% undersize comparison in Figure 4e. Test results on two different pressurized metered dose inhalers in NGI-W7, at 100 and 140 L/min, also produced comparable cumulative% undersize plots similar to Figure 4e (data not shown).
APSDTLDin vitro
Figure 4 shows the percent drug distribution on the inhaler mouthpiece, MT, NMI, and NGI-W7 impaction stages for Budelin as % grand mean metered dose after testing with the General Method for the nine MT-IP pairs (8 MT-IP pairs tested at an impactor flow of 100 L/min and five MT-IP pairs tested at an impactor flow of 140 L/min) as shown in Table 1. The method was reproducible and clearly able to provide data for both TLD in vitro and APSDTLDin vitro at impactor flow rates of either 100 or 140 L/min. At both flow rates, it was possible to discriminate between the size distributions seen when either MT or IP was varied. The amounts of drug collected in the NMI were consistently ≤2% of TLD in vitro (drug deposition in NMI + NGI-W7) in all cases, suggesting that the addition of NMI to the NGI-W7 had negligible effects on the data for APSDTLDin vitro.
While the figures show the general impact of IP and MT upon the drug's aerosol properties (e.g., larger MT-IP combinations produced larger values for TLD in vitro and smaller aerosol sizes), the difference in x axis labeling (compare Figs. 4a–c to d, f) makes it difficult to compare data directly from experiments with different NGI-W7 flow rates. It remained possible, however, to extract and analyze the values for MMADTLDin vitro independent of flow because the cumulative% undersize curves for each MT-IP combination could be superimposed (Fig. 4e).
Effects of MT model and IP on Budelin's in vitro performance
Standardized USP testing(13) on Budelin Novolizer at a 4 kPa pressure drop across the inhaler (80 L/min) produced delivered doses well within compendial specifications (208.0 ± 5.0 μg for batch 3L068A) and an apparently log-normal particle size distribution with MMAD = 2.1 ± 0.0 μm and GSD of 1.8 ± 0.0 (n = 5). The mean (SD) values for drug mass collected from the inhaler mouthpiece, MT + preseparator, and NGI for this batch were 15.0 ± 0.8, 135.7 ± 3.6, and 72.3 ± 3.0 μg, respectively, while the fine particle dose for budesonide smaller than 5 μm was 66.2 ± 2.9 μg (n = 5). These values, of course, provide no indication of the possible variability in the delivered aerosol properties and what that variability is actually due to. Moreover, regulators often express difficulty in deciding whether two products are bioequivalent because of the uncertainty with which inhalers deliver drugs in clinical situations. Unlike standardized USP testing, realistic testing provides values for drug doses and aerosol sizes likely to enter the lung (TLD in vitro and APSDTLDin vitro) and enables exploration of factors that determine them.
The obvious effects of MT geometry and IP on Budelin's in vitro deposition are shown in Table 2, where the 27 MT-IP combinations produced large variations in budesonide aerosol distribution between the inhaler mouthpiece, MT, and the exiting aerosol (TLD in vitro ). For a single MT, IPs with larger values of PIFR and V produced smaller mouthpiece deposition and larger values for TLD in vitro . The effect of changing MT, however, was less clear, although larger MT appeared to produce larger TLD in vitro (Table 2), ANCOVA was used (on values for delivered dose and TLD in vitro expressed as % grand mean metered dose) to better understand the dominant factors (i.e., MT size, PIFR, or V) affecting the inhaler's in vitro performance. Results showed that the delivered dose was significantly affected only by the inhaled volume, V (p < 0.0001). TLD in vitro , however, was significantly affected by MT size, PIFR, and V (p < 0.0001 in all cases).
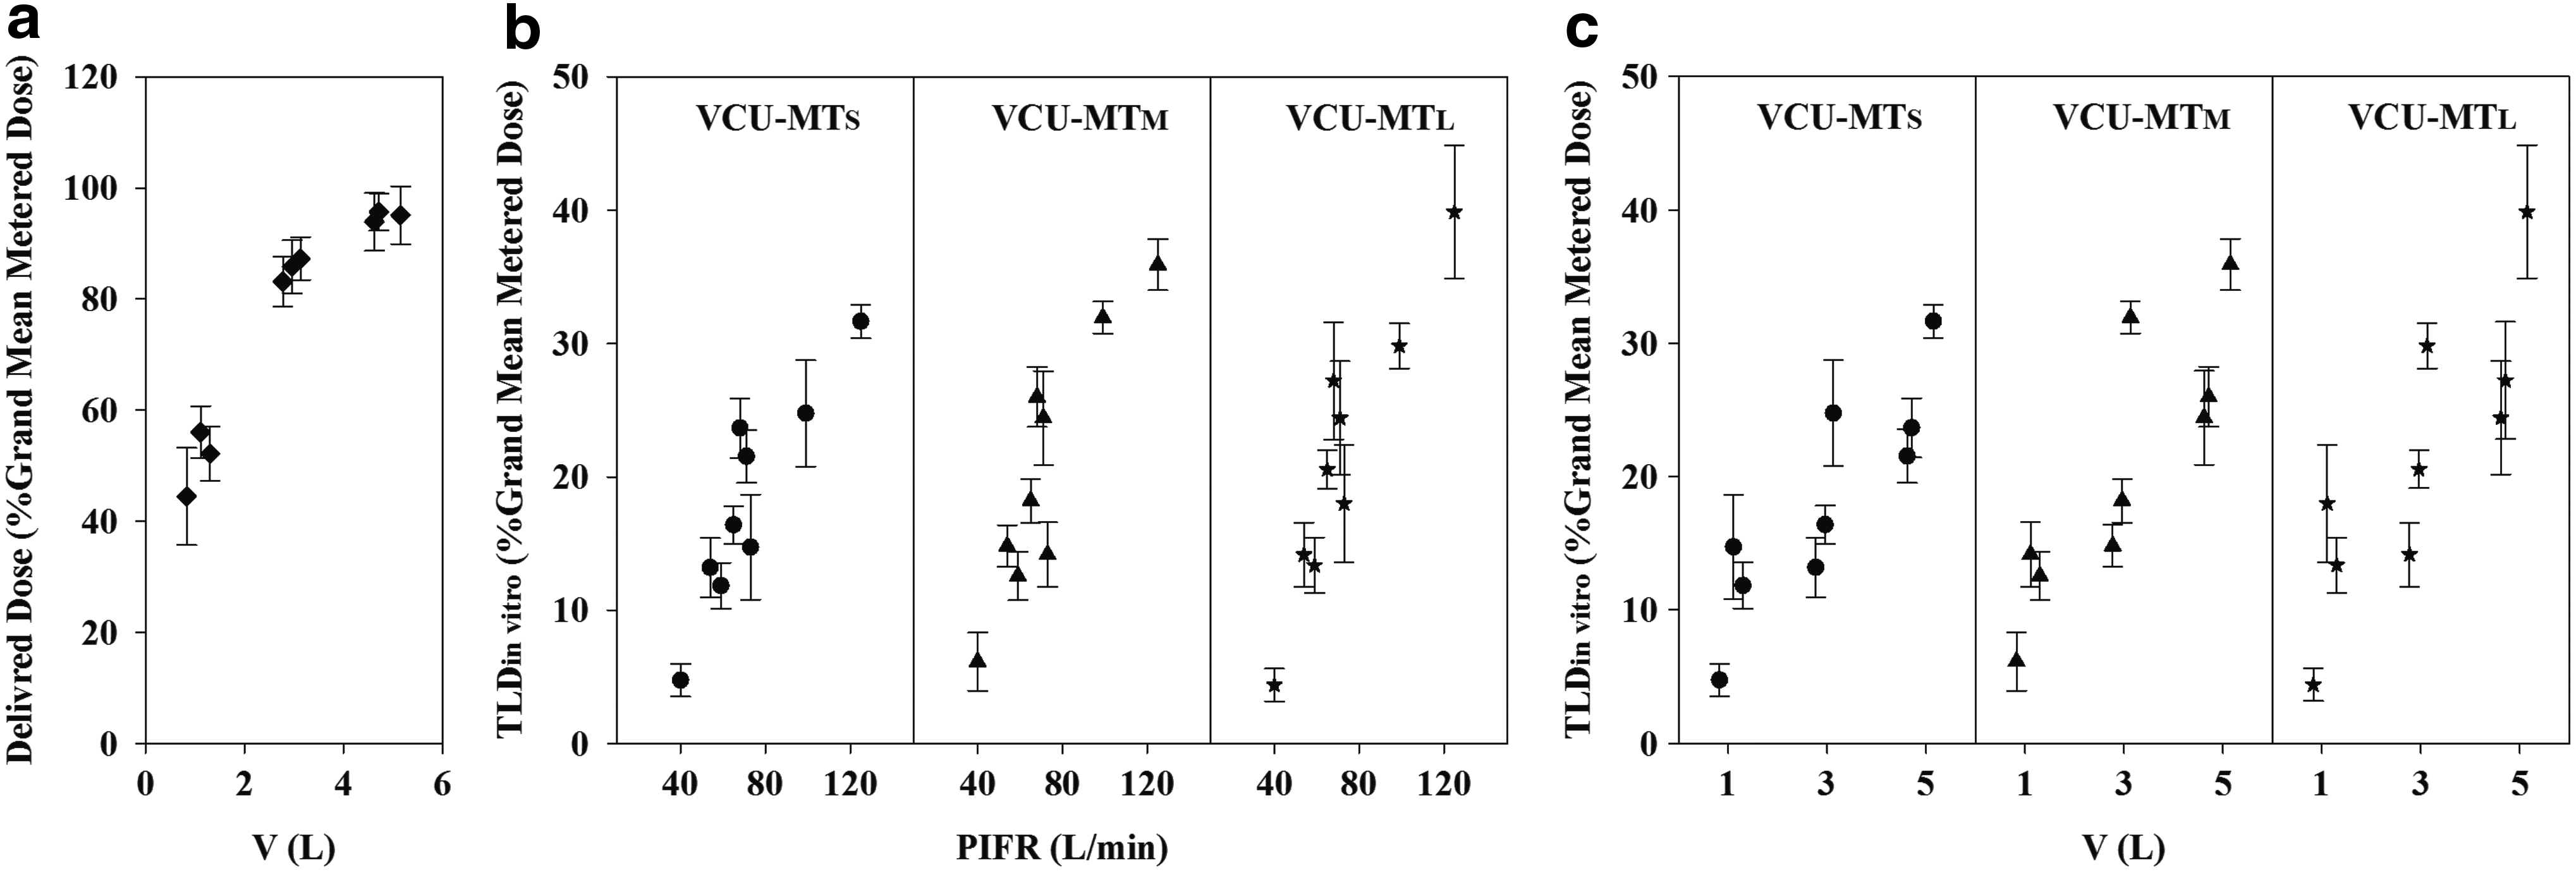
Because MT size had no significant effect on the delivered dose, data for delivered dose were pooled across the three MT models to show its relationship with V. Figure 5a shows a clear dependence of the delivered dose on inhaled volume with mean values increasing more than twofold when V changed from 0.83 to 5.15 L (44.5% and 95.1% grand mean metered dose, respectively). Figure 5b and 5c show the positive relationships between TLD in vitro and the covariants, PIFR and V, for each VCU-MT model with this inhaler; mean values increased from 4.7% to 31.7% for VCU-MTS, 6.1% to 35.9% for VCU-MTM, and 4.4% to 39.9% for VCU-MTL over the tested range for PIFR and V, in part, because of the variation in delivered dose with V. Furthermore, increasing the size of MT with this inhaler produced only marginal enhancements in the values for TLD in vitro that depended more on IP than MT.
Effects of MT and IP (PIFR and V) on Budelin's delivered dose, dd, and TLD
in vitro
determined using the Filter Method.
The MMAD values for the budesonide doses exiting MT are shown alongside their dependence on PIFR in Figure 6. The results show clearly that each MT was efficient in removing coarse particles by impaction, with larger values for MMADTLDin vitro associated with smaller values for PIFR. This correlation was consistent with our previous finding for this inhaler that, in vitro deposition depended more on the IP than the size of the MT model. While inhaled air flow is usually believed to have two opposing effects on aerosol delivery from DPIs (facilitating powder dispersion to produce smaller aerosols, while simultaneously increasing inertia and enhancing impaction), increasing PIFR decreased values for MMADTLDin vitro across MT sizes with smaller values for MMADTLDin vitro correlating with larger values for TLDin vitro. These results suggest that an increasing PIFR had a much greater effect on dispersion than impaction.
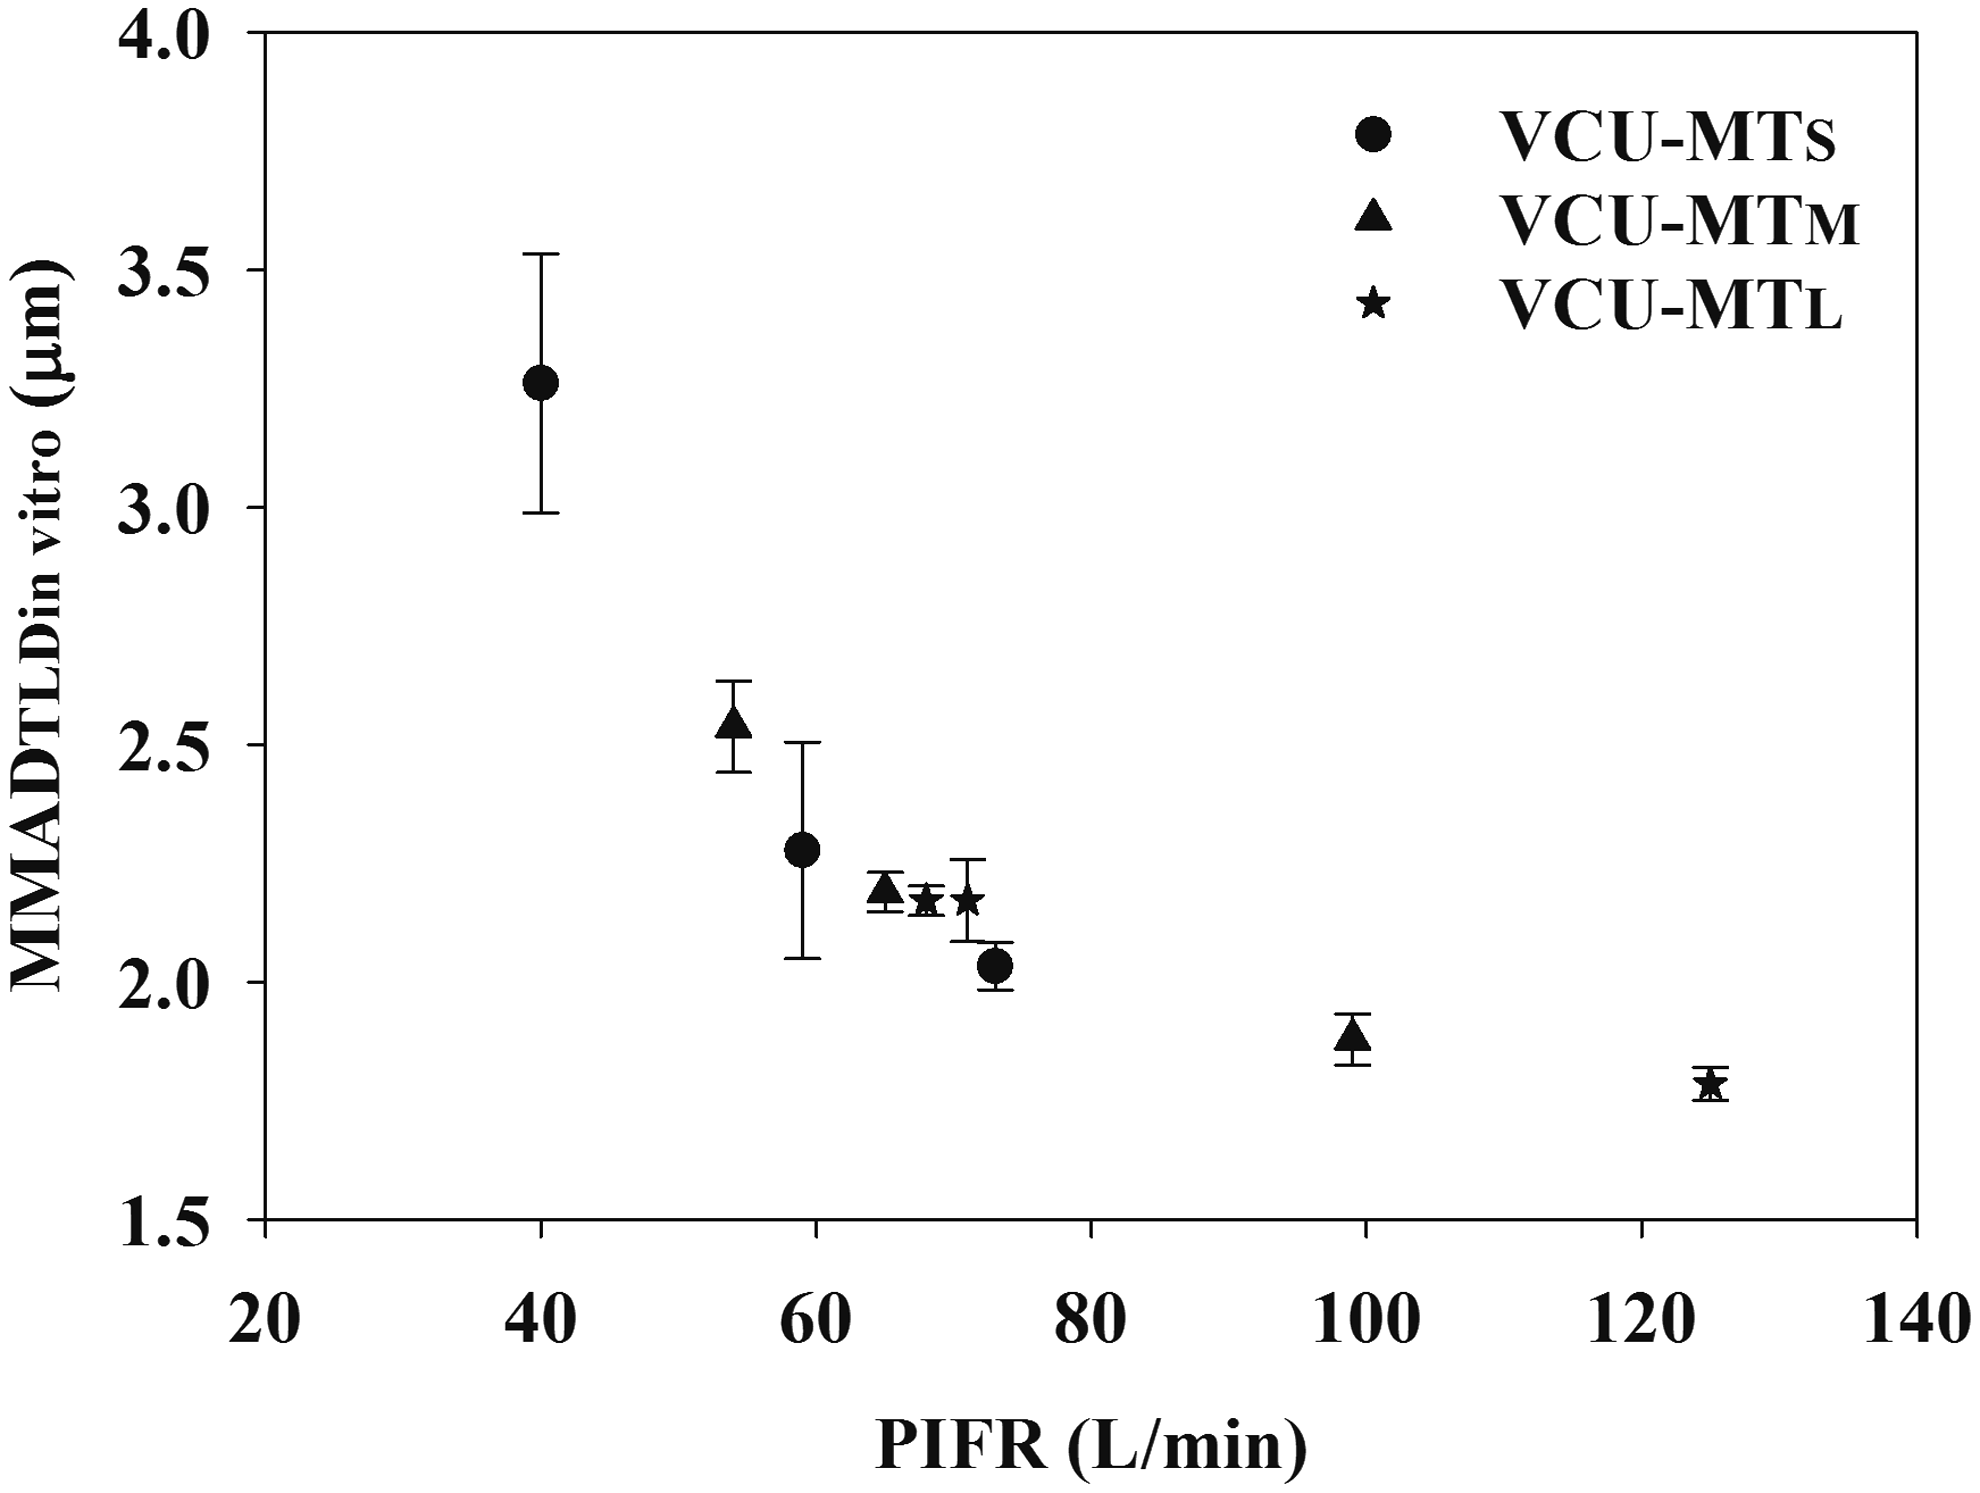
MMADTLDin vitro versus PIFR for VCU-MTS (•), VCU-MTM (▲), and VCU-MTL (★) for Budelin tested by the General Method. Data are mean ± SD (n = 5).
Conclusion
A general method was evaluated to enable the determination of APSDs of TLD in vitro from powder inhalers. Determining the dose of drug exiting MT onto either a filter or the Nephele Mixing Inlet and modified NGI enabled estimation of TLD in vitro . Using the new technique to study a proprietary powder inhaler, Budelin Novolizer 200 μg, which delivers reproducibly when subjected to USP testing, we showed significant variations in lung dose in vitro that correlated with reports of its clinical behavior due to variations in oropharyngeal (MT) geometry and the way that subjects inhaled (IPs). Coupling realistic test methods to cascade impactors to evaluate the APSDs exiting the MT models showed that the methods were precise and able to distinguish between the different aerosol doses and aerosol sizes likely to enter the trachea as well as the major factors likely to influence those parameters for the test inhaler chosen in this study for method demonstration purposes. Whether the APSDTLDin vitro determined by this method has any clinical significance requires further evaluation.
Footnotes
Acknowledgments
The authors are grateful to Ingmar Medical for upgrading and loaning the ASL 5000 XL Breath Simulator and software (needed to simulate large inhaled volumes). The study was funded, in part, by Medical College of Virginia Foundation and grant 1U01FD005231 from the Department of Health and Human Services (DHHS), Food and Drug Administration. The content is solely the responsibility of the authors and does not necessarily reflect the official policies of the DHHS, nor does any mention of trade names, commercial practices, or organizations imply endorsement by the U.S. Government. Two visiting student interns, Katharina Bormann and Bao Khanh Hyunh, are acknowledged for their technical assistance. Dale Farkas from VCU School of Engineering provided three-dimensional geometries for the VCU-MT models. Dennis Sandell and Jurgen Venitz provided advice on statistical analyses.
Author Disclosure Statement
P.R.B. and M.H. are faculty members and X.W. is a postdoctoral research fellow at Virginia Commonwealth University. R.R.D. is a reviewer at the Office of Research and Standards in the U.S. Food and Drug Administration (FDA). FDA has neither endorsed this work nor influenced statements made in this article. Supplies and equipments were purchased from commercial sources. No conflicts of interest exist.