




Abstract
Abstract
Background:
Accurate prediction of the regional deposition of inhaled dry powders as a function of powder properties and breathing pattern is a long-term research goal for pulmonary drug delivery. In the present work, deposition along the respiratory tract of dry powders of Fluticasone propionate and Salmeterol is predicted.
Methods:
A one-dimensional particle transport and deposition model is used, whose novelty is in the treatment of the alveolar space of each airway generation as an efficient mixing chamber. This assumption has been supported by simulations and measurements during the last 20 years. The model is applied to two popular pulmonary tree geometries, to investigate the effect of particle size on localized deposition and to estimate the uncertainty due to variations in airway size.
Results and Conclusions:
Application of the model for the specific particle size distribution measured by a cascade impactor in the marketed product ELPENhaler, predicts the whole lung deposition (WLD), as well as the split between pulmonary (PU) and tracheobronchial (TB) deposition. Introduction in the model of modified particle size distributions with increased fractions of fine particles, indicates that the fine-particle dose is a satisfactory predictor of WLD but not of the PU/TB ratio.
Introduction
A
Another key parameter is the breathing pattern, which, at the most fundamental level, may be quantified by the mean air flow rate and the tidal volume (or, equivalently, the inhalation and exhalation time). As a general rule, large particles (d > 5 μm) are expected to deposit high in the respiratory tract by inertial impaction, particles with sizes in the range 1 μm < d < 5 μm are expected to penetrate deeper and deposit mainly by gravitational sedimentation, whereas the fate of small particles (d < 1 μm) is increasingly affected by Brownian diffusion.(2)
Pharmaceutical dry powders are polydisperse, and cascade impactors are typically used to obtain information on their size distribution. The mass median aerodynamic diameter is frequently chosen to characterize the average particle size in the sample and to serve as a gross predictor of deposition behavior.
Detailed prediction of the spatiotemporal variation of dry powder deposition in a specific patient is presently beyond our capabilities because of a host of complications. In particular, the respiratory tract anatomy is highly complex and varies widely with health condition and personal characteristics of each individual.(3) The characteristics of a specific inhaler determine the dispersion of the powder and the retention in the device,(4) but may also affect the pattern of extrathoracic deposition.(5)
A very promising approach in this direction is the combination of tomographic techniques for recording the individual's characteristics with detailed, three-dimensional, computational fluid dynamics simulations of particle transport inside the device and the specific airway geometry.(6–8) However, this approach is presently limited to the first few airway generations, because of rapidly escalating computational cost and decreasing reliability of tomographic data.
Complications of a different nature are introduced by the periodic variation in the size of lung volumes during breathing, which triggers highly nontrivial secondary flows. A most striking example of this, is the discovery that chaotic advection (leading to efficient mixing) takes place inside the alveoli, despite the very small flow velocities involved. Chaotic mixing results from the combination of axial flow due to expansion/contraction of the alveoli with shear flow along the airway and has been predicted computationally and demonstrated experimentally.(9–12)
Given the present state of the art as outlined above, it is desirable for the pharmaceutical industry to have a computationally efficient (one-dimensional) predictive tool that is directly fed with standard particle size distribution measurements and, indeed, there have been many efforts in this direction.(13–15) A new one-dimensional model was recently proposed(16) and shown to predict very satisfactorily the available benchmark data over a wide range of particle sizes and breathing patterns. Its basic novelty is in the modeling of acinar deposition by the hypothesis that perfect mixing takes place in the alveolar volume of each airway generation. This hypothesis, which is based on the aforementioned discovery of chaotic mixing, treats alveolar particle concentrations as spatially uniform and permits derivation of analytic expressions for their temporal evolution.
The aforementioned model(16) is presently employed to predict the deposition along the respiratory tract of dry powders of Fluticasone propionate and Salmeterol, using the specific particle size distributions measured in vitro with ELPENhaler (ELPEN Pharm. Co. Inc). In Methods section, the measuring protocols are provided and the computational model is described. In Results and Discussion section, the results are presented and discussed. Conclusions section contains the conclusions.
Methods
Measurements of dry powder characteristics
ELPENhaler is a dry powder inhaler for the administration of Fluticasone propionate and Salmeterol with nominal doses 500 μg/blister and 50 μg/blister, respectively. Uniformity of delivered dose is confirmed by experiments carried out with the Dose Uniformity Sampling Apparatus described in the European Pharmacopoeia (Copley Scientific, Nottingham, United Kingdom) and is found to be 480 μg ± 15% and 46 μg ± 15%, respectively.
The fine-particle dose (FPD) is measured by experiments carried out with the Andersen Cascade Impactor (ACI), Apparatus D of European Pharmacopoeia (Copley Scientific). Results are reported in terms of the mass of powder retained on the adapter, the induction port, the preseparator, each of the eight main stages (numbered −1, 0, and 1–6) and the filter. The air flow rate used is 70 L/min and this also determines the cutoff diameter of each stage, which is reported with the data of Fluticasone propionate and Salmeterol in Tables 1 and 2, respectively. Three different devices were used for the measurements. For each device, the first and the last five doses out of the 60 were delivered into the impactor; all the intermediate doses were delivered to waste.
FPD, fine particle dose; MMAD, mass median aerodynamic diameter.
FPD, fine particle dose; MMAD, mass median aerodynamic diameter.
The ACI is operated with the universal induction port, according to EMA guidelines and pharmacopoeial standards. It must be noted, however, that the induction port serves only to introduce the aerosol to the preseparator and is in no way considered as a realistic model of the mouth–throat region. Indeed, there is evidence in the literature(17) that deposition fractions measured in human mouth–throat replicas agree better with in-vivo data.
Outline of computational model
The transport and deposition of monodisperse, spherical particles of density ρ and diameter d is considered during one breathing cycle. The lungs are modeled as a symmetric bifurcation network. The airway length, Li, and diameter, Di, and the alveolar volume, Va,i, of generation i, are taken from the literature. Two alternative popular choices are employed,(3,18) which differ significantly in the dimensions of bronchi and conductive bronchioles and also place the onset of respiratory bronchioles at different generations (15th vs. 17th). Thus, the sensitivity of the present predictions to the respiratory tree geometry is assessed. According to a recommendation in the literature,(19) the fractional coverage of the walls with alveoli is taken as fi = 0.2, 0.4, 0.7, 1.0 for the first four alveolated airways of each model.
Breathing patterns are described in terms of the tidal volume, VT, and inhalation time, tb, assuming equal durations of inhalation and exhalation and no breath holding. Thus, the mean volumetric air flow rate is Q0 = VT/tb and the mean velocity through generation i is
Particles released from the beginning of inhalation (zero drug release time) are carried by the flow and deposit along the way. As the main novelty of our approach lies in the assumption of good mixing in the alveolar volumes, the potential significance of the present work is in an improved prediction of the split between central and peripheral deposition. Thus, extrathoracic deposition is modeled by a standard semiempirical correlation.(20) It is well known that the uncertainty in extrathoracic and intradevice deposition is a key obstacle in the reliable prediction of the amount of aerosol drug delivered to the lungs.(8,21) However, there is no benefit for the present study from adopting a more detailed extrathoracic model, as it has been shown that this uncertainty is mainly caused by intersubject variations in mouth–throat characteristics.(22)
Deposition inside the bronchial and bronchiolar airways is predicted by combining the probability for inertial impaction, gravitational settling, and Brownian diffusion. Each probability is calculated using correlations from the literature based on an appropriate dimensionless number.(23–25) The reduction in wall area of alveolated ducts due to the alveolar openings is taken into account by multiplying the predicted airway deposition with (1-fi).
Particles enter the alveolar volumes of each generation by two mechanisms whose contribution is additive, (1) by convection with the air flow entering the alveoli and (2) by gravitational settling and/or Brownian diffusion on the fraction, fi, of the airway wall that is absent due to the alveolar openings.(14) This summation is equivalent to the classical formulation of mass flux of a component in a mixture as the sum of a convective and a molecular contribution.(26)
Particle dynamics in the alveoli of each generation is modeled by mass balances, which take into account inflow, outflow, and deposition. Based on the assumption of perfect mixing inside the alveolar volume, we define a particle concentration that is spatially uniform and varies only with time. Thus, the temporal variation of the suspended particle mass is, during inhalation, the difference between inflow and deposition and, during expiration, the negative sum of outflow and deposition.
The mathematical formulation of the above model, a set of algebraic and analytically integrable ordinary differential equations, is described in detail elsewhere.(16) Predictions by this model of the tracheobronchial (TB) and pulmonary deposition at benchmark conditions corresponding to a wide range of particle diameters (0.05–15 μm) and breathing patterns are in very encouraging agreement with data.(20,27)
Results and Discussion
Prediction of the effect of particle size on deposition
A parametric investigation is performed for the breathing pattern implied by the flow rate 70 L/min used for the in vitro measurements. Thus, the simulations use a tidal volume VT = 2.334 L and inhalation/exhalation time tb = 2 seconds. Figure 1a and b shows the fraction deposited in the TB and the pulmonary region as a function of aerosol diameter. Results for both models of the tree geometry (indicated as “Finlay”(3) and “Soong”(18)) are depicted. According to Figure 1, the most appropriate particle sizes for pulmonary deposition are in the rather narrow zone 1–4 μm, whereas TB deposition extends over the wider range 1–10 μm with maximum around 4–5 μm. These predictions agree with established rules of thumb.(28)
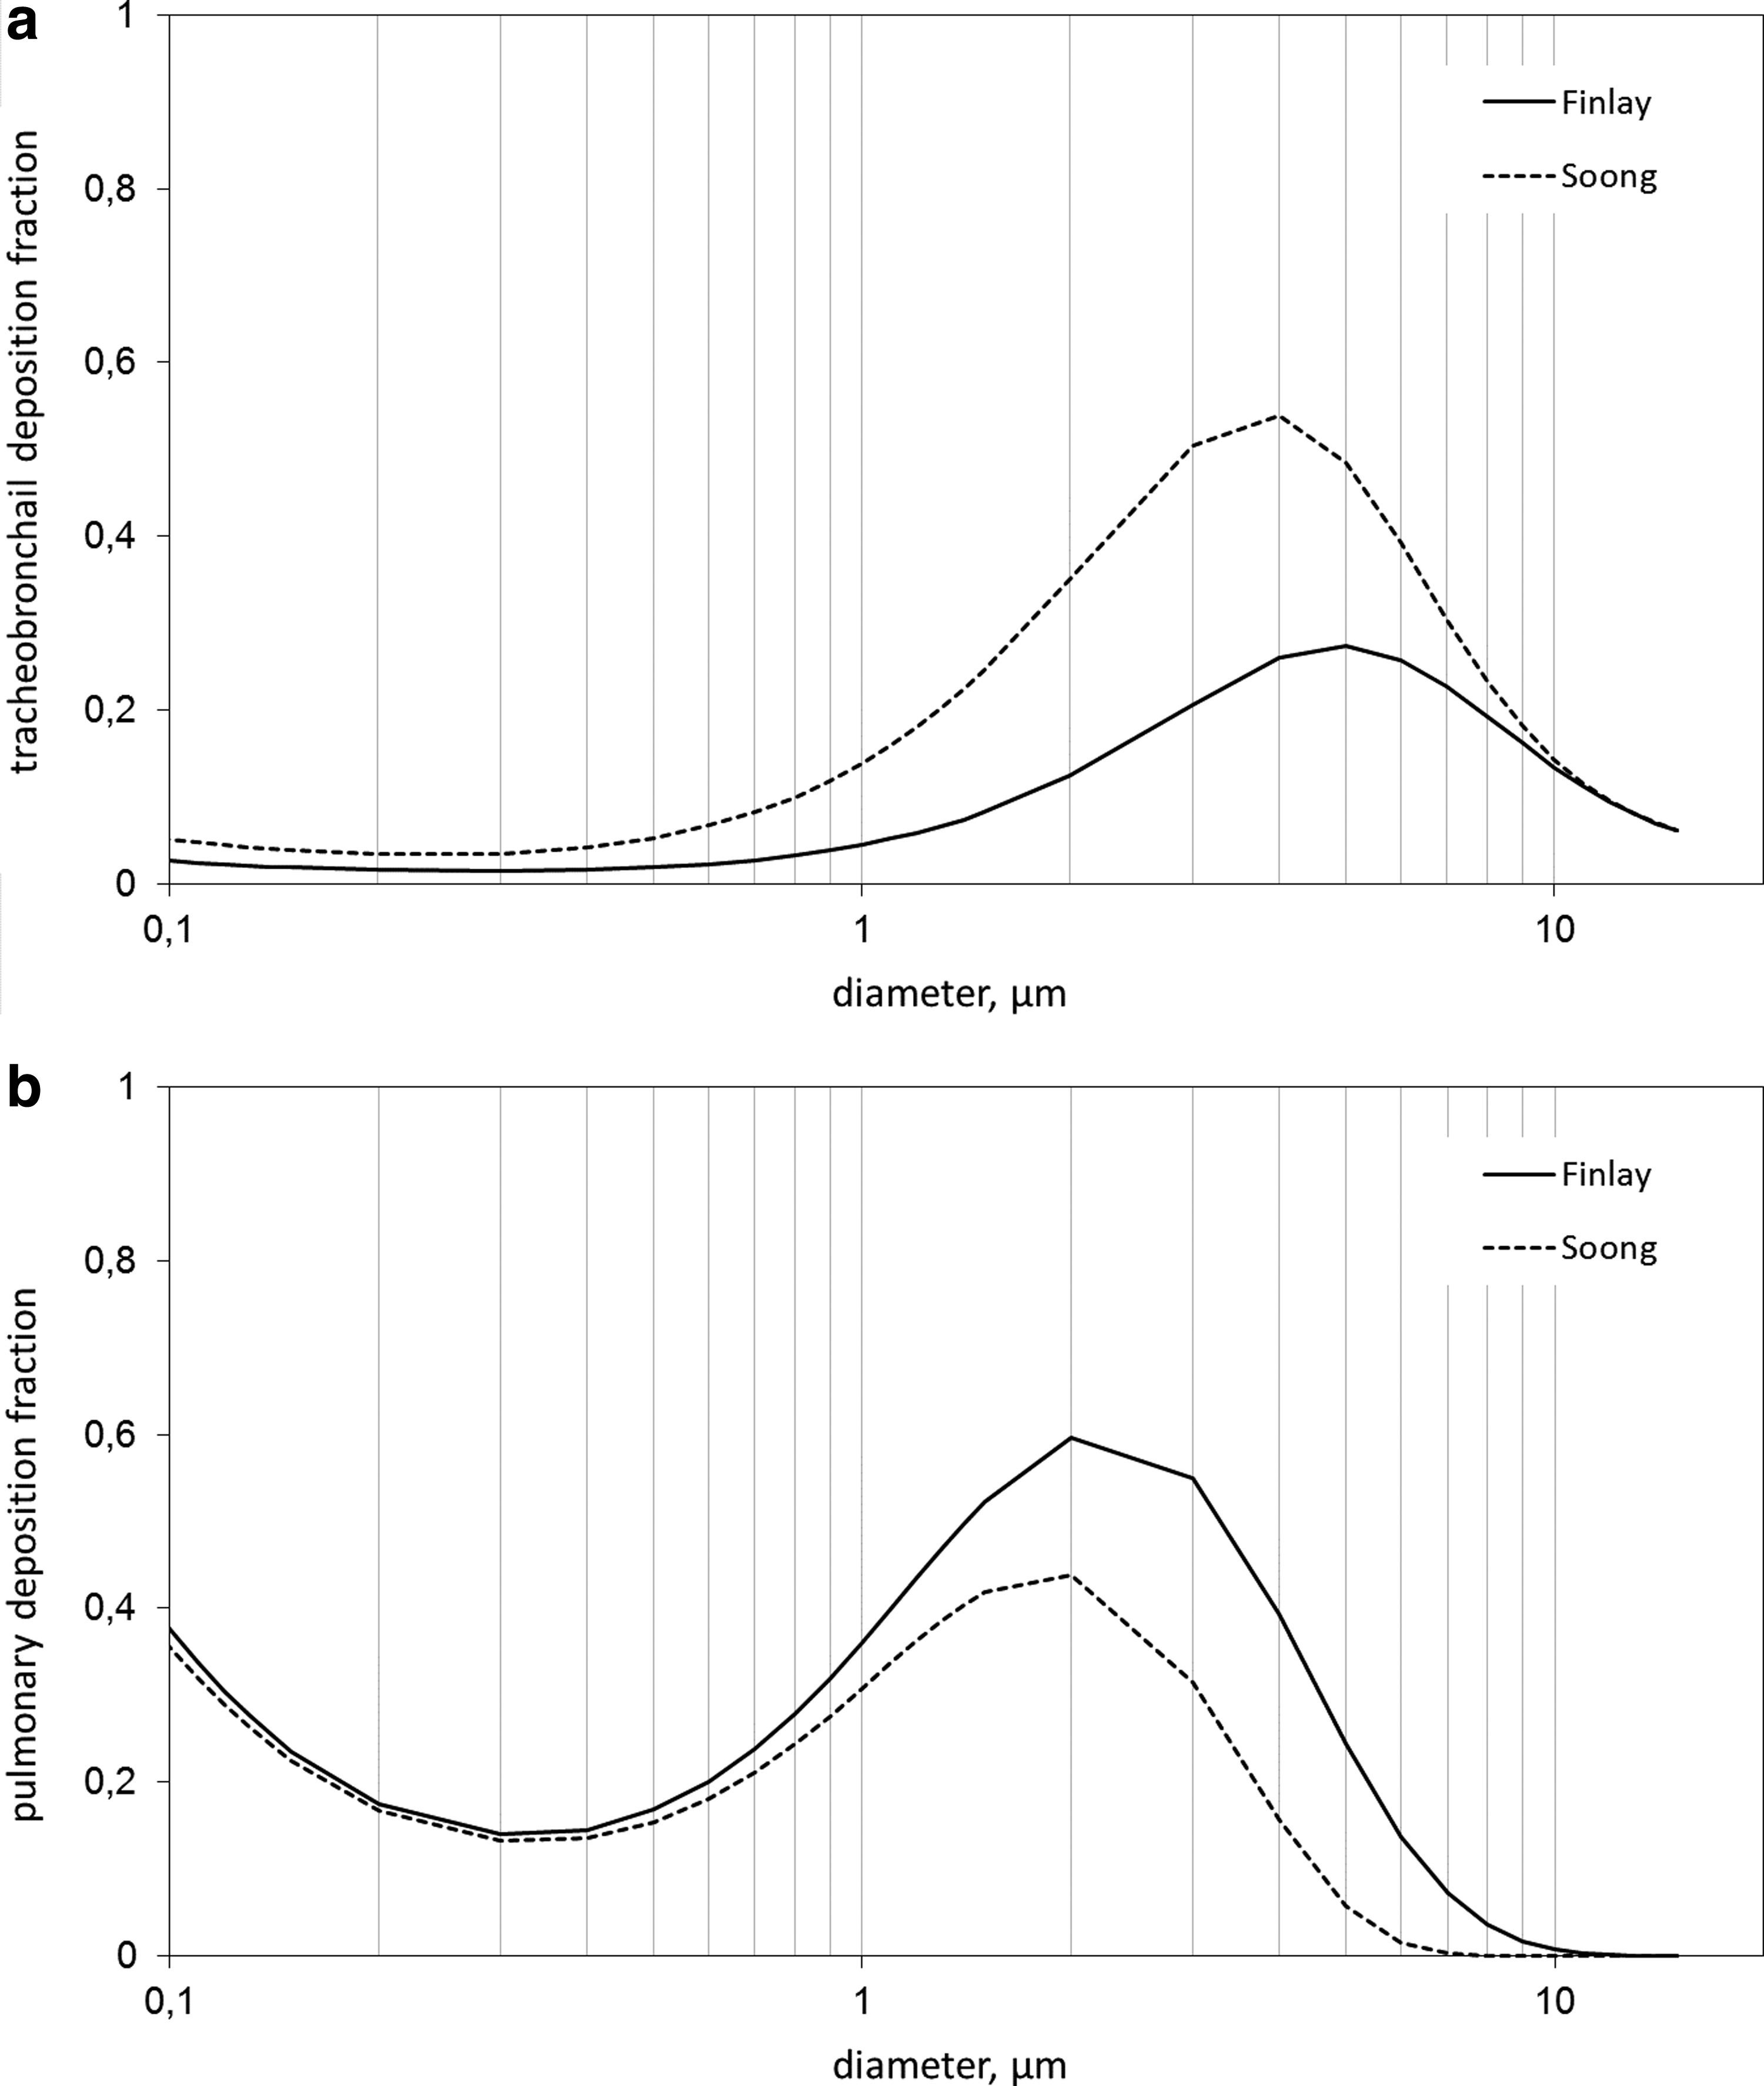
The predicted mass fraction of a monodisperse powder deposited
The ratio of pulmonary to TB deposition as a function of particle size is shown in Figure 2 and a monotonic decrease is observed over the entire size range. For larger particle diameters, this behavior is evidently the result of increasing deposition at the first generations and thus decreasing availability of particles deep in the lung. The continuous increase of the ratio with decreasing particle diameter at the small size end of the range must be interpreted in a different way. Small particles deposit weakly along the airways, and thus a large percentage reaches the pulmonary region. Efficient mixing inside the alveolar volumes results in higher particle residence times there and, therefore, in higher deposition rates. This phenomenon, that is, the trapping of particles inside alveoli during the entire exhalation phase because of the continuous mixing (sometimes called kinematic irreversibility) has been instrumental in many modeling efforts.(29)
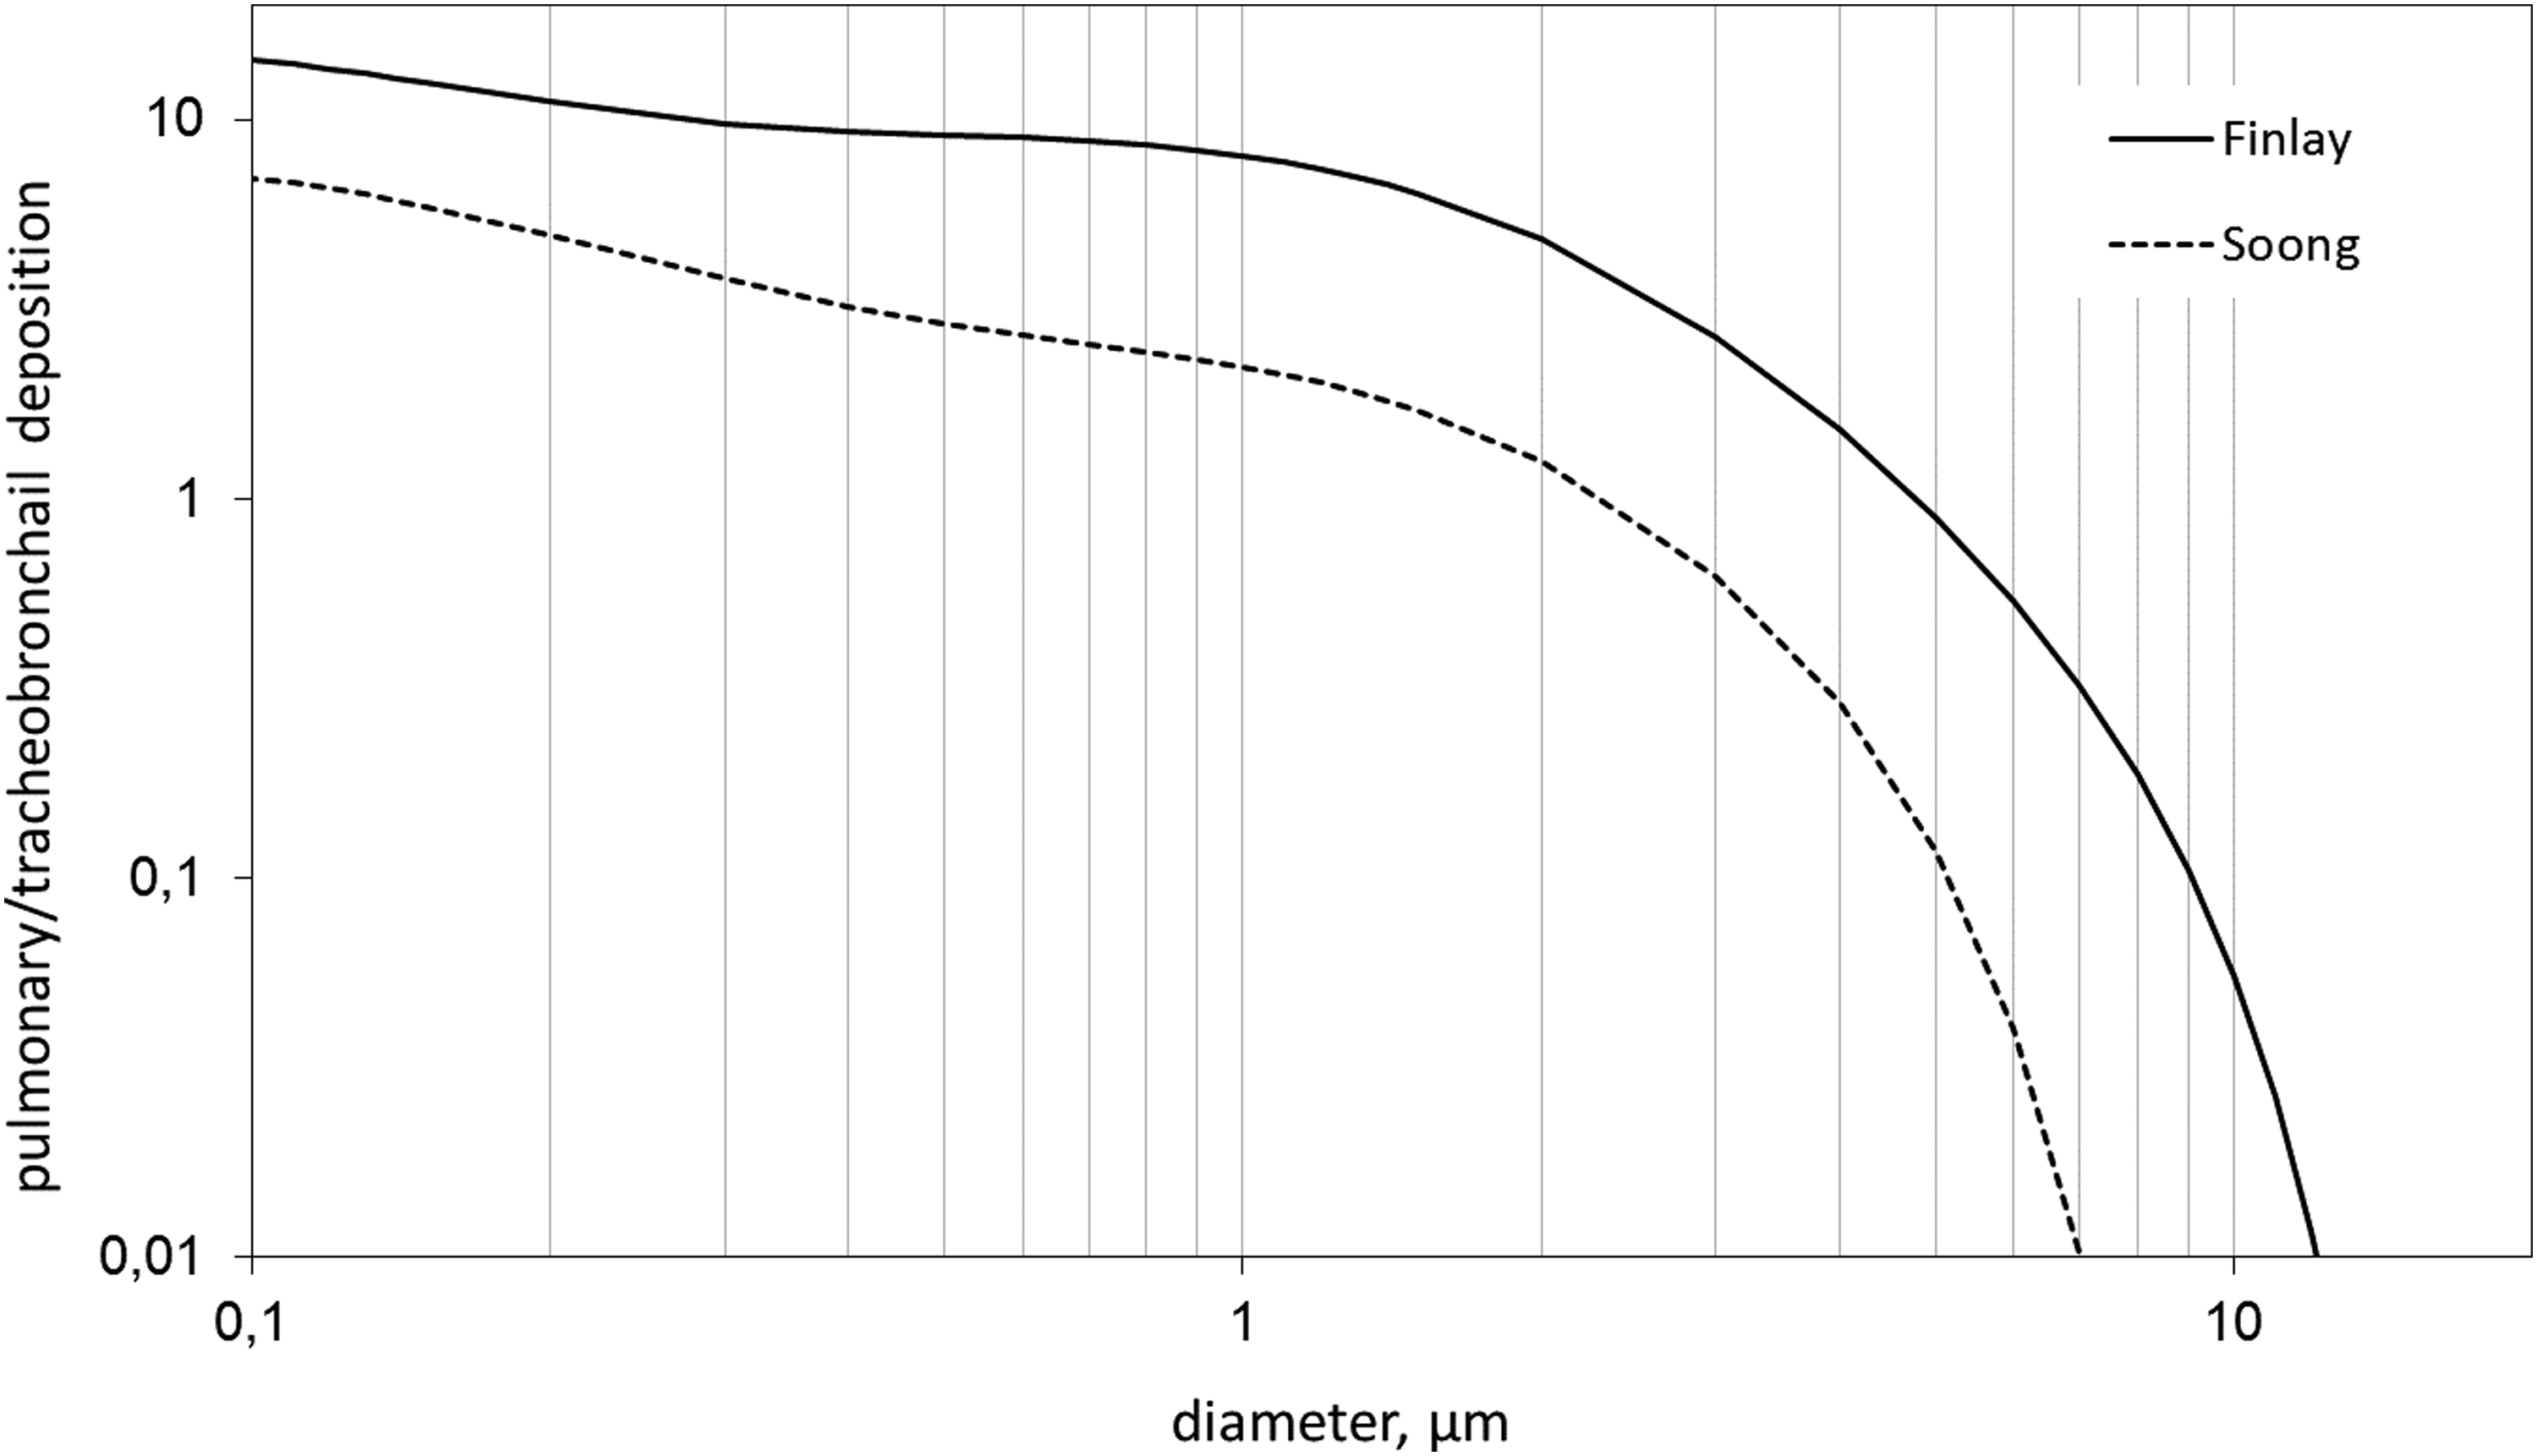
The predicted ratio of pulmonary to tracheobronchial deposition of a monodisperse powder as a function of particle diameter. The curves correspond to the two different respiratory tree models used.
Despite the aforementioned common trends, it is evident from Figures 1 and 2 that the interchange of “Finlay” and “Soong” models results in significant quantitative differences. More specifically, the former predicts higher pulmonary and lower TB deposition over the entire particle diameter range. These differences may be viewed as a measure of the uncertainty in the present predictions.
Considering further the implications of the above uncertainty, it is noted that the results of Figure 1b are of particular interest for systemic drug delivery, as the target area would probably involve the acinus. On the other hand, bronchodilation drugs for asthma target the conducting bronchioles, because smooth muscle is predominantly located there.(30) In this respect, Figure 1a, which contains the entire TB deposition, might be somewhat misleading. The calculation of deposition only in the conducting bronchioles (comprising generations 4–14 and 4–16, respectively, in the “Finlay” and “Soong” models), which may be more relevant, gives the results plotted in Figure 3. It is observed that the difference between the two curves in Figure 3 is less dramatic than in Figure 1a.
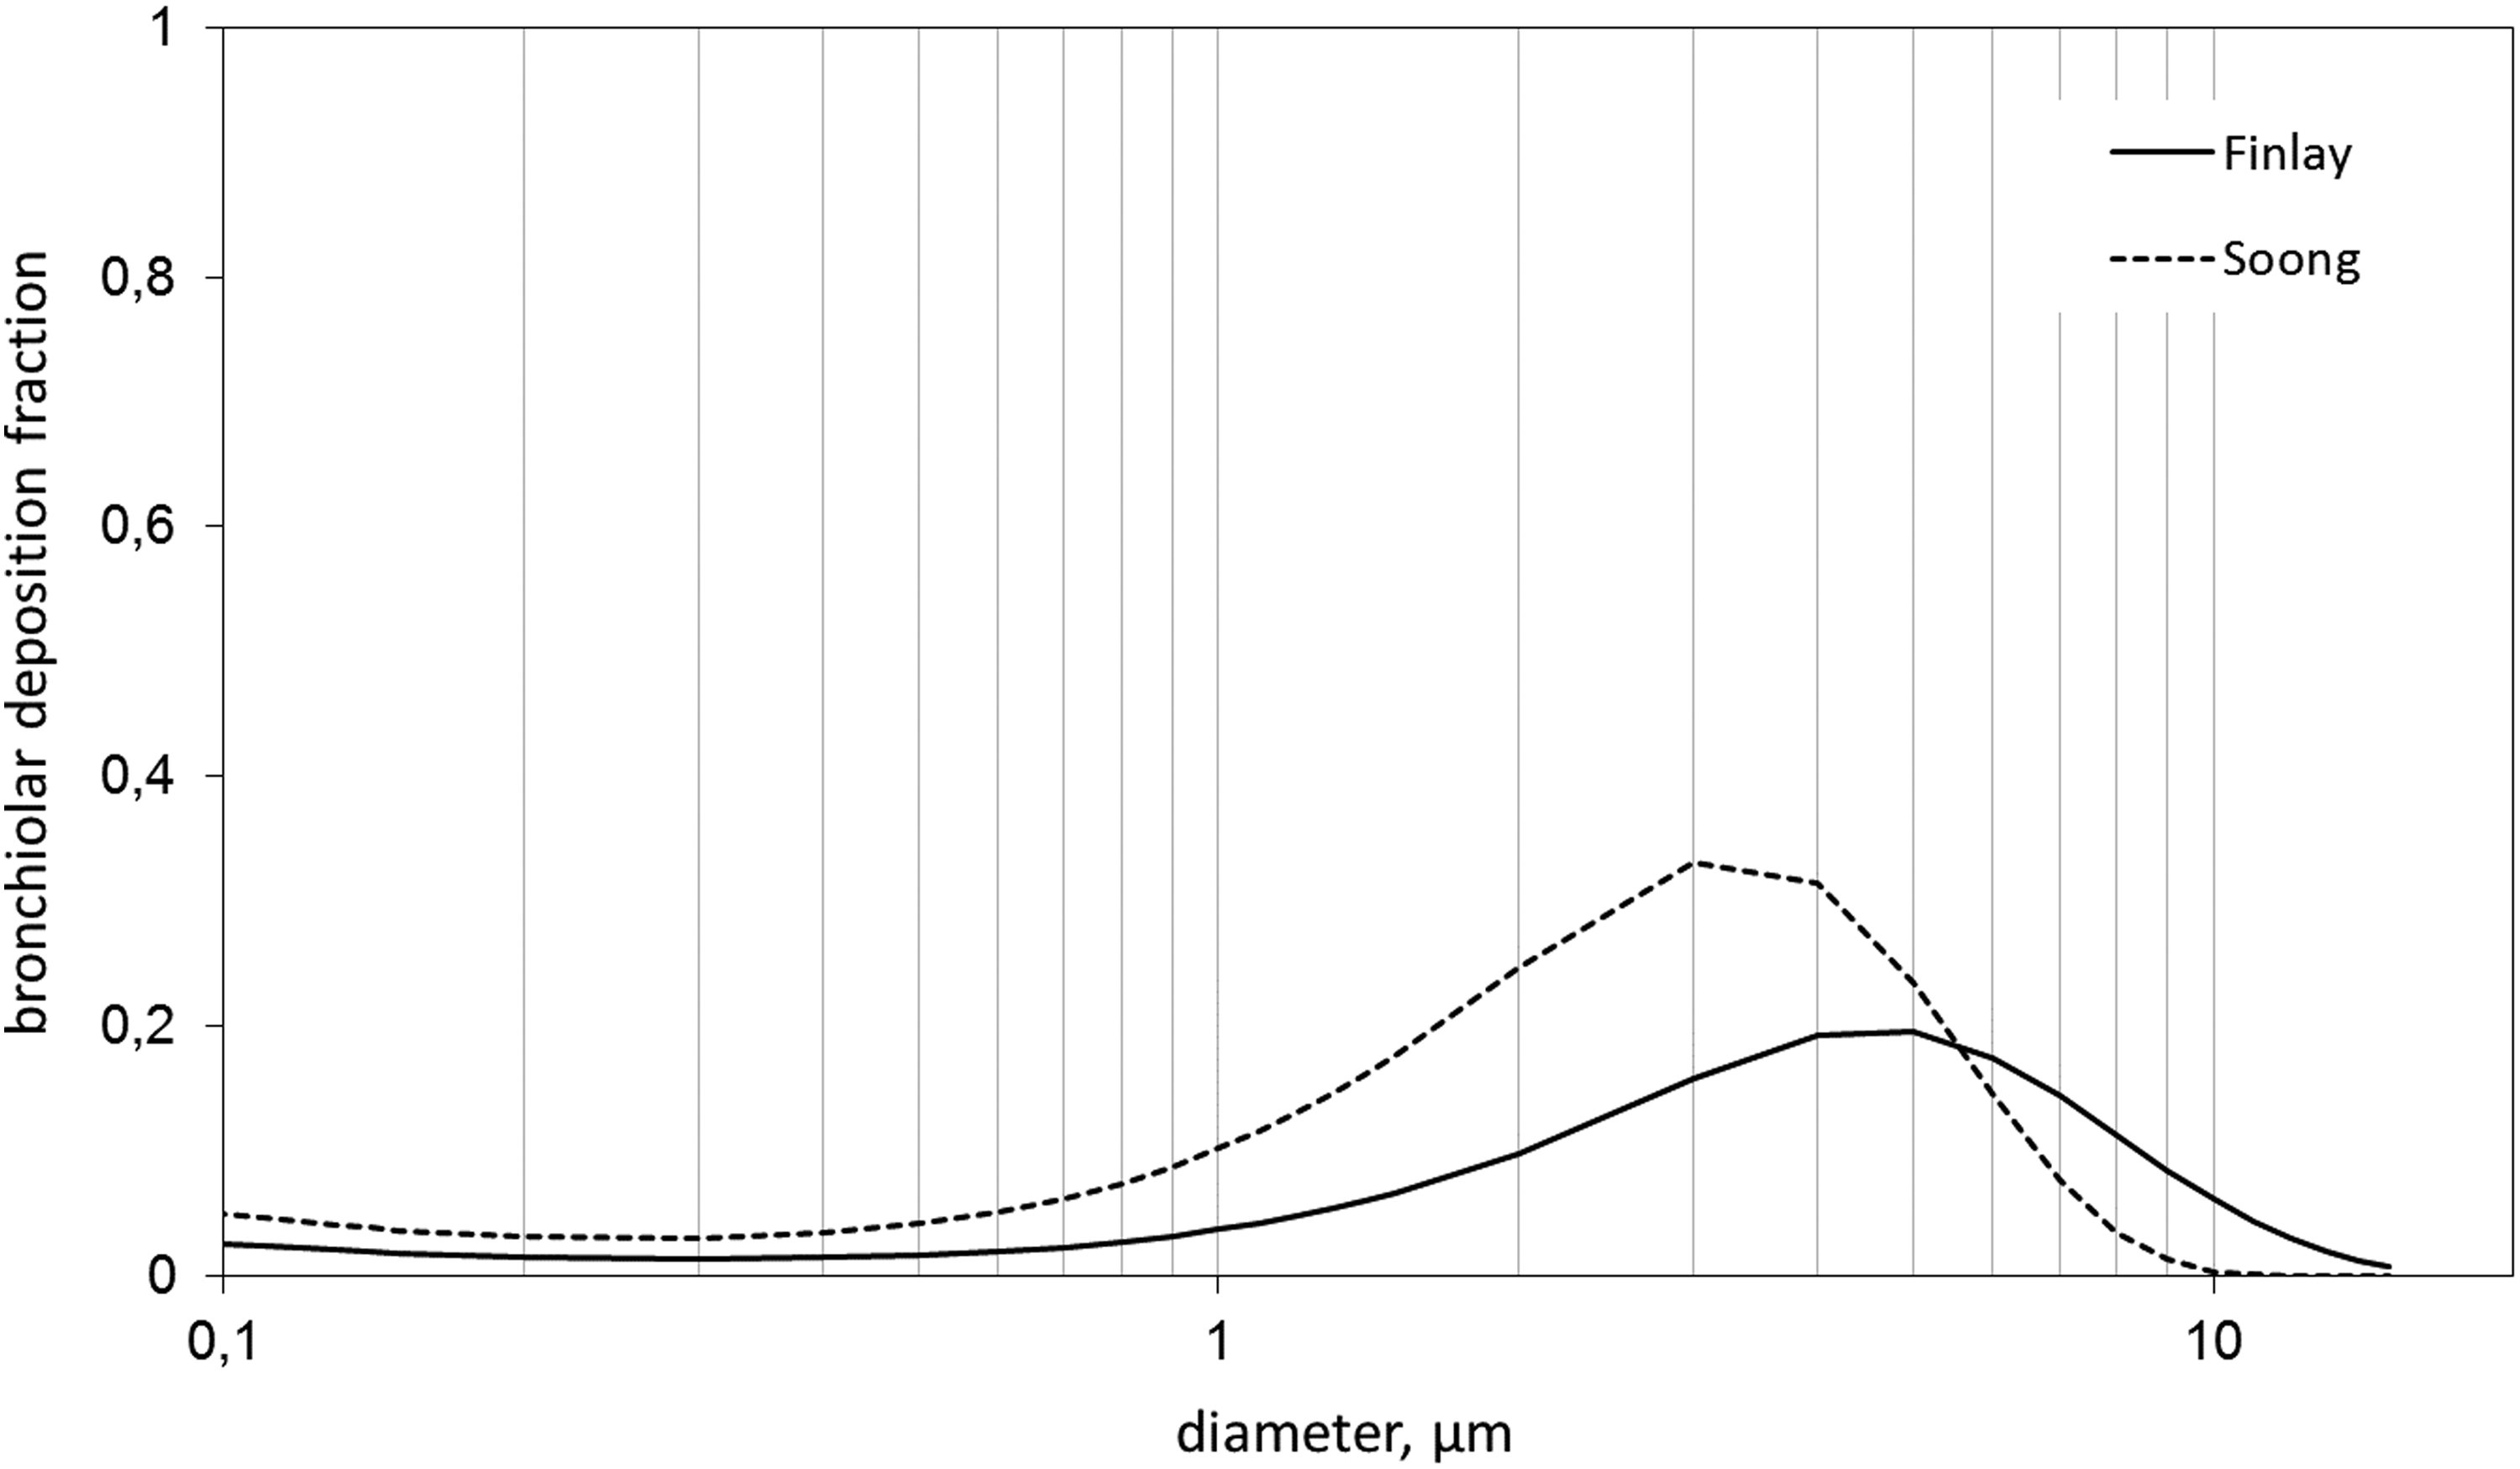
The predicted mass fraction of a monodisperse powder deposited in the conducting bronchioles as a function of particle diameter. The curves correspond to the two different respiratory tree models used.
It is also worth considering that all the above predictions—and in particular the dependence on the assumed respiratory tree model—are based on the characteristics of a healthy, adult lung, and large discrepancies may occur for variations of airway geometry related to age or disease. Such variations are expected to be significant for the asthmatic lung, which is typically characterized by reversible and nonhomogeneous airflow obstruction. However, there is evidence(31,32) suggesting that the narrowing of airways in asthma results in less penetration of the drug particles and consequently more deposition along the conducting airways. In this sense, the predictions of Figure 3 may be considered as a conservative estimate of conducting bronchiolar deposition.
Prediction of deposition of Fluticasone propionate and Salmeterol
Next, the computational model is employed to predict the deposition along the respiratory tract of dry powders of Fluticasone propionate and Salmeterol, using the specific particle size distributions measured in vitro with ELPENhaler. Distributions have been determined for the first five and last five blisters from a number of devices. Indicative data for three devices are presented in Table 1 for Fluticasone propionate and in Table 2 for Salmeterol. These data have been arithmetically averaged to get a representative mass loading, which is subsequently used in the computations.
Based on the cutoff diameters of Tables 1 and 2, we define the size classes d < 0.4, 0.4–1.1, 1.1–3.3, 3.3–4.7, 4.7–5.8, 5.8–9.0, and >9 μm. The deposition pattern of each size class is estimated by a computation at the mean diameter of the class. To predict the deposition of the entire drug dose, the results for each mean diameter are combined using as weighting factor the above representative mass loadings per size class. This methodology, that is, the summation of independent contributions from each particle size, is justified, provided the aerosol is dilute enough for particle–particle interactions to be neglected, an assumption generally valid for pharmaceutical applications.(3) Computations are performed for both the “Finlay” and the “Soong” tree geometries and their arithmetic average is used. The variation between the two computations is taken as an estimate of the uncertainty in the prediction.
Detailed results are shown in Figure 4 for Fluticasone propionate and in Figure 5 for Salmeterol. In both cases, pulmonary deposition is dominated by particles in the range 1–6 μm, with a distinct peak around 3 μm. Tracheobronchial and bronchiolar deposition is more uniformly distributed in the particle range 2–9 μm. In all cases, the contribution of very fine (d < 1 μm) and of very large (d > 9 μm) particles is negligible.

The predicted localized deposition of Fluticasone propionate as a function of diameter class, for the actual particle size distribution measured in vitro.
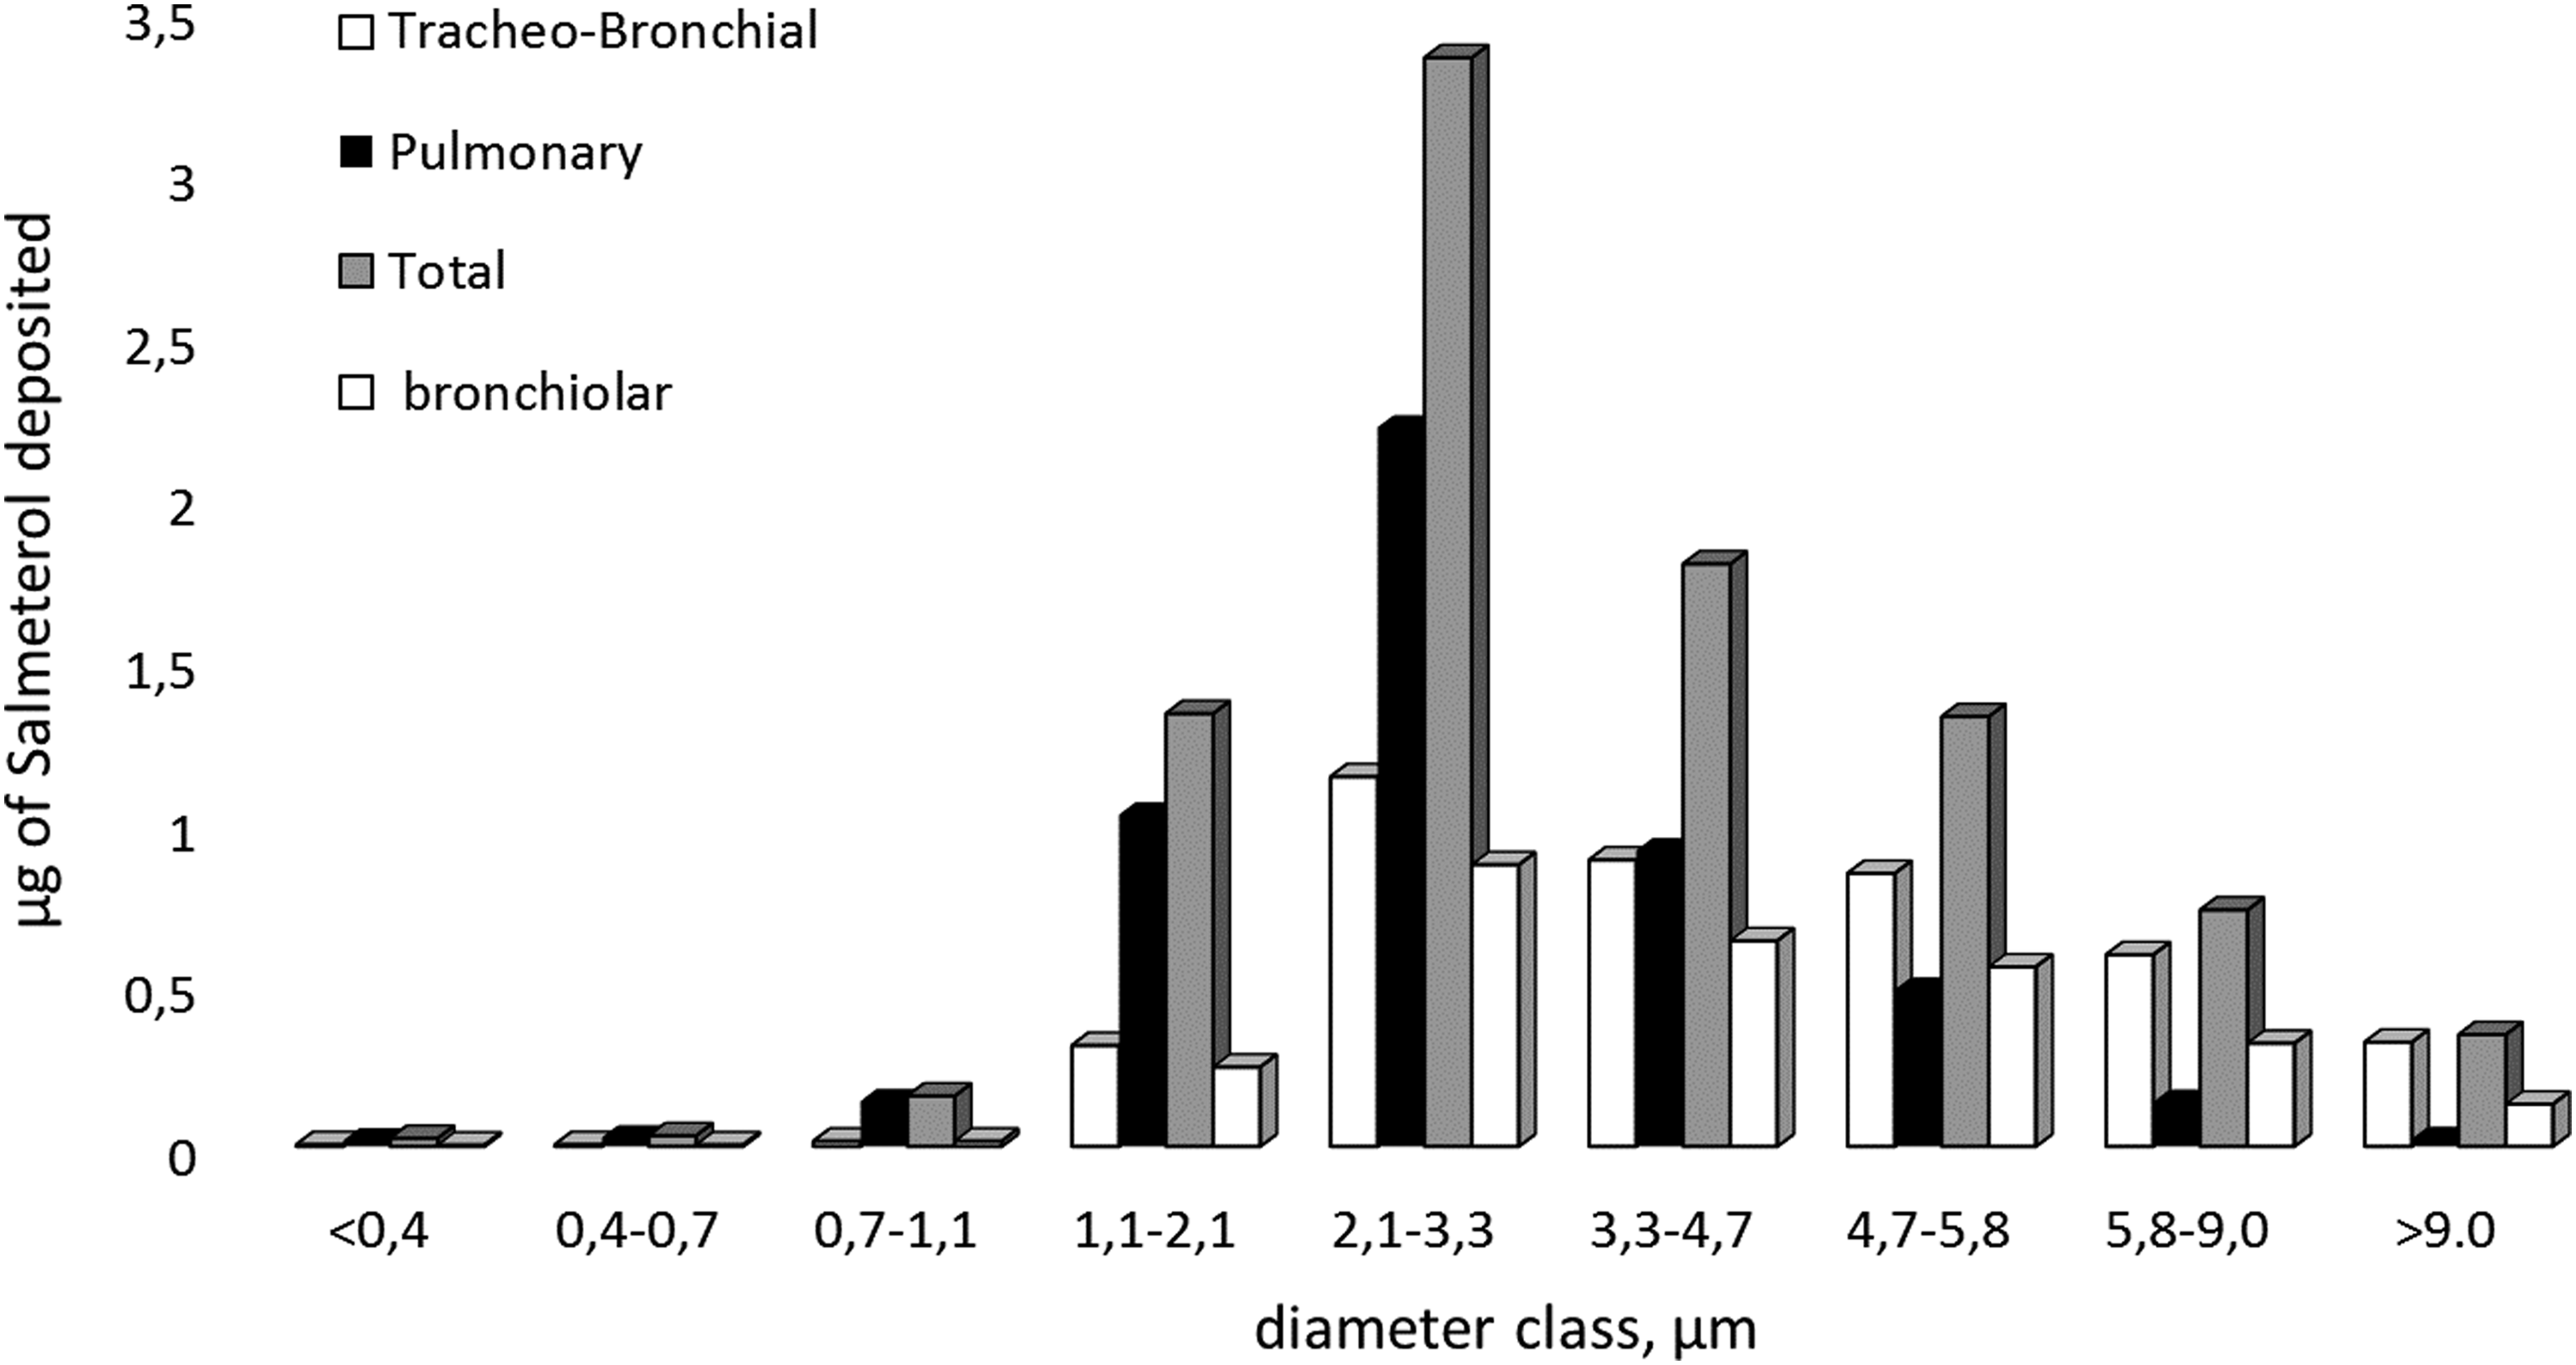
The predicted localized deposition of Salmeterol as a function of diameter class, for the actual particle size distribution measured in vitro.
The predicted overall deposition effectiveness of the product is as follows: For Fluticasone propionate, out of a dose of 480 μg (143 μg with d < 5.8 μm), 97(±2) μg deposits. This total deposition is distributed as 52(±13) μg in the pulmonary region and 45(±16) μg in the TB region. Out of the latter, 30(±7) μg deposits in the conducting bronchioles. For Salmeterol, out of a dose of 46 μg (13 μg with d < 5.8 μm), 9(±0.2) μg deposits. This total deposition is distributed as 5(±1) μg in the pulmonary region and 4(±1) μg in the TB region. Out of the latter, 3(±0.5) μg deposits in the conducting bronchioles. Thus, as a general estimate, about 20% (±0.5) of the dose deposits in the lung, 11% (±3) of which in the pulmonary, and 9% (±3) in the TB region. Out of the latter, 6.5% (±1.5) deposits in the conducting bronchioles.
It is observed that the predictions of overall deposition are insensitive to the model of tree geometry used. On the contrary, the split between pulmonary (PU) and TB deposition varies significantly, with the ratio PU/TB estimated as 1.1 (0.6–2.2) for Fluticasone Propionate and 1.2 (0.7–2.2) for Salmeterol. These values agree—both in mean and range—with the ratio of peripheral to central zone deposition, measured by gamma scintigraphy for aerosols with similar fine particle fractions.(33–35)
However, as was recently noted,(36) there are significant difficulties in comparing directly in silico to in vivo data, and a combination in vitro–in silico approach is recommended. In particular, the above comparisons are only indicative, as gamma scintigraphy—although being an excellent method for determining extrathoracic deposition—offers only a rough estimate of the depth of penetration. Indeed, due to the two-dimensional nature of the method, overlying alveolar deposition may artificially increase the measured central/intermediate deposition well over the true value corresponding to the conducting airways dose.(30)
Correlation of predictions with the FPD
The FPD is an in-vitro tool used by the pharmaceutical industry to estimate the aerosol deposition to the lung. Indeed, there is ample evidence(37) that the FPD correlates well with the whole lung deposition (WLD), although the ratio FPD/WLD is always higher than one and varies with the kind of inhalation device. The predicted ratios for the presently considered product are 1.48 for Fluticasone propionate and 1.47 for Salmeterol. These values are typical for DPIs (mean 1.50, with range 1.10–1.94(37)) and thus argue in favor of the accuracy of our simulation.
A related but different question is whether the FPD may be used to predict the split between pulmonary and TB deposition. To investigate this question, predictions are recalculated for specifically modified particle size distributions. In particular, the Fluticasone propionate dose is formulated with 17% more fine particles than the standard, with the size distribution shown in Figure 6, and the Salmeterol dose with 37% more fine particles than the standard, with the size distribution shown in Figure 7. Based on the modified particle size distributions, it is predicted that Fluticasone propionate will increase WLD by 14%, split into 11.5% increase in pulmonary, and 16.5% increase in TB deposition, and Salmeterol will increase the WLD by 32%, split into 42% increase in pulmonary, and 20% increase in TB deposition.
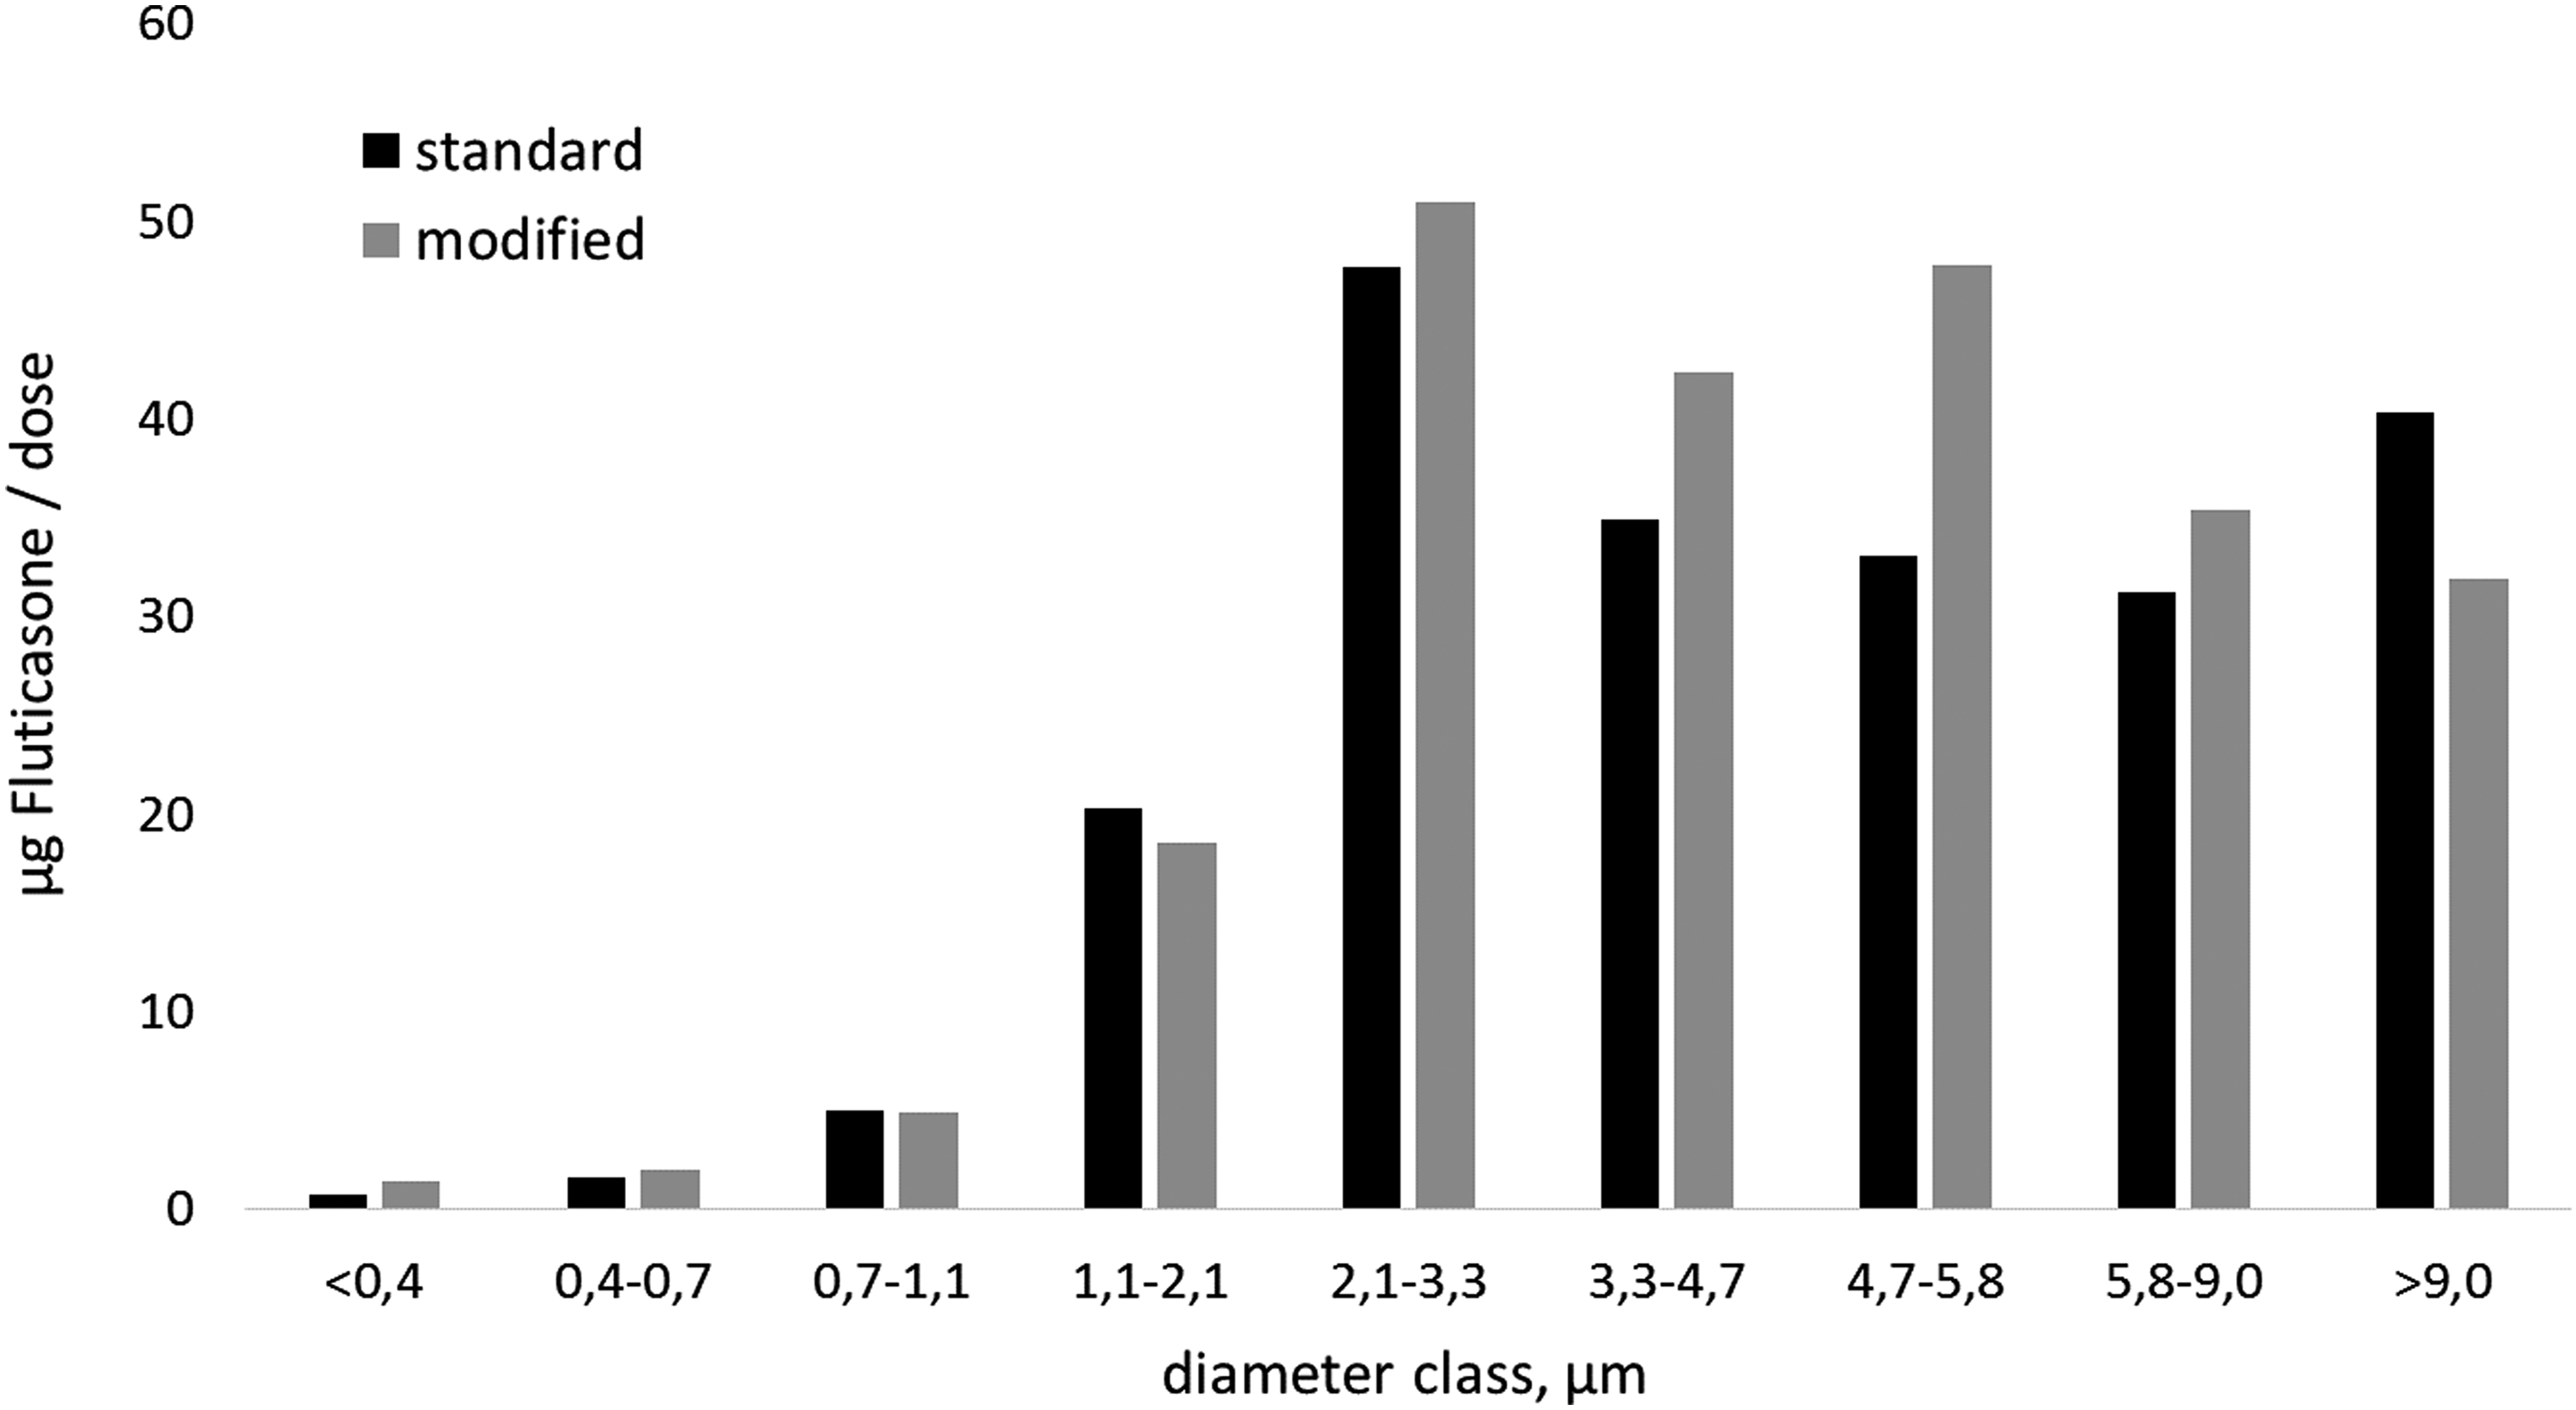
The measured mass of Fluticasone propionate per diameter class in the standard and the modified dose.

The measured mass of Salmeterol per diameter class in the standard and the modified dose.
The above results for the modified particle size distributions show that the FPD is still a good predictor of WLD, but is a bad predictor of the PU/TB ratio. Indeed, although the FPD is increased for both drugs, the ratio of pulmonary to TB deposition increases significantly for Salmeterol, but decreases slightly for Fluticasone propionate. This discrepancy is a result of the large difference in pulmonary deposition predicted for the two drugs. One possibility for an improved predictor would be to define a modified FPD (e.g., d < 3 μm(33)) and indeed it appears that such a definition might correlate better with our results of pulmonary deposition. However, it is argued that the use of a simple simulation like the present one, in combination with standard cascade impactor results, is a more satisfactory predictive tool of the regional deposition pattern in the lung.
Conclusions
A novel, one-dimensional model is employed to estimate deposition along the respiratory tract of dry powders containing Fluticasone propionate and Salmeterol. The model uses as input standard particle size measurements, which were presently conducted in a cascade impactor operated with 70 L/min air flow. The novelty of the model is in the treatment of the alveolar space of each generation as an efficiently mixed chamber, a hypothesis motivated by the discovery that chaotic convection takes place in the alveoli. It is noted that the present approach is in line with other recent works(38,39) that aim to model more realistically the role of the acinus in breathing dynamics and particle deposition.
The simulation is first used to identify optimum particle size ranges when targeting the pulmonary or TB region and to determine the variation of the ratio of pulmonary to TB deposition. Two popular models of pulmonary tree geometry are used, to estimate the uncertainty from variations in airway size. Then, the deposition patterns of Fluticasone propionate and Salmeterol powders are calculated for the actual particle size distributions found in vitro in the marketed product (ELPENhaler). For both drugs, it is predicted that roughly 20% of the delivered dose deposits intrathoracically, and these predictions vary little with the tree geometry used. On the contrary, the split between pulmonary and TB deposition depends strongly on the tree geometry, with the ratio PU/TB varying in the range 0.6–2.2. Specifically modified particle size distributions with increased FPD are considered in an attempt to test computationally the predictive power of FPD. It is concluded that the FPD is a good predictor of WLD, but is not by itself a reliable predictor of the split between pulmonary and TB deposition.
Finally, it is noted that a key limitation of the present implementation of our model is its inability to compute particle deposition in an asthmatic lung with asymmetric generational constrictions, that is, with diseased and healthy bronchioles at the same generation level. However, there is no fundamental obstacle in the application of perfect mixing assumption for the alveolar volumes, and the main difficulty is in the solution of an asymmetric ventilation problem. More specifically, with healthy airway geometry data, all pathways from the trachea to alveolar sacs are equivalent and ventilation is described by one value of air flow per generation. A plausible approach for the asymmetric case would be to define multiple pathways, corresponding to different exposures to diseased airways. The flow rate through each branch of the network of pathways could then be estimated by a pressure-drop calculation, applying an appropriate boundary condition at the distal end, that is, the alveolar volumes.
Footnotes
Acknowledgments
Partial financial support of this research by a donation from ELPEN Pharmaceutical is gratefully acknowledged. The authors deeply appreciate the many insightful comments by the reviewers, which led to significant improvement of the article.
Author Disclosure Statement
No competing financial interests exist.