
Abstract
Abstract
Background:
Model predictions of regional deposition in the respiratory tract are useful in assessing factors that influence the effectiveness of aerosol delivery. Regional deposition models have previously been coupled with models of mucous production and clearance to estimate initial concentrations of drug deposited in the airway surface liquid (ASL) lining tracheobronchial airways.
Methods:
Established models of regional deposition and ASL volumes were used to provide input to a new model evaluating the disposition of drug resulting from dissolution or release, absorption, and mucociliary clearance. Additional modeling of oral absorption, distribution, and elimination allowed prediction of systemic exposure. Herein, predicted ASL and plasma concentrations of free (dissolved or unencapsulated) ciprofloxacin over time are reported for a healthy, adult lung model following inhalation of single doses of nebulized liposomal (6 mL of liposomal ciprofloxacin for inhalation, 50 mg/mL, or 6 mL of Pulmaquin, 210 mg; Aradigm) and dry powder (32.5 and 65 mg doses; Bayer) formulations.
Results:
Over a range of mucous production rates and tracheal clearance velocities, peak ASL concentrations of free ciprofloxacin were consistently greater for Pulmaquin than for other formulations investigated, owing to the presence of free drug in the nebulized Pulmaquin formulation. The time that ASL concentrations of free drug remained above the minimum inhibitory concentration for Pseudomonas aeruginosa was similar for all four formulations. Predicted plasma ciprofloxacin concentration profiles were in good agreement with available data from Phase I trials in healthy volunteers.
Conclusions:
Predictions of ASL drug concentrations over time are valuable in elucidating the roles of deposition, drug release or dissolution, and disposition on the effectiveness of inhaled aerosol therapies. For inhaled ciprofloxacin, the present results predict similar ASL concentrations of free drug over time following single doses of inhaled liposomal and dry powder formulations. The impact of multiple doses and airway disease warrants further consideration.
Introduction
M
In contrast, analytical models have been developed to predict deposition down to the level of individual airway generations, typically relying on algebraic equations that predict deposition probabilities due to individual mechanisms: most commonly, inertial impaction, gravitational sedimentation, and Brownian diffusion.(5–11) However, validation of deposition predictions at the level of airway generations remains a challenge,(12) and additional analysis is required to relate deposited drug fractions to more meaningful predictors of therapeutic effect.
One approach used previously is to combine analytical deposition modeling with estimation of the distribution of airway surface liquid (ASL) volume through the tracheobronchial airways.(13–17) This approach allows both the deposited drug mass and ASL volume to be predicted at each airway generation. Where the aerosol formulation contains freely soluble drug in solution or solid-state drug that rapidly dissolves in the ASL, the ratio between deposited drug mass and ASL volume may be interpreted as the initial concentration of drug in the ASL. The distribution of initial ASL drug concentrations through the airways can then be compared with concentrations associated with efficacy in vitro, or in animal models, to infer whether or not effective drug concentrations are predicted for a given combination of model input parameters, including the aerosol size distribution, the breathing pattern or inhalation maneuver, the lung volume, and other parameters. Such analysis has been previously performed for aerosol delivery of mucolytics,(16) D-amino acid mixtures,(15) and antibiotics.(13,14,17)
While the ability to estimate aerosol deposition and associated initial ASL drug concentrations is valuable in the design and analysis of aerosol drug delivery systems, prediction of drug disposition subsequent to deposition is equally valuable. A description of disposition, used herein to encompass drug release or dissolution, mucociliary clearance, pulmonary metabolism, and absorption, is a critical consideration in assessing the effect, and the duration of effect, of an inhaled drug product.(18,19) Recently, compartmental models of disposition processes have been used in combination with assumed or modeled regional deposition patterns to predict systemic exposure following aerosol drug delivery.(20,21)
In the present work, we describe a three-part model linking aerosol deposition, ASL volumes, and disposition processes. The model enables prediction of ASL drug concentrations over time following inhalation, as a function of the initial deposited dose, local ASL volume, and competing processes of drug release or dissolution, mucociliary clearance, and absorption. Additional modeling of oral absorption, distribution between central and peripheral body compartments, and elimination allows prediction of systemic exposure, for comparison with available pharmacokinetic (PK) data.
As a representative study, the model was used to compare ASL drug concentrations between liposomal and dry powder formulations of inhaled ciprofloxacin. As with other inhaled antibiotics, inhaled ciprofloxacin offers the potential to achieve much greater drug concentrations in the lungs and lower systemic drug concentrations, compared with oral or intravenous administration.(22,23) Ciprofloxacin appears to exhibit a blend of concentration-dependent and time-dependent antimicrobial activity(24); therefore, both the initial deposited dose and the maintenance of ASL drug concentrations over time may play critical roles in the treatment of lung infections with inhaled ciprofloxacin.
Accordingly, liposomal formulations of ciprofloxacin for inhalation (CFI) have been developed with the intent of providing a sustained release profile in the lungs, so as to maintain drug concentrations above the minimum inhibitory concentration (MIC) without need for frequent administration.(22) The rate of release from liposomes, relative to absorption and clearance, is likely to be an important determinant of ASL drug concentrations over time. For dry powder formulations of ciprofloxacin, dissolution of deposited particles in the lungs appears to be solubility-limited,(25) such that timing of competing disposition processes is again likely to be important in determining drug concentrations over time. The present model calculations provide comparative estimation of the time course of ciprofloxacin concentrations in the ASL after inhalation of liposomal or dry powder formulations, with the aim of identifying any differences that may influence the effectiveness of inhaled ciprofloxacin in treating lung infections.
Materials and Methods
Cases studied
Model calculations of regional ciprofloxacin ASL concentrations over time were performed for four cases. The first, referred to below as CFI (Aradigm Corp., Hayward, CA), modeled 300 mg liposomal ciprofloxacin contained in 6 mL solution, delivered using a PARI LC Sprint nebulizer (PARI GmbH, Starnberg, Germany) and standard PARI Vios compressor. The second, referred to as Pulmaquin (Aradigm Corp., Hayward, CA), modeled 150 mg liposomal ciprofloxacin and 60 mg free ciprofloxacin in 6 mL solution, again delivered using a PARI LC Sprint nebulizer and standard PARI Vios compressor.
The third and fourth cases represented single-capsule and two-capsule doses of ciprofloxacin dry powder for inhalation (Bayer Pharma AG, Berlin, Germany) delivered using the T-326 inhaler (Novartis Pharmaceuticals, San Carlos, CA). These cases are referred to below as the 32.5 and 65 mg DPI cases, respectively, corresponding to the nominal dose of ciprofloxacin in each capsule. Throughout this article both CFI and Pulmaquin ciprofloxacin concentrations and doses are expressed in terms of the ciprofloxacin hydrochloride salt form. To allow comparison to the ciprofloxacin content in the dry powder formulations, the ciprofloxacin base form is calculated by multiplying the ciprofloxacin hydrochloride salt form by 0.90.
Aerosol deposition model
Regional drug deposition in the extrathoracic, tracheobronchial, and alveolar airways was modeled using a well-established analytical aerosol deposition model.(5–7,26–29) Briefly, the model adopts the symmetric lung model proposed previously by Finlay et al.(16) with a functional residual capacity of 3 l. Extrathoracic deposition was predicted using correlations developed by Golshahi et al.(30) for lower inhalation flow rates consistent with tidal breathing and by Grgic et al.(31) at higher inhalation flow rates typically employed in inhalation maneuvers used with single-breath inhalers. In the thoracic airways, deposition probabilities were predicted using equations provided by Chan and Lippmann(32) for inertial impaction, by Heyder(33) and Heyder and Gebhart(34) for gravitational sedimentation, and by Ingham(35) for diffusion.
For the two liposomal formulations, CFI and Pulmaquin, a representative tidal breathing pattern for a healthy normal adult was used in deposition calculations: tidal volume was 790 mL, breathing frequency was 14 min−1, and the inspiratory:expiratory ratio was 1:1, with no pause between exhalation and inhalation. These parameters were selected based on average values previously measured in vivo for healthy volunteers breathing saline aerosol through LC-Star nebulizers (PARI GmbH, Starnberg, Germany).(36)
A lognormal aerosol size distribution with volume median diameter = 4.3 μm and geometric standard deviation (GSD) = 2.1 was used for both CFI and Pulmaquin cases, consistent with a range of lognormal size distribution parameters previously reported for CFI based on laser diffraction or cascade impaction.(37,38) Droplet density was assumed to be 1000 kg/m3. For CFI, an inhaled dose of 105 mg encapsulated ciprofloxacin was specified, based on an estimate of 70% nebulization efficiency with 50% of nebulized drug inhaled.(39,40) For Pulmaquin, an inhaled dose of 52.5 mg encapsulated ciprofloxacin and 21 mg free ciprofloxacin was specified, based on the same assumptions.
For the two DPI cases modeled, regional deposition fractions were calculated for a 2 L inhaled volume and an inhalation flow rate of 60 L/min. Aerodynamic size distribution data reported by Stass et al.(23) were used: mass median aerodynamic diameter (MMAD) = 3.6 μm and GSD = 2.1. As extrathoracic deposition from DPIs is device- and formulation dependent, modeled extrathoracic and total lung deposition fractions were matched directly to values obtained by scintigraphy in healthy volunteers as reported by Stass et al.(23). Total lung deposition was then distributed through the tracheobronchial airway generations and alveolar region using predicted generational deposition fractions determined by the present deposition model.
ASL model
ASL volumes in each tracheobronchial generation were determined using a previously reported model,(13–17) based on specified values of daily mucous production (DMP) and tracheal clearance velocity (TCV). The ASL model estimates the thickness of the periciliary liquid (PCL) layer and mucous layer in each tracheobronchial airway generation, treating these as two concentric annular layers. The PCL layer thickness in each generation is approximated by lengths of the cilia lining the airways, which were previously estimated by Lange et al.(14) by interpolating measurements of cilia lengths in humans made by Serafini and Michaelson.(41) Mucous layer thickness in each generation was estimated using mass conservation and a model of generational mucous velocities based on specified DMP and TCV values described previously by Finlay et al.(16)
The ASL volume in each generation was then obtained by summing PCL and mucous volumes determined from the layer thicknesses along with airway lengths and diameters. Together with predictions of generational drug deposition from the regional deposition model described above, these allowed initial ASL drug concentrations to be predicted in each tracheobronchial generation.
Three distinct combinations of DMP and TCV were used in the present work, yielding low, intermediate, and high estimates of initial ciprofloxacin ASL concentrations. These were, from low to high: DMP = 20 mL/day, TCV = 5 mm/min; DMP = 10 mL/day, TCV = 10 mm/min; and DMP = 5 mL/day, TCV = 20 mm/min. These values were selected to span a range of reported TCV and DMP rates for healthy subjects.(1,42–45)
Compartmental disposition model
A new, compartmental disposition model was developed to predict the evolution of ASL drug concentrations over time. The disposition model is illustrated schematically in Figure 1. The lungs were represented by a single alveolar compartment (ALV) along with 15 compartments corresponding to tracheobronchial airway generations 0 through 14 in the Finlay et al.(16) lung model (GEN0 through GEN14). Each of these compartments was subdivided in two, to account for encapsulated or undissolved drug (e.g., ALV1) separately from liberated, or free, drug (e.g., ALV2) released from liposomes or resulting from dissolution of solid particles.
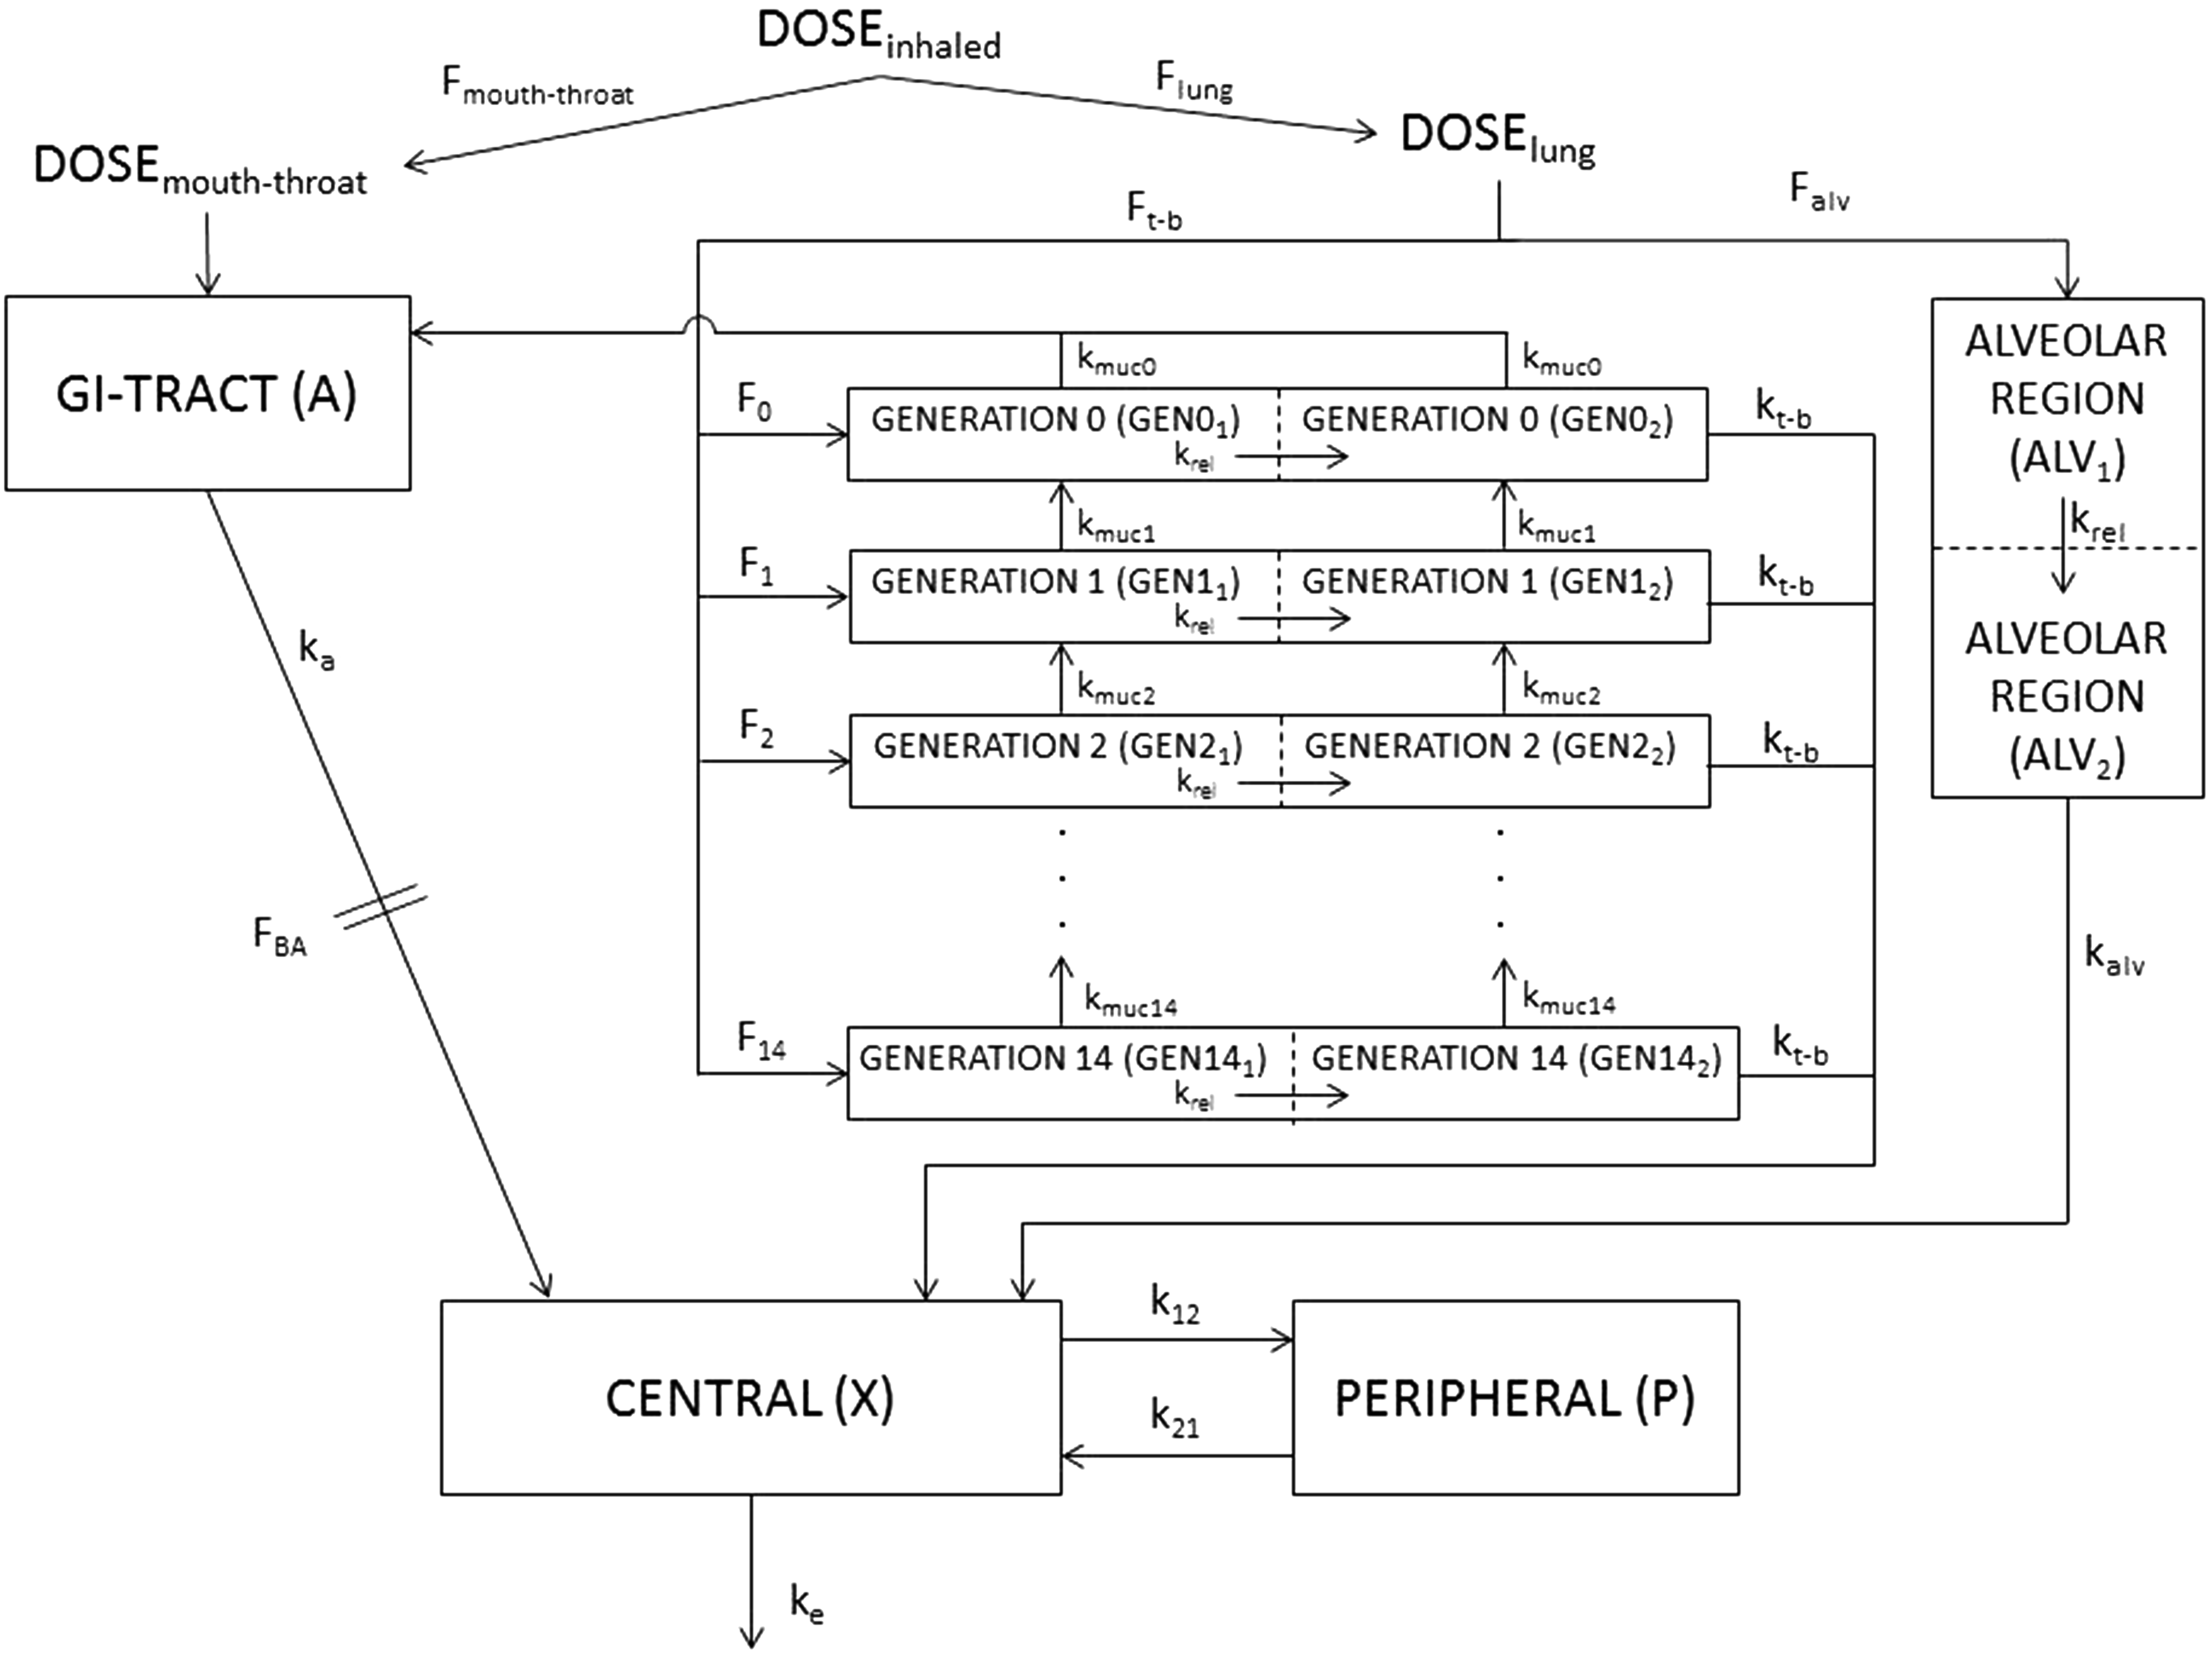
Schematic of the compartmental disposition model. Dose fractions Fi are received from the aerosol deposition model. Rate constants describe release of drug, krel, drug absorption from tracheobronchial, kt-b, and alveolar, kalv, regions, mucociliary clearance, kmuc,i, oral absorption, ka, distribution of drug between central and peripheral body compartments, k12 and k21, and elimination, ke. FBA is the bioavailable fraction from the gastrointestinal tract. Additional description of model parameters is provided in the text. Composition of the present disposition model is based on the compartmental model proposed by Weber and Hochhaus,(21) with the addition in this study of a multigenerational tracheobronchial region.
A compartment representing the gastrointestinal tract (A) was included to account for drug depositing directly in the extrathoracic, mouth-throat, airways and drug entering the gastrointestinal tract through mucociliary clearance. A standard two-compartment PK model was adopted to represent the rest of the body. The central compartment (X) represented the blood and well-perfused organs, whereas the peripheral compartment (P) represented poorly perfused tissues. The composition of the present disposition model is based on the compartmental model proposed by Weber and Hochhaus,(21) with the addition in this study of a multigenerational tracheobronchial region.
With reference to Figure 1, the disposition model receives input from the aerosol deposition model in the form of regional drug deposition fractions (Fmouth-throat, Ft-b, Falv, F0, F1, …, F14) based on a specified aerosol size distribution, lung model, and breathing pattern. First-order rate constants kt-b and kalv were used to model absorption of free drug from tracheobronchial and alveolar spaces, respectively. For the model results presented below, kt-b = 5.33 h−1 was calculated based on the absorptive half-life of free ciprofloxacin measured in vivo in lungs of mice by Yim et al.,(46) and kalv was specified as 2 × kt-b to reflect faster absorption from alveolar airways than tracheobronchial airways, similar to previous authors' assumptions.(21,47,48)
For the two liposomal formulations investigated, CFI and Pulmaquin, the rate constant krel models the release of ciprofloxacin from liposomes. Results presented below were calculated using a first-order rate constant of 0.06 h−1. This value was calculated based on the absorptive half-life of liposomal ciprofloxacin measured in mice lungs by Yim et al.,(46) under the assumption that release was the limiting factor determining the rate of absorption. This assumption appears reasonable given the much faster absorption of free ciprofloxacin observed by Yim et al.(46) In the present model calculations, only released (free) ciprofloxacin was subject to absorption, whereas both free and encapsulated drug were transported into and out of tracheobronchial generation due to mucociliary clearance.
For the two DPI cases, the first-order rate constant krel was replaced with a Noyes–Whitney process describing dissolution of deposited particles in the tracheobronchial ASL. In general, the rate of change in mass of a dissolving particle may be expressed as
where m is the mass of the undissolved particle, S is the surface area between the dissolving particle and solvent, D is the diffusion coefficient of the dissolved species in the solvent, h is the dissolution boundary layer thickness at the surface of the particle, and Cs and Cb are the mass concentrations of the dissolved species at the particle surface and in the bulk solvent, respectively.
For the model calculations reported below, Equation 1 was replaced with the following expression for the cumulative rate of drug dissolution in each tracheobronchial generation:
where mi is the mass of undissolved ciprofloxacin in the ith tracheobronchial generation, Cb,I is the ASL concentration of free (dissolved) ciprofloxacin in the ith generation, Cs is the solubility of ciprofloxacin betaine in the ASL, set to 70 μg/mL,(49) and kdiss,TB is assumed constant throughout the tracheobronchial airways. For spherical particles dispersed and fully immersed in the ASL, the total surface area between particle and solvent phases in a given generation is proportional to mi2/3, as noted by Hixson and Crowell for dissolving compact particles in general.(50)
In the alveolar compartment, a first-order rate constant, kdiss,ALV, was maintained for modeling the dissolution of ciprofloxacin particles. Values of kdiss,TB = 5.0 mL·h−1·mg−2/3 and kdiss,ALV = 0.4 h−1 were determined by fitting the in vivo ciprofloxacin plasma concentration profiles in healthy volunteers reported by Stass et al.(23) for the single capsule (32.5 mg) case.
For both the liposomal and DPI cases, mucociliary clearance from tracheobronchial generations was modeled using first-order rate constants kmuc0 through kmuc14. These rate constants were defined individually for each generation, determined from the ratio between the mucous volumetric flow rate and generational mucous volume output by the ASL model described above. Accordingly, mucociliary clearance rate constants varied between tracheobronchial generations and with specified values of DMP and TCV. Values ranged from ∼1 h−1 in distal tracheobronchial generations for the case of DMP = 20 mL/day and TCV = 5 mm/min up to ∼15 h−1 in proximal generations for the case of DMP = 5 mL/day and TCV = 20 mm/min.
The remaining first-order rate constants and parameters appearing in Figure 1 were used to determine ciprofloxacin concentrations in the central compartment over time, for comparison with in vivo plasma concentrations, where available. Values of rate constants k12 = 0.48 h−1, k21 = 0.58 h−1, ka = 1.15 h−1, and the oral bioavailability, FBA = 0.75, were specified based on literature values used in two-compartment models describing distribution of oral and intravenous ciprofloxacin.(51–53) The rate of elimination, ke = 0.68 h−1, and the volume of distribution of the central compartment, Vc = 80 l, were determined based on the quality of fit to in vivo plasma PK profiles in healthy volunteers for the CFI formulation(54) and for the 32.5 mg DPI formulation.(23)
The value of ke fell in between elimination rate constants previously reported by Bergan et al.(51) after rapid bolus intravenous injection (1.03 h−1) and by Nix et al.(52) after oral administration (0.46 h−1). The value of VC compared reasonably with the central distribution coefficient reported by Bergan et al.(51) (0.91 ± 0.23 L/kg). While both ke and VC strongly affect modeled plasma ciprofloxacin concentrations, it is noted that neither of these parameters appreciably influences ASL concentrations of ciprofloxacin reported below.
Numerical calculations
Specification of all rate constants and parameters used in the disposition model results in a system of 35 ordinary differential equations that describes the variation in the amount of drug in each compartment and subcompartment over time. These were solved numerically using an explicit Euler time advancement technique over a 24-hour time disposition period. For the CFI and Pulmaquin cases, the time step was 0.05 h. For the DPI cases, a shorter time step of 0.01 h was required, owing to the inclusion of the dissolution process in the tracheobronchial ASL. Preliminary calculations with different time steps confirmed time step size independence in all cases. Calculations were performed for the three combinations of DMP and TCV specified above, yielding low, intermediate, and high estimates of initial ASL ciprofloxacin concentrations.
Results
Initial deposition of ciprofloxacin was as follows: for the CFI formulation, extrathoracic deposition of 19.8 mg liposomal ciprofloxacin, tracheobronchial deposition of 17.8 mg, and alveolar deposition of 29.9 mg; for the Pulmaquin formulation, extrathoracic deposition of 13.9 mg ciprofloxacin (9.9 mg encapsulated/4.0 mg free), tracheobronchial deposition of 12.4 mg (8.9 mg encapsulated/3.5 mg free), and alveolar deposition of 21.0 mg (15.0 mg encapsulated/6.0 mg free); for the 32.5 mg DPI case, extrathoracic deposition of 14.3 mg, tracheobronchial deposition of 4.23 mg, and alveolar deposition of 12.3 mg; and for the 65 mg DPI case, extrathoracic deposition of 28.6 mg, tracheobronchial deposition of 8.46 mg, and alveolar deposition of 24.6 mg.
Modeled central compartment (plasma) ciprofloxacin concentrations for the CFI and Pulmaquin cases are presented in Figure 2, for the three combinations of DMP and TCV investigated. For comparison, Figure 2a also includes plasma concentration profiles measured in vivo for CFI in healthy volunteers.(54) Figure 3 displays model predictions of plasma concentrations for the 32.5 mg (single capsule) and 65 mg (two capsule) DPI cases, again for the three combinations of DMP and TCV. Figure 3a includes available in vivo plasma concentrations measured for the 32.5 mg case.

Plasma concentrations of ciprofloxacin from the compartmental disposition model for
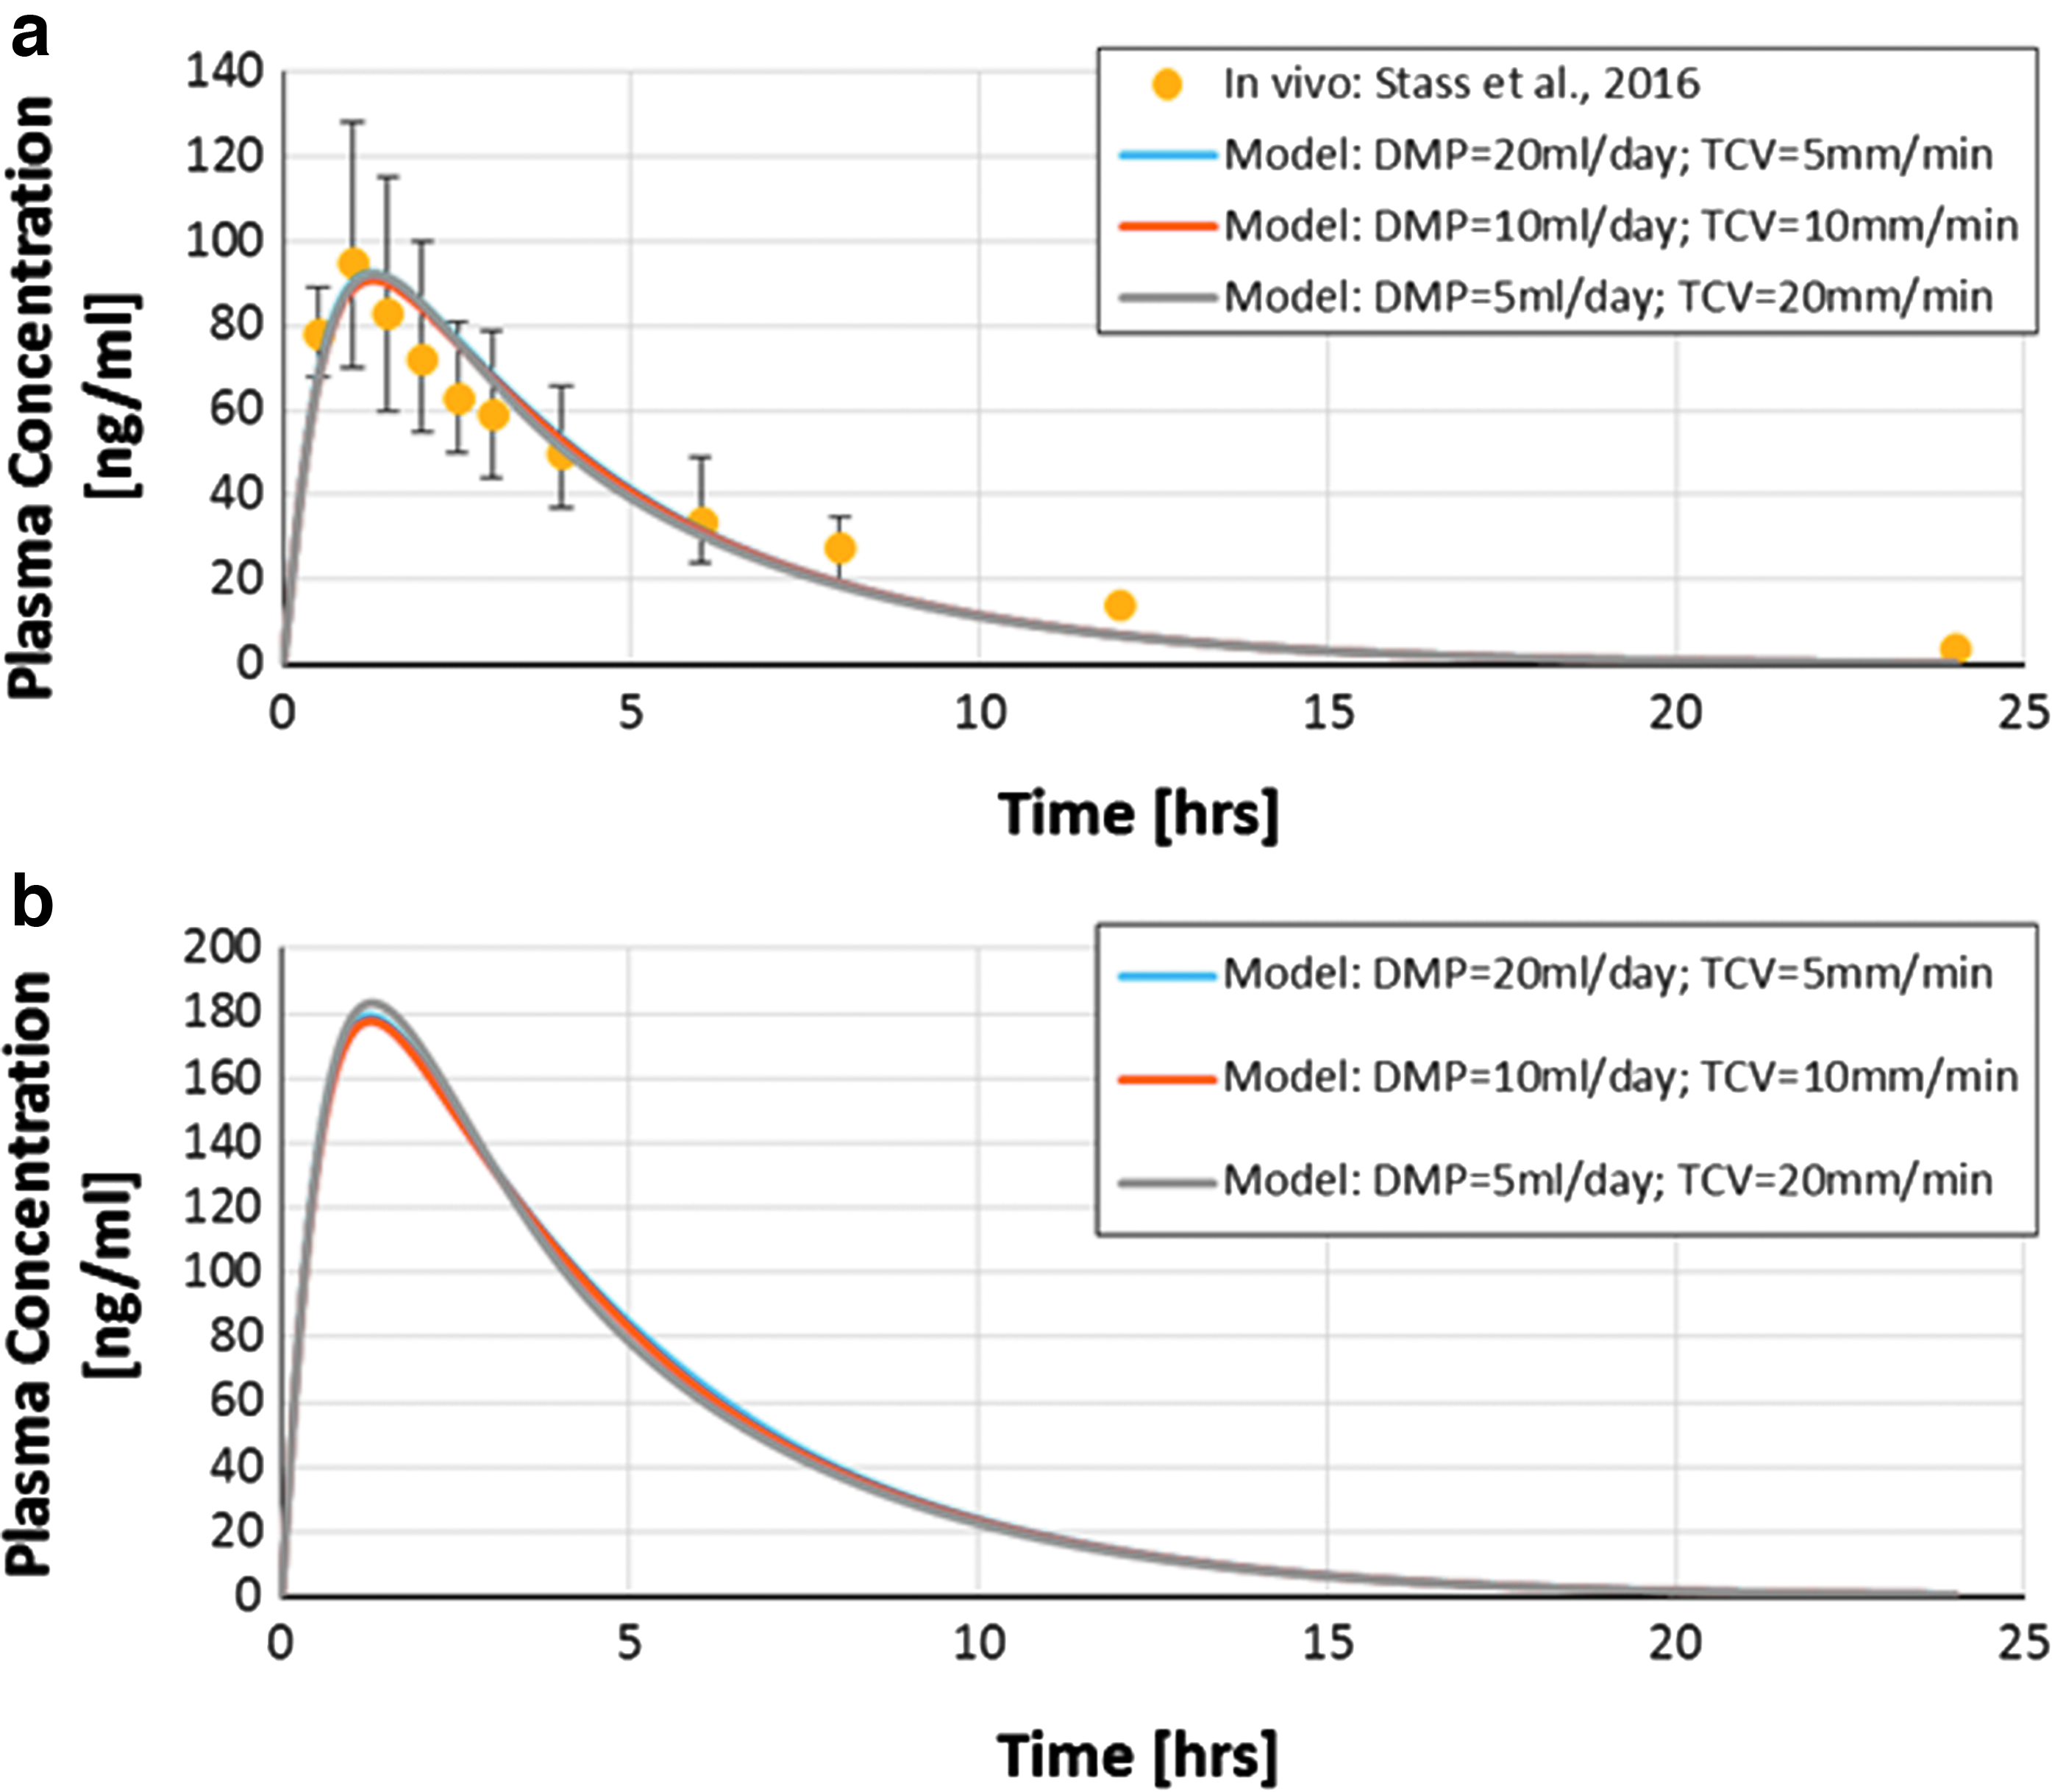
Plasma concentrations of ciprofloxacin from the compartmental disposition model for
Variation in ASL concentrations of encapsulated and free ciprofloxacin over time following inhalation is displayed in Figures 4 and 5 for the CFI and Pulmaquin cases, respectively. ASL concentrations of undissolved and free ciprofloxacin following inhalation are presented in Figures 6 and 7 for the 32.5 and 65 mg DPI cases, respectively. In all cases, ASL concentrations are presented for the three combinations of DMP and TCV investigated.
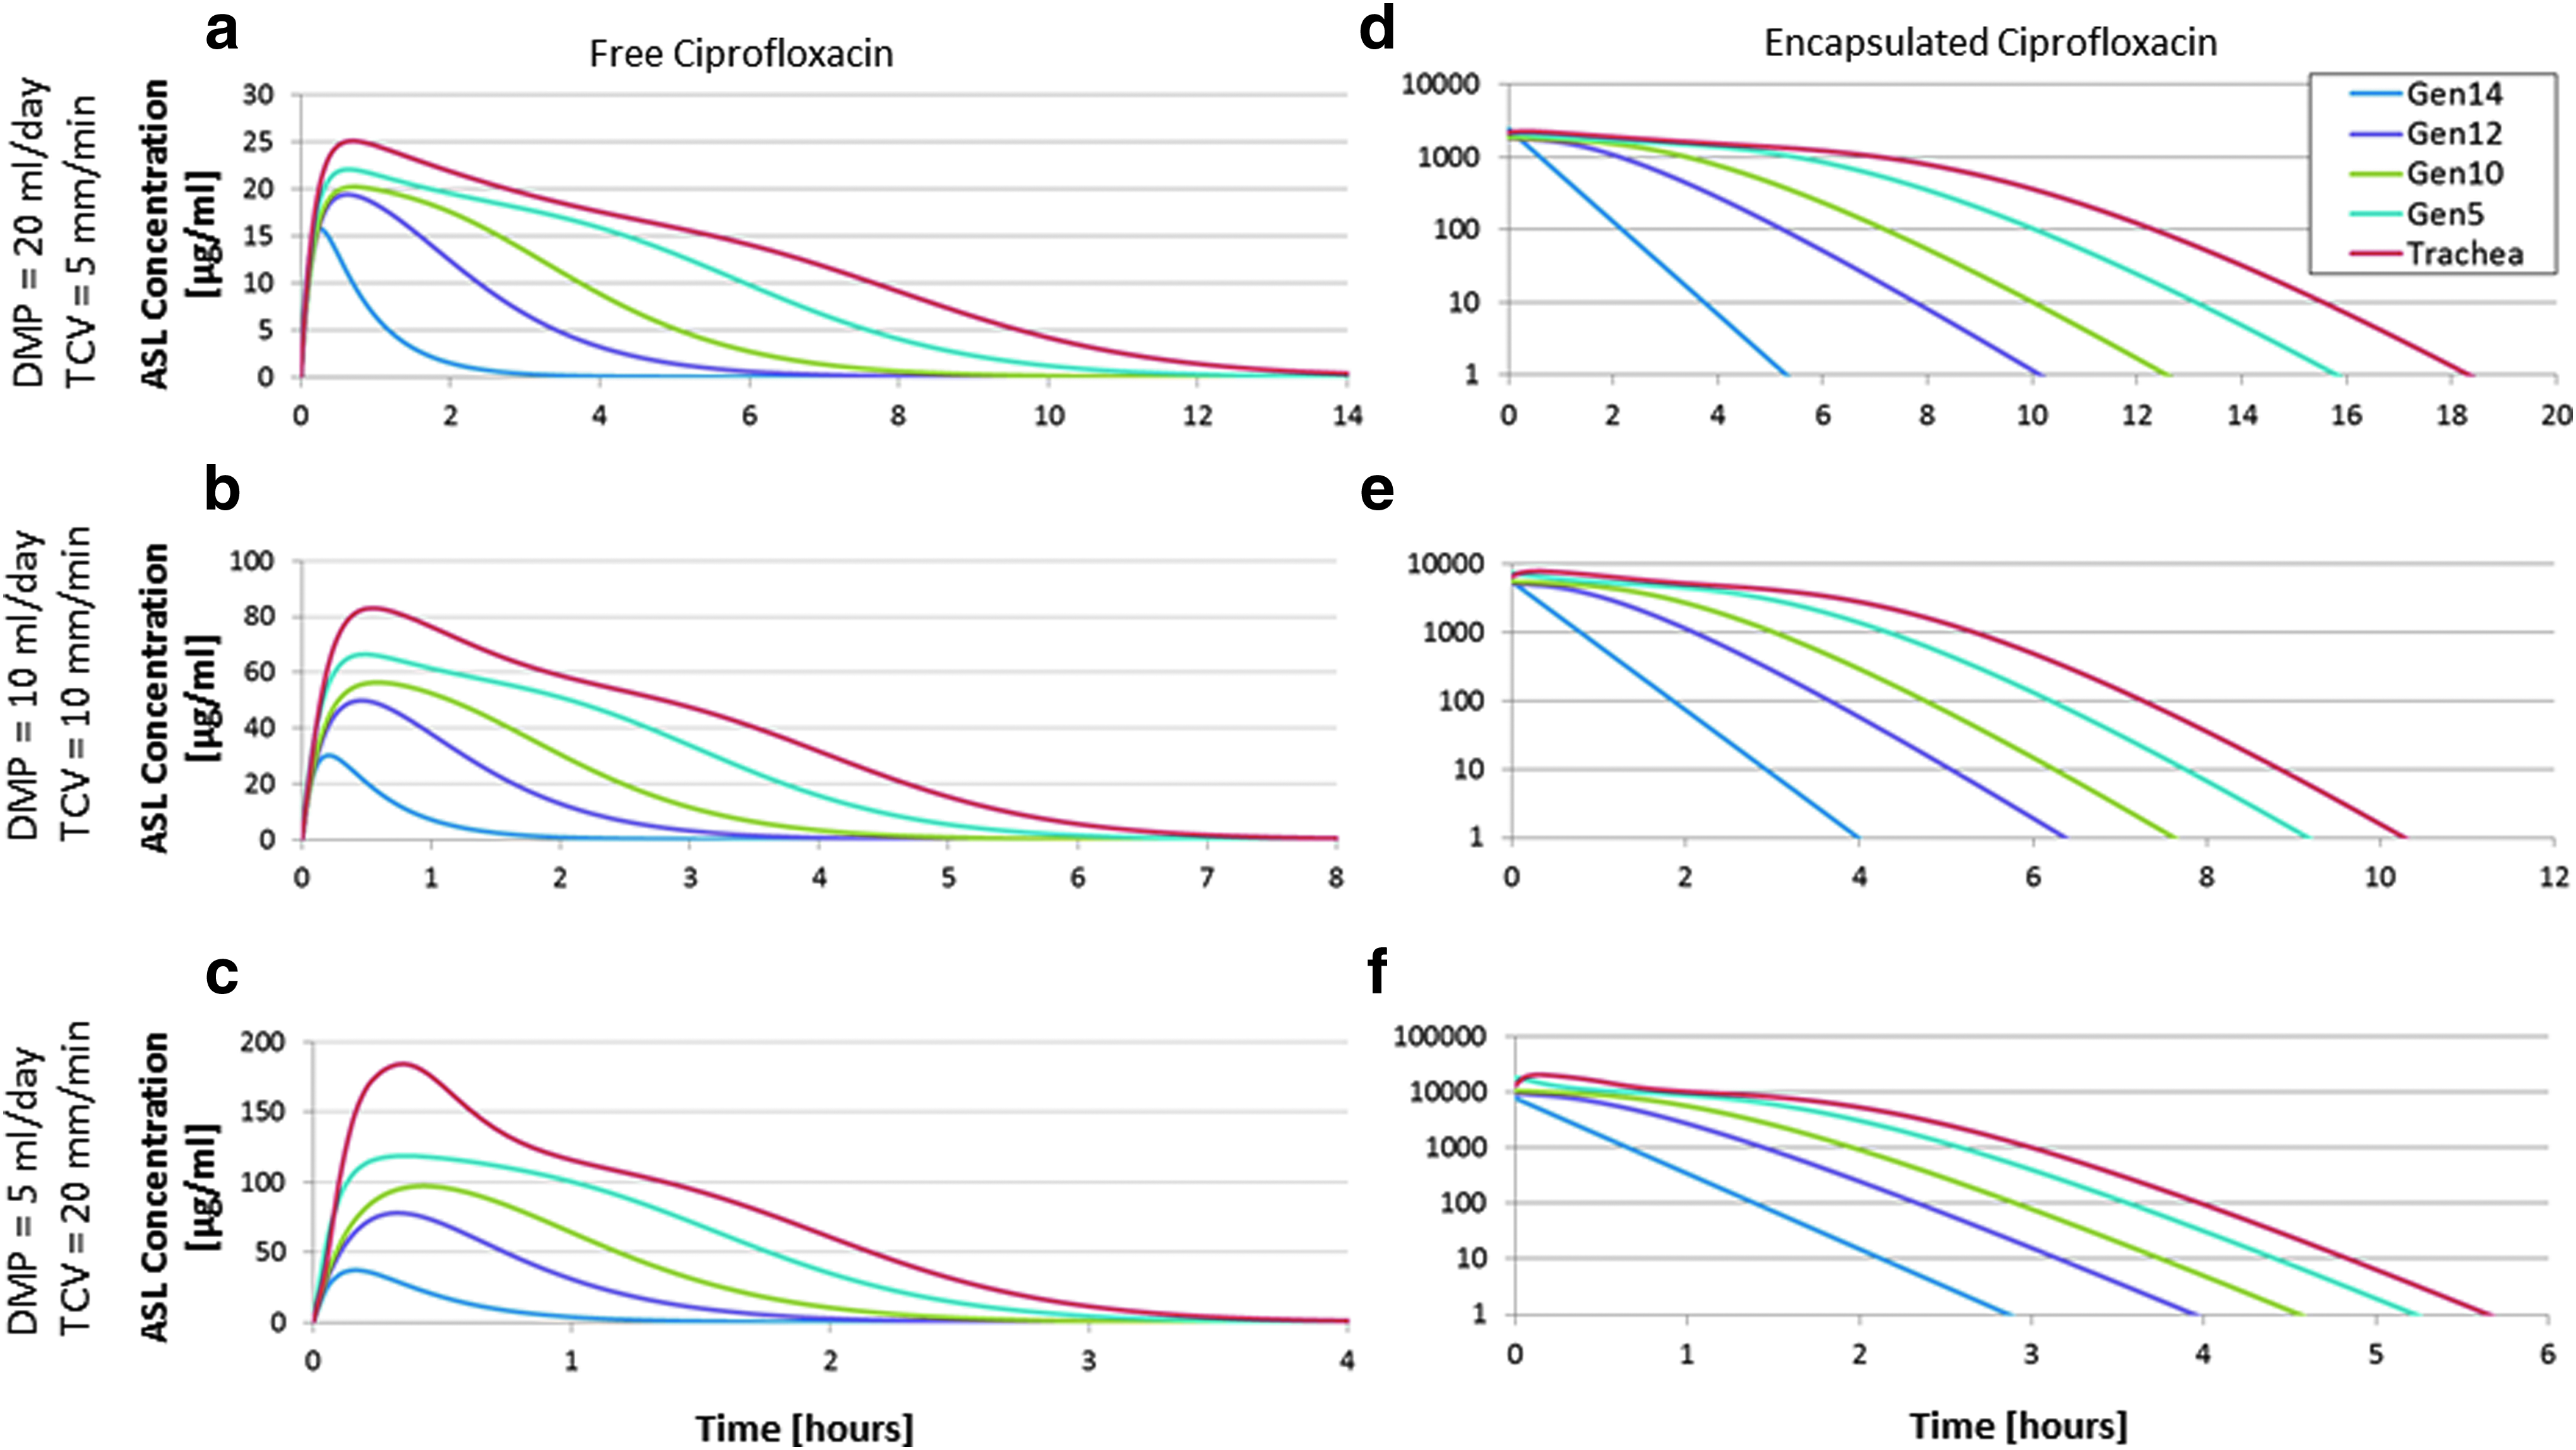
CFI: Modeled airway surface liquid (ASL) concentrations of free ciprofloxacin
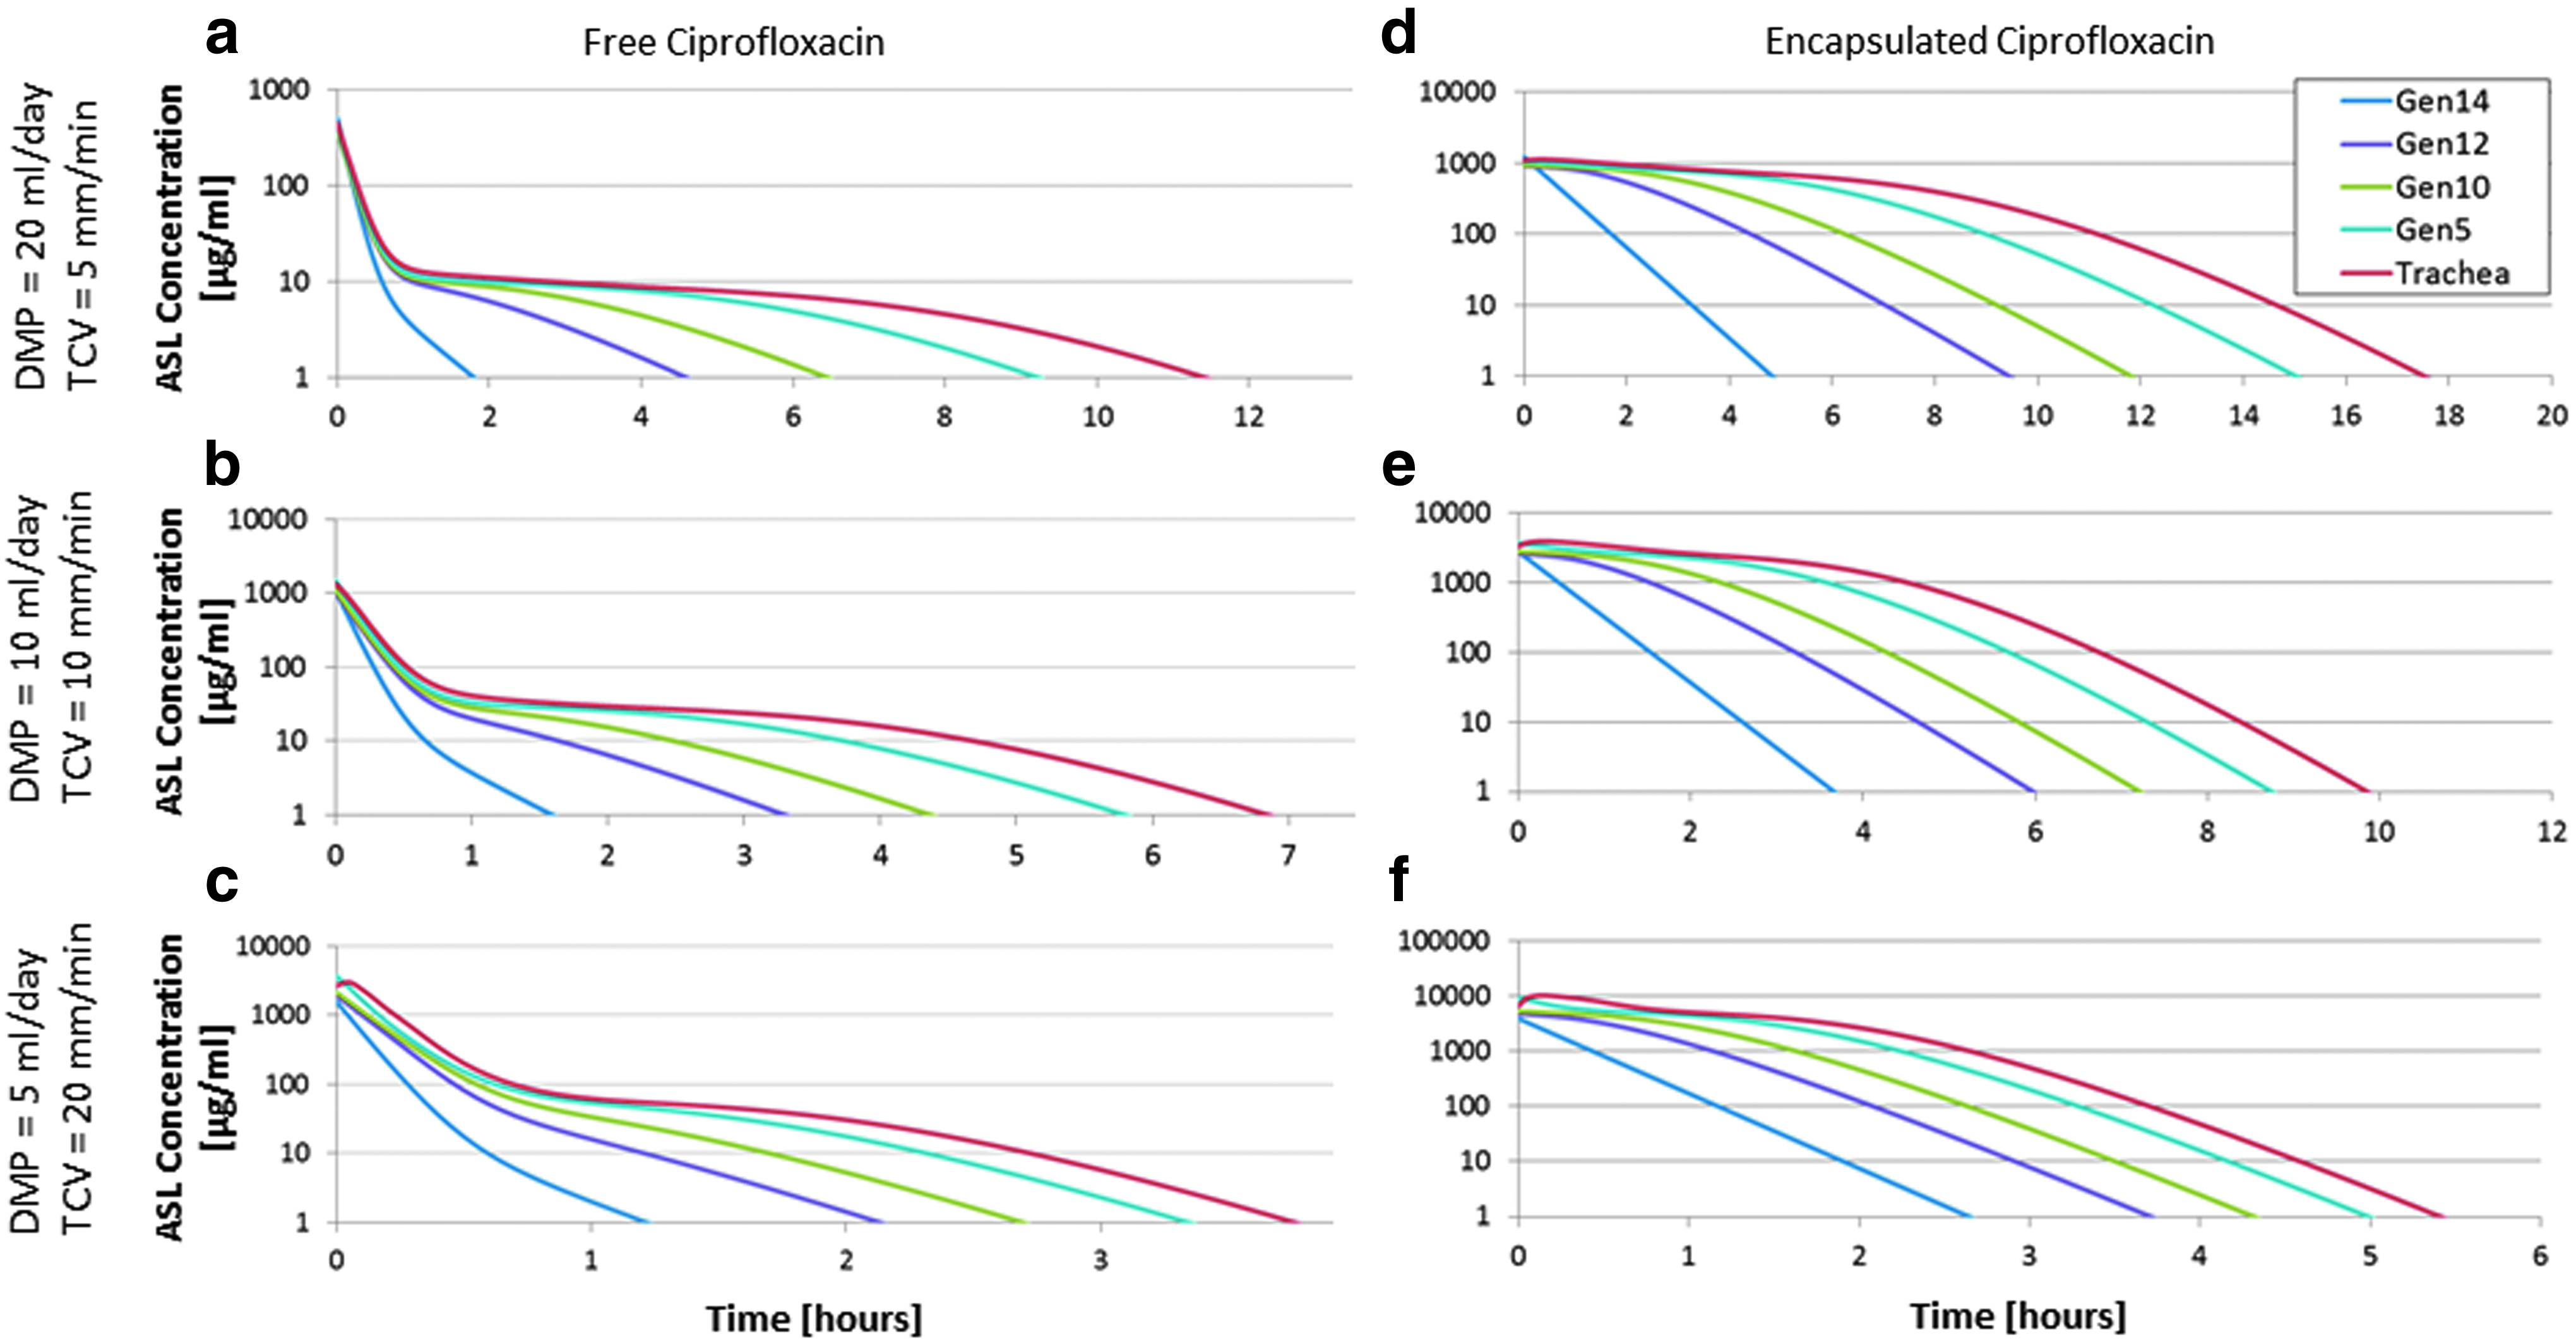
Pulmaquin: Modeled ASL concentrations of free ciprofloxacin
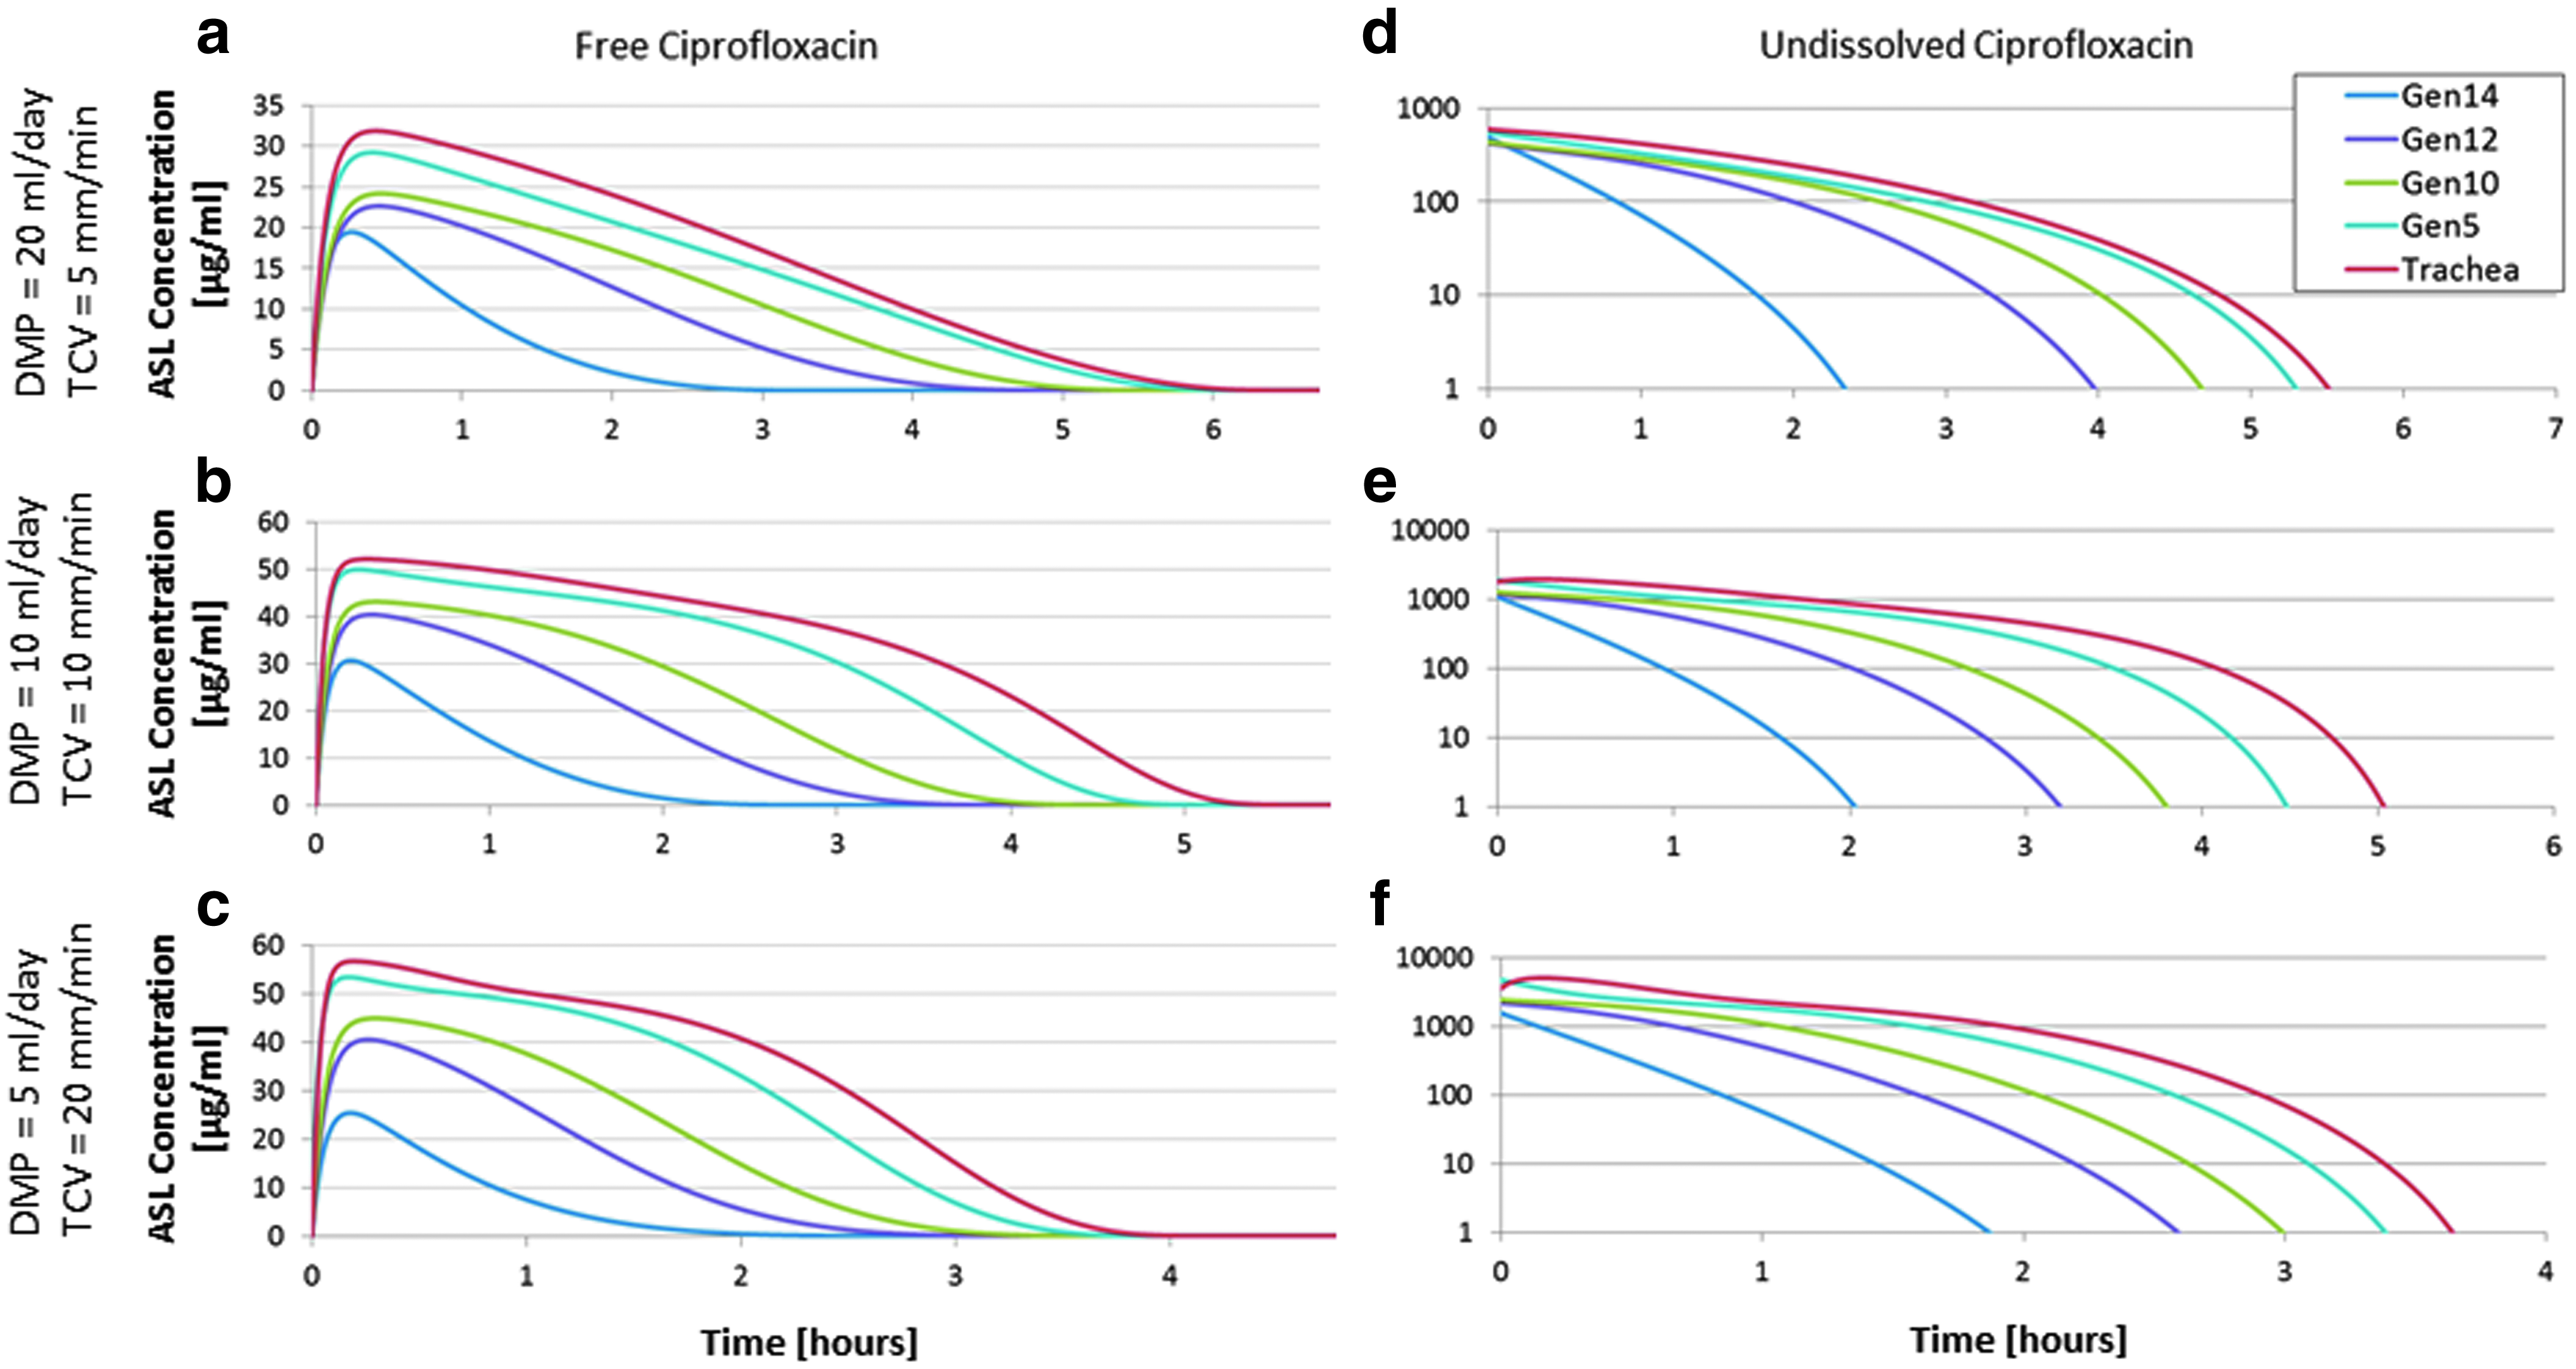
DPI 32.5 mg: Modeled ASL concentrations of free ciprofloxacin

DPI 65 mg: Modeled ASL concentrations of free ciprofloxacin
For each case studied, Figures 4 through 7 consistently display increasing initial drug concentrations, but decreasing residence times in the airways, as DMP decreases and TMV increases. An initial spike in ASL free ciprofloxacin concentration is notable in Figure 5 for the Pulmaquin case, consistent with the presence of free drug in the nebulizer formulation. Also notable are the relatively similar ASL-free ciprofloxacin concentrations between the 32.5 and 65 mg DPI cases, despite a doubling of the inhaled dose, as seen in Figures 6 and 7.
Table 1 summarizes peak-free ciprofloxacin ASL concentrations in the trachea and in the 5th and 12th tracheobronchial generations, along with the time following inhalation to reach peak concentrations, for the four cases investigated. These summary results are presented for the intermediate ASL model case of DMP = 10 mL/day and TCV = 10 mm/min.
Results are shown for daily mucous production of 10 mL/day and TCV of 10 mm/min.
CFI, ciprofloxacin for inhalation; TCV, tracheal clearance velocity.
Table 2 displays the time period over which modeled ASL concentrations of free ciprofloxacin remained above 4 μg/mL, which is the MIC90 for Pseudomonas aeruginosa.(55) Modeled time above MIC in the trachea and in the 5th and 12th tracheobronchial generations is reported in Table 2 for the four cases studied. Summary results are again presented for DMP = 10 mL/day and TCV = 10 mm/min. Similar trends between airway generations and the four cases were seen for the other modeled combinations of DMP and TCV values.
Results are shown for daily mucous production of 10 mL/day and TCV of 10 mm/min.
MIC = 4 μg/mL.
MIC, minimum inhibitory concentration.
Discussion
The present work extends existing models of generational aerosol deposition and tracheobronchial ASL volumes to predict disposition of deposited drug over time. Inclusion of the drug liberation process, release from liposomes or dissolution of solid particles, and of individual rate constants describing mucociliary clearance from each tracheobronchial generation permitted the time course of ASL drug concentration to be estimated at the generational level. Such estimates have potential value in further understanding the roles of formulation, deposition, and disposition on the effectiveness of inhaled aerosol therapies.
Model calculations were performed to explore deposition and disposition of liposomal and dry powder formulations of inhaled ciprofloxacin. For one of the liposomal cases studied (CFI) and one of the dry powder cases studied (DPI 32.5 mg), model predictions of systemic exposure were compared with available in vivo data describing plasma concentrations over time in healthy volunteers (Figs. 2a and 3a). In both cases, agreement between model predictions and in vivo concentration–time profiles is reasonably strong. The availability of in vivo PK profiles was valuable in the definition and verification of model parameters and rate constants; however, it is noted that several parameters that were fit to PK data, including the elimination rate constant, ke, and the volume of distribution of the central compartment, Vc, have negligible influence on modeled ASL concentrations of ciprofloxacin.
Considering deposition alone, the total mass of ciprofloxacin depositing in the tracheobronchial airways was larger for the two liposomal formulations (17.8 mg for CFI; 12.4 mg for Pulmaquin) than for the two dry powder cases studied (4.23 mg for the 32.5 mg DPI case; 8.46 mg for the 65 mg DPI case). However, peak ASL concentrations of free ciprofloxacin were of similar magnitude between CFI and the two DPI nominal doses. For the combination of DMP = 10 mL/day and TCV = 10 mm/min, peak ASL concentrations ranged from 1.6 × (in the trachea) to 1.2 × (in Generation 12) greater for CFI than for 32.5 mg DPI and from 1.4 × to 1.03 × greater for CFI than for 65 mg DPI (Table 1).
In contrast, peak ASL concentrations were several orders of magnitude greater for the Pulmaquin formulation than for the other three cases studied. This was a direct result of the presence of free ciprofloxacin in the deposited aerosol. For Pulmaquin, the initial bolus of free drug deposited in the airways was rapidly absorbed in the model, such that the duration that the ASL concentrations remained above the MIC in the conducting airways was similar between all four cases studied (Table 2).
The rationale for the development of Pulmaquin relies on the hypothesis that the presence of high initial levels of free ciprofloxacin would lead to greater antimicrobial effect.(22) Ciprofloxacin belongs to the class of fluoroquinolone antibiotics that generally exhibit time-dependent killing, for which efficacy is related to the time that the antibiotic concentration exceeds the MIC. However, for ciprofloxacin, the ratio of the area under the concentration time curve (AUC) divided by the MIC appears to be the best predictor of antimicrobial effect.(24,56) Thus, higher initial levels of free ciprofloxacin in Pulmaquin would lead to higher values of AUC/MIC than for CFI and for the 32.5 and 65 mg dry powder doses. This appears to be born out in the clinic with two doses of CFI exhibiting a 3.5 to 4 log drop in mean sputum Pseudomonas aeruginosa colony-forming units (PA CFUs) after once-daily dosing for 28 days in cystic fibrosis(22) and only an ∼2 log drop for the twice-daily DPI formulation(57) in non-CF bronchiectasis versus a >4 log drop for once-daily Pulmaquin in non-CF bronchiectasis.(22)
The two dry powder formulations studied represent nominal doses for inhalation of a single capsule (32.5 mg) or two capsules (65 mg). Modeled plasma concentrations essentially scaled linearly with nominal dose (Fig. 3). Conversely, ASL concentrations of free ciprofloxacin increased only marginally between the 32.5 and 65 mg DPI cases (Figs. 6 and 7). This is indicative of solubility-limited dissolution of deposited powder in the ASL, as has been noted previously in a dose-escalation study in cystic fibrosis patients.(25) As a result, modeled ASL concentrations were relatively insensitive to dissolution rate constants compared with solubility of ciprofloxacin. There appears to be little benefit to increasing the nominal dose of ciprofloxacin powder from 32.5 to 65 mg, at least in consideration of ASL drug concentrations that can be achieved.
The description in the present model of particle dissolution by distinct processes in the tracheobronchial and alveolar regions follows from regional differences in the environment encountered by depositing particles. Particles depositing in tracheobronchial airways may become immersed in ASL, such that the area between the dissolving particle and solvent is proportional to the particle surface area.(18) This assumption is made in the Noyes–Whitney process used in the present model to describe dissolution of deposited particles in the tracheobronchial ASL. The constant kdiss,TB used in the tracheobronchial dissolution model can be further explored by equating the right hand sides of equations (1) and (2). With the assumption that all drug mass in a given generation is contained in dispersed and fully immersed spherical particles of uniform density, the following definition can be made:
where ρ is the density of the particles.
Equation 3 allows for an estimate of kdiss,TB based on values of the diffusion coefficient, D, the dissolution layer thickness, h, and the particle density, ρ. For the diffusion coefficient, a value of 6.87 × 10⁻⁶ cm2/s is used.(58) For the particle density, a coarse estimate of 0.5 g/cm3 can be made, based on the upper limit of tap densities reported for PulmoSphere powders.(59) For a dissolving particle, the dissolution thickness is commonly approximated as the particle radius. Here dissolution thickness is approximated as one half the aerosol mass median diameter of 5.1 μm, itself calculated from the particle density and MMAD of 3.6 μm used in the model calculation above. These values combine in equation (3) to predict a value of kdiss,TB = 7.4 mL·h−1·mg−2/3.
Although this value should only be considered a crude approximation, it compares favorably with the fitted value of kdiss,TB = 5 mL·h−1·mg−2/3 used in the present model calculations, providing some justification for the latter value. That said, a number of factors will influence this parameter that have not been accounted for here, including, for example, particle shape and porosity, incomplete or partial immersion of aerosol particles landing on the ASL, and decreasing particle sizes (and associated dissolution layer thickness) as dissolution progresses.
In contrast to the approximation of immersed particles made in the tracheobronchial dissolution model described above, those particles depositing in the alveolar region will sit in a fluid film thinner than the particle diameter.(18) In this case, surface wetting may be a significant factor in the dissolution process. Lacking a physical description of particle dissolution in alveolated airways, a first-order rate constant was adopted in the present analysis, and drug concentrations in distinct alveolar airway generations were not modeled.
In addition to modeling ASL concentrations of free drug, the present analysis also models ASL concentrations of encapsulated and undissolved drug. For the liposomal formulations, the rate at which encapsulated drug leaves the airways is determined in the model calculations primarily by mucociliary clearance; the rate at which drug is released from liposomes and becomes available for absorption (krel = 0.06 h−1) is significantly slower than the rate of clearance (kmuc,I ranging from ∼1 to ∼15 h−1 depending on the generation number i and the specified DMP and TCV values). For the intermediate values of DMP = 10 mL/day and TCV = 10 mm/min, encapsulated drug was completely cleared from the tracheobronchial airways within ∼10 h. This time frame is comparable with mucociliary clearance times measured in healthy nonsmokers for micrometer-sized insoluble particles.(60)
In the present model, all deposited drugs are subject to mucociliary clearance; slow clearance from tracheobronchial airways, representing a fraction of deposited drug for which mucociliary clearance is ineffective or less effective,(61) was not modeled in the present analysis. The existence of a slow-cleared fraction of the tracheobronchial dose would potentially result in more sustained levels of drug in the conducting airways, beyond those described in the current model (Table 2). It is noted that unpublished data from the Pulmaquin Phase 3 efficacy trials indicate mean drug levels in sputum exceeding 100 μg/mL (n = 16) throughout the 24-hour posttreatment window (data not shown), which is inconsistent with the present model predictions that show liposome drug levels falling below the MIC within 24 hours (Fig. 5).
This discrepancy may reflect slow clearance of encapsulated drug from the tracheobronchial airways that is not captured in the present model, but could also arise if DMP or TCV for noncystic fibrosis bronchiectasis patients participating in the trials was on average higher or lower, respectively, than values used in the model calculations. The time for which modeled tracheal concentrations of encapsulated drug remained above MIC increased from ∼5 to 16 h as DMP increased while TCV decreased (Fig. 5).
Indeed, for all formulations studied, model calculations performed for a high DMP rate (20 mL/day) and low TCV (5 mm/min) produced the largest ASL volumes, with lowest peak drug concentrations, but longest residence times of drug in the airways (Figs. 4–7). These conditions provide some insight into the effect that moderately impaired mucociliary clearance, due to respiratory disease, may have on retention of drug in the ASL. However, such interpretation should be made with some caution, as the influence of disease on deposition patterns was not modeled in the present work. While scintigraphy data for ciprofloxacin DPI reported by Stass et al.(23) demonstrated no significant difference in extrathoracic or lung deposition among healthy volunteers, chronic obstructive pulmonary disease patients, and noncystic fibrosis bronchiectasis patients, some increase in the central/peripheral deposition ratio was noted between healthy volunteers and patients.
Conclusions
The present work combined existing models of generational aerosol deposition and ASL volumes to predict disposition of deposited drug over time. Predictions of the time course of ASL ciprofloxacin concentration were reported at the generational level for single doses of liposomal and dry powder formulations of inhaled ciprofloxacin. Over a range of DMP and TCV values, the peak ASL concentration of free ciprofloxacin was consistently much greater for Pulmaquin than for the other formulations investigated, owing to the presence of free drug in the nebulized Pulmaquin formulation.
The time for which ASL concentrations of free drug remained above the MIC for Pseudomonas aeruginosa was similar for all four formulations in all airway generations. Times above MIC in the terminal bronchioles were approximately half of those in the trachea. The ability to estimate evolution of ASL drug concentrations over time has value in furthering the understanding of the roles of deposition, drug release or dissolution, and disposition on the effectiveness of inhaled aerosol therapies.
Footnotes
Acknowledgments
This work was funded by Aradigm. The authors acknowledge Igor Gonda and David Cipolla for their very helpful advice and insight both in defining the disposition model and interpreting model predictions. Funding source: Aradigm Corporation.
Author Disclosure Statement
No competing financial interests exist.