
Abstract
Background:
Mucociliary clearance (MCC) rate from the lung has been shown to be reduced in chronic obstructive pulmonary disease (COPD). This study investigates the value of regional clearance measurements in assessing MCC in mild-to-moderate disease.
Methods:
Measurement of lung MCC using planar gamma camera imaging was performed in three groups: (i) healthy nonsmoking controls (NSCs) (n = 9), (ii) smoking controls (SCs) who were current smokers with normal lung function (n = 10), and (iii) current smokers with mild-to-moderate COPD and bronchitis (n = 15). The mean (±standard deviation) forced expiratory volumes at 1 second (FEV1) for the three groups were 109 (± 18), 94 (± 5), and 78 (± 12), respectively. After inhalation of a technetium-99m labeled aerosol, planar imaging was performed over 4 hours and then at 24 hours. Both lung clearance and tracheobronchial clearance (TBC) (normalized to 24 hours clearance) were calculated for inner and outer lung zones. Inner zone clearance was corrected for input from the outer zone. A novel parameter, the bronchial airways clearance index (BACI), which combined clearance data from both zones, was also evaluated. Regional results were compared with whole lung clearance in the same subjects.
Results:
Corrected inner zone clearance at 3 hours was not reduced compared with NSC in either SCs or COPD. Outer zone clearance was higher in COPD than in the other groups. Corrected inner zone TBC showed significant reductions in SC and COPD compared with NSC. BACI was significantly reduced in COPD compared with NSC and also correlated with FEV1. The mean BACI for SC was also reduced compared with NSC, but the distribution of results was bimodal, with a significant proportion of subjects having values in the NSC range.
Conclusions:
Regional MCC demonstrated differences between NSCs, SCs, and subjects with mild-to-moderate COPD, which were not apparent with whole lung measurements.
Introduction
Chronic Obstructive Pulmonary Disease (COPD) is a common disorder of the respiratory system. It is an important, global, public health challenge and health resource burden; and it is a major cause of chronic morbidity and mortality. COPD is currently the fourth leading cause of death in the world and is expected to become the third leading cause by 2020.(1)
Mucociliary clearance (MCC) is reported to be affected by COPD, particularly in subjects with chronic bronchitis (CB).(2) It can be assessed by measuring the clearance of a nonabsorbable, radio-labeled aerosol administered to the lung by inhalation.(3) Previous studies have generally shown a reduction of clearance in subjects with CB when clearance is assessed from a whole lung region.(2,4,5)
Measures of MCC using this technique are influenced by the pattern of the initial distribution of aerosol. Since inhalation of aerosol in COPD subjects tends to result in a more central deposition pattern than in nonsmoking controls (NSCs), several studies comparing the two groups have applied a correction for this factor.(6) This is usually done either by normalization of clearance values to the 24 hours clearance, as a measure of the amount aerosol available for fast clearance,(6) or by using different aerosol inhalation protocols to produce similar distribution of deposition in both groups.(5)
Some studies that used imaging to measure clearance also assessed regional clearance, by dividing the lung into inner (central) and outer (peripheral) lung zones.(2,5,7) Previous studies on subjects with CB have indicated that the reduction in clearance is more marked from the inner zone than from the outer.(2,5) These investigations have included subjects with a wide range of disease severity, including those with severe loss of function. In our recent study on subjects with mild-to-moderate COPD and CB, it was found that there was no significant reduction in whole lung MCC compared with NSCs.(8) However, this article also investigated the use of a new measure of clearance, the normalized change of penetration index (NOCHIP). This was significantly reduced in CB compared with NSC subjects, and it was suggested that differences in regional clearance might explain this finding. Therefore, in this study, we investigate how clearance from inner and outer lung zones was affected in the same dataset. This previous study also included a group of asymptomatic current smokers, and results of regional clearance for this group will also be reported in this article.
Similar to whole lung clearance measurement, regional clearance rates will also depend on the initial distribution pattern of the aerosol and some previous studies have sought to correct for this factor by normalizing to the 24 hours clearance to obtain a measure of tracheobronchial airway clearance.(7,9) This approach will also be used in our measurements. It has been suggested that even in NSC subjects, clearance from the tracheobronchial airway is not complete by 24 hours.(4) The fraction cleared at 24 hours may also be reduced further by the presence of disease. This, of course, has important implications for the interpretation of 24 hours clearance as a measure of tracheobronchial airways deposition. However, it is considered that this does not invalidate it as a suitable parameter for normalization of MCC measurements, as it still gives a reasonable measure of the amount of aerosol available for fast clearance.(8)
Regional clearance measured in the inner or central zone will be underestimated, as aerosol cleared from the outer (peripheral) zone will appear in the inner zone. This increases the amount of aerosol in the inner zone, causing the measured clearance value to be falsely lowered. This article will use the technique described by Agnew et al.(9) for correction of this factor. The two-dimensional nature of the images means that the corrected inner zone clearance will still not accurately reflect clearance from the central tracheobronchial airway, that is, the bronchial pulmonary airways (generations 2–8). This is because the zone includes a significant proportion of bronchiolar and interstitial conducting airways (generations 9–19). (Note that in this context the interstitial conducting airways refer to the respiratory bronchioles in the alveolar-interstitial region of the lung as described in the ICRP model of the lung,(10) and is not to be confused with the lung interstitium as used, for example, in interstitial lung disease). We introduce a new parameter that attempts to correct for the influence of these bronchiolar and interstitial conducting airways in the inner zone to give an index of bronchial airway clearance.
The aim of this study is to investigate whether analysis of regional clearance may be better able to detect the differences in MCC between smokers with and without CB and NSCs compared with whole lung measurements. The study should also elucidate the reason for the previous observation, that the normalized change in penetration index was able to detect differences between these groups, whereas whole lung clearance was not.
Methods
Much of the details of the subject selection and methodology of this study have been described in a previous publication,(8) so this section will provide a summary of these aspects of technique, together with a full description of the regional clearance measurements, which are not covered in the previous paper.
Subjects
Nine healthy nonsmokers (negative urinary cotinine), 10 smokers with normal lung function (non-COPD with >5 cigarettes/day for more than 2 years), and 15 patients with an established diagnosis of COPD participated in the study. The study was approved by the Southampton and South West Hampshire local research ethics committee and the University Hospital Southampton NHS Foundation Trust Research and Development Department. All participants gave written informed consent. The healthy smoker group had no physiological evidence of obstructive airway disease. The COPD subjects had mild-to-moderate disease (Forced Expiratory Volume for 1 second [FEV1] between 56% and 101%). They were all current smokers (>5 cigarettes/day for more than 2 years). They were also all sputum producers and, therefore, had symptoms of CB. Seven of the group had no or minor emphysema as judged by computed tomography imaging, whereas eight had mild-to-moderate disease.
Overview of experimental protocol
Each participant had two visits to the hospital for: (i) screening and pulmonary function testing, (ii) imaging measurement of MCC.
Screening and pulmonary function testing
On the first visit, volunteers were screened for suitability for the study. Spirometry was performed by using the Viasys VMAX system that computed FEV1, Forced Vital Capacity (FVC), peak expiratory flow (PEF), and forced expiratory flow between 25% and 75% volume (FEF25–75) from the flow volume loop. The best of three measures was taken for each separate recording.
MCC measurement by radionuclide imaging
Aerosol administration
The aerosol administration regime was aimed at delivering a high proportion of the inhaled aerosol to the tracheobronchial airways. It is described in full in Fleming et al.(8) An aqueous radiolabeled aerosol consisting of Tc-99m human serum albumin nanocolloid (Tc-HSA) was administered via a DeVilbiss 646 nebulizer. This had a mass median aerodynamic diameter of 5.4 μm with a geometric standard deviation of 1.8. The inhalation regime followed the method described in a multicenter trial of radionuclide measurements of MCC(11) in using a shallow controlled inspiration. This was enabled by using a KoKo DigiDoser Dosimeter (nSpire Health, Inc., USA). This was followed by a forced expiration into an exhalation filter as described by Mortensen et al.(12)
Imaging protocol
Immediately after inhalation, the subjects were transferred to the imaging couch where they were positioned supine and imaging commenced. The imaging was performed on a GE Infinia dual head gamma camera with a computed tomography (CT) attachment (GE Medical Systems, Milwaukee, Wisconsin, USA). Planar imaging of the aerosol distribution in the thorax and stomach was performed immediately after inhalation and then at 1,2, 3, 4, and 24 hours. At each time point, a pair of anterior/posterior images was acquired. An image was also acquired of the background without the subject in position. A low-resolution CT (LRCT) scan was performed after the initial planar image pair, which provided a CT image of the thorax at mean tidal breathing.
The effective dose of ionizing radiation from the procedure described earlier was estimated at 1.05 mSv (radioaerosol imaging, 0.25 mSv, LRCT 0.8 mSv).
Definition of lung regions of interest
The first part of the processing was to define two-dimensional (2D) regions of interest (ROIs) for the left and right lungs. These were obtained from the LRCT data.(8) They were then superimposed on the initial aerosol image. Each lung region was then split into inner (central) and outer (peripheral) regions by using a 2D shell analysis where each pixel in the image was assigned to 1 of 10 shells based on the fractional distance from the hilum to the extrapolated point on the lung periphery.(13) The inner five shells were then taken as the inner region, and the five outer shells were taken as the outer region. The average area of the inner region was 21% of the whole lung region area. Figure 1 shows an example division of the lungs into inner and outer zones.
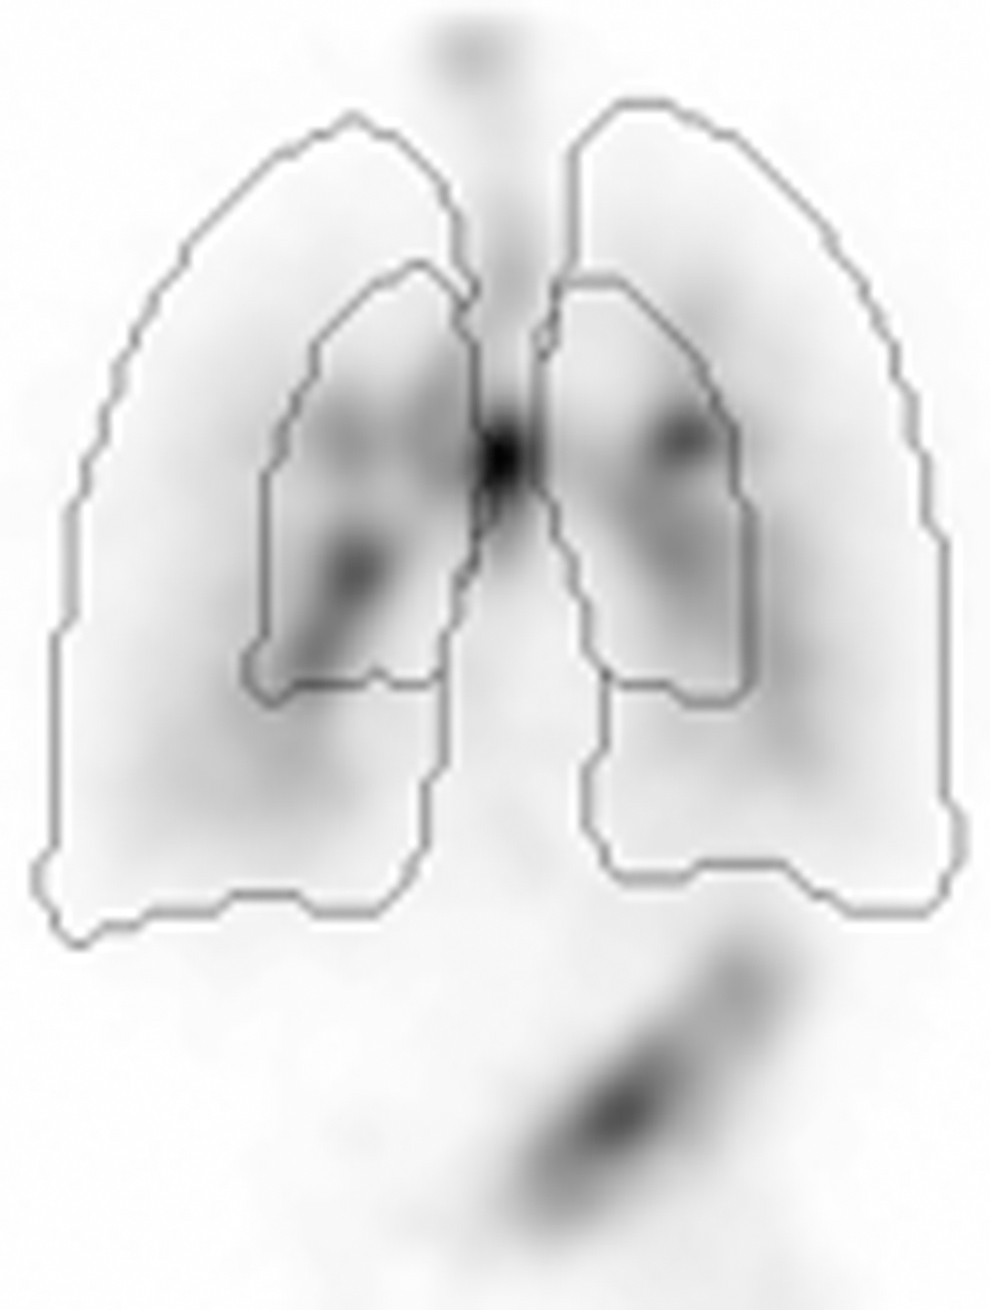
Example aerosol image showing the division of the lungs into inner and outer zones.
A 2D map of attenuation factors for the thorax was also formed from the CT image.(14)
Determination of activity in the lung regions
Static geometric mean images of the thorax were formed immediately after inhalation and then at 1, 2, 3, 4, and 24 hours. They were corrected for background and radioactive decay and multiplied by the map of attenuation factors to provide an attenuation-corrected 2D image of the aerosol deposition. The regions determined from LRCT were overlaid on the geometric mean images. The position of the regions on the aerosol deposition image was checked by visual inspection and if necessary moved by using a semi-automatic process. In planar imaging the images and regions are only 2D representations of the three-dimensional (3D) body and this meant that for some subjects there was a significant contribution of nonlung activity into the lung ROIs. This was particularly the case for the stomach overlying the base of the left lung. In subjects where this occurred, the left lung region was manually adjusted to avoid the problem as previously described.(8) Any modifications to the whole left lung region were then applied to the inner and outer sub-regions. The same modified regions were applied to all the images in the series.
Calculation and interpretation of clearance
The percentage clearance in the inner zone at each time point t, ClI(t), was determined as follows:
where CI(t) is the sum of the count in the right and left lung inner zone ROIs at time, t. CI(0) is the corresponding count in the first planar image obtained as soon as possible after inhalation. All counts were decay corrected to the time of the first image. As the actual times of the images varied from subject to subject, clearance values at the specific times were calculated by linear interpolation between the nearest two measurements. The clearance of the outer zone at time t, ClO(t), was calculated similarly from the sum of the counts in the right and left outer zone ROIs.
Correcting inner zone counts for contribution from the outer zone
Clearance measurements in the inner zone are complicated by the arrival of additional aerosol cleared from the outer zone. This relates to the essentially radial nature of the airway tree within each lung, which means that aerosol cleared from the outer zone will have to pass through the inner zone on its way out of the lung. This means that simple clearance estimates in the inner zone derived from Equation (1) will underestimate the true clearance from the zone. Agnew et al.(9) have suggested a method of performing this correction but, as far as we can determine, this technique has not been used in subsequent analyses of inner zone clearance at other centers.(5,7) The method can be described by considering the total amount of aerosol arriving in the inner zone at any time point t as I(t):
where dI(t) is the additional input to the inner region from the outer region, given by:
So the corrected clearance from the inner region, ClIC(t) can be calculated as:
This calculation makes the assumption that the percentage clearance from the inner zone for the aerosol coming from the outer zone is similar to that of the aerosol deposited directly in the inner zone after the initial inhalation at time zero. The clearance of aerosol that has arrived from the outer zone up to time, t, will tend to be lower than that deposited at time zero, as most of it arrives later and will have less time to clear. It also arrives on the periphery of the inner region and will have to travel across the whole zone before being cleared from the lung. For those subjects in whom the left lung outline required modification due to overlap of stomach radioactivity, there will also be a slight underestimate in clearance from the outer zone. However, these factors will be balanced by the fact that a significant portion of the aerosol crossing the boundary of the zones will already be in the bronchial airways (generations 2–8) from which percentage clearance will tend to be quicker. These factors will tend to balance out, meaning that, although the assumption will clearly not be exact, the subtraction process will result in reducing the underestimation in inner zone clearance, which results from the aerosol from the outer zone passing through the inner zone.
Determining parameters of initial aerosol distribution
The rate of MCC determined as the percentage leaving the lung will depend on the initial deposition pattern of the aerosol. For a given rate of MCC, higher deposition in the tracheobronchial airways would be expected to give rise to higher percentage clearance values. The initial aerosol deposition pattern within both the inner and outer zones was determined by using 24 hours clearance as a measure of the deposition in the tracheobronchial airways.(9)
Calculation of tracheobronchial clearance
The tracheobronchial counts for the inner and outer regions, CTI(t) and CTO(t) were calculated by subtracting the corresponding alveolar counts CAI and CAO. These alveolar counts were derived from the 24 hours measurement on the assumption that all the ciliated airways have been cleared at 24 hours, so that the counts remaining at 24 hours represent alveolar deposition. Therefore, CAI = CI(24 hours) and CAO = CO(24 hours) and
The tracheobronchial clearance (TBC) for the outer zone can then be calculated from clearance Equation (1):
For the inner zone the calculation uses the corrected clearance Equation (2). The total tracheobronchial input at time t in the inner zone, IT(t) is given by
This assumes that all the input from the outer to the inner zone goes into the tracheobronchial airways. So, the inner zone corrected TBC is given by:
Combining the inner and outer zone TBC values
The tracheobronchial tree within the lung can be considered in two sections, the bronchial airways (generations 2–8) and the bronchiolar and interstitial airways (generations 9–16 and part of generations 17–19, respectively).(10,15) These two airway sections overlap the 2D inner and outer zones used in this study. The outer zone will be dominated by the bronchiolar and interstitial airways, whereas the inner zone will contain not only most of the bronchial airways but also a significant contribution from the bronchiolar and interstitial airways. This means that the clearance from the two zones will provide complementary information on the clearance from the different airway categories.
It was, therefore, considered valuable to investigate whether more information on airway clearance within the tracheobronchial tree could be obtained by using the combined information from the two zone clearance values. We approached this by deriving a theoretical expression describing the relationship between clearance in the 2D lung zones and that in the different airway categories.
The theory is based on the description of the tracheobronchial airway being divided into its two parts: (i) the pulmonary bronchial airways (b) composed of generations 2–8 and (ii) the bronchiolar and interstitial airways (bb) composed of generations 9–16 and part of generations 17–19.(10,15) Therefore, the counts in the tracheobronchial airway of the inner zone, are assumed to be corrected for any additional input from the outer zone, CITC(t), are given by:
where CIb(t) and CIbb(t) are the variations of counts at time t due to activity originating in (i) the bronchial airways and (ii) the bronchiolar and interstitial airways of the inner zone tracheobronchial airway. The tracheobronchial airway clearance at time t, TBCIC(t), is given by:
Substituting Equation (2) into Equation (3) and rearranging gives:
where TBCIb(t) and TBCIbb(t) are the percentage clearances from the bronchial and bronchiolar and interstitial airways, respectively, in the inner region, and f is the fraction of initial deposition in the bronchial component of the inner region tracheobronchial airway given by CIb(0)/[CIb(0)+CIbb(0)]. Note that the TBC of the inner zone bronchiolar airways in these equations, TBCIbb(t), includes the passage through the bronchial airways.
Previous work on the spatial arrangement of the different airway generations in both 2D(13) and 3D(16) lung shells has allowed us to estimate the volumes of the different airway regions in the inner and outer lung zones. This is shown in Table 1. Using these data, we make two assumptions, which allow us to estimate bronchiolar and interstitial clearance and then to apply Equation (4) to estimate clearance in the bronchial airways: (i) that the TBC from the outer zone represents bronchiolar and interstitial clearance (This is not unreasonable, as 96% of the volume of the tracheobronchial airway in the outer zone is in the bronchiolar/interstitial region.); (ii) that the initial deposition in the inner zone tracheobronchial tree is equally divided between the bronchial and bronchiolar and interstitial components. Although the volume of bronchial airways is lower than that of the bronchiolar and interstitial component (33% compared with 67%), the concentration of initial deposition will be higher in the more central airways as a result of the inhalation regime, which focused on delivering aerosol more centrally.(17)
Columns 2–4 Show the Percentage of Total Lung Volume of the Different Airway Regions in the Inner and Outer Two-Dimensional Lung Zones. Columns 5 and 6 Show the Percentage of Tracheobronchial Airway Volume in the Bronchial and Bronchiolar/Interstitial Regions for Both Lung Zones as a Percentage of the Total Conducting Airway Volume in That Zone
Based on these approximations, we can define an index of the clearance from the bronchial airways of the inner zone:
This parameter is clearly not an accurate measure of clearance from the bronchial airways, as it depends on assumptions that are not validated, so it is referred to as the bronchial airways clearance index (BACI). It gives an indication of the bronchial component of the inner zone clearance.
Statistical analysis
Except where stated, statistical analysis on results was carried out by using Excel (Redmond, WA). The Student's t-test was used to compare results between means, with a p-value of less than 0.05 being considered significant. However, where significances between the means of the three groups of subjects were being compared, the Bonferroni correction was applied to allow for multiple comparisons. This was implemented by using a threshold p-value a factor of three times smaller, that is, 0.0167.
Differences between inner and outer zone clearances were compared by using the paired t-test, with a p-value less than 0.05 being considered significant. Inter-subject variability within each group of subjects was assessed by the coefficient of variation. Differences between the distributions of results between groups were compared by calculating the proportion of values that overlapped. Proportions were compared by using the z statistic. Correlation coefficients were compared by using the comparing correlations website (comparingcorrelations.org). Testing for bimodality of the smoking control (SC) results was performed by the method described by Schilling et al.(18)
The Student's t-test was also applied to the comparison of the regional parameters obtained at the 3 hours end-point for the two COPD sub-groups based on the degree of emphysema, as described in the Subjects section.
Results
Measures of initial distribution of aerosol
The initial distribution of the aerosol within each zone was evaluated by using the 24 hours clearance. The results are shown in Table 2. The 24 hours clearance for COPD was significantly higher than that in the NSCs for both the inner and outer zones. Twenty-four hours clearance for the SCs was intermediate between the other two groups for both zones. It was significantly different from NSCs for the outer zone. Twenty-four hours clearance for the inner zone was significantly higher for the inner zone compared with the outer zone for all groups.
The Mean (COV %) Percentage Clearances at 24 Hours for Each of the Three Groups of Subjects for the Inner and Outer Lung Zones
The p-values of the comparisons between both the SC and COPD groups and the NSCs are shown. The p-values of the comparison between inner and outer zones are also shown for each group. Significant differences are denoted by an asterisk.
NSC, nonsmoking control; SC, smoking control.
Zone clearance curves
The mean clearance curves for the three groups of subjects for the inner and outer zones are illustrated in Figure 2a and c, respectively. The corresponding coefficients of variation are shown in Figure 2b and d. Note that the scales of all clearance and COV curves in Figures 2, 3, 4, and 6 are displayed to the same scales to facilitate comparison of values.


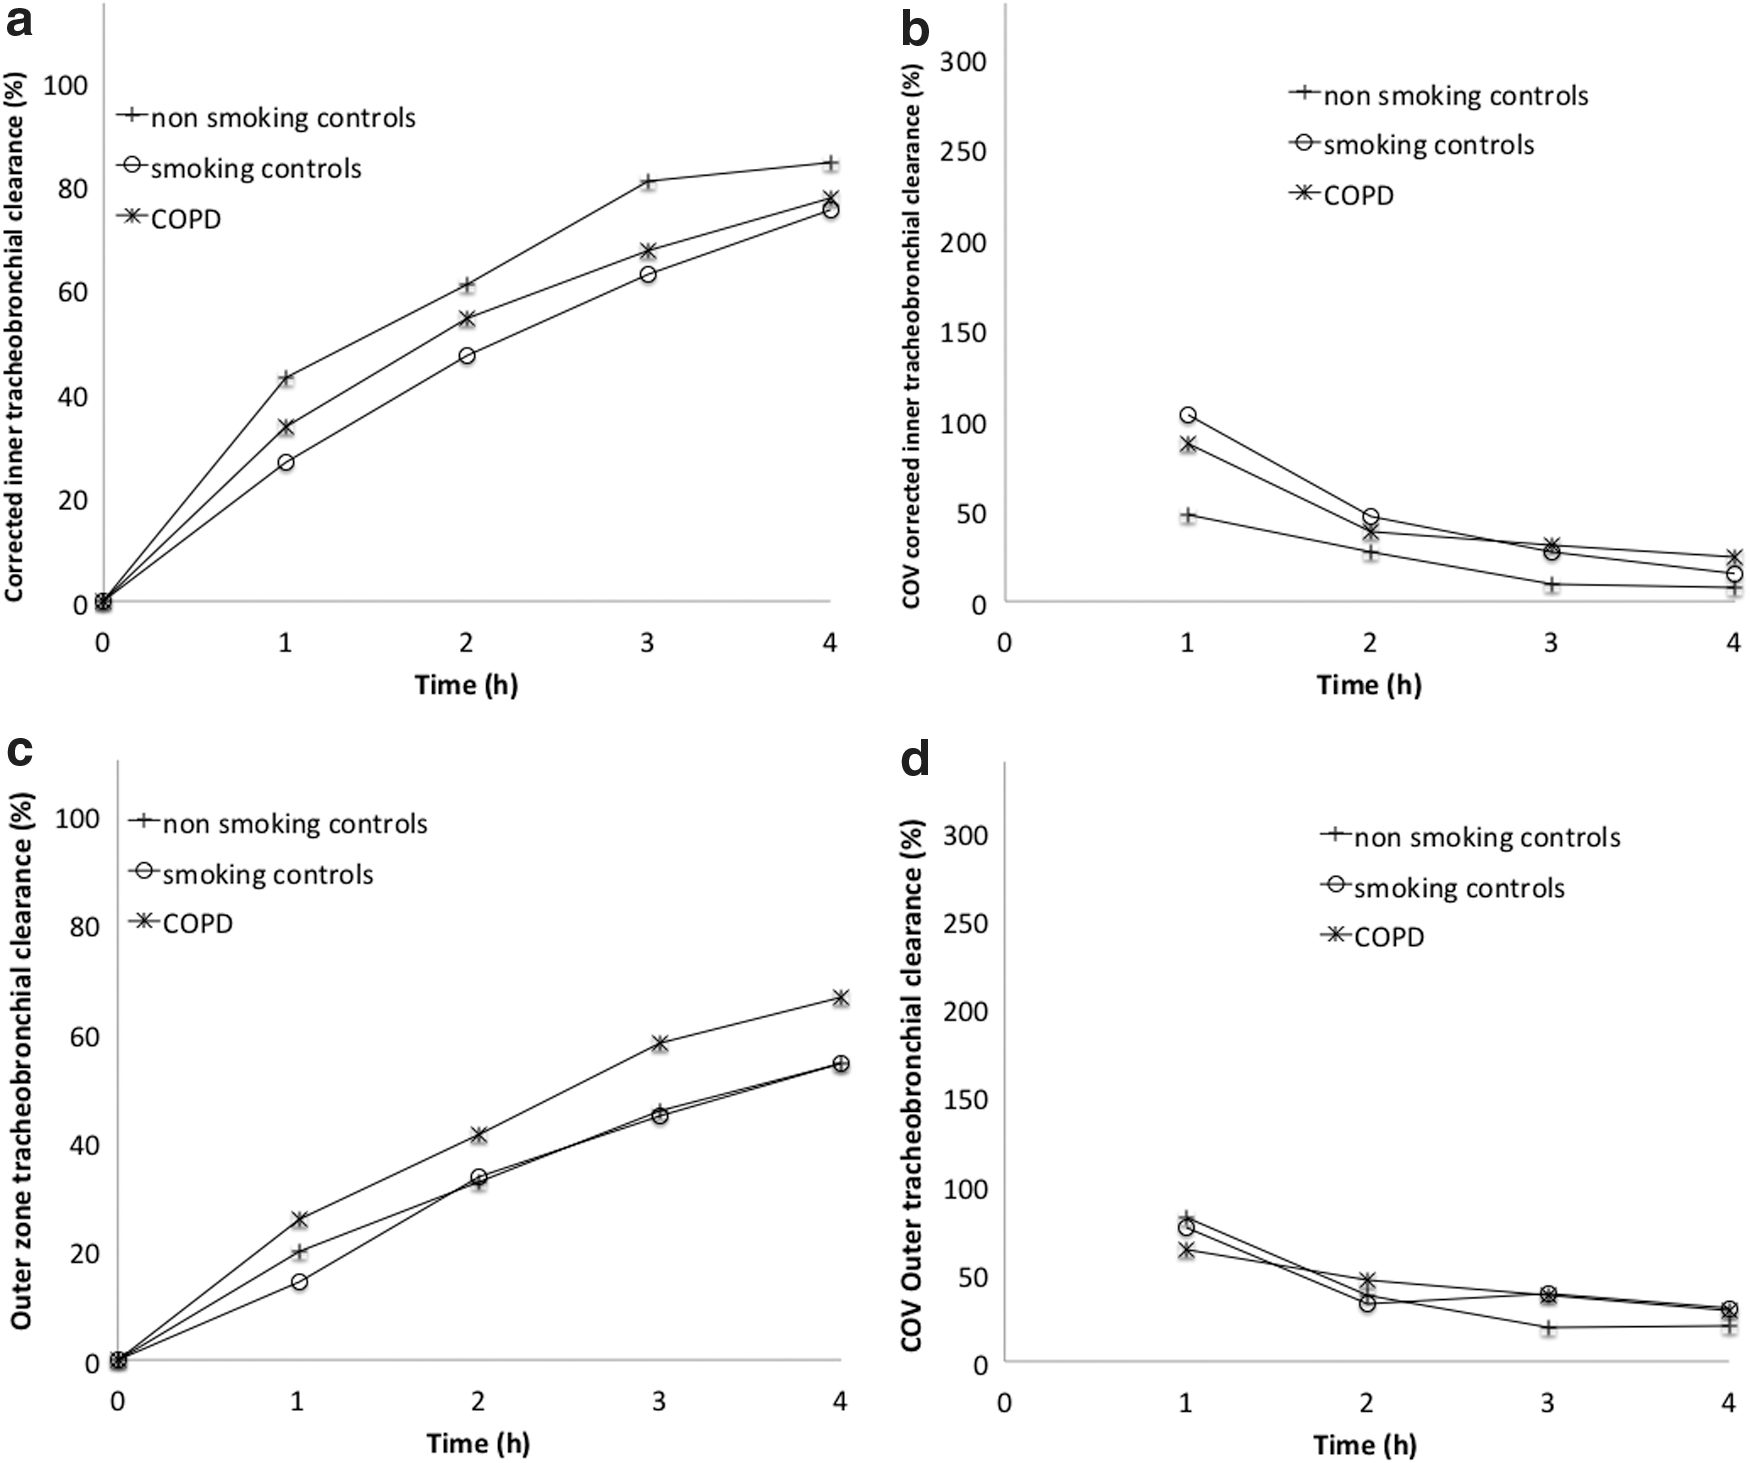
Over the first 4 hours after inhalation, the clearance from the inner zone for the COPD group was very similar to the NSCs. The mean inner clearance showed no difference between the groups. The clearance curve for the outer zone revealed the unexpected finding that the outer zone clearance for the COPD subjects was higher than in both the other groups. It was significantly higher compared with the NSCs at the 2-, 3-, and 4-hour time points and compared with the smoking group at the 4 hours time point. The outer clearance was not statistically different between the smoking and NSCs.
The coefficients of inter-subject variation were reduced with time for all groups, as was found with whole lung measurements.(8) The COV for the smoking group was particularly high for the 1- and 2-hour time points, indicating the large variation in clearance rates for this group.
In the previous study of whole lung clearance in this dataset, it was decided to use the 3 hours time point as the optimal endpoint for clearance assessment. This was based on the argument that the 3 hours measurements provided the best compromise between a parameter that reflected early clearance, while simultaneously minimizing inter-subject variation. As the regional results followed a similar pattern, it was decided to use the same endpoint. The summary of the clearance results at this time is shown in Table 3.
The Mean (±Standard Deviation) Percentage Clearances for the Inner and Outer Regions at the Endpoint Time of 3 Hours
The p-values of the comparisons between groups are also shown. Significant differences (p values below 0.0167) are denoted by an asterisk.
BACI, bronchial airways clearance index; TBC, tracheobronchial clearance.
Correcting inner zone clearance
The results of correcting the inner zone clearance for the additional aerosol entering the zone from the outer zone are shown in Figure 3a. The corresponding coefficients of variation are shown in Figure 3b. The results at 3 hours are shown in Table 3. As expected, percentage clearance values are increased after subtraction. Clearance in COPD was very similar to NSCs at all time points. Clearance is consistently reduced for the SCs, but none of these differences is statistically significant. The coefficients of variation reduce with time for all groups; they are lowest in the NSCs.
Normalizing clearance curves for initial distribution
The results of normalizing clearance for the effect of initial distribution to give the TBC are shown in Figure 4, and the values at 3 hours are listed in Table 3. Figure 4a and c show the corrected inner zone and outer zone TBC, respectively. The corresponding coefficients of variation are shown in Figure 4b and d.
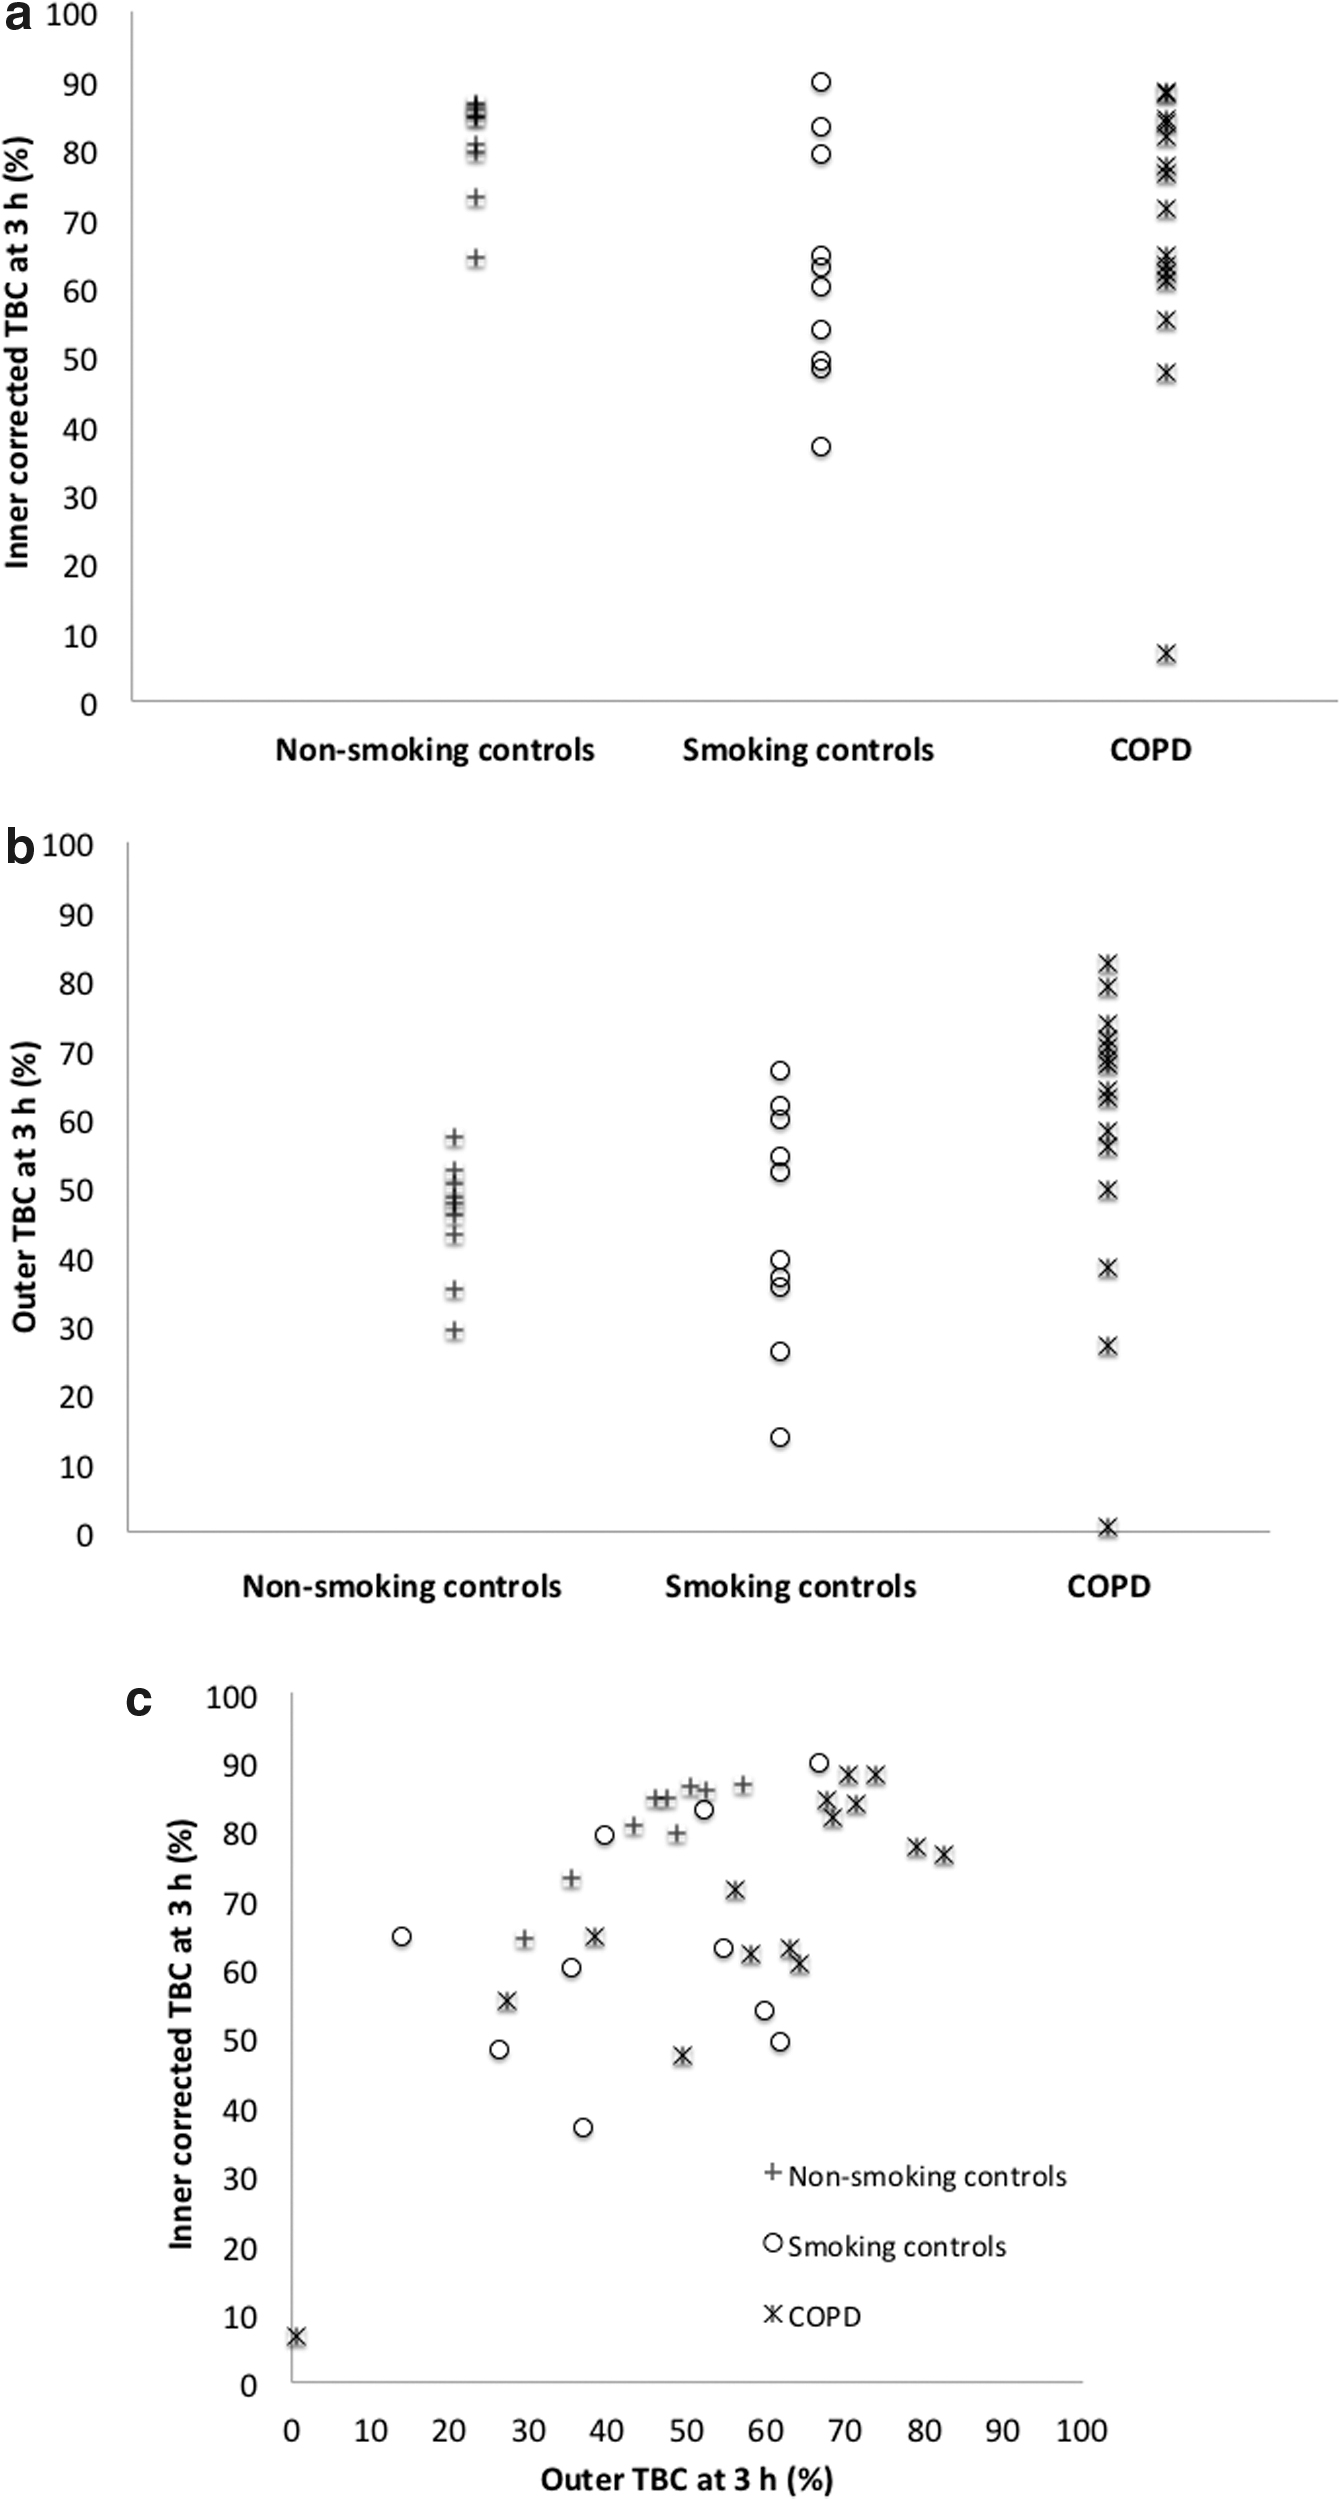
The corrected TBC for the inner zone was highest in the NSCs at all time points, with significant differences compared with the SC group at 3 and 4 hours. The mean corrected inner zone clearance of the COPD group was not significantly lower than that in the NSCs, but the distribution of results was different, with 6 out of 15 results below the lower limit of the normal range (p = 0.014).
Table 3 shows that the effect of correction on inner zone TBC was to increase the clearance values. This is because the uncorrected values are falsely lowered due to the input from the outer zone. Since the outer zone clearance is higher in COPD than in NSC, the effect of the correction process on the inner zone clearance is greater for the COPD group.
The mean outer zone TBC at 3 hours was higher in COPD than in both the other groups, although these differences were not significant. Although the mean clearance of the COPD group was not significantly higher than that in the NSCs, the distribution of results was different, with 10 out of 15 results higher than the upper limit of the normal range (p = 0.0006). The mean outer zone clearance in COPD was also higher but not significantly different from the SC group. However, the distribution of the results was different, with 7 out of 15 values in the COPD group higher than the SC range (p = 0.011).
Inter-subject COV for all groups reduced with time for both inner and outer zone data, and it was generally lowest in the NSCs.
Combining inner and outer zone TBC
The individual results for TBC for the inner and outer zones at 3 hours are shown in Figure 5a and b, respectively, and the comparison of the two clearance values at this time point is presented in Figure 5c. These graphs illustrate that although corrected inner zone clearance was not reduced from the NSC range in all COPD subjects (Fig. 5a), the clearance space graph allowed complete separation of the two groups (Fig. 5c).
The individual results by group of
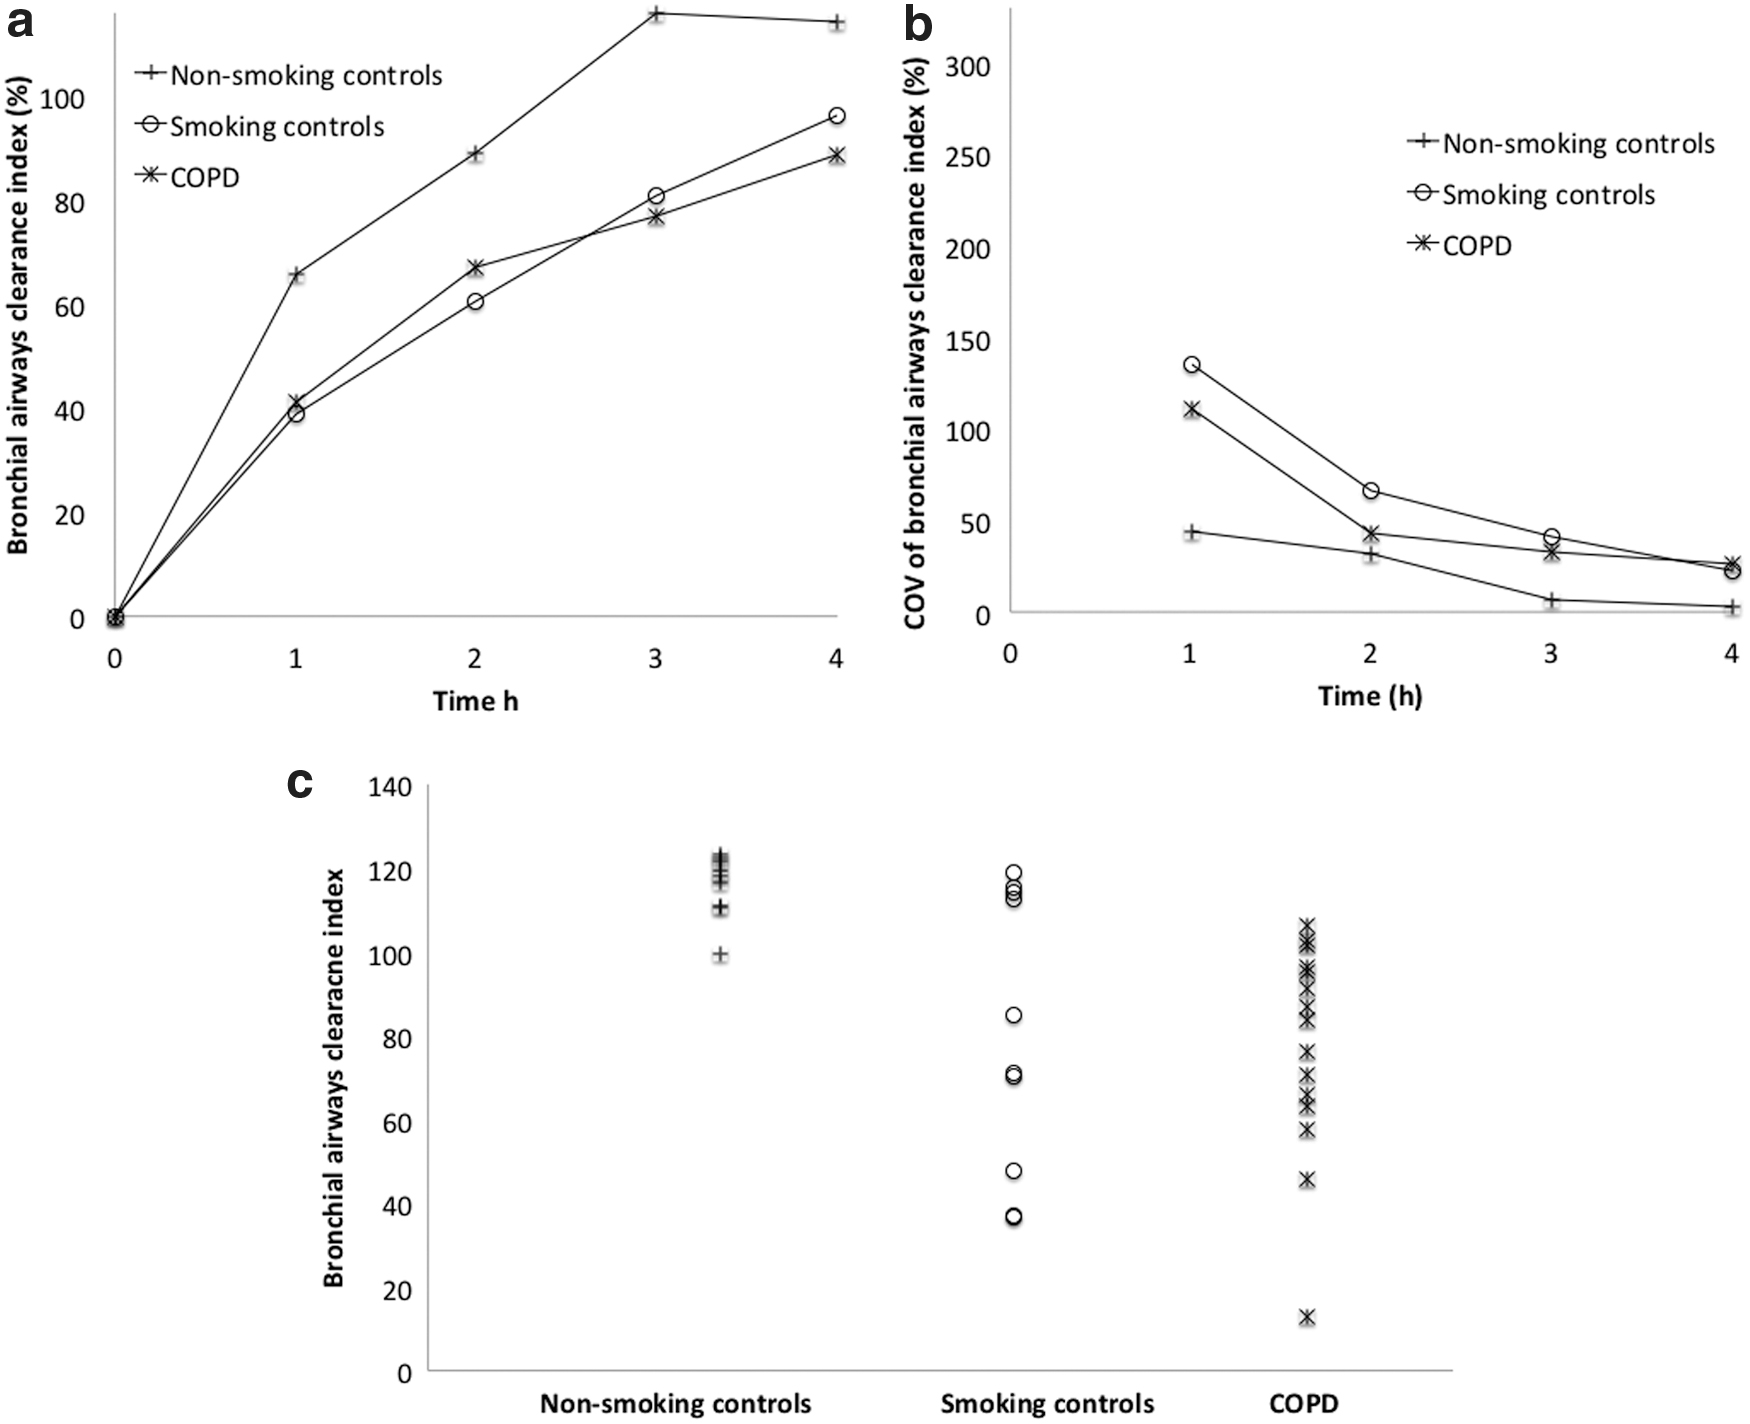
The results for the BACI are shown in Figure 6. Figure 6a shows the mean value of the index for each of the groups at the different time points. The clearance for the NSCs was higher than both the other groups at all time points. The difference was significant for both the SC and COPD groups at 3 and 4 hours. The values for smoking and COPD groups were similar. The corresponding coefficients of inter-subject variation are shown in Figure 6b, illustrating that the values improved with time after inhalation and were lowest for the NSCs and highest for the SCs. The individual results of BACI at 3 hours are shown in Figure 6c. The results show almost complete separation of the NSCs and COPD groups. The SCs are divided into two groups, with four subjects having clearance in the normal range and the others having reduced clearance. The distribution was bimodal in that the difference between the means of the two groups was greater than twice the common standard deviation.(18) The SC group had a significant proportion of subjects outside the range of the COPD results (p = 0.008).
The correlation of BACI with FEV1 is shown in Figure 7a. Across all subjects, the correlation is significant (r = 0.43, p = 0.01). It is apparent from visual inspection of the graph that the BACI in the SC group does not correlate with FEV1 and, if these subjects are excluded, the correlation improves (r = 0.59, p = 0.002).
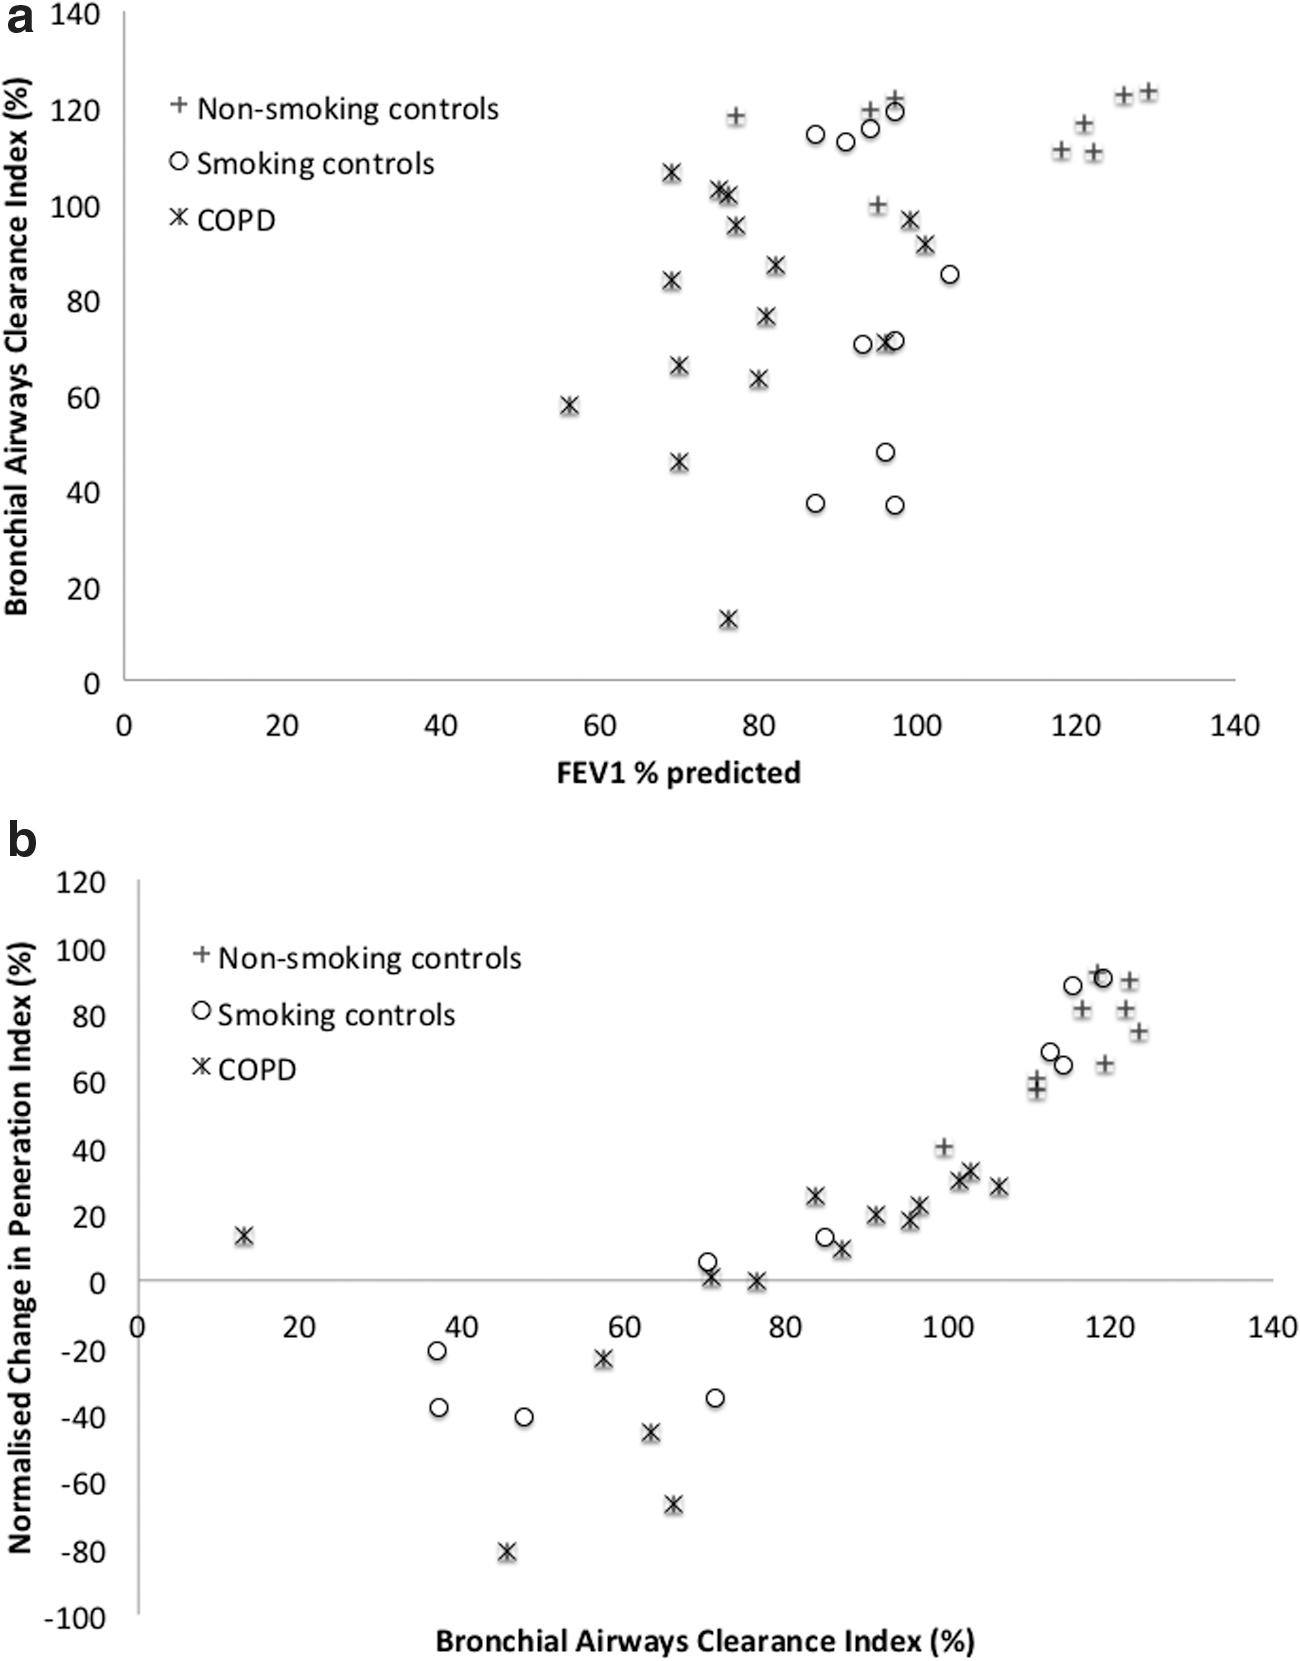
Figure 7b shows the correlation of BACI with the NOCHIP, obtained in the previous analysis of the dataset used in this study.(8) There is significant correlation between the results (r = 0.84, p < 0.00001), even including the one outlying point on the graph. The categorization of SC subjects as being inside or outside the NSC normal range is identical to NOCHIP.
There were no significant differences in the mean values of BACI or the outer zone TBC at 3 hours between the two sub-groups of COPD subjects with different degrees of emphysema.
Discussion
Previous analysis of whole lung clearance using the dataset described in this article was unable to demonstrate any difference in either whole lung clearance or TBC between the three groups of subjects.(8) In the case of the COPD group, this was felt to be at least partly due to the mild to moderate disease of the subjects. This study on the analysis of regional clearance has now demonstrated significant differences between the groups.
The simple inner zone clearance results were not significantly different between the groups, but when corrected for the contribution of aerosol from the outer zone and normalized for the different initial distributions of aerosol to calculate TBC, the SC group had significantly lower clearance and the COPD group had a significant proportion of results with clearance below the NSC range. In addition, although the mean outer zone TBCs were not different between the groups, the distribution of results was different, with a significant proportion of COPD clearances above the NSC range.
Combined analysis of the inner and outer zone clearance rates allowed indices of (i) bronchial and (ii) bronchiolar and interstitial airways to be estimated. Although there are clearly approximations in the equations used to derive these indices, they do illustrate the principle that estimation of clearance in different airway regions is possible. We believe that the results provide insights into the relative clearance from the different airway zones. In this study, the BACI showed significantly reduced values compared with NSCs in smokers both with and without COPD. Smokers with COPD showed generally reduced values of BACI whereas SCs were divided into two groups, those with normal values of BACI and those with reduced clearance.
Assessment of the initial deposition pattern
This was assessed for both zones by using the 24 hours clearance results as a measure of the percentage of aerosol in the tracheobronchial airways. For all groups, the mean 24 hours clearance was higher from the inner zone compared with the outer zone. This was expected due to the higher proportion of conducting airways in the inner zone (Table 1). The 24 hours clearance was raised significantly compared with the NSCs in the COPD group for both zones and for the SCs in the outer zone.
Regional MCC in nonsmoking healthy control subjects
All measurements of regional clearance in both inner and outer zones in the NSC group rose monotonically over the first 4 hours after inhalation, with the rate of increase reducing with time (Figs. 2, 3, 4, and 6). The effect of the correction and normalization processes are summarized in Table 3 for the 3 hours endpoint. The clearance for the inner zone increased after correction for the input of aerosol from the outer zone from 44% to 61%, illustrating the important effect of the correction process. The clearances for both zones increased on normalization to the 24 hours clearance to give the TBC.
This pattern of results is similar to that described by Agnew et al.(9) This is illustrated in Figure 8, which shows the corrected TBC curve for the inner zone for the NSCs in our study compared with those from the Agnew study. The curves are similar in shape but with consistently lower values from our study. In both cases, the clearance is almost complete by about 4 hours. The outer zone clearance at 3 hours was similarly lower for our study: 46% compared with Agnew's 57%. These differences may be attributed to differences in type of aerosol, inhalation regime, and region of interest definition.
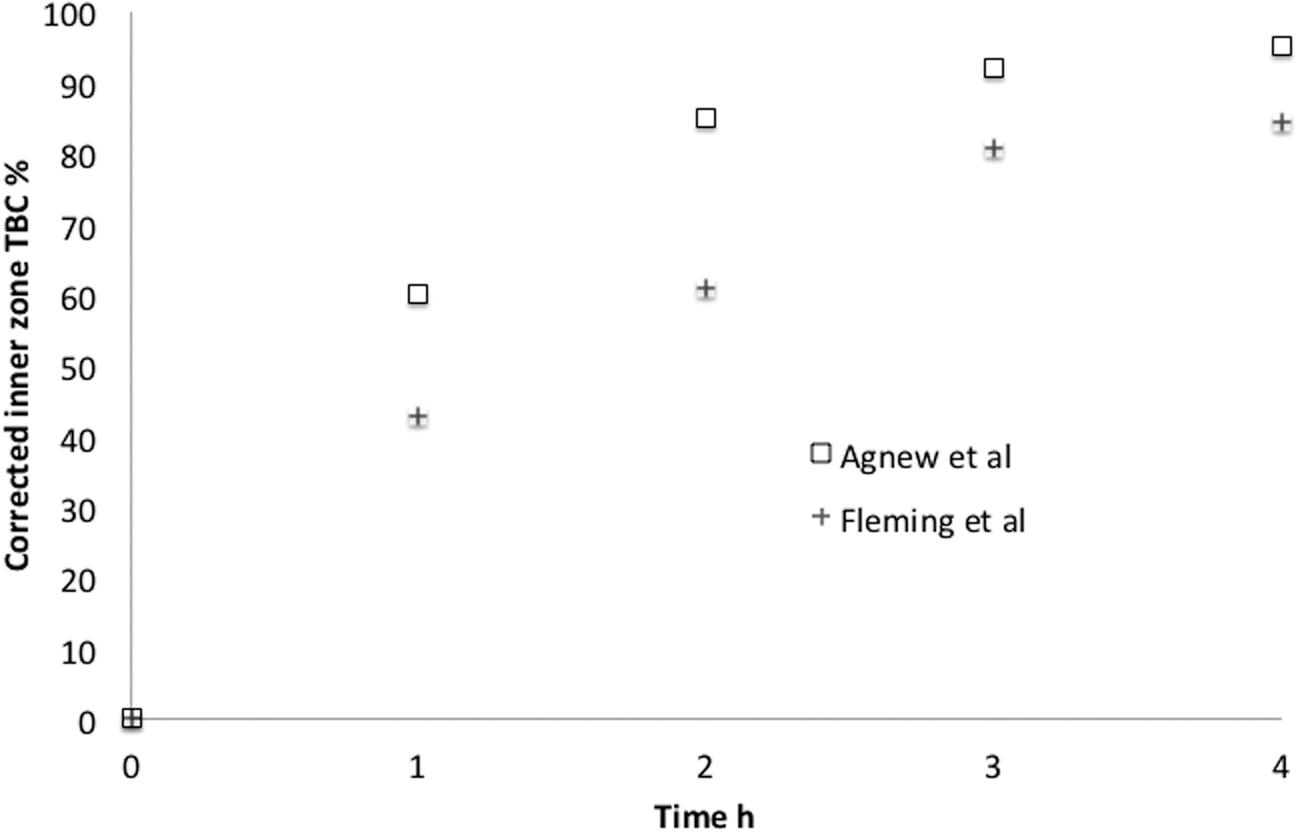
The variation with time for the corrected inner zone TBC in the current study with that of Agnew et al.,(9) who used the same method of correcting for the input of aerosol from the outer zone into the inner zone.
When the corrected clearance results are further analyzed to obtain indices of bronchial and bronchiolar and interstitial airway clearance, the mean value of the former at 3 hours in the NSC group was 116%. This is significantly greater than 100% (p < 0.0001), which clearly suggests that some of the assumptions made in the calculations are not accurate, as discussed earlier. The bronchiolar and interstitial clearance rate of 46% at 3 hours was estimated from the outer zone TBC. Note that this value will overestimate the clearance rate for aerosol originating in these airways to completely clear from the lung, as it will also have to pass through the inner zone on its way out of the lung.
Regional MCC in the different groups
Nonsmoking versus SCs
The inner zone clearance at 3 hours in smokers was not significantly reduced compared with NSCs either before or after correction for the input from the outer zone (Table 3). However, both the corrected TBC and BACI at 3 hours were reduced, (p = 0.005 and p = 0.004, respectively). Both the mean outer zone clearance and TBC for smokers were similar to the nonsmokers.
Consideration of the individual results for the BACI in Figure 6c shows that the SC results are clearly divided into two groups, with 4 out of 10 results in the control range and 6 with reduced clearance. This confirms the finding of our previous study using the NOCHIP, which also detected the same two subgroups of smokers.(8) The number of subjects is small, but it suggests that measurement of regional clearance may be useful in identifying subjects with lung impairment as a result of smoking, who might be more at risk of developing further lung disease. The correlation of BACI with FEV1 in Figure 7a shows that there is no correlation for the smoking group. This suggests that measurements of FEV1 in smokers do not provide a good index of the damage being done to the cilia of the bronchial airways from smoking.
NSCs versus COPD
The mean corrected TBC was not significantly reduced at 3 hours in COPD compared with NSC (p = 0.04). However the index combining the inner and outer zone TBC values (BACI) was significantly reduced in COPD. BACI correlated well with FEV1, particularly when the SCs were excluded from the correlation, showing that FEV1 was a reasonable marker of the damage to the cilia of the bronchial airways in these subjects.
In these mild-to-moderate COPD subjects with CB, the mean outer zone clearance of 40% was very similar to that of the inner zone (39%). This explains the finding in our previous article: that the average normalized change in penetration index in these subjects was close to zero.(8)
TBC at 3 hours was not significantly raised in the outer zone for COPD compared with NSC (p = 0.03). However consideration of the individual results (Fig. 5b) showed a wide variation of rates for the COPD group, with a significant number of subjects having TBC values above the NSC range (p = 0.0006). This gives additional evidence to the suggestion that the production of increased mucins in mild COPD tends to increase peripheral airway clearance.(19,20)
These findings also show why our previous study on whole lung clearance failed to demonstrate a difference for these mild COPD subjects compared with controls,(8) the reduced central airway clearance being balanced by the increase in peripheral clearance.
The reduction of clearance in the bronchial airways in COPD is expected from previous studies investigating regional clearance in COPD. Smaldone et al.(5) showed that inner zone clearance gave higher values than whole lung measurements, which is consistent with our results. Anderson et al.(7) also demonstrated that TBC of the inner zone was reduced in COPD and that the reduction correlated with severity of disease as estimated by FEV1.
SCs versus smokers with COPD
None of the mean values of the regional clearance parameters were different between the smokers with and without COPD. However, the distribution of results for the BACI was different: The SCs were divided into two groups with a significant proportion of values (40% 4/10) outside the COPD range, and with the other values (6/10) within the range. Regional clearance measurements may, therefore, identify asymptomatic smokers whose clearance mechanisms are being compromised through their smoking. Interestingly, the increase in outer zone clearance observed in the COPD subjects was not seen in the SCs, which had very similar outer zone clearance to the NSCs.
Regional versus whole lung clearance
These results help to explain the results of our previous study, which found that the measurement of total lung TBC showed no difference between groups whereas the NOCHIP did.(8) This study shows that for all groups the mean inner zone TBC is higher than that in the outer zone, so that the total clearance values are intermediate between the two. However, the difference between the inner and outer rates is much less for the SC and COPD groups compared with the NSCs. This explains: (i) why the differences between NSCs and COPD found for the inner zone TBC are masked when measuring the total lung clearance and (ii) why the NOCHIP is able to detect the differences between groups.
The results for NOCHIP were very similar to those found for BACI, with close correlation between the two parameters. The BACI results help to explain the underlying reason for the success of the empirical parameter, NOCHIP, in distinguishing between the NSC and COPD groups; that it is only clearance of the bronchial airway that is impaired in COPD, whereas the bronchiolar and interstitial clearance is increased in some of these subjects. Thus, NOCHIP, the normalized change in penetration index, is demonstrated to be an empirical parameter that reflected bronchial airway clearance in this group of subjects.
The reduced inner zone clearance in COPD in our study concurs with results of previous studies of regional clearance on COPD subjects with CB, which included a wider range of subjects with a lower average FEV1.(2,5) However, these studies also observed a reduced peripheral clearance in COPD compared with normal. This is in contrast with our study, where a significant proportion of COPD subjects had a higher clearance in the outer zone compared with NSCs. Our results suggest that, in the interests of maximizing the information available from imaging studies of MCC, both normalization to 24 hours clearance and assessment of regional clearance are likely to provide significantly improved information on clearance than whole lung measurements. Agnew et al.(9) also demonstrated the value of both these corrections in clarifying differences in clearance in asthma.
Technical aspects
The study has applied a number of different corrections to the data, and the effects of these are now discussed in more detail.
Correction for 24 hours clearance to obtain an estimate TBC is a generally accepted technique.(9) This has usually been applied to whole lung clearance, but it has also been used for regional measurements.(7,9) Although there is debate about whether it accurately reflects the actual clearance from the tracheobronchial airways,(4) the correction certainly provides normalization to a measure of the amount of aerosol available for fast clearance. Table 2 shows that 24 hours clearance in the outer zone was lower than that for the inner zone for all groups of subjects. This is expected due to the larger proportion of tracheobronchial airways in the inner zone compared with the outer zone.
The correction of the inner zone clearance for the contribution of aerosol entering the zone from the outer zone was described by Agnew et al. in 1984,(9) but, as far as can be determined from the literature, it has not been used in more recent studies on measuring regional MCC.(7,21) Simple measurements of clearance in the inner region will always underestimate the true value, due to aerosol entering it from the outer region. In our study, the rate of aerosol leaving the outer region was shown to vary between groups (Table 3). This means that that the underestimate of clearance will not be systematic between groups, and so correction for its contribution is important. As discussed in the Methods section, the correction technique is not exact, but it will, nevertheless, almost certainly give rise to a more accurate reflection of the actual clearance, compared with using the uncorrected values.
The combined analysis of clearance rates from the inner and outer zones is now considered. The two zones contain different proportions of bronchial and bronchiolar and interstitial airways and this has enabled a novel index of clearance to be obtained: the BACI. This has been derived theoretically, which means it has the advantage, in principle at least, of being applicable to any time point or dataset. It has differentiated very effectively between the groups of subjects in this study. It is also valuable in that it serves to provide a theoretical explanation for the difference in results found in basic whole lung clearance measurements compared with the empirical parameter, NOCHIP. The failure of whole lung TBC to observe a difference between NSCs and COPD is now clearly explained in the light of the increased clearance rate in the bronchioloar and interstitial airways in these mild-to-moderate COPD subjects.
It should be noted, however, that the BACI values are not an accurate measure of bronchial clearance, as the percentage values for the NSCs go above 100% at times after 2 hours. This is presumably due to the fact that one or more of the assumptions made in the calculations may be incorrect, that is (i) that aerosol entering the inner zone from the outer zone will be handled similarly to that initially deposited in the inner zone, (ii) that the tracheobronchial airway of the outer zone contains only bronchiolar and interstitial airways, and (iii) that the initial deposition of aerosol in the tracheobronchial airway is equally divided between bronchial and bronchiolar and interstitial airways. Although all these assumptions seem reasonable approximations, they are clearly not validated and their errors are unknown.
Limitations of the study
This study was limited by the relatively small subject numbers and by the limited range of disease severity in the COPD group. However, despite the low numbers, significant conclusions have been made and the limited range of disease severity has served to demonstrate the value of regional compared with whole lung measurements.
The extent to which distinction between the bronchial and bronchiolar and interstitial components of the tracheobronchial airways has been achieved has been limited. Further studies to explore better assumptions applicable to this 2D data are indicated. This might include basing the relative contributions of the different regions of the airway on surface area rather than volume, as we have done in this study. Additional data informing these assumptions would be available from 3D imaging using single photon emission tomography, positron emission tomography, and high-resolution CT. Despite the current limitations of BACI, it is considered, in principle, to be a more generalizable parameter than NOCHIP; BACI is based on theory, whereas NOCHIP is an empirical parameter.
The purpose of the study was to compare clearance in COPD with control subjects. Therefore, we focused on measuring inter-subject rather than intra-subject variability and did not perform repeat measures in individual subjects. Intra-subject variability is, however, important in studies monitoring the effect of an intervention. It is a component of inter-subject variability and it seems highly likely that at least some of factors that affected inter-subject variability assessed in this and other studies will also affect intra-subject variability. A study of whether the control of inhalation technique, for example, could specifically improve intra-subject variability would be valuable future work.
Conclusions
. Combined analysis of regional MCC rates improves the information about clearance differences between NSCs, SCs, and subjects with mild-to-moderate COPD with CB compared with whole lung measurements.
i. Clearance in the bronchial airways derived by using the methods described in this article is significantly reduced in mild-to-moderate COPD compared with NSC subjects.
ii. Clearance from the outer lung zone, which approximates to bronchiolar and interstitial airway clearance, is increased in some subjects with mild-to-moderate COPD.
v. SC subjects are divided into two groups, with some having a reduced BACI, and others having values in the NSC range.
Footnotes
Acknowledgments
J.C., J.S.F., and M.J.B. would like to acknowledge the support of the Southampton Respiratory Biomedical Research Unit, which is funded by the UK National Institute of Health Research. The authors also thank Ms Sandra Johns and her staff of the Department of Nuclear Medicine for carrying out the imaging studies.
Author Disclosure Statement
The authors declare they have no competing financial interests.
Funding Information
This study was part of a research project titled “Quantitative assessment of mucociliary clearance (MCC) in Chronic Obstructive Pulmonary Disease,” which was funded by AstraZeneca (Study No. D6256M00047) and supported by the National Institute of Health Research Biomedical Research Unit in Respiratory Disease at University Hospital Southampton NHS Foundation Trust.
Reviewed by:
Timothy Corcoran
William Bennett