




Abstract
Background:
Measurement of aerodynamic particle size distribution, a clinically relevant in vitro attribute of inhalable drug products, involves multistage cascade impactors and is tedious and expensive. A leading candidate for a quicker method is the reduced NGI™ (rNGI). This method involves placing glass fiber filters on top of the nozzles of a chosen NGI stage, selected often to collect all particles with an aerodynamic diameter smaller than approximately five microns. These filters contribute additional flow resistance that can alter the flow rate start-up curve, potentially affecting the size distribution and mass of the drug product dispensed by passive dry powder inhalers (DPIs). The magnitude of these additional flow resistance measurements is currently unreported in the literature.
Materials and Methods:
We placed glass fiber filters on top of the stage 3 nozzles of an NGI, along with the necessary support screen and hold-down ring. We measured the pressure drop across NGI stage 3 with the assistance of a delta P lid and a high-precision pressure transducer. With each filter material type and multiple individual filters, we gathered eight replicates at flow rates of 30, 45, and 60 L/min.
Results:
The filters typically doubled the total pressure drop through the NGI. For example, at a flow rate of 60 L/min, the Whatman 934-AH filters introduced a pressure drop of about 9800 Pa at stage 3, reducing the absolute pressure exiting the NGI to about 23 kPa below ambient, compared with a typical value of 10 kPa for the NGI alone at this flow rate.
Conclusions:
The pressure drop across typical filters is approximately equal to that through the NGI alone and therefore will affect the flow start-up rate intrinsic to compendial testing of passive DPIs. This change in start-up rate could cause differences between results of the rNGI configuration and those of the full NGI and will increase the required vacuum pump capacity.
Nomenclature
D50—the aerodynamic particle diameter captured with 50% efficiency at a given impactor stage.
NGI™—Next Generation Impactor, a trademark of MSP Corporation, Shoreview, MN.
rNGI—reduced NGI; NGI with a filter on top of a chosen nozzle piece (numbers 2 to 7).
Introduction
Pharmacopeial methods1,2 for measuring the size distribution of particles emitted by dry powder inhalers (DPIs) require multistage cascade impaction because it is the only method capable of determining particle size and at the same time capturing enough material for quantitative determination of active pharmaceutical ingredient(s) [API(s)] in each size fraction. Cascade impaction methods can be tedious and time-consuming and therefore expensive. Consequently, there continues to be an interest in quicker methods, typically involving fewer cascade impactor stages, to reduce the workload while maintaining adequate quality control information.
A leading way for achieving a quicker method 3 involves placing a filter on top of the nozzle piece for any stage—two through seven—of the NGI™ (such as figure 10.64b in the study by Tougas et al. 3 ). As an example, a filter placed on top of the stage 3 nozzle piece of the NGI will capture all particles smaller than the D50 value of stage 2. The material captured in cups 1 and 2 and by the filter would be analyzed for API(s). There would be no particles in NGI cups 3 to 8.
Therefore, this impactor arrangement involves recovering the drug product from a reduced number of cups (two cups rather than eight cups) and is therefore called a reduced NGI or simply the rNGI configuration. Particles smaller than five microns are often considered fine for the purpose of assessing the ability of an aerosol to disperse into the lung. 1
When the flow rate at the inlet of the NGI is 60 L/min, the D50 value of stage 2 is 4.46 μm, 4 rather close to 5 μm, which leads many investigators to place a filter on top of the stage 3 nozzle if testing the rNGI configuration. Depending on the definition of “fine” and the intent of the rNGI method, the user can ideally choose an advantageous location of the filter and an advantageous flow rate at which to run rNGI tests.
A potential technical problem with the rNGI concept is that glass fiber filters introduce significant flow resistance, causing the airflow to start up more slowly than in full NGI testing using compendial methods. 5 Start-up kinetics is one of several factors influencing the dispersion from passive DPIs in compendial testing.6–8 No data exist in the open literature that indicate the magnitude of the airflow resistance of typical glass fiber filters, and consequently practitioners in the field have no means of anticipating the importance of the flow resistance issue.
For these reasons, we report here the pressure drop across several filter types commonly in use by the inhaler testing community when testing the rNGI configuration and other test systems. We also report the absolute pressure of air exiting the rNGI because the gas density influences how large the vacuum pump needs to be for compendial testing of passive DPIs.
In addition, we describe the need for a repeatable method of placing the filter successfully on the top of an NGI nozzle piece when using the support screen and hold-down ring manufactured by MSP Corporation (Shoreview, MN). We also report the pressure drop across the TSI Model 4043 flow meter, with its accompanying high-efficiency protective filter, because this flow meter and filter are also in common use in the industry. This pressure drop reduces the gas density and should be considered when aiming to understand downstream filter face velocity and pressure drop.
Materials and Methods
We studied the pressure drop of the rNGI with five types of binderless glass fiber filters (Table 1), each in the form of 42.5-mm-diameter discs and placed on top of the stage 3 nozzle piece of an NGI. Filters of this diameter fit nearly perfectly onto the top side of any of the six NGI nozzle pieces (stages 2–7). There are several suppliers and manufacturers of binderless glass fiber filters. A definitive specification of each grade of material does not exist in the open literature, but manufacturer specification literature partially fills that gap.
Filter Media Studied
Grade A–E is offered by many suppliers (e.g., Pall product 61631).
Efficiency for 0.3-μm particles in gas filtration.
934-AH is a trademark of Whatman plc; rights acquired by GE Healthcare UK; now owned by Cytiva Life Sciences (Marlborough, MA), part of the Danaher Corporation (Washington, DC).
EPA, Environmental Protection Agency.
Filter users must be wary of remarks such as pore size in these glass fiber filter specifications. The most relevant specification for filtration of particles in gases is the capture efficiency of 0.3-μm particles because particles of this size are captured with the least efficiency of any particle size. 9 Consequently, filters so tested are more efficient for all real-world polydisperse aerosols.
To keep the filter media from being pushed partially into the nozzles themselves when the flow begins, it is important first to place a support screen on the top of the chosen NGI nozzle piece (Fig. 1; part number 0170-78-0412; TSI Inc., Shoreview, MN). Then, the 42.5-mm disc of filter media can be placed on top of this support screen.
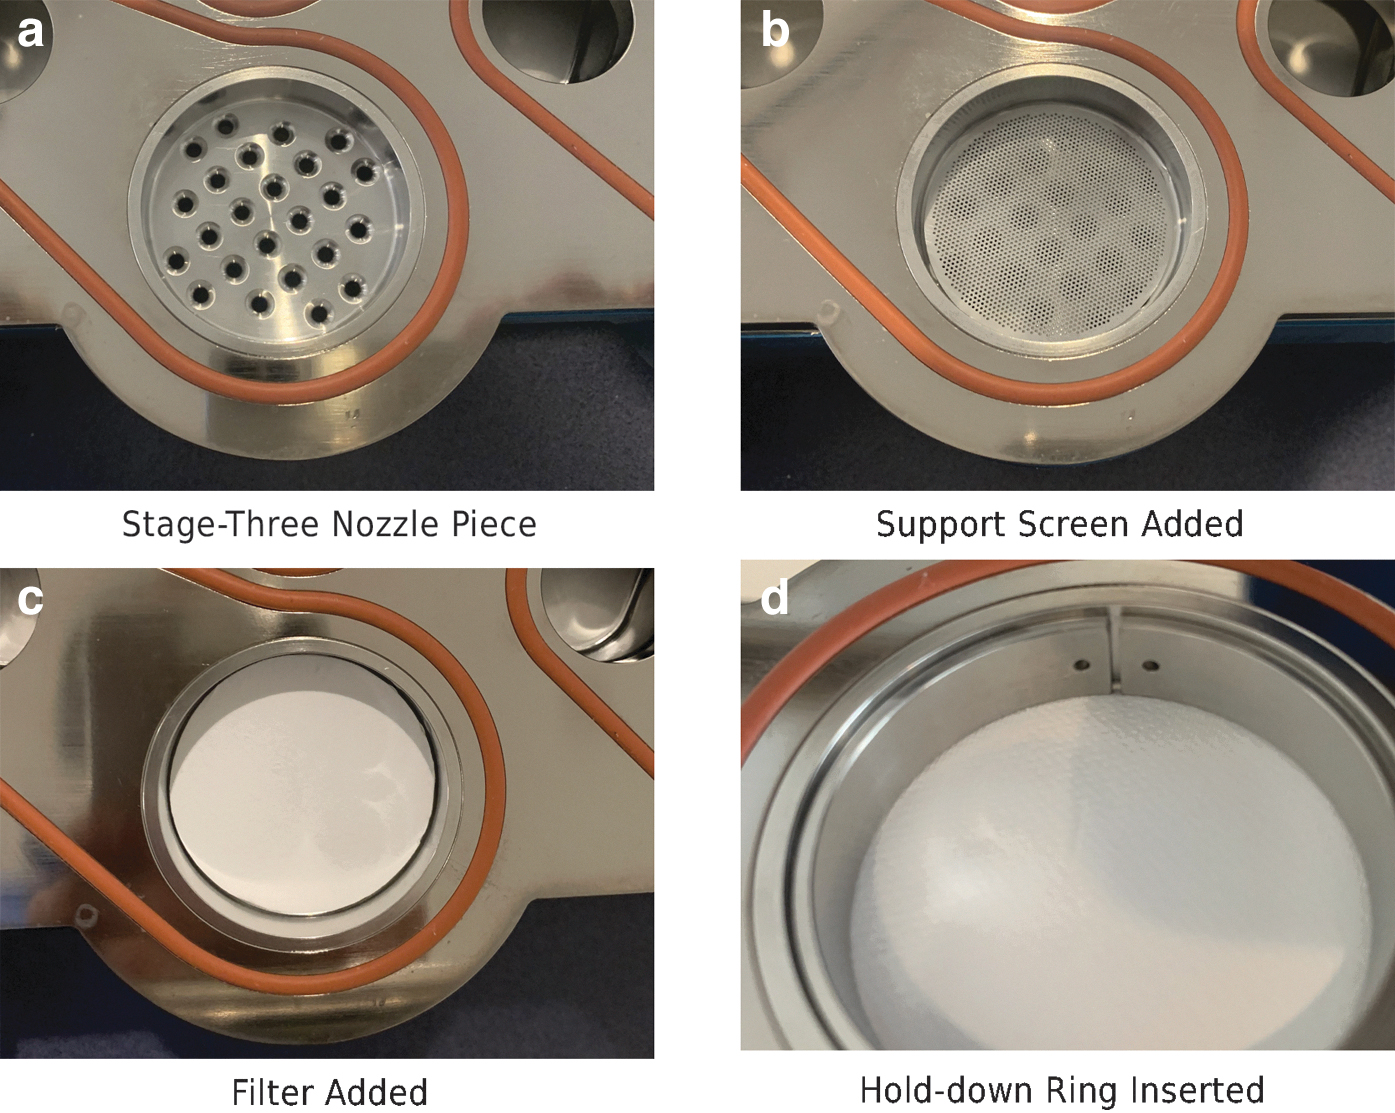
Placing a filter on top of the stage 3 nozzle piece (
Finally, to ensure that the filter remains firmly in place, a split hold-down ring, approximately 1.5 mm thick and 9 mm tall (part number 0170-78-0413; MSP Corporation), must be inserted with retaining ring pliers (e.g., Gearwrench product 3151; Apex Tool Group, Sparks, MD) so that it rests on top of the filter disc at its outer edge and along the side of the NGI nozzle piece.
We drew room air into an NGI equipped with a lid that had a port in each interstage passageway to enable pressure measurements before or after any stage (part number C005019-A; AB FIA, Lund, Sweden). The air first passed through a high-efficiency filter (SKU 1602300; TSI Inc.) attached to the inlet of a hot-film flow meter (Model 4043; TSI Inc.; Fig. 2). This flow meter was attached to the inlet of the NGI induction port with a silicone rubber adapter (part number 5238; Copley Scientific, Nottingham, UK).

Flow system for testing the rNGI pressure drop. The flow system is rather conventional, but includes a special lid on the NGI, which allows access to ports upstream or downstream of any NGI stage. Pressure measurements are made for the ambient atmosphere and at the three numbered locations of the special NGI lid.
Just downstream of the NGI exit, we used a bonnet needle valve (part number SS-1RS8; Swagelok, Solon, OH) to control the flow rate at the inlet of the NGI to the desired value. An oil-free carbon-vane pump (Model VT 4.8; Becker Pumps Corporation, Cuyahoga Falls, OH) was the last item in the flow stream. We protected this pump from any unintentional particulate matter with a Pall breathing filter (Model BB50T; Betty Mills Company, San Mateo, CA) placed just upstream of the pump inlet. The pump was constantly on during the pressure and pressure drop measurements.
We used a high-precision pressure transducer (Model CPT6020; Mensor LP, San Marcos, TX) to make pressure measurements of the surrounding atmosphere and at three points of the flow stream (Fig. 2); point 1 was in the interstage passageway between stages 2 and 3 of the NGI, point 2 was in the interstage passageway between stages 3 and 4, and point 3 was at the exit of the micro-orifice collector (MOC). The difference between the pressure levels at points 1 and 2 is the pressure drop across stage 3 of the NGI. This transducer has a range of 55,200 to 117,200 Pa with a reading accuracy of 0.02%.
Any pressure difference, calculated by subtracting one pressure measurement from another, therefore has an accuracy of 0.028%. The pressure of ambient air was in the range of 99,500 to 100,500 Pa. The pressure decreased by ∼500 to 1500 Pa, depending on flow rate, before reaching the upstream side of the stage 3 nozzle piece where the glass fiber filter was. The pressure drop values across the filters held on top of the stage 3 nozzle piece ranged from 3000 to 10,000 Pa for NGI inlet flow rates of 30, 45, and 60 L/min.
For any individual pressure measurement, a single outlet port on the special lid was connected to the pressure transducer with a silicone rubber tube (7/32” OD, 3/32” ID; part number 51135K14; McMaster-Carr, Elmhurst, IL; depicted as solid lines in Fig. 2). All other outlet ports of the special lid where pressure was not being measured were capped with rubber extensions for glass rod stirrers (rubber policeman, straight, 1/8 inch, item number 201AA; Walter Stern, Inc., Port Washington, NY).
When it came time to measure from a different outlet port, the rubber “policeman” was removed manually and, as much as possible, simultaneously while moving the silicone rubber tube to the new measurement port. With the chosen, highly precise pressure transducer, measurement of the flow rate with the Model 4043 flow meter was the primary system uncertainty (±2%).
We used a sensitive differential pressure transducer (Model FCO 432; Furness Controls, Indian Trail, NC; full-scale 750 Pa) early in the testing program to ensure that the pressure drop across the clean, unobstructed, stage 3 nozzle piece was as expected (∼110 Pa when the inlet flow rate was 60 L/min, as in the study by Roberts et al. 10 ). With this same instrument, we determined that the pressure drop of the support screen with the hold-down ring on top of stage 3 nozzles was only 1% to 2% of the pressure drop observed when glass fiber filters were tested (therefore treated as negligible).
Results and Discussion
An early surprise in the testing was the discovery that the hold-down ring supplied by MSP Corporation (a division of TSI Inc.) is chamfered only on one side along the inner diameter and not on the opposite side where both its inner diameter and outer diameter have a sharp edge (Fig. 3). This chamfer means that the flow streamlines adjacent to the periphery of the flow path leading up to the filter disc itself differ depending on whether the chamfered edge is up, facing the direction of the incoming air, or down, pressed against the filter disc.
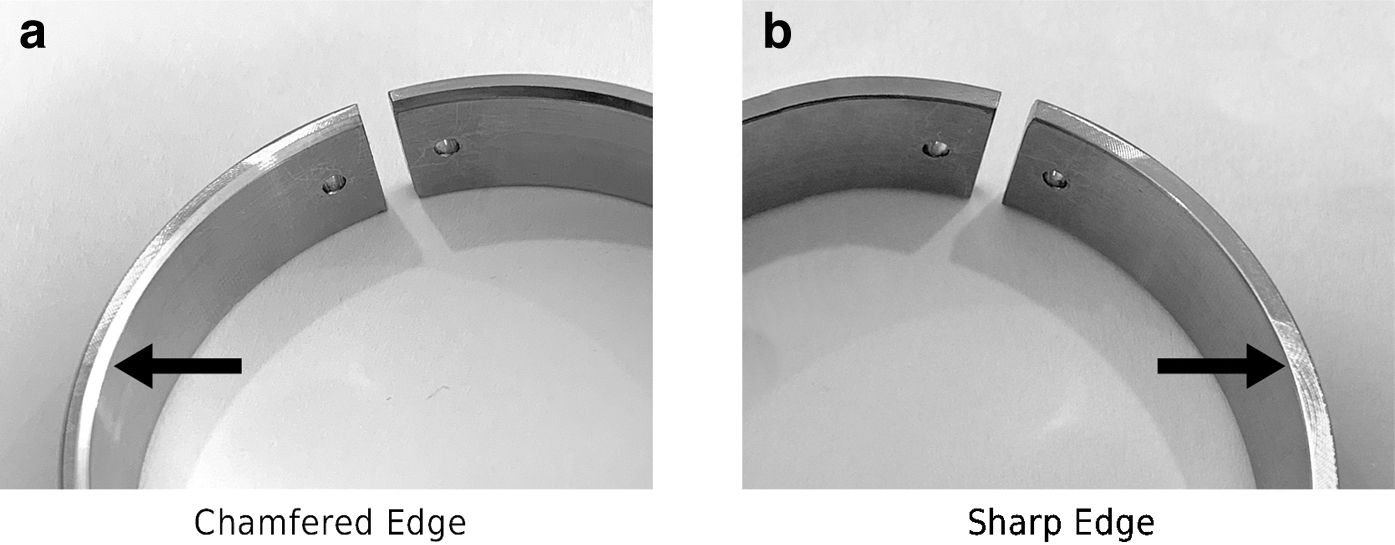
Chamfered edge of the hold-down ring (see arrow in
This aspect of the hold-down ring was not anticipated nor mentioned by the manufacturer. Early variability in some experimental results was unexpected, and after some exploratory work, we came to the conclusion that the hold-down ring needed to be placed with the chamfered edge up and in a controlled sequence of steps (Fig. 4).

Method for ensuring contact of hold-down ring with filter. A routine procedure is needed to press the hold-down ring into contact with the filter in a firm and regular manner. Numbers and arrows indicate the sequence used in this study.
These steps included exerting modest, but firm, pressure with a) fingers at two points 90 degrees from the tool location and then b) with the tool and fingers 180 degrees from the tool location. This process ensured that the hold-down ring engaged the filter all around the circumference.
We found that the filters on top of the stage 3 nozzle piece approximately doubled the total pressure drop through the NGI (Tables 2–6). In these tables, we have listed the nominal, baseline NGI pressure drop in the rightmost column. 10
Pressure Drop Characteristics with Sterlitech Grade A–E Filters
Ambient pressure ∼100,000 Pa. Number of replicate tests N = 8. NGI exit pressure, sample point number 3, Figure 2. Nominal baseline NGI pressure drop = 3.3 × (flow rate) × (flow rate). Pressure drop in Pa; flow rate in L/min; taken from Table 1 of reference 10; includes MOC pressure drop at 2 × flow rate × flow rate, based on personal experience.
MOC, micro-orifice collector; NGI, Next Generation Impactor.
Pressure Drop Characteristics with Sterlitech 934-AH Filters
Ambient pressure ∼100,000 Pa. Number of replicate tests N = 8. NGI exit pressure, sample point number 3, Figure 2. Nominal baseline NGI pressure drop = 3.3 × (flow rate) × (flow rate). Pressure drop in Pa; flow rate in L/min; taken from Table 1 of reference 10; includes MOC pressure drop at 2 × flow rate × flow rate, based on personal experience.
Pressure Drop Characteristics with Whatman 934-AH Filters
Ambient pressure ∼100,000 Pa. Number of replicate tests N = 8. NGI exit pressure, sample point number 3, Figure 2. Nominal baseline NGI pressure drop = 3.3 × (flow rate) × (flow rate). Pressure drop in Pa; flow rate in L/min; taken from Table 1 of reference 10; includes MOC pressure drop at 2 × flow rate × flow rate, based on personal experience.
Pressure Drop Characteristics with Advantec GA-55 Filters
Ambient pressure ∼100,000 Pa. Number of replicate tests N = 8. NGI exit pressure, sample point number 3, Figure 2. Nominal baseline NGI pressure drop = 3.3 × (flow rate) × (flow rate). Pressure drop in Pa; flow rate in L/min; taken from Table 1 of reference 10; includes MOC pressure drop at 2 × flow rate × flow rate, based on personal experience.
Pressure Drop Characteristics with Advantec GC-50 Filters
Ambient pressure ∼100,000 Pa. Number of replicate tests N = 1. NGI exit pressure, sample point number 3, Figure 2. Nominal baseline NGI pressure drop = 3.3 × (flow rate) × (flow rate). Pressure drop in Pa; flow rate in L/min; taken from Table 1 of reference 10; includes MOC pressure drop at 2 × flow rate × flow rate, based on personal experience.
As a broad-brush observation, the stage 3 pressure drop values with the filter are approximately the same as the entire NGI pressure drop when no filter is present. The pressure drop with the filter is therefore significant and can be expected to have an influence on the time history of particle release from a passive DPI when it is tested in accordance with compendial methods.
The NGI exit pressure levels (third column from the left side in Tables 2–6) indicate the density of the gas approaching the control valve in the compendial DPI test method. At this control valve, the gas density must be reduced further, approximately by 50%, to achieve sonic airflow at the control valve in the compendial method. Therefore, with the filter of the rNGI in place, the volumetric flow rate at the vacuum pump approaches three times the volumetric flow rate at the entrance to the NGI induction port.
The pumping requirements for DPI testing can be quite demanding, and consequently users placing a filter into their system for rNGI testing could struggle to achieve the needed sonic velocity constraint. In addition, because the gas density approaching the flow control valve is lower, the valve will need to be more open so as to achieve the desired flow rate into the induction port. These considerations will not be new to the skilled test technician, but indicate the additional ways in which testing with the rNGI configuration requires additional attention and hardware capability compared with testing with the full NGI.
Table 7 compares the flow resistance behavior of all five filter materials by showing the ratio of the pressure drop to the face velocity (which is called the flow resistance coefficient) for each of the nominal flow rates of 30, 45, and 60 L/min. The face velocity is defined as the volumetric flow rate approaching the filter divided by the open area of the filter (a diameter of 4 cm is assumed; this figure is an approximation because the inside diameter of the hold-down ring is 40.6 mm and the support screen openings extend to 39 mm in diameter). For any given filter material, the flow resistance coefficient increases slowly with flow rate.
Calculated Flow Resistance Coefficients
Open area of filter medium = 12.57 cm2 (4 cm inside diameter of the hold-down ring).
The Advantec GC-50 medium clearly has the highest flow resistance. It has a rated efficiency of 99.99%, whereas the Advantec GA-55 has an efficiency of 99.9%, a value that is quite sufficient for practical work. We therefore tested the GC-50 material only once because there is no need for 99.99% efficiency for the quantitative assessment of fine-particle mass or total particle mass of inhaler-generated aerosols.
The Whatman 934-AH material has a flow resistance that is about 10% larger than that of the Tremont 934-AH material. This difference may not be observed statistically among individual batches of these materials. However, the 934-AH material by Tremont that we tested has the least flow resistance of all five filter types. The Grade A–E medium made by Tremont has almost the same flow resistance as the Advantec GA-55. Manufacturer websites imply that GA-55 is intended to mimic the Grade A–E material of the leading manufacturer (Pall Corporation, e.g., product 61631).
There continues to be substantial and possibly intentional lack of clarity, possibly to protect trade secrets, on the exact specifications of these several common grades of binderless glass fiber filters. There are several manufacturers whose products we did not test, such as those of Zefon International (a manufacturer of Grade A–E filters; https://www.zefon.com/filter-glass-fiber-grade-a-e-47mm-100pk). However, our study indicates that these products are likely to have similar behavior.
We quantified the pressure difference between ambient air and the inlet of the NGI induction port. The air flows through a cartridge filter and the TSI flow meter (Model 4043) before reaching the induction port, and we relied on the absolute pressure displayed on the TSI flow meter to indicate the pressure at the inlet to the NGI induction port. The cartridge filter upstream of the flow meter comes in the case when purchasing a Model 4043 flow meter from TSI (SKU 1602300; https://tsi.com/product-accessories/filter-375-inch,-fnpt,-hepa-grade-1602300/).
We obtained the pressure drop data for the cartridge filter/flow meter combination at 30, 45, and 60 L/min flow rates into the induction port with 32 replicates (N = 8, each of four glass fiber filters). We found that the pressure drop across the filter/flow meter combination, ΔP, followed a simple linear relationship in the limited range we studied (Eq. 1):
The pressure drop we measured indicated that the filter had about five times the pressure drop of the flow meter alone. Even so, this pressure drop is not large (e.g., 1400 Pa at 60 L/min). We include these data here, however, because a failure to understand this inlet pressure drop can lead to systematic errors in any inhaler testing.
Conclusions
The present study provides reliable pressure drop data for a leading method of reducing the complexity of testing DPIs with cascade impactors. This reduced NGI (rNGI) method employs a filter on top of a selected NGI nozzle piece. The common filters used for this purpose have a flow resistance that approximately equals that of the full NGI, and for that reason, the total pressure drop through the rNGI is approximately double that of the full NGI.
Of the filter media tested, the Grade 934-AH product made by I.W. Tremont has the least flow resistance. However, three of the other four filters tested have a flow resistance that is not more than about 10% higher than that of the Tremont Grade 934-AH. The fifth filter medium tested, Advantec Grade GC-50, has the highest flow resistance and was tested purposely to show that its high particle removal efficiency (99.99%) is unjustified for the rNGI application.
Because the filters offer substantially increased pressure drop compared with the full NGI, inhaler testing results for the rNGI dry powder testing may be affected by the change in start-up kinetics. In addition, the increased pressure drop of the rNGI substantially decreases the gas density exiting the NGI, which means that a greater pumping capacity will be required. This issue is particularly important for the compendial testing method because it relies on controlling the flow rate with sonic velocity at the control valve, dropping the gas density by a factor of two.
Finally, the hold-down ring offered by the sole manufacturer of the rNGI test kit (part number 0170-98-5024; MSP Corporation) has a chamfered edge on only one side. This edge should be placed on the upstream side so that the squared-edge side contacts the filter media.
In practice, users intending to examine the rNGI will need to make decisions regarding the likelihood of their device output changing with the airflow start-up kinetics. Ideally, users would measure the start-up kinetics 8 and take steps to match the start-up kinetics of rNGI testing with that of the full NGI. Since the pressure drop of the several common filter media nearly equals that of the full NGI, it is possible that removing the flow after the filter (as in figure 10.64c in the study by Tougas et al. 3 ) would result in equalizing the pressure drop of the rNGI testing and the pressure drop of the full NGI testing.
Other tools such as a flow resistance compensator 11 or additional system volume 7 could be satisfactory for nearly matching the flow rate start-up kinetics. Future investigation of the rNGI should address the flow start-up issue so that possibly a standard protocol could be developed for inclusion in the several major pharmaceutical compendia such as United States Pharmacopeia (USP) and European Pharmacopoeia (Pharm. Eur.). In addition, another topic of future work would be the testing of glass fiber filters across the entire flow rate range of 15 to 100 L/min wherein impactor testing takes place.
Footnotes
Acknowledgments
The author appreciates regular interactions with Dr. Henk Versteeg of Loughborough University and with the Impactor Sub-Team of the European Pharmaceutical Aerosol Group (EPAG), interactions that made clear the need for the experimental data herein. The author also appreciates Mr. Ronnie Smith, Rock Solid Mobile LLC, Hamilton, VA, for writing a Windows-compatible data acquisition routine for the Mensor CPT6020 pressure transducer.
Author Disclosure Statement
The author is an independent consultant in the field of inhaler testing and is solely responsible for the entirety of this study.
Funding Information
No outside funding sources contributed to this work.
Reviewed by:
Jolyon Mitchell
Francesca Buttini