




Abstract
Traditionally, empirical correlations for predicting respiratory tract deposition of inhaled aerosols have been developed using limited available in vivo data. More recently, advances in medical image segmentation and additive manufacturing processes have allowed researchers to conduct extensive in vitro deposition experiments in realistic replicas of the upper and central branching airways. This work has led to a collection of empirical equations for predicting regional aerosol deposition, especially in the upper, nasal and oral airways. The present section reviews empirical correlations based on both in vivo and in vitro data, which may be used to predict total and regional deposition. Equations are presented for predicting total respiratory deposition fraction, mouth-throat fraction, nasal, and nose-throat fractions for a large variety of aerosol sizes, subject age groups, and breathing maneuvers. Use of these correlations to estimate total lung deposition is also described.
Introduction
As discussed in the preceding sections of the ISAM Texbook (see footnote),(l,la) particle size distributions obtained from in vitro measurement are widely used to predict regional deposition of inhaled aerosols. However, regional deposition is not determined solely by aerosol particle size. To accurately predict regional deposition, additional factors must be taken into consideration—most notably the inhalation flow rate and pattern and variation in airway geometry between individuals or groups of individuals. Where data sets are available from in vivo deposition studies, they can be used to develop empirical correlations relating deposition in given regions of the respiratory tract to one or more influencing variables. Typically, this is done by assuming a functional form for the correlation equation and then fitting coefficients and exponents to the in vivo data using least-squares regression. Unfortunately for aerosol scientists, cost and exposure considerations, together with technical challenges of obtaining meaningful, quantified deposition data, limit the number of in vivo deposition studies that are performed. This being so, a number of groups have capitalized on advances in medical image segmentation and additive manufacturing processes to conduct extensive in vitro deposition experiments in realistic replicas of the upper and central branching airways. This work has led to an assortment of recent empirical equations for predicting regional deposition, especially in the upper, nasal, and oral airways.
Dimensional Analysis and Development of Empirical Correlations
In engineering, and especially in fluids engineering, results of laboratory experiments performed using representative physical models are fundamental to the design and analysis of a wide range of systems and structures, from pipelines to airplane wings to wind turbines. The behavior of such systems typically depends on a large number of independent variables describing geometric and material structures and the physical properties of fluids they interact with. To simplify analysis, and to extract the greatest amount of useful information from the fewest number of experiments, independent variables are organized into a smaller number of dimensionless groups in a process known as dimensional analysis governed by the so-called Π-theorem(1b) and first derived by Bertrand.(2) Provided that all pertinent independent variables are identified and accounted for, the set of dimensionless groups serves to encompass the influence of these variables on the behavior of a given dependent parameter within the experimental range considered. That is to say, the variation of each independent parameter need not be considered in isolation; rather, the independent variable influences one or more dimensionless groups, which in turn influence the dependent parameter. Empirical correlations are thus commonly developed to relate experimental measurements to the variation of one or more dimensionless groups. The effects of an independent variable may then be analyzed by assessing, by simple calculation, its influence on a dimensionless group.
The utility of dimensional analysis is best described by way of example. Aerosol scientists are very familiar with one dimensionless group that has far-reaching application in our field—the particle Stokes number (Stk):
where ρ is the particle density, d is the (assumed spherical) particle diameter, CC is the slip correction factor, U is a representative gas velocity, μg is the gas dynamic viscosity, and D is a representative length, often set equal to an airway diameter.
If, for example, the impaction of an aerosol particle on a wall or plate depends solely on Stk, then experiments can be designed to cover a range of Stk by varying any parameter or combination of parameters contained within Stk. Correlations built from the results of these experiments can then be used to predict effects on impaction efficiency of any parameter or combination of parameters contained within Stk, so long as the value of Stk remains within the range of experiments. Different combinations of independent variables that produce dimensionless groups of equal value are said to be dynamically similar. Similarity has very practical implications: experimentally, it might be much easier to vary flow rate than it is to vary particle size or gas viscosity. Accordingly, experiments might be performed over a wide range of flow rates to cover a wide range of Stk, while varying other parameters only sparingly for confirmation that their effects are fully encompassed by Stk. By developing an empirical correlation to predict impaction efficiency as a function of Stk, instead of dimensional parameters such as flow rate and particle size, the correlation is predictive of a wider set of conditions.
In what follows below, empirical correlations developed to predict aerosol deposition in various regions of the respiratory tract will be presented. Correlations relating deposition to one or more dimensionless groups, such as Stk, will be favored, but in circumstances where dimensionless correlations are lacking, correlations based on dimensional variables will be provided.
Total Deposition Fraction
The total deposition fraction (TDF) is defined as the amount of aerosol depositing anywhere in the respiratory tract divided by the amount of aerosol inhaled. Accordingly, the sum of the TDF and the exhaled fraction is equal to unity.
Oral breathing
For many therapeutic aerosols inhaled orally from a pressurized metered-dose inhaler (pDMI)or dry powder inhaler (DPI), the intention is to deliver medication to the lungs in a single inhalation. Patients are advised to inhale deeply and then hold their breath for several seconds to encourage deposition in the peripheral lung. This is referred to as a single-breath inhalation maneuver, and when such a maneuver is employed, the TDF can often be assumed to be close to unity. In contrast, when nebulizers are used to deliver aerosol to the lungs over multiple tidal breaths, a significant fraction of aerosol may be exhaled such that the TDF is well below unity. In this case, empirical correlations may be employed to predict the TDF.
The TDF may be obtained in vivo through measurement of inhaled and exhaled aerosol concentration and flow rate, without need for medical imaging or information describing lung and airway geometry. Accordingly, extensive studies have been performed measuring TDF of stable, electrically neutral, monodisperse aerosols in healthy adult volunteers.(3,4) For micrometer-sized aerosols, it has been demonstrated that this data can be described through the following correlation(5,6)
where
and
and where VT is the inhaled tidal volume, FRC is functional residual capacity, Q is the inhalation flow rate, and g is the acceleration due to gravity.
The asterisk appearing above Stk and t in equations 2-4 is used to denote that these are integral parameters scaled with dimensions and flow rates defined for the respiratory tract in total, rather than for an individual airway. For example, comparing Stk* defined in equation 3 to the traditional definition of Stk provided earlier in equation 1, the ratio between a local representative velocity and length, U/D, has been replaced with the ratio between inhalation flow rate and functional residual capacity, Q/FRC.
The three dimensionless groups Stk*, t*, and VT/FRC contained within equation 2 encompass the collection of particle, flow, and geometric properties that have been observed to influence TDF of micrometer-sized aerosols. Figure 1 displays the close agreement of predictions made using equation 1 with extensive in vivo data for healthy adults presented by Heyder and colleagues(3) and by Kim and Hu.(4) The utility of dimensional analysis and similarity is highlighted in Figure 2, where the same equation fitted to adult data is used to predict the TDF in a number of special cases.(7–9) Data presented in Figure 2 falls outside the range of dimensional variables used in the adult studies; however, when these variables are incorporated into Stk*, t*, and VT/FRC, the majority of special cases remain within the experimental range of these dimensionless groups used in the adult studies (the case of low gravity being the exception). As seen in Figure 2, the dimensionless correlation fitted to the larger set of adult data provides reasonably accurate prediction of limited available data obtained for a number of special cases.
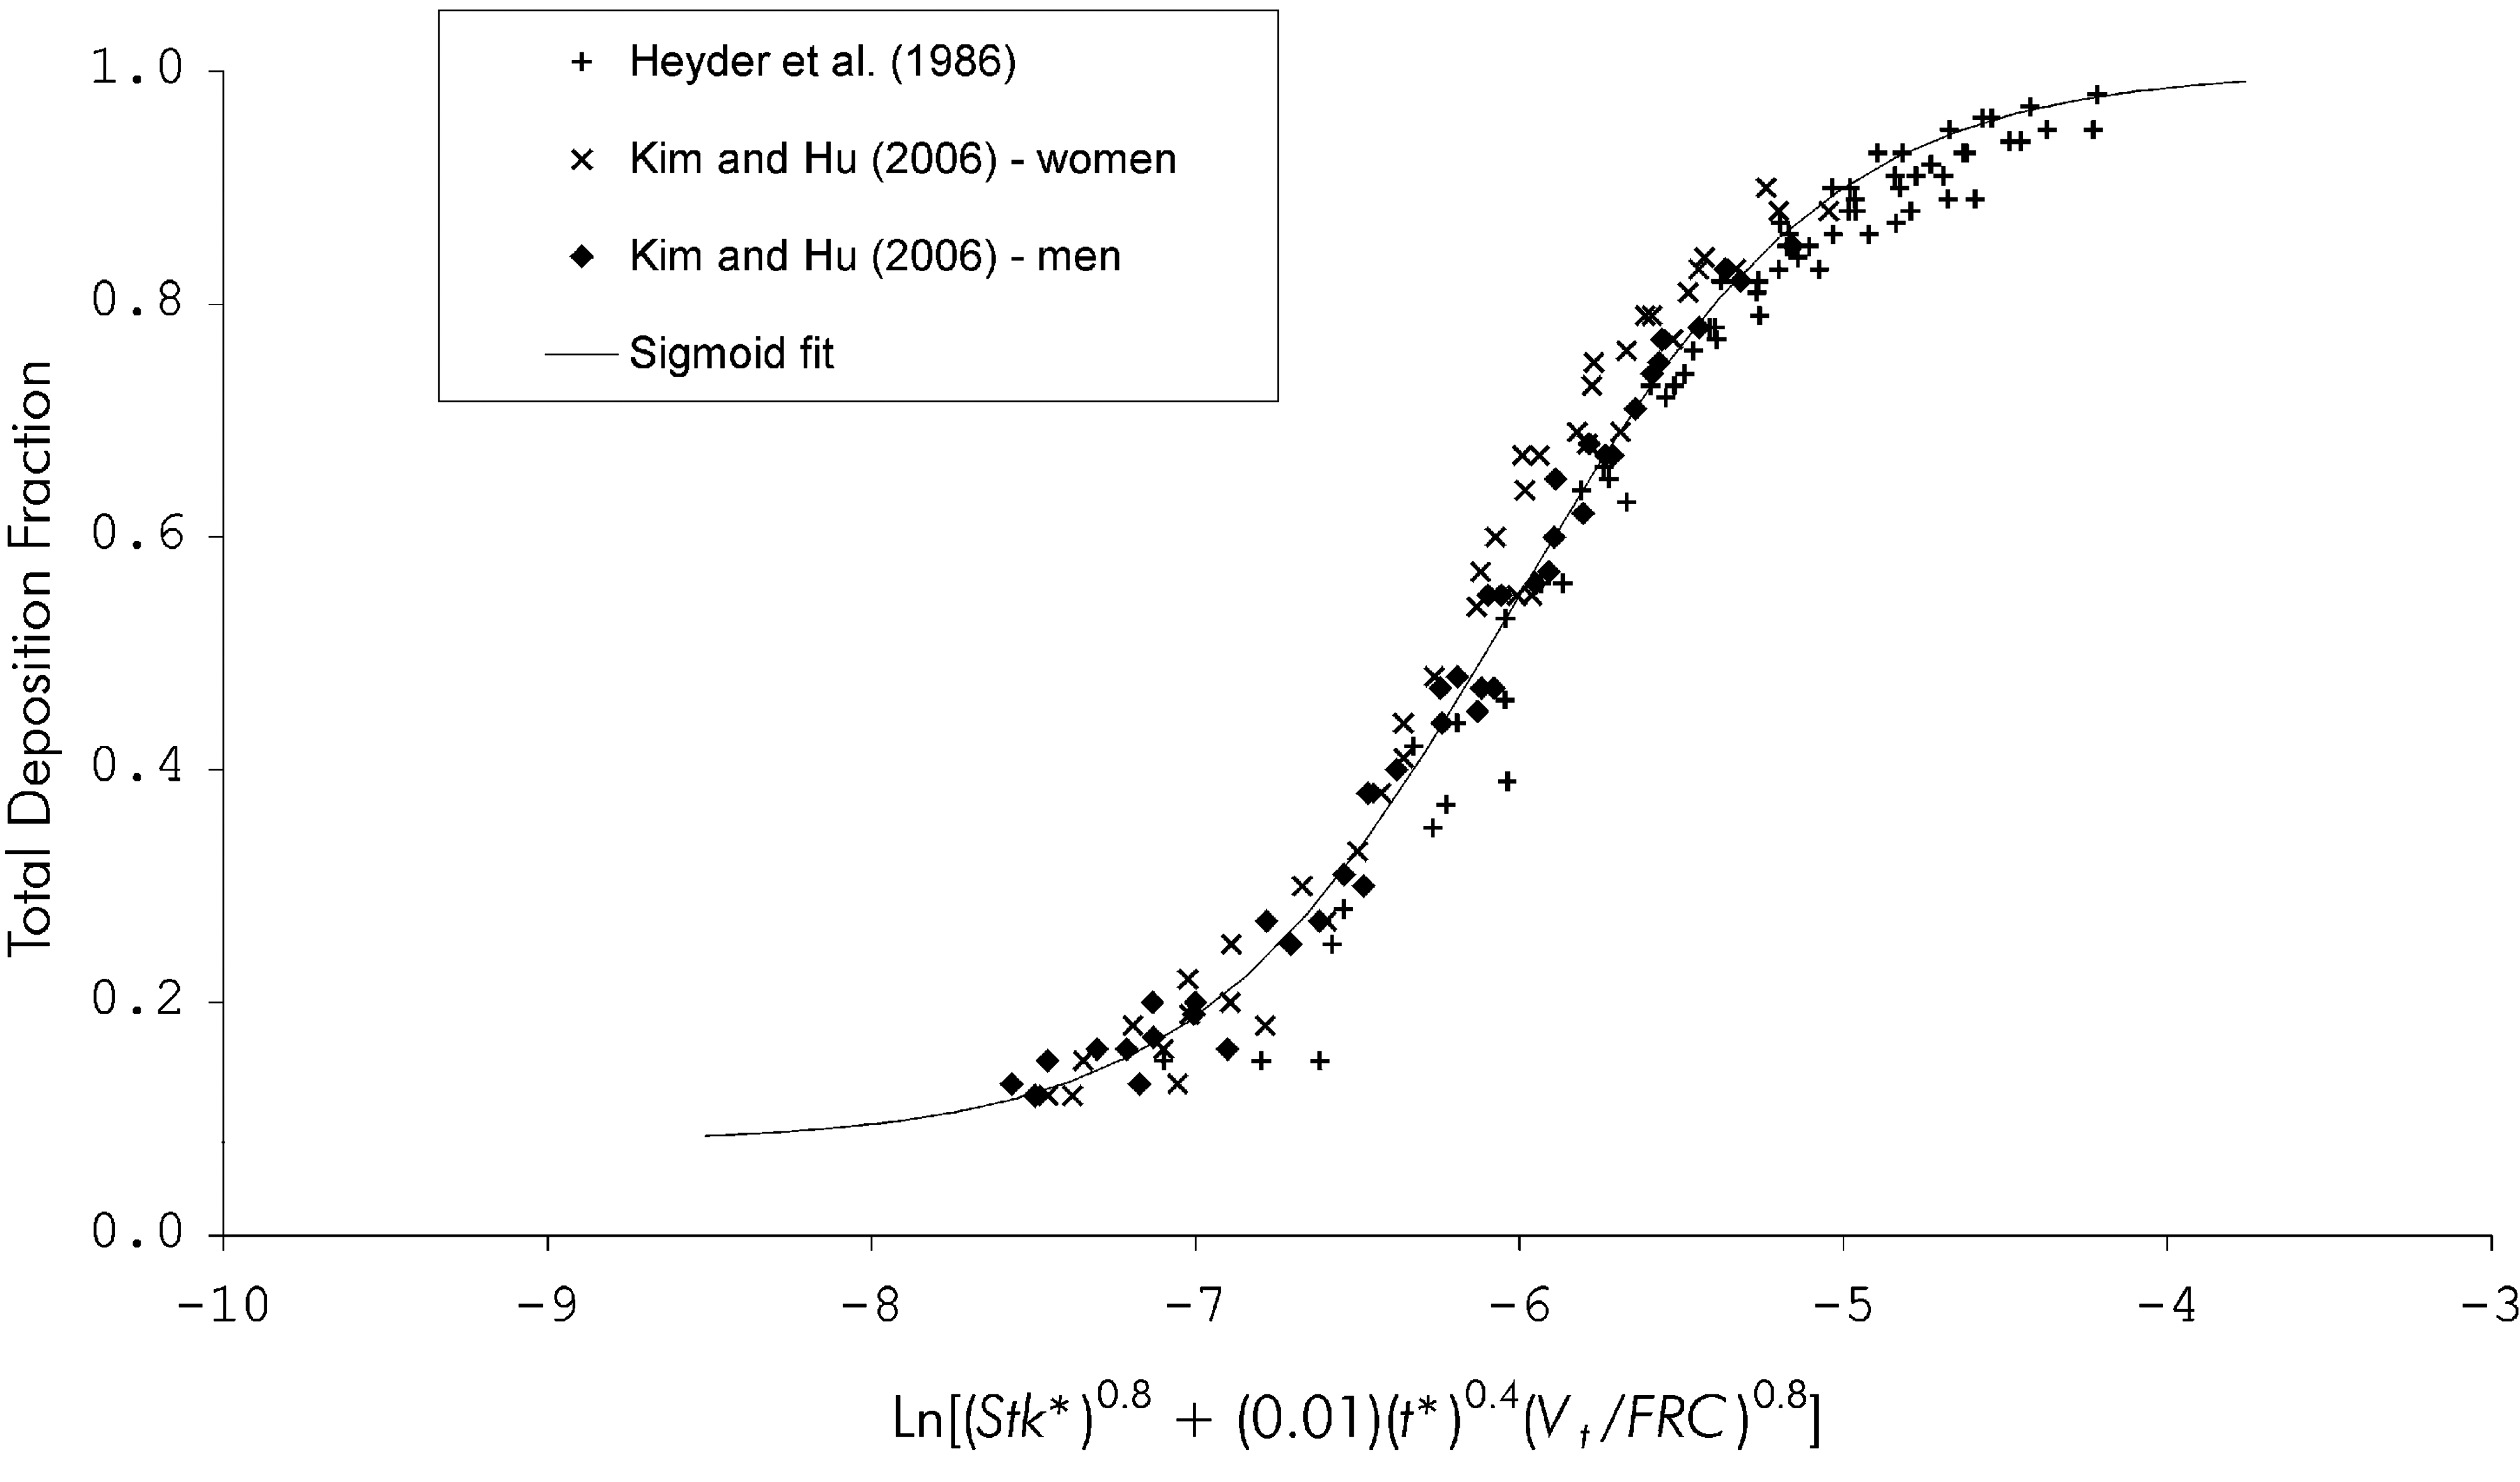
Total deposition fraction predicted using equation 2 (solid line) is compared with average values measured in adults during mouth breathing.(3,4) Reprinted with permission from Reference (5). Mary Ann Liebert publishers, New Rochelle, NY.

Total deposition fraction during mouth breathing predicted using equation 2 (solid line) is compared with values measured in altered gravitational acceleration,(7) with an alternative carrier gas (heliox),(8) and in children.(9) Reprinted with permission from reference (5). Mary Ann Liebert publishers, New Rochelle, NY.
For submicrometer aerosols, equation 1 is not accurate because it does not include effects of particle diffusion on deposition. Rather, for ultrafine particles with diameter below 100 nm the following equation may be used,(5) which was fit to in vivo TDF data obtained by Kim and Jaques(10,11) in healthy adults for tidal, oral breathing:
where
and where T is the gas (air) temperature in Kelvin, and k = 1.38x10⁻²³ J/K is Boltzmann's constant.
While predictions made using equations 5 and 6 agree well with TDF measured for particles with diameter below 100 nm, a transition regime exists between diameters of ∼100 nm and 1 μm, where deposition is influenced both by aerodynamic (inertial and gravitational) and diffusional mechanisms. In this range, neither equation 2 nor 5 is accurate; rather a nonlinear combination of the two may be employed:
The coefficients in equation 7 were determined by nonlinear regression and fitted to TDF data measured by Heyder and coworkers(3) for transition regime particles during oral breathing.(5)
Nasal breathing
In principle, the approach applied above to predict TDF during oral breathing based on governing dimensionless groups may equally be used to predict TDF during nasal breathing. However, for nasal breathing the experimental data required to develop an empirical correlation is to date only available for micrometer-sized aerosols. In this size range, the following equation, which was fit to experimental data provided by Heyder and coworkers,(12) may be used.(5)
where Stk* and t* are defined as in equations 3 and 4.
In contrast with equation 2 for oral breathing, equation 8 was developed through fitting to data from a more limited set of subjects-four in total.(12) Accordingly, the predictive accuracy of equation 8 in a broader sample of healthy adults has not been proven. In addition, and again unlike equation 2, the accuracy of equation 8 in children and in special cases such as in reduced gravity or gases other than air has not been evaluated since experimental data sets are not available for these cases.
For nasal breathing of ultrafine or transition regime aerosols, empirical equations equivalent to equations 5-7 for oral breathing are not available, again due to lack of experimental data from which such empirical equations would be developed. This being so, Heyder and coworkers(3) provide means to estimate TDF for nasal breathing of ultrafine and transition regime aerosols by converting values measured for oral breathing through use of estimates of deposition in the nose relative to that in the mouth. As previously pointed out,(5) this approach yields values of TDF for nasal breathing that are lower than the oral breathing values reported by Kim and Jaques,(11) whereas the opposite trend would generally be expected. Accordingly, there exists some uncertainty in estimated TDF values for nasal breathing of ultrafine and transition regime aerosols.
Polydisperse vs. monodisperse aerosols
For monodisperse aerosols consisting of a single compound, the amount of aerosol depositing may be expressed as a mass, volume, or number of particles, and mass-, volume-, or number-weighted deposition fractions may be used interchangeably. In contrast, polydisperse aerosols may be treated by division into a number of monodisperse size bins, where number-weighted deposition fractions will be interchangeable with volume- or mass-weighted fractions only within a given size bin. Furthermore, therapeutic aerosols very often contain multiple compounds, having active ingredients blended with or dissolved in excipients. Typically, the mass of active ingredient is of interest, and in this case, care must be taken when using predictive deposition correlations to appropriately weight the deposition fraction for a given size bin by the mass of inhaled active ingredient contained within that bin. These cautions apply not only to the TDF, but equally to other deposition fractions presented in this section. As long as adequate bookkeeping is done to track the quantity of interest, correlations developed using monodisperse laboratory aerosols may be readily used to predict deposition fractions for polydisperse, multi-component aerosols.
Upper Airways Deposition Fraction
The airways of the mouth, nose, and throat present a direct route of access for administration of therapeutic aerosols to the lungs. However, a significant fraction of the inhaled aerosol dose may be filtered out by deposition in these upper airways. Indeed, variation in mouth-throat deposition fraction (MTF) between subjects has been identified as the dominant factor influencing intersubject variability in lung dose of orally inhaled aerosols.(13) Over recent years, our understanding of the various factors influencing upper airways deposition has expanded considerably, due in large part to the adoption of in vitro methods through which to measure deposition in physical, realistic airway replicas. In parallel, empirical equations have been proposed to predict deposition both in the mouth-throat and nose-throat region across a broad range of aerosol sizes and inhalation flow rates, and for several age groups.
Mouth-throat fraction
Tidal breathing
Adults
For adults breathing tidally through their mouths, the empirical correlation proposed by Rudolf and colleagues(14) has been widely used to predict average MTF of micrometer-sized particles:
Equation 9 is a dimensional equation in which dae is the particle's aerodynamic diameter expressed in micrometers, Q is the inhalation flow rate in cm3/s, and VT is the tidal volume in cm3. Coefficients and exponents in equation 9 were determined by fitting to in vivo deposition data measured for healthy adults.(14)
Equation 9 can be used to predict variation in average MTF with aerodynamic diameter, inhalation flow rate, and tidal volume. However, intersubject variability around that average is known to be large. Equation 9 does not account for variation in MTF that arises from variation in airway geometry between individuals. To predict MTF for micrometer-sized aerosols in an individual for whom airway dimensions are known, the more recent correlation presented by Golshahi and colleagues(15) can be used. This correlation was developed based on experiments performed in vitro in realistic airway replicas with simulated tidal breaths:
where
and
where ρg in equation 12 is the density of the gas phase (typically air).
Equations 10-12 incorporate variation in airway geometry through the characteristic diameter Dc appearing in the expressions for dimensionless Stokes and Reynolds numbers, Stk and Re. When fitting deposition data in complex geometries such as the upper airways to functions involving dimensionless numbers, selection of an appropriate characteristic diameter is critical to the predictive utility of the empirical equation. A common approach is to investigate several different airway dimensions or combinations of dimensions, ultimately selecting that dimension or combination that produces the best correlation with experimental data. Golshahi and coworkers(15) report best fit to their data when the characteristic diameter Dc was defined as the square root of the average cross-sectional area of the oropharyngeal region (i.e., the region between the oral cavity and the larynx). This value ranged from 13.5 to 22.5 mm in their mouth-throat airway replicas, with an average value of 18.2 mm.
It should be noted that the equations presented above for predicting MTF are valid for micrometer-sized aerosols; that is, for aerosol particle diameters of ∼1 μm and above. Smaller particles, down to the nanometer size range, have attracted some attention in recent years as potential carriers for inhalation drug delivery. In this size range, Brownian diffusion becomes an important deposition mechanism, and equations such as 9 and 10 which do not account for diffusion are not valid. To predict average deposition of aerosolized nanoparticles in the oral cavity of adults, Cheng(16) provides a dimensional empirical correlation based on inhalation flow rate and particle diffusion coefficient that was developed by fitting to in vivo and in vitro data. However, this correlation does not include laryngeal deposition, and thus its predictions are not equivalent to MTF. As an alternative, Xi and Longest(17) proposed a best-fit dimensionless correlation to predict MTF of nanoparticles based on computational fluid dynamics (CFD) simulations of particle deposition in a realistic mouth-throat geometry, as well as in simplified versions of that geometry:
where
Sc is the particle Schmidt number, in which k is again Boltzmann's constant as given above in equation 6, and D is the particle diffusion coefficient.
The definition of Re used in equation 13 is identical to that provided in equation 12, save that the characteristic diameter used by Xi and Longest(17) is the inlet hydraulic diameter of the mouth; that is, the ratio between the cross-sectional area and perimeter of the mouth inlet multiplied by a factor of 4.
As equation 13 was developed based on simulations in one realistic geometry, it remains to be seen whether effects of intersubject variability in geometry will be predicted using the inlet hydraulic diameter. In addition, it may be noted that the correlation presented in equations 13-14 was not developed from simulations of tidal breathing per se, but rather from simulations performed for constant inhalation flow rates ranging from 4 to 60 L/min. This range of flow rates more than encompasses typical inhalation flow rates for adults during tidal breathing; however, potential effects of unsteady inhalation flow rate should be explored in future studies.
Children
In addition to the adult population, predicting MTF in children is of considerable interest given the widespread use of orally-inhaled drugs to combat asthma, cystic fibrosis, and other respiratory diseases affecting children. Following a similar methodology to their adult in vitro studies, Golshahi and coworkers(18) developed the following empirical equation to predict MTF during tidal, oral breathing of micrometer-sized aerosols for children between the ages of 6 to 14 years old:
where Re and Stk are defined as in equations 11 and 12, but with the distinction that the characteristic diameter used to calculate Re and Stk for use in equation 15 is the ratio between the volume and surface area of the mouth-throat airway. This characteristic diameter ranged between 2.1 and 3.1 mm for the nine replicas studied, with an average value of 2.7 mm.
Both equation 10 for adults and equation 15 can be used with average characteristic diameters in order to predict average MTF. An added utility of the equations is in assessing influence of geometric variation on MTF, or in predicting MTF, through changing values of the characteristic diameter. Where the airway surface area for an individual has been determined through post-processing of medical images obtained from magnetic resonance imaging (MRI) or computed tomography (CT) scans, equation 15 can be used to make individual predictions. However, recognizing that obtaining such medical images will not be practical in many cases, Golshahi and colleagues(18) also proposed an alternative correlation of similar form, but fit to Re and Stk calculated for an alternative characteristic diameter, equal to the square root of the ratio between airway volume and airway centerline path length. This is attractive in that airway volume and path length can be obtained from acoustic pharyngometry; no radiation imaging being required. However, with this alternative definition of the characteristic diameter, the empirical correlation produced a somewhat poorer fit to experimental data. Further considerations of alternative definitions of the characteristic diameter for adult and pediatric upper airways deposition can be found in the paper by Carrigy and coworkers.(19)
For submicrometer aerosols, no equivalent to the adult equation 13 is currently available for predicting MTF in children during oral, tidal breathing.
Single-breath inhalation
In many cases, aerosol drug delivery is performed using singe-breath inhalation maneuvers, as opposed to during tidal breathing. Such is the case for pDMDIs and DPIs. In such circumstances, inhalation flow rates typically far exceed the upper bounds for which empirical equations developed for tidal breathing can be expected to provide reasonable estimates of MTF. Accordingly, alternative correlations are required for single-breath inhalation.
Adults
For adult subjects inhaling stable, neutrally charged, micrometer-sized aerosols at flow rates ranging from 30-90 L/min, MTF may be predicted using the equation proposed by Grgic and colleagues,(20) which is presented here in the modified form given by Carrigy and co-investigators(19) for consistency with the correlation presented above in equation 10 for tidal breathing:
In equation 16, the definitions of Stk and Re are the same as in equations 11 and 12, respectively, save that the characteristic diameter is equal to the square root of the ratio between airway volume and airway centerline path length. This characteristic diameter had an average value of 20 mm for the seven realistic mouth-throat airway replicas studied by Grgic and coworkers.(20)
Similar to the correlations involving Stk and Re presented above for tidal breathing, equation 16 may be used to examine intersubject variability in MTF through various physical parameters appearing in Stk and Re, including the characteristic diameter. That said, several additional factors not accounted for in equation 16 can affect MTF for real-world inhalers: first, equation 16 was developed based on measurements taken at constant inhalation flow rates. In contrast, for realistic inhalation maneuvers employed by subjects using inhalers, flow rate may increase as particles travel through the mouth-throat. In this case, MTF will be larger than predicted based on the assumption of a constant flow rate equal to that at which aerosol enters the mouth-throat.(21) Figure 3 illustrates this conceptually by providing the time change and associated increase in flow rate as an aerosol bolus moves through an idealized mouth-throat geometry. If the primary site of deposition within the mouth-throat is known, the increase in MTF can be predicted by adjusting the flow rate used in equation 16 to a value consistent with the point in time when the majority of particles reach the deposition site.(21)

Positions of an inhaled aerosol bolus determined by computational fluid dynamics (CFD) simulation at several time points during transit through the mouth and throat. Aerosol particles were released at the entrance to the mouth into inspiratory flow with flow increase rate of 4.0 l/s2. Reprinted with permission from Grgic and coworkers.(21)
Second, aerosol particles and droplets emitted from commercial inhalers can in some cases carry considerable electrostatic charge. In close proximity to airway walls, such particles induce a dielectric effect in airway wall tissues, which leads to a net electrostatic force drawing particles to the wall.(22) When this is the case, MTF may again increase compared with predictions made for neutrally charged particles. Azhdarzadeh and colleagues(23) have presented a modified form of equation 16 that includes an additional dimensionless parameter accounting for deposition due to induced electrostatic effects. This new dimensionless correlation was developed based on careful laboratory measurements made in an idealized mouth-throat geometry using monodisperse, uniformly charged, micrometer-sized aerosols. Inhalation flow rates used in the study ranged from 15-30 L/min, thus future research is required to extend these results to flow rates typical of single-breath inhalers.
Third, for some commercial inhalers, the diameter of the mouthpiece is considerably smaller than the mouth inlet used in the experiments upon which equation 16 is based. For mouthpiece diameters smaller than ∼10 mm, aerosol enters the mouth in a turbulent flow resembling a jet, and increased deposition in the oral cavity leads to a total MTF that is greater than predicted by equation 16. In this circumstance, the alternative correlation developed by DeHaan and Finlay,(24) which has shown good agreement with past in vivo studies measuring MTF for DPIs with small diameter mouthpieces, can be used.
Finally, to use equation 16 or the special-case alternatives described above, the aerodynamic size distribution of the inhaled aerosol must be known. However, for DPIs, variation of powder fluidization and deaggregation with inhalation flow rate and maneuver is complex and difficult to predict analytically or to describe using easily-applied empirical correlations. Furthermore, aerosol size measurement techniques generally require aerosol to be drawn from the inhaler mouthpiece to an instrument, e.g., through an induction port to a cascade impactor. As a result, the inhaled aerodynamic size distribution exiting the mouthpiece and arriving at the entrance to the mouth is often unknown. Similarly, for pMDIs, propellant droplets emitted as spray from the outlet orifice rapidly decelerate and evaporate as they are entrained in the inhalation flow. Again, the physics governing these processes is complex, and size measurements at the mouthpiece exit are difficult, such that the aerodynamic size distribution of pMDI droplets entering the mouth is generally not known. Accordingly, in place of empirical correlations, many researchers and developers prefer to rely on laboratory testing using airway replicas and idealized geometries that have been described in Section 3.3.
Children
As school-aged children and adolescents frequently use single-breath inhalers, it is important to describe variation in MTF for this population as well as for adults. Again, because larger inhalation flow rates and inhaled volumes are used with single-breath inhalers than are typical during tidal breathing, extrapolation using correlations developed for tidal breathing is ill-advised. Alternatively, Golshahi and colleagues(25) conducted laboratory experiments to measure deposition of stable, neutrally charged, micrometer-sized aerosols in realistic mouth-throat airway replicas of children 6-14 years old at inhalation flow rates ranging from 30-150 L/min. Based on this data set, the following empirical correlation was proposed.(25)
where the characteristic diameter used in calculating Stk and Re is the ratio between airway volume and surface area, which had an average value of 2.7 mm.
As was the case for their correlation predicting MTF in children for tidal breathing, Golshahi and colleagues(25) also presented an alternative correlation for which Re and Stk were calculated for a characteristic diameter equal to the square root of the ratio between airway volume and airway centerline path length. Again, this alternative correlation produced a somewhat poorer fit to experimental data, but the characteristic diameter based on volume and path length is potentially more straightforward to obtain for an individual subject using acoustic pharyngometry.
The special cases considered above for adults, including effects of small diameter mouthpieces and electrostatic charge, are equally likely to influence MTF for children. For charged particles, Azhdarzadeh and colleagues(26) have presented a modified form of equation 17 that includes additional terms accounting for increased deposition as compared with electrically neutral particles. For small diameter mouthpieces, limited experimental data is currently available for children from which to develop correlations; however, effects measured in adult mouth-throat airway geometries are expected to be qualitatively similar in children's airways.
Nose-throat fraction
The nasal route is generally viewed as less attractive than the oral route for administering therapeutic aerosols to the lungs. This is chiefly due to the increased filtering efficiency of the nasal, compared with oral, airway. That said, for certain patient groups, characterization of aerosol drug delivery through the nasal route is relevant. Neonates and infants are commonly described as obligate nose breathers and usually receive aerosol through facemasks that cover the nose and mouth. Likewise, aerosol delivery has been explored for patients also receiving supplemental oxygen or ventilatory support through a variety of interfaces conducive to nasal breathing, including nasal cannulas, nasal pillows, and nasal or oronasal masks. In addition, resting tidal breathing is commonly done through the nose, and thus nasal aerosol deposition efficiency is important in assessing exposure to environmental and workplace aerosols.
Tidal breathing
Adults
For adults at rest breathing micrometer-sized aerosols tidally through their noses, Garcia and colleagues(27) propose the following correlation based on experiments performed using constant flows of 10-40 L/min through realistic nasal replicas of four healthy subjects:
where in equation 18 Stk is defined atypically as:
and the characteristic diameter Dc is defined as:
where Ln is the linear distance from the nostrils to the end of the nasal septum, and Rn is the nasal resistance, defined for use in equation 20 as:
where Δp is the nasal pressure drop and Q the nasal volumetric flow rate.
It should be noted that, strictly speaking, equation 18 describes the nasal deposition fraction (NF) as opposed to the nose-throat deposition fraction (NTF), since the nasal airway replicas used by Garcia and coworkers(27) terminated at the nasopharynx and did not include the laryngeal region. That said, laryngeal deposition is in general much smaller than nasal deposition. Indeed, for micrometer-sized aerosols, NF predicted using equation 18 was recently shown to be in reasonably good agreement with NTF measured in replicas which terminated at the trachea.(28) Figure 4 displays the close agreement between equation 18 and experimentally measured NF in four realistic nasal airway replicas. Garcia and co-investigators(27) also presented an equally good fit to their data using a dimensional correlation based on aerodynamic particle diameter and nasal pressure drop:

Nasal deposition fraction predicted using equation 18 is compared with values measured in four realistic nasal airway replicas. Reprinted from Garcia and colleagues,(27) with permission.
The equivalence of equations 18 and 22 in capturing variation in nasal deposition with nasal geometry and flow rate can be appreciated by considering the functional dependence of nasal pressure drop on these parameters. As noted by Garcia and coworkers,(27) for flow rates above ∼24 L/min, nasal pressure drop can be modeled as low turbulent Reynolds number flow through a circular cross-section pipe.(29)
where D and L are the diameter and length of the pipe.
With this description of nasal pressure drop, then:
where Stk is defined as in equation 19 above.
Equation 22 is attractive in that intersubject variability in NF is accounted for using only the pressure drop, which is simpler to measure than is the distance Ln required in the calculation of characteristic diameter used in equation 18.(27) Both equations 18 and 22 were developed based on experiments performed with constant flows in a range representative of adult tidal breathing at rest. Comparison with in vitro or in vivo data obtained during unsteady, cyclic tidal breathing is presently lacking and merits investigation in future studies. Discrepancies between data obtained for simulated tidal breathing patterns versus averaged constant flows have been noted for nasal deposition(30) and mouth-throat deposition.(18)
Equations 18 through 24 describe nasal and nose-throat deposition fractions for micrometer-size range aerosols. For submicrometer aerosols, these correlations are not valid. For aerosol particles with diameters below ∼100 nm, Cheng and colleagues(31) proposed the following equation to predict NTF, based on in vivo nose-throat deposition measurements in four adult male subjects combined with MRI evaluation of the nasal geometries of the same four subjects:
where An is the total nasal airway surface area, and ĀC is the average airway cross-sectional area. These geometric parameters had average values of 207 cm2 and 2.95 cm2 for An and ĀC, respectively, for the four subjects studied. In addition, for equation 25, the Schmidt number is defined above in equation 14 and Reynolds numbers is defined as:
where P is the average nasal airway perimeter, which appears in the expression for Re as a result of the use of the hydraulic diameter 4ĀC/P as the characteristic diameter. The average value of P measured in the four subjects was 21.7 cm.
Children
The results obtained by Garcia and coworkers(27) have been extended to younger ages in recent work reported by Zhou and colleagues.(28) These authors measured NTF for micrometer-sized aerosols in realistic replicas of the nose-throat airways from five subjects: an adult, a 5-year-old, a 3-year-old, a 7-month-old, and a 10-day-old.(28) Remarkably, a single empirical correlation was found to predict NTF measured in all five replicas:
where
and where DC is defined in equation 20. Note that while the form of equation 27 is the same as that of equation 18, the definition of the Stk is different.
The ability to predict NTF over a wide age range with a single correlation is clearly attractive. Equation 27 does, however, inherit the same limitations as the adult correlation upon which it is chiefly based. Experiments were performed using constant flows through the replicas so that the ability of equation 27 to accurately predict NTF for tidal breathing patterns is not presently known. Further, in developing equation 27, a single replica for each age was employed, so the ability of equation 27 to predict intersubject variability in NTF within a given age group has yet to be studied.
In contrast, an alternative empirical correlation to predict NTF in children aged 4-14 years was proposed by Golshahi and colleages(32) based on experiments performed on 14 realistic replicas during simulated tidal breathing:
where the definitions of Stk and Re are identical to those given in equations 11 and 12, but where the characteristic diameter Dc is calculated as the ratio between airway surface area and centerline path length. While this definition of the characteristic diameter provided the closest fit to experimental data, Golshahi and coworkers(32) examined a wide range of potential characteristic diameters and also provided an alternative correlation based on the square root of the ratio between airway volume and path length, which was shown to also provide a good fit to their data.
Infants
Deposition of micrometer-sized aerosols was measured by Storey-Bishoff and co-investigators(33) in realistic nasal airway replicas of 11 infants aged 3-18 months during simulated tidal breathing. Variation in NTF was well captured by the following correlation:
Again the definitions of Stk and Re are identical to those given in equations 11 and 12, where for equation 30 the characteristic diameter Dc is equal to the ratio between airway volume and surface area, which averaged (Davg) 1.2 mm for the 11 replicas studied.(33)
In contrast to the majority of correlations presented above, equation 30 contains an additional dependence on the characteristic diameter Dc (i.e., in addition to the indirect dependence on Dc through its influence on Stk and Re). Correlations based on Re and Stk alone, and with alternative definitions of Dc, exhibited noticeably poorer fit to experimental data.(33) Further, Golshahi and coworkers(32) were unable to identify a correlation that provided satisfactory fit to both Storey-Bishoff's data in infants and their own data in children. Whether this is due to some fundamental anatomical difference, or some other difference between the different age groups that results in different dynamics of aerosol deposition, remains to be determined.
Equation 30 is valid for electrically neutral particles, whereas pharmaceutical aerosols inhaled nasally by infants may in some circumstances contain significant charge levels. This can arise, for example, for aerosols delivered from some pMDIs through holding chamber/facemask combinations. For charged particles, Azhdarzadeh and colleagues(34) have presented an alternative correlation to equation 30 that includes terms accounting for increased deposition as compared with electrically neutral particles.
Deposition of ultrafine aerosols ranging from 13-100 nm in diameter has also been studied in the same set of infant nasal airway replicas, again during simulated tidal breathing.(35) The following empirical equation provided reasonable fit to experimental deposition data:
where
The Schmidt number appearing in equation 32 is defined as above in equation 14, whereas the Reynolds number is here defined as:
and the Womersley number, Wo, is defined as:
where fi is the tidal breathing frequency.
The characteristic diameter, DC, used in equations 33 and 34 was equal to the ratio between average cross-sectional area of the nasal airway and path length from the nostrils to the trachea. The average value of this ratio for the infants studied was 1.1 mm.(35)
The Womersley number (Wo), which appears in equation 32, has not appeared in any other correlation described above. In fluid mechanics, the Womersley number is used to gauge the significance of transient inertial effects owing to pulsatile or oscillating flow versus viscous effects that tend to quell inertia. Where Wo > 1, oscillations occur sufficiently quickly that flow velocity profiles lack time to develop to quasi-steady profiles; therefore, at a given instant, a snapshot of the unsteady flow field will look decidedly different from that of a steady flow at equivalent flow rate. Golshahi and coworkers(35) included this parameter after observing significant differences in deposition measured for steady (constant) and unsteady (tidal) flows, which they suggest occurs due to the relatively high frequency of breathing in infants combined with flow-assisted diffusion in recirculation regions.
Lung Deposition Fraction
Total lung deposition
A primary motivation for developing correlations predictive of upper airways deposition is to determine the fraction of inhaled aerosol penetrating the upper airways to reach the lungs. As mentioned above, variation in mouth-throat deposition between subjects has been identified as the dominant factor influencing intersubject variability in lung dose.(13) For many single-breath inhalers, the fraction of aerosol exhaled from the lungs is negligible, and thus all aerosol penetrating the upper airways can be counted as deposited in the lung.(5) For example, for oral breathing:
where lung deposition fraction (LDF) and MTF are both expressed as fractions of the total inhaled aerosol.
In circumstances for which the exhaled fraction is non-negligible, LDF may be estimated using the following equation, which assumes equivalent probabilities of upper airways deposition for expiratory flow as for inspiratory flow.(5)
where TDF, LDF and MTF are fractions of the total inhaled aerosol and where TDF and MTF are determined using correlations provided above appropriate to the case in consideration. For nasal breathing, MTF is replaced by NTF. As noted previously,(5) equation 36 has been found to provide reasonable estimation of LDF except when MTF and TDF are close in value. This condition usually occurs when both MTF and TDF are near unity, in which case equation 35 can be used.
Regional lung deposition
In addition to total lung deposition, the regional distribution of aerosol deposition within the lungs is of considerable interest in many applications. Extensive work has been done over several decades to develop and refine mathematical models predicting regional lung deposition of inhaled aerosols. These regional deposition models, including those based on or incorporating results of empirical studies, have been reviewed elsewhere in this text (Chapter 2, Section 2.4: Regional Deposition Models).
Footnotes
Author Disclosure Statement
The authors declare they have no financial conflicts of interest.