




Abstract
Background
: The combined use of a pressurized metered-dose inhaler and valved holding chamber (pMDI+VHC) is recommended to improve efficiency and safety; however, aerosol release is likely to vary with the inhalation maneuver. This in vitro study investigated the aerodynamic characteristics and aerosol release features of pMDI+VHC (Aerochamber, Trudell Medical International).
Methods
: The static and dynamic changes in the airway resistance (Raw) during inhalation (withdrawal) through pMDI+VHC were measured. Subsequently, the aerosol released from pMDI+VHC was measured using simplified laser photometry during withdrawal with either fast ramp-up then steady or slow ramp-up followed by gradual decrement at different intensities and times to peak flow (TPWF).
Results:
Raw increased linearly with changes in the withdrawal flow (WF) rate between 10 and 50 L/min. The slope was steep in the low WF range (<50 L/min) and became milder in the higher range. The aerosol mass tended to increase with an increase in the peak WF (PWF) of slow ramp-up profile. When three different WF increment slopes (TPWF: 0.4, 1.4, and 2.4 seconds) were compared, the released aerosol mass tended to decrease, and the aerosol release time was prolonged at longer TPWF. When the PWF was increased, the aerosol release time became shorter, and the withdrawn volume required for 95% aerosol release became larger; however, it did not exceed 0.4 L at suitable TPWF (0.4 seconds).
Conclusion
: Raw analysis suggests that inhalation at 30–50 L/min is suitable for pMDI+VHC in this setting. Rapid (TPWF, 0.4 seconds) inhalation, but not necessarily long (maximum 2.0 seconds) and deep (but larger than 0.55 L), is also recommended. Practically, direct inhalation to be weaker than usual breathing, as fast as possible, and far less than 2.0 seconds.
Introduction
Pressurized metered-dose inhalers (pMDIs) are the most widely used form of portable inhaler in many countries. However, the difficulty in coordinating between actuation and inhalation is a major disadvantage; thus, the use of a combination of a valved holding chamber (VHC), that is, pMDI+VHC, is recommended, 1 especially for pMDI with hydrofluoroalkanes. Slow and deep inhalation is recommended during the use of pMDI+VHC. 1 Slow inhalation corresponds to 30 L/min, 1 whereas deep inhalation corresponds to “total lung capacity 2 ” or “maximal inhalation 3 ”; however, the underlying requirement of such inhalation remains to be clarified.
We previously performed a dynamic analysis of aerosol release from pMDI+VHC using a fast ramp-up inhalation flow profile and observed that the release consisted of three phases: increment, flat, and decrement. We also reported the minimum required combination of inhalation flow rate and depth for pMDI+VHC. 4 However, as the human inhalation profile resembles a triangle5,6 and instantaneous aerosol release depends on the current inhaled airflow, 4 features of aerosol release from pMDI+VHC using a simulated human profile should be further investigated.
Furthermore, as the incremental or decremental flow of human inhalation is perturbed by a flexible valve incorporated into VHC, the aerosol release profiles may also be modulated. Thus, further investigations using a human inhalation flow profile are required.
We hypothesized that the internal resistance of VHC (Raw: airway resistance) varies with flow changes during human inhalation. Moreover, we also hypothesized that the aerosol release profiles using the human inhalation flow profile differed considerably from those using the fast ramp-up flow profile. Two experiments were conducted to test these hypotheses. The first experiment measured the driving pressure (Paw: airway pressure) for aerosol release from VHC at different inhalation flow rates and then calculated the Raw at each flow rate.
The second experiment measured the time trajectories of the particle concentration (CONC) and aerosol mass releasing rate (AMRR) using simplified laser photometry during withdrawal through the fast ramp-up and simulated human flow profiles. Since AMRR is defined as “instantaneous inhaled flow × CONC” using laser photometry, 4 the time trajectories of cumulative aerosol mass (CAM: summation of AMRR) and AMRR driven by a fast ramp-up flow profile are identical; in contrast, those driven by the human profiles differ as they depend on the inhalation profile.
Thus, this in vitro study investigated the aerodynamic characteristics and aerosol release features of pMDI+VHC.
Materials and Methods
Two experimental setups were used in this study. The system used to measure Raw in the first experiment consisted of a manually driven valve and pneumotachometer serially connected in VHC (Aerochamber Plus Flow-Vu®; Trudell Medical International, Ontario, Canada), which was combined with a pMDI containing fluticasone propionate (Flutide Air®; GSK Japan, Tokyo, Japan) (Fig. 1A). The Paw in the tube connecting the pneumotachometer and valve was measured continuously.

The setup used for the measurement of airway resistance
The withdrawal flow (WF) provided by the vacuum pump was controlled by a manually operated valve. Two sets of WF profile, that is, static and dynamic changes, were evaluated. The system used to measure the particle release from pMDI+VHC in the second experiment was almost identical to that used in our previous study (Fig. 1B). 4 In this system, air containing aerosol was withdrawn using a vacuum pump, and a computer-controlled valve and measuring tube were inserted between the vacuum pump and pMDI+VHC.
Two WF profiles were generated using the computer-controlled valve: one involving fast ramp-up then steady (fast ramp-up), and the other featuring slow ramp-up followed by a gradual decrement (slow ramp-up). 7 The latter profile aimed to simulate human inhalation. A laser-illuminated aerosol was passed through the measuring tube, and the intensity of the reflected light was measured using a pair of photointegrated circuit diodes. The signals from the laser photometric system (such as CONC) and WF were stored and processed using a PowerLab System (AD Instruments, Bella Vista, Australia).
The results are expressed as means ± standard deviation. Statistical analyses were performed using Stat View ver. 5 (SAS Institute, NC, USA). Paired data were analyzed using an unpaired t-test, whereas group data were analyzed using one-way analysis of variance. Tukey–Kramer analysis was performed if required. Statistical significance was set at p < 0.05.
Study protocols
Static and dynamic changes in WF were applied to three sets of pMDI+VHC to evaluate the relationship between Raw and WF (Fig. 1A). As shown in the static change panel, the WF was initially increased from 0 to 100 L/min through 15 steps and a holding time of 5 seconds, and then decreased from 100 to 0 L/min. This trial was repeated three times for each pMDI+VHC. Raw was calculated using the following equation: Raw = Paw0.5/WF. 8 Subsequently, WF was slowly (8 seconds) increased from 0 to 100 L/min and then slowly (15 seconds) decreased to 0 L/min during continuous withdrawal from pMDI+VHC as shown in the dynamic change panel. This trial was repeated four times for each pMDI+VHC.
All dynamic trials for particle release measurement were conducted to simulate human use, with each trial involving a single actuation and single withdrawal. 1 To assess the changes in the time trajectory of aerosol release, one of the three VHCs was selected and eight pMDIs were tested. The eight sets of pMDI+VHC were withdrawn with fast and slow ramp-up flow profiles (Fig. 1B), and the WF and CONC were continuously recorded.
The slow ramp-up flow profiles were as follows: peak withdrawal flows (PWFs) of 10, 20, 30, 50, and 70 L/min and time to PWF (TPWF) of 0.4, 1.4, and 2.4 seconds. Six wasted actuations were performed before using the new pMDI. Then, at least one of any conditions was tried in each pMDI. Seven of the eight pMDIs were shaken at every 10th trial, and the shake-to-actuation interval was 15 seconds. As we were concerned that those numbers and intervals were unsatisfactory, we immediately shook before each actuation and implemented a shorter shake-to-actuation interval (<10 seconds) in one pMDI; however, particle release performances did not differ from those of the seven pMDIs.
VHC was not washed between actuations and experiments because accurate measurements require the VHC to be firmly fixed in the airtight box, and cleaning the VHC between setup and measurement resulted in unstable readings.
Results
Static and dynamic changes in the internal resistance of pMDI+VHC
The relationships between WF and Paw0.5 for the three sets of pMDI+VHC were obtained with static changes in WF (Fig. 2A). The curve representing Paw0.5 versus WF was triphasic; the regression lines were Paw0.5 = 0.116 × WF +0.071, r2 = 0.822, p < 0.0001 (WF <10 L/min); Paw0.5 = 0.004 × WF +0.776, r2 = 0.186, and p < 0.0001 (WF = 10–50 L/min); and Paw0.5 = 0.013 × WF +0.335, r2 = 0.728, and p < 0.0001 (WF >50 L/min). The curves for Raw (Paw0.5/WF) and conductance (i.e., 1/Raw) versus WF were also obtained (Fig. 2B). Both curves were biphasic rather than triphasic. The Raw curve decreased steeply in the WF range of 0–50 L/min, whereas the slope became mild with an almost constant value >50 L/min.

Square root of the airway pressure (Paw0.5) versus WF
The dynamic changes in Paw0.5, Raw, and conductance versus WF in the three different pMDI+VHCs were evaluated (Fig. 3). The curves of the three trials overlapped in each panel, indicating good reproducibility. These relationships resembled those observed in the static trials. Furthermore, in the range of 10–50 L/min, the Paw and Raw curves in the flow increment phase were always located above those in the flow decrement phase, whereas the conductance curves were always located below those in the flow decrement phase. These findings suggest that the Raw, Paw, and conductance of pMDI+VHC are not fixed but are rather variable in the static or dynamic trials.
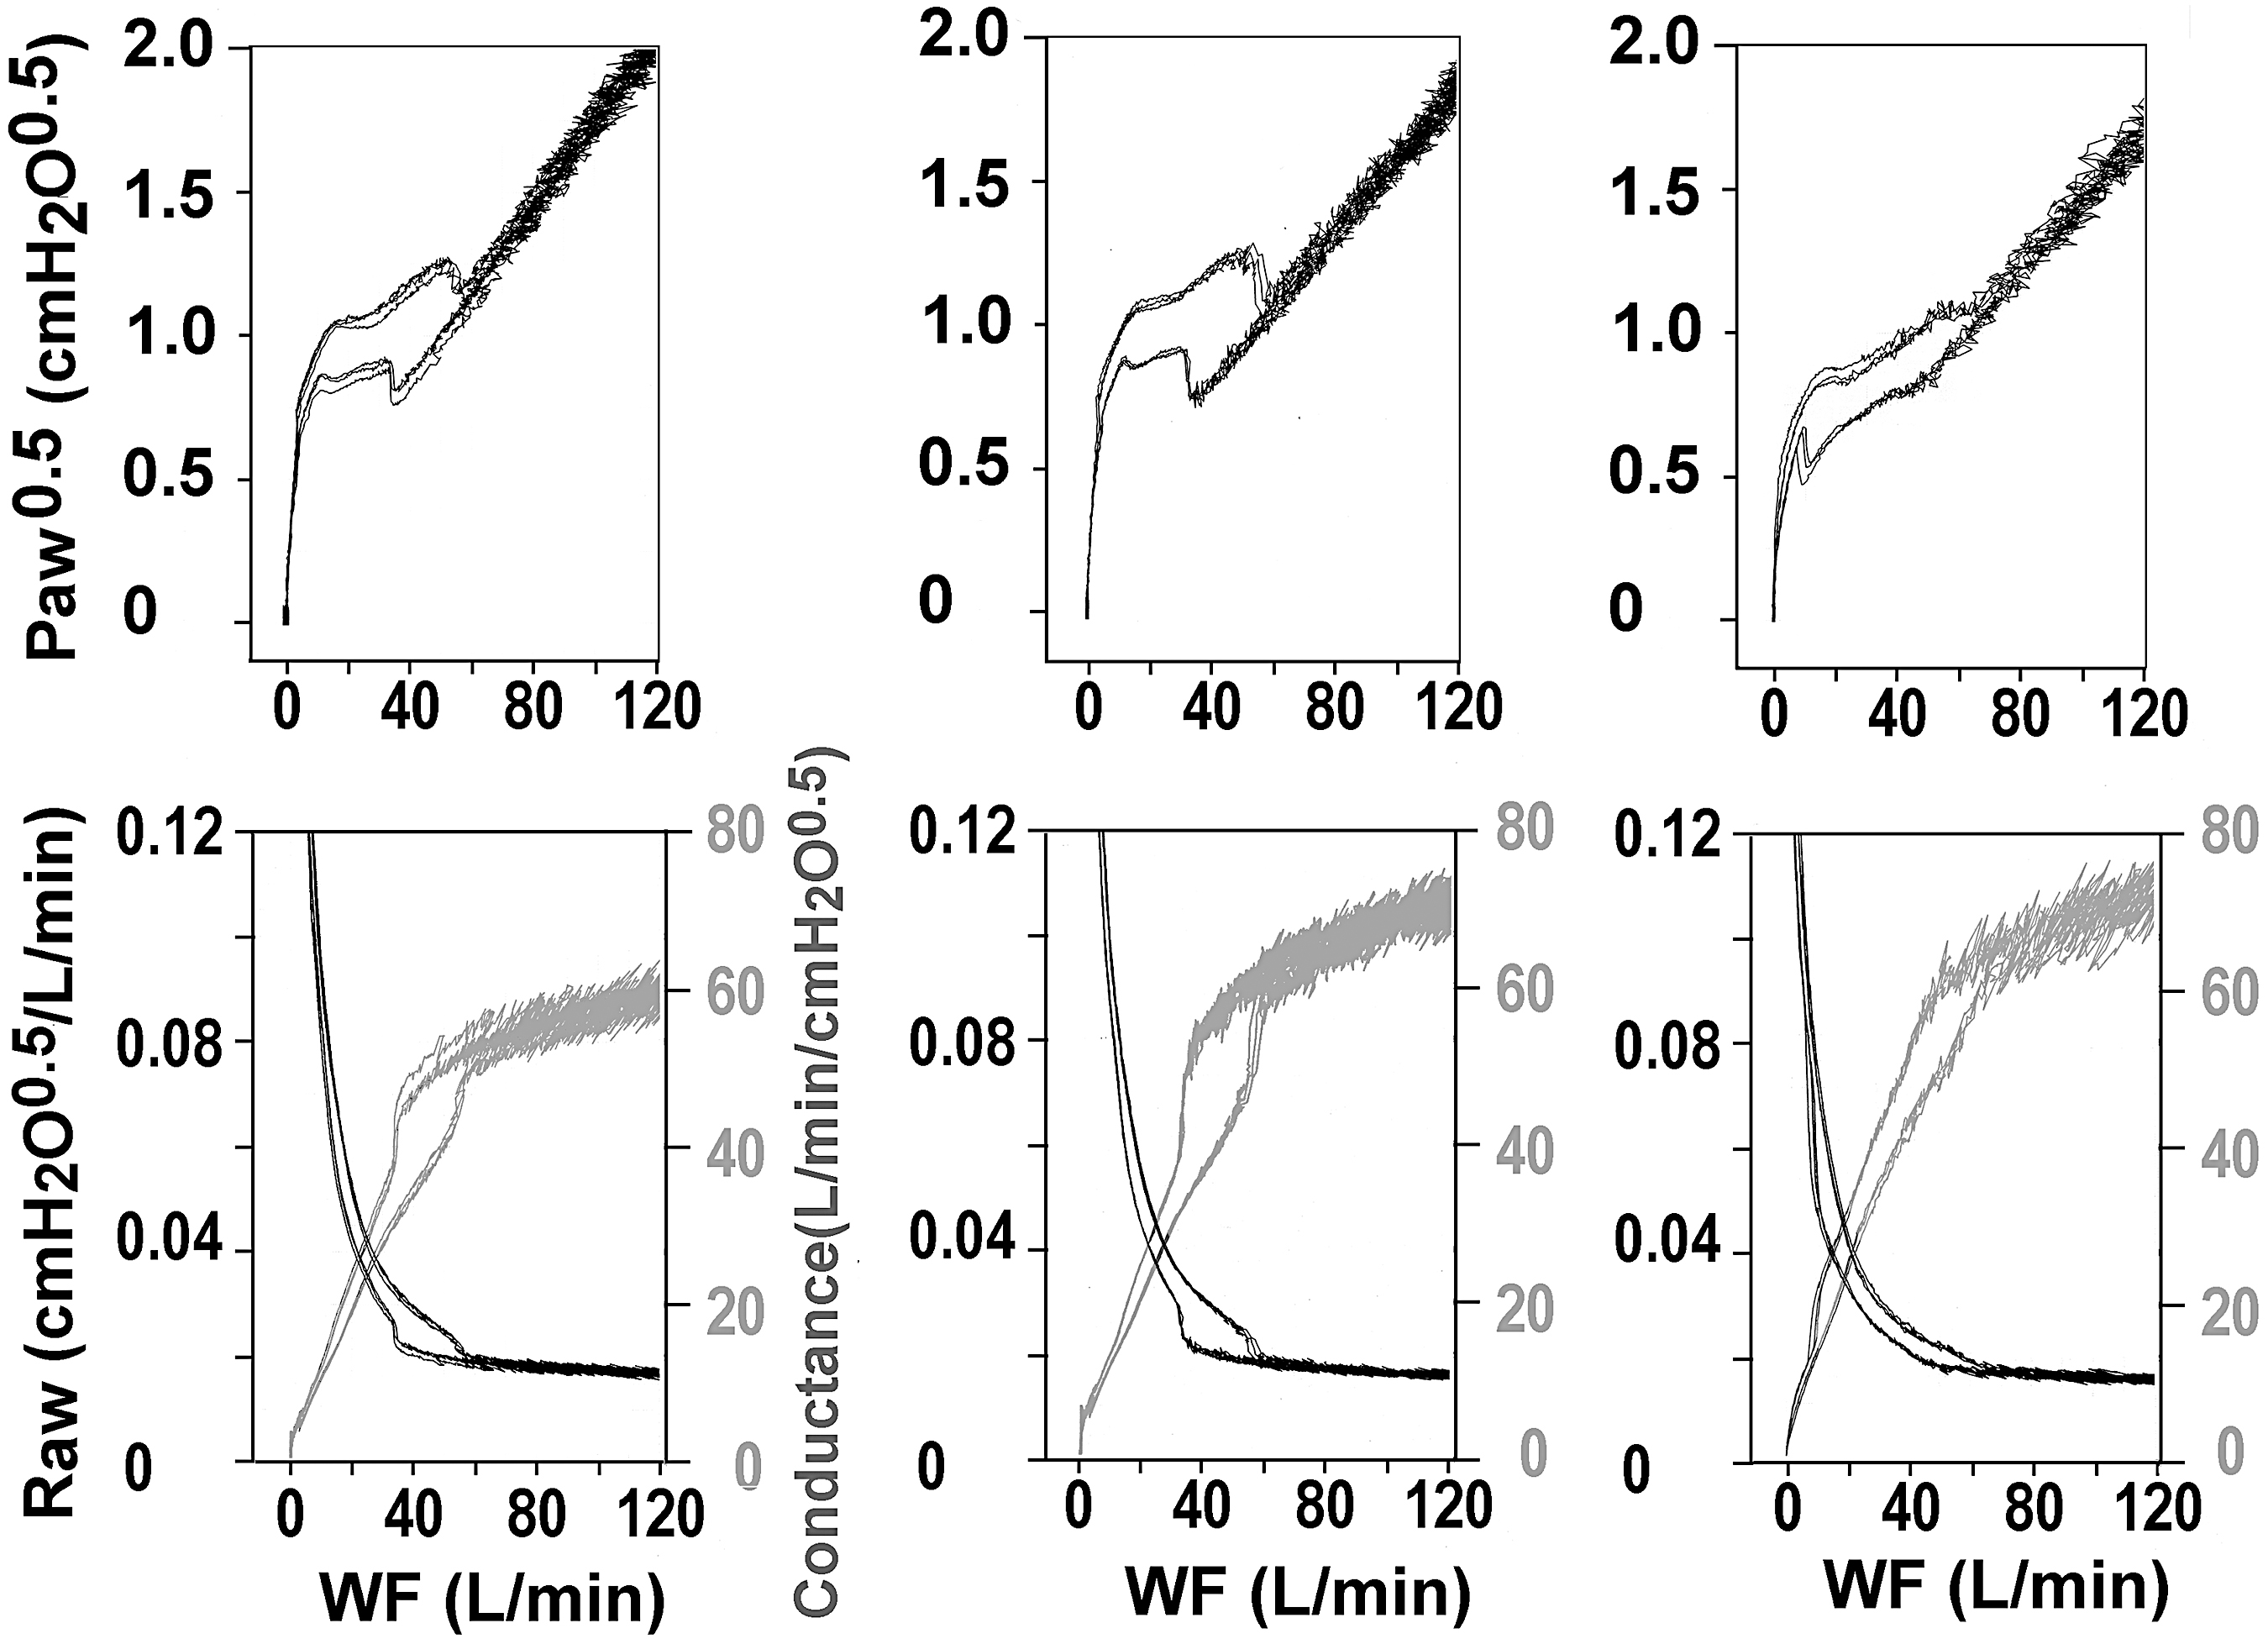
Dynamic changes in airway pressure (Paw0.5) (upper panels), airway resistance (Raw, black curves), and conductance (gray curves) (lower panels) against WF in three different sets of VHC and metered-dose inhaler (pMDI+VHC).
Aerosol releases from pMDI+VHC
Sample records depicting the aerosol release profiles obtained using fast ramp-up and slow ramp-up flows with a PWF of 50 L/min are presented in Figure 4. In response to the fast ramp-up WF, the time trajectories of CONC and AMRR are almost identical, consisting of steeply rising and convexly decreasing phases (panel A). When the slow ramp-up flow trials with different TPWFs (0.4, 1.4, and 2.4 seconds) were compared, the peak values of the CONC curve did not differ, whereas those of the AMRR curves decreased with longer TPWF.
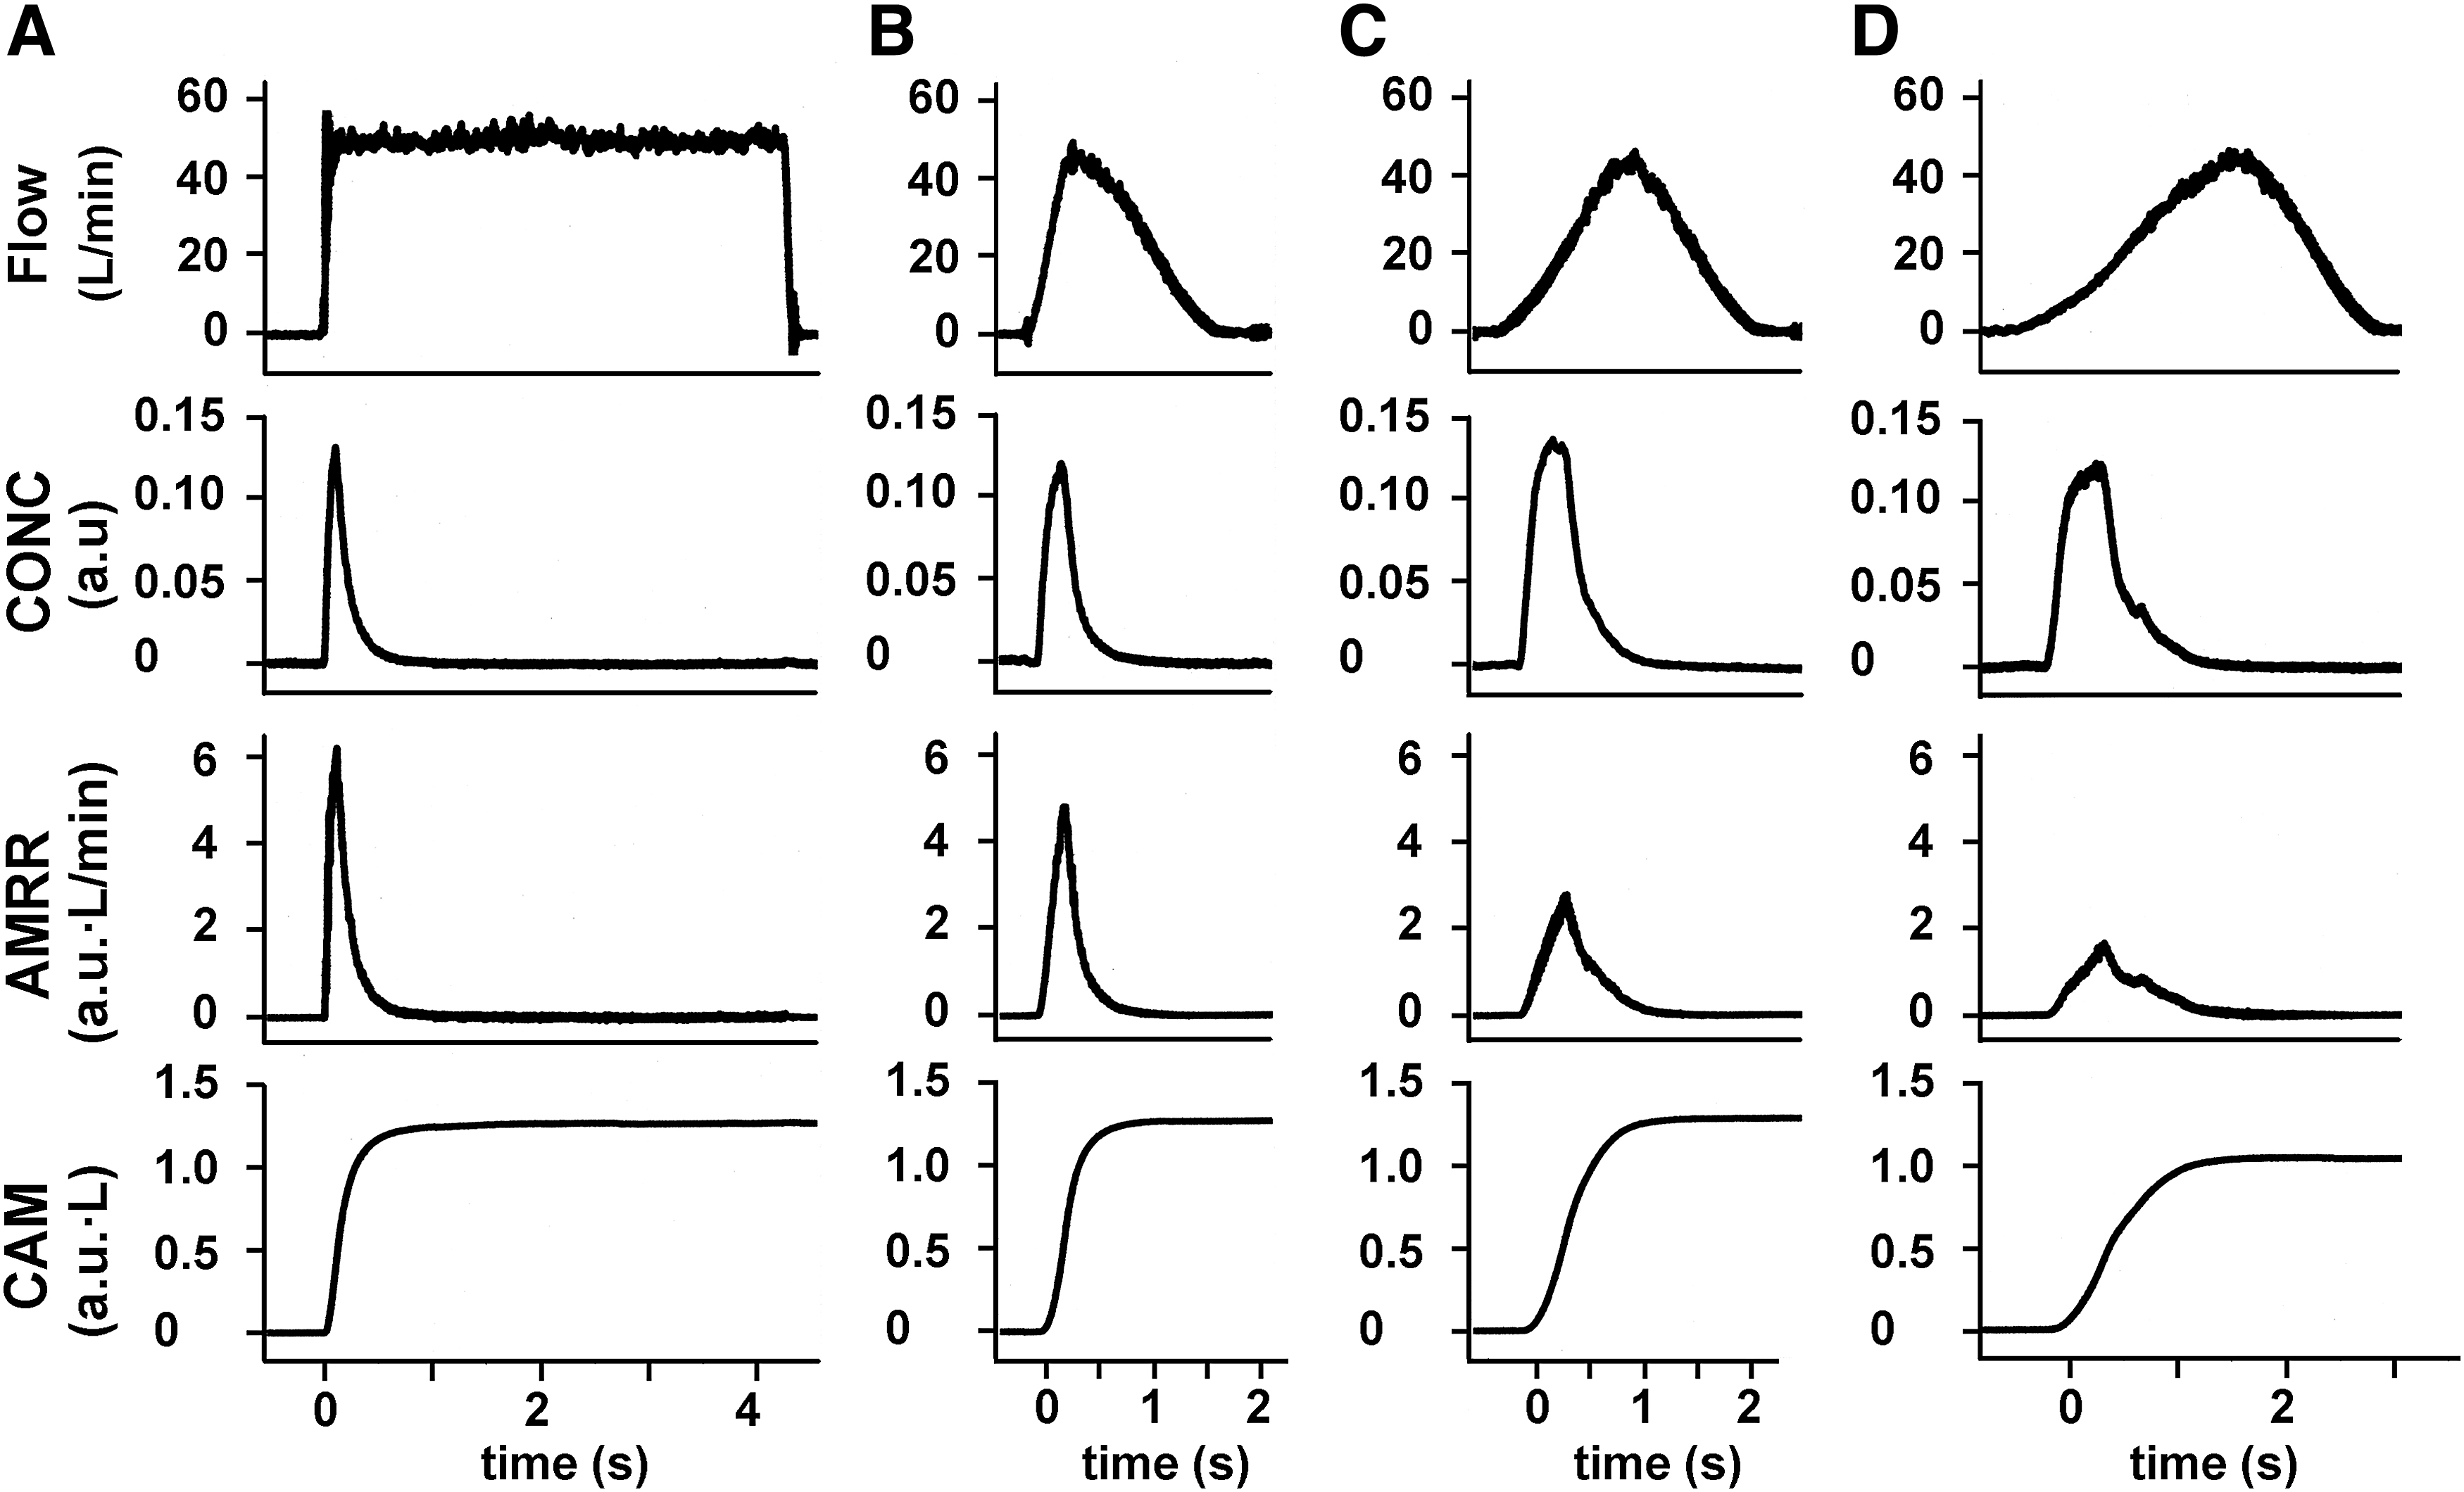
Example of recordings comparing the flow profiles and particle release. Inhalations with the fast ramp-up profile at 50 L/min
The aerosol release times for the CONC and AMRR curves showed TPWF-dependent prolongation. Moreover, the CONC curve became triphasic (i.e., rising, flat, and decrement phases) with longer TPWF. Triphasic CONC profiles appeared in 6 out of 33, 26 out of 35, and 22 out of 32 trials at TPWF = 0.4, 1.4, and 2.4 seconds, respectively, whereas the AMRR curve maintained a biphasic profile for any TPWFs (27 out of 33, 34 out of 35, and 32 out of 32 trials at TPWF = 0.4, 1.4, and 2.4 seconds respectively). Although the flat phase appeared frequently in the CONC, they appeared sporadically at TPIF = 0.4 seconds and PWF ≥50 L/min (1 out of 13 trials). The CONC and AMRR peaks always developed during the flow-increase phase. The CAM values, that is, the summation of AMRR, were not affected by the withdrawal profiles.
These features are quantitatively depicted in Figure 5. Peak value of CONC was TPWF independent (A), whereas that of AMRR was dependent (B). TAR, defined by either 95% particle release time for CONC (C) or AMRR (D), for a long TPWF was always longer than that for a short TPWF. Moreover, a slow inhalation, that is, long TPWF, requires a long inhalation time, yet the aerosol releasing time did not exceed 2.0 seconds.
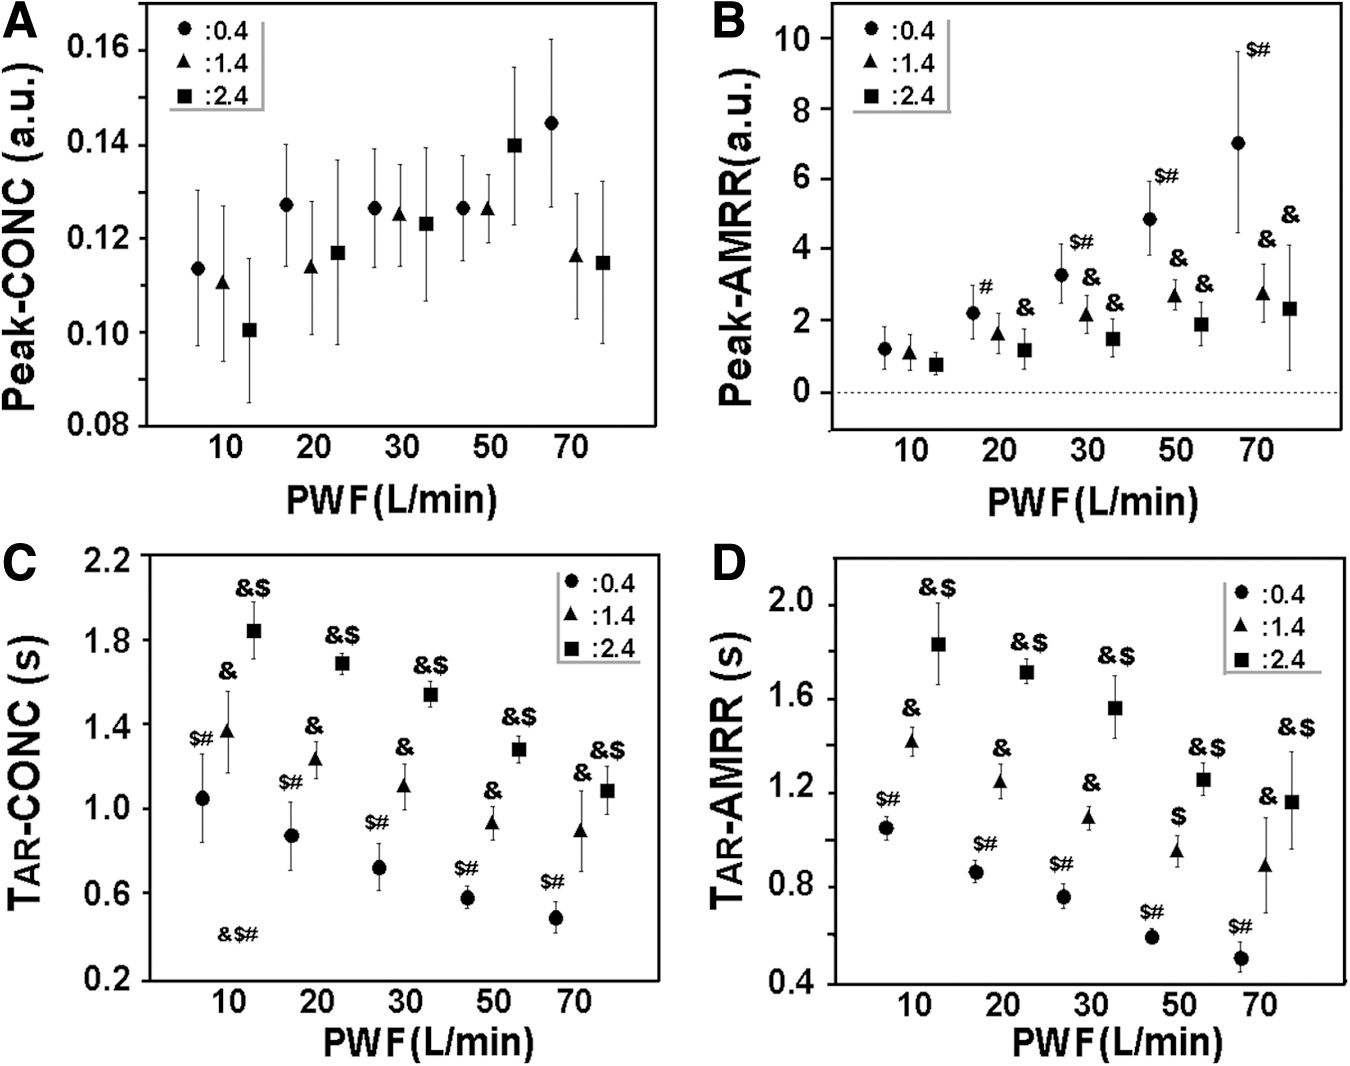
Comparison of peaks of aerosol release (peak) and aerosol release time (TAR) between CONC and AMRR. Upper panels are peak aerosol releases at different PWFs obtained from CONC traces
The quantitative changes in the aerosol release parameters during slow ramp-up withdrawals were further evaluated (Fig. 6). CAM tended to increase with a higher PWF or shorter TPWF; however, most did not reach statistical significance. Peak-AMRR, that is, the peak of AMRR, increased with increases in PWF; however, these increments tended to be blunted when TPWF was prolonged. TAR-AMRR also became shorter with increases in PWF. As shown in panel D, the withdrawn volume required for 95% aerosol release (VOL95) increased with increases in PWF using any withdrawal profiles.

Particle release parameters as the PWF varies.
Panel D in Figure 6 was reorganized (Fig. 7), revealing that the VOL95 tended to increase at higher PWF. These changes were statistically significant when the TPWF was short.

VOL95 versus PWF. This figure is rearranged from panel D in Figure 6. The WF profiles were fast ramp-up (open square), slow ramp-up with 0.4-seconds peak time (closed circle), 1.4 seconds (closed triangle), and 2.4 seconds (closed square). Significant differences (p < 0.05) were observed when compared with fast ramp-up (*), time to peak flow of 0.4 seconds (&), 1.4 seconds ($), and 2.4 seconds (#).
Discussion
This dynamic analysis highlighted the differences between the aerosol release from pMDI+VHC using slow ramp-up (i.e., human inhalation-like) profiles and those using a fast ramp-up profile, which is often recommended for in vitro testing on inhaler devices. This difference can be attributed to the following two factors: the variable Raw, which was changed by inhalation strength, and the flow-profile dependency of AMRR.
Mechanical characteristics of pMDI+VHC
When WF was increased stepwise and then decreased, the Paw0.5 versus WF curves changed to bi- or triphasic. Similar Paw0.5-WF behavior was observed with continuous changes in WF; however, the changes observed in the middle WF range (10–50 L/min) differed. Namely, the Paw0.5 versus WF curves in the flow increment phase are always located above those in the decrement phase. Such bi- or tri-phasic and flow direction-dependent Paw0.5 trajectories suggest the existence of a flexible construction in the VHC, indicating the presence of a flexible valve.
Valve opening and shutting are responsible for the early biphasic feature of the Paw0.5 trajectory, and the subsequent mild flexion and hysteresis may be caused by valve flexibility. During the static and dynamic trials, Raw ∼10 L/min was as high as those of dry powder inhalers (Ellipta = 0.09 cmH2O0.5/[L·min] and Breezhaler = 0.06 cmH2O0.5/[L·min]),9,10 potentially reducing the benefits of the low resistance of pMDI+VHC. Although a WF of ∼10 L/min may be the minimum flow in adult patients, this low value has been discussed in pediatric inhalations.11,12
However, Raw was small and almost constant in the WF range above 50 L/min. High-flow inhalation is not an optimal strategy as the inhalation effort represented by Paw [i.e., (WF × Raw) 2 ] increases in this range. Furthermore, a flow rate >60 L/min can result in more aerosol losses by inertial impaction on the valve at the outlet to the VHC. Therefore, the preferable WF range through MDI+VHC may be between 20 and 50 L/min (i.e., ∼0.75–1.04 cmH2O).
Aerosol releases from pMDI+VHC
The aerosol release profiles from pMDI+VHC using slow ramp-up withdrawal were similar to those using fast ramp-up flow. 4 However, the PWF-dependent increments in peak were considerably smaller for slow ramp-up withdrawal, and CAM also tended to decrease, especially at longer TPWF. Thus, the number of aerosols released from the pMDI+VHC was altered by the inhalation profile.
Both a higher PWF (e.g., 50 L/min) and a shorter TPWF (e.g., 0.4 seconds) provided a larger aerosol release irrespective of the WF profiles (Fig. 6A). Such a strong and rapid inhalation required short aerosol release time (Fig. 6C). Needless to say, a larger withdrawn volume is also needed. Therefore, strong, rapid, and deep inhalations may be the most efficient. However, for putting such inhalation maneuver into clinical practice, quantitative measures are required, especially in those who have poor respiratory function such as pediatric patients and patients with respiratory diseases.13,14
Few studies have described the effects of a high WF on the aerosol release from pMDI+VHC or only pMDI. Johal et al. reported that the fine particle fractions from pMDI using peak flows of 28.3 and 60.0 L/min did not differ (formoterol, 41.2% vs. 43.7% and fluticasone, 39.1% vs. 42.1%). 15 A review on pMDI, not pMDI+VHC, reported that slow inhalation results in a better airway effect than fast inhalation (37 L/min vs. 80 L/min and 37 L/min vs. 151 L/min). 16 These reports suggested that extremely high PWF, that is, >60 L/min, is not suitable for pMDI+VHC.
The lower limit of the PWF for efficient aerosol release should also be discussed. The CAM tended to be smaller when the PWF was small (Fig. 6A); however, the difference did not reach statistical significance. This finding may be attributed to the long aerosol stay in VHC. In such cases, the aerosols were precipitated on the inner surface of VHC. 17
Slator et al. applied a fast ramp-up flow for 10 seconds and peak flows of 5, 15, and 30 L/min to pMDI+Aerochamber Plus Z-Stat, and reported that the average emitted dose was 61.4%, 79.4%, and 85.8%, respectively, of the label claim, 18 suggesting that a peak flow of 30 L/min rather than 5 or 15 L/min is beneficial to pMDI+VHC. Concerning a rapid inhalation, CAMs with fast ramp-up and with any TPWF were not significantly different. This observation suggested that a TPWF <0.4 seconds can be recommended.
Deep or long inhalation is required to deliver the particles to the lower airways. As the withdrawal volume to complete aerosol release in the preferable PWF (30–50 L/min) was <0.4 L, the required inhalation volume may be a sum of 0.40 L and the anatomical dead space (∼0.15 L in adults). We observed that the maximum particle release time did not exceed 2.0 seconds, which is in contrast with the findings of a report by Verbanck et al. 19 In their in vitro study using Aerochamber Plus and a fast ramp-up WF of 15 L/min, aerosol release was completed in 4.0 seconds.
This discrepancy may have arisen from the differences in the system configurations. In our system, the AMRR was measured at the mouthpiece of the VHC, whereas in their system, the particle mass was measured at the end of an induction tube connected to the VHC. Therefore, the induction tube may have acted as an additional spacer.
Limitations
This study was conducted using a similar setup and procedure as in our previous report 4 ; thus, several methodological limitations discussed in the previous report were also observed in this study. These include insufficient shaking times before actuation, a relatively longer delay between shaking and fire, an inability to distinguish drug particles from unevaporated propellants, and an inability to represent fine particles. Nevertheless, these limitations were not detrimental to the results of this study, as discussed previously. Although Raw was measured at flow rates up to 120 L/min, aerosol release was only measured at flow rates up to 70 L/min, so we do not know what happens to aerosol release at higher flows.
Next, aerosol mass was deduced indirectly from optical data and the drug output was not measured. Moreover, it should be noted that the observed signals represented the aerosols released from the pMDI+VHC but not those that arrived at the lower airway. Lastly, the VHCs we analyzed were of only one type; thus, the results cannot be applied directly to other larger- or smaller-sized VHCs. This is a significant limitation of the article.
Conclusions
In conclusion, this dynamic analysis revealed that aerosol release from the pMDI+VHC was affected by the changes in Raw caused by the flexible valve and WF profile. The findings of this study suggest that efficient inhalation using human inhalation profiles is at 30–50 L/min (inhalation strength, 0.84–1.04 cmH2O), the required inhalation volume is >0.55 L, as rapidly as possible (onset to peak inhalation time <0.4 seconds), and the inhalation time is no longer than 2.0 seconds.
Footnotes

Authors' Contributions
T.K. and T.T. contributed to conceptualization, methodology, software, data curation, and writing of the original draft. M.H., S.H., K.M., S.T., R.K., and S.W. were involved in writing, reviewing, and editing.
Author Disclosure Statement
The authors declare they have no conflicting financial interests.
Funding Information
No funding was received for this article.
Reviewed by:
Michael Hindle
Steven Newman