




Abstract
Imaging of radiolabeled aerosols provides useful in vivo data on both the initial site of deposition and its subsequent transport by mucociliary clearance and epithelial permeability. Single Photon Emission Computed Tomography (SPECT) uses a gamma camera with multiple rotating heads to produce three-dimensional (3D) images of inhaled radioaerosol labeled with technetium-99m. This enables total lung deposition and its 3D regional distribution to be quantified. Aligned 3D images of lung structure allow deposition data to be related to lung anatomy. Mucociliary clearance or epithelial permeability can be assessed from a time series of SPECT aerosol images. SPECT is slightly superior to planar imaging for measuring total lung deposition. However, it is more complex to use, and for studies where total lung deposition is the endpoint, planar imaging is recommended. However, SPECT has been shown to be clearly superior to planar imaging for assessing regional distribution of aerosol and is the method of choice for this purpose. It therefore has applications in studying the influence of regional deposition on clinical effectiveness and also in validating computer models of deposition. The inability to directly radiolabel drug molecules with 99mTc is a clear disadvantage of SPECT and limits its potential use for pharmacokinetic studies. SPECT provides a wealth of data on aerosol deposition, which has been relatively underused at present. Optimal methods of analyzing and interpreting the data need to be developed. SPECT can also, in principle, provide detailed information of mucociliary clearance and has the potential to significantly improve knowledge of this process and hence clarify the role of clearance as a biomarker.
Introduction
Delivery of drugs by inhalation is well established for the treatment of acute and chronic respiratory diseases. 1 It is also a convenient means of administering drugs systemically to treat diseases in other parts of the body. The efficacy of inhaled drugs depends on their deposition in the lungs. 2 To improve treatment and to tailor drug delivery to the individual patient, more knowledge needs to be acquired on (1) how to control the amount of drug deposited and its regional distribution and (2) how these factors affect drug efficacy for different diseases. 3
Radionuclide imaging provides in vivo quantitative data on the fate of inhaled drug, which has greatly enhanced our fundamental understanding of the factors that affect pulmonary drug delivery and how to optimize this treatment modality. These studies have proven to be very useful for assessing novel inhaler devices or formulations and for comparing them against established products.4,5
Three types of radionuclide imaging are available, two-dimensional (2D) planar gamma camera imaging, three-dimensional (3D) single photon emission computed tomography (SPECT) and positron emission tomography (PET). Most inhaled therapy studies have involved planar imaging,4,5 but use has also been made of the 3D imaging methods.6–9
In addition to providing data on the initial deposition pattern of inhaled aerosol, radionuclide imaging can also provide information on its clearance from the airway tree, either by mucociliary clearance 10 or by absorption through the epithelium into the blood stream (epithelial permeability). 11 These functions of the airway tree are often impaired in disease, giving the potential to use measurements of clearance as a biomarker of disease and response to treatment. Nearly all studies to date on clearance have used planar imaging, but there is no reason in principle why 3D imaging could not be used for this purpose as well. 10
This section will focus on the use of SPECT measurements of aerosol deposition and clearance. This technology provides 3D images of a gamma emitting radiotracer administered to the body. It is widely used clinically, both in routine diagnosis and research. In most of these applications, it has now replaced conventional planar gamma camera imaging. As the problems resulting from the analysis and interpretation of the 3D data have been overcome, the superior information provided has usually led to its becoming the method of choice. At the same time, SPECT has been challenged by positron emission tomography (PET). This also provides 3D images of radiotracers but this time using a different class of radionuclide, namely positron emitters. Many clinical applications of radionuclide imaging are now covered by PET, but currently there still remains a unique role for both planar imaging and SPECT for particular applications, partly due to the expense, technical complexity and lack of general availability of PET technology.
This general assessment of the relative merits and applications of the radionuclide imaging modalities also applies to their use in measuring aerosol deposition and clearance. However, the comparatively small amount of work carried out in this area compared to that in the routine diagnostic applications has meant that progression along the path from planar imaging to SPECT to PET has been somewhat slower. Most studies on radionuclide imaging applied to aerosol deposition and clearance still rely on planar imaging, but SPECT and PET clearly have the potential to provide additional information of clinical value. This chapter describes the technique of SPECT applied to this area and the attempts that have been made to analyze and utilize the 3D information that is available.
Methods
Radionuclide imaging of aerosol deposition involves first labeling the aerosol with a suitable radioactive material. 4 When the subject inhales, the radiolabel follows the aerosol, and an image of the initial aerosol deposition distribution can be obtained using gamma rays emitted by the radiolabel. These have a long enough path length in tissue to escape from the body for external detection. As the name implies, SPECT imaging uses single photon emitting radionuclides in which the gamma ray used for imaging is produced directly. This is in contrast with PET imaging where the gamma rays are produced indirectly following the combination of the positrons with electrons in the body in a process of annihilation.
The distribution of a single photon emitter like 99mTc can be imaged by a gamma camera which produces two-dimensional images. 4 By rotating two or more heads around the body, 3D images can be created – this is SPECT. Modern day cameras often have a computed tomography (CT) scanner attached (Fig. 1). A detailed description of the methodology used in aerosol deposition measurements using SPECT is given in the recent International Society for Aerosols in Medicine (ISAM) guidelines document. 12 Some of the key points are covered in this section.

Photograph of a double-head gamma camera with CT attachment.
Image acquisition
Aerosol administration
Prior to the study, it is important to establish (1) the target amounts of drug and radiolabel to be administered and (2) that the radiolabel will be deposited in proportion to the aerosol mass. 4 The amount of radioactivity administered is a compromise between minimizing the effective dose of radiation to the subject and obtaining good quality image data. The aerosol should be administered using the predetermined protocol for the particular investigation. 4
Image acquisition for measuring aerosol deposition
Once the radioaerosol has been administered, the subject is moved as quickly as possible to lie supine on the couch of the SPECT scanner, and imaging commenced. Two-dimensional images are acquired at regular angular intervals around the subject, and these are stored in a computer. Digital image processing is then applied to reconstruct the three-dimensional distribution of activity that gave rise to the observed projection images.
Assessment of the aerosol deposition pattern requires the image to be a genuine quantitative representation of the 3D distribution of activity. The imaging process is affected significantly by the attenuation and scatter of the gamma rays in their passage out of the body, and correction of these factors is vital for quantitative imaging. Attenuation correction is achieved by forming a map of attenuation coefficients, which is obtained from an anatomical image, either CT, 13 a radionuclide transmission image, 14 or a magnetic resonance (MR) image. 15 This information is incorporated into the image reconstruction program, allowing the influence of gamma ray attenuation to be corrected and a quantitative 3D image to be obtained. Scatter correction is usually achieved by simultaneous acquisition of an image of scattered gamma rays.
These images are typically visualized as a series of two-dimensional cuts, which can be obtained in any plane through the 3D database. Where CT imaging has also been performed, the aerosol deposition can be displayed relative to the anatomy of the airway tree seen on CT (Fig. 2).
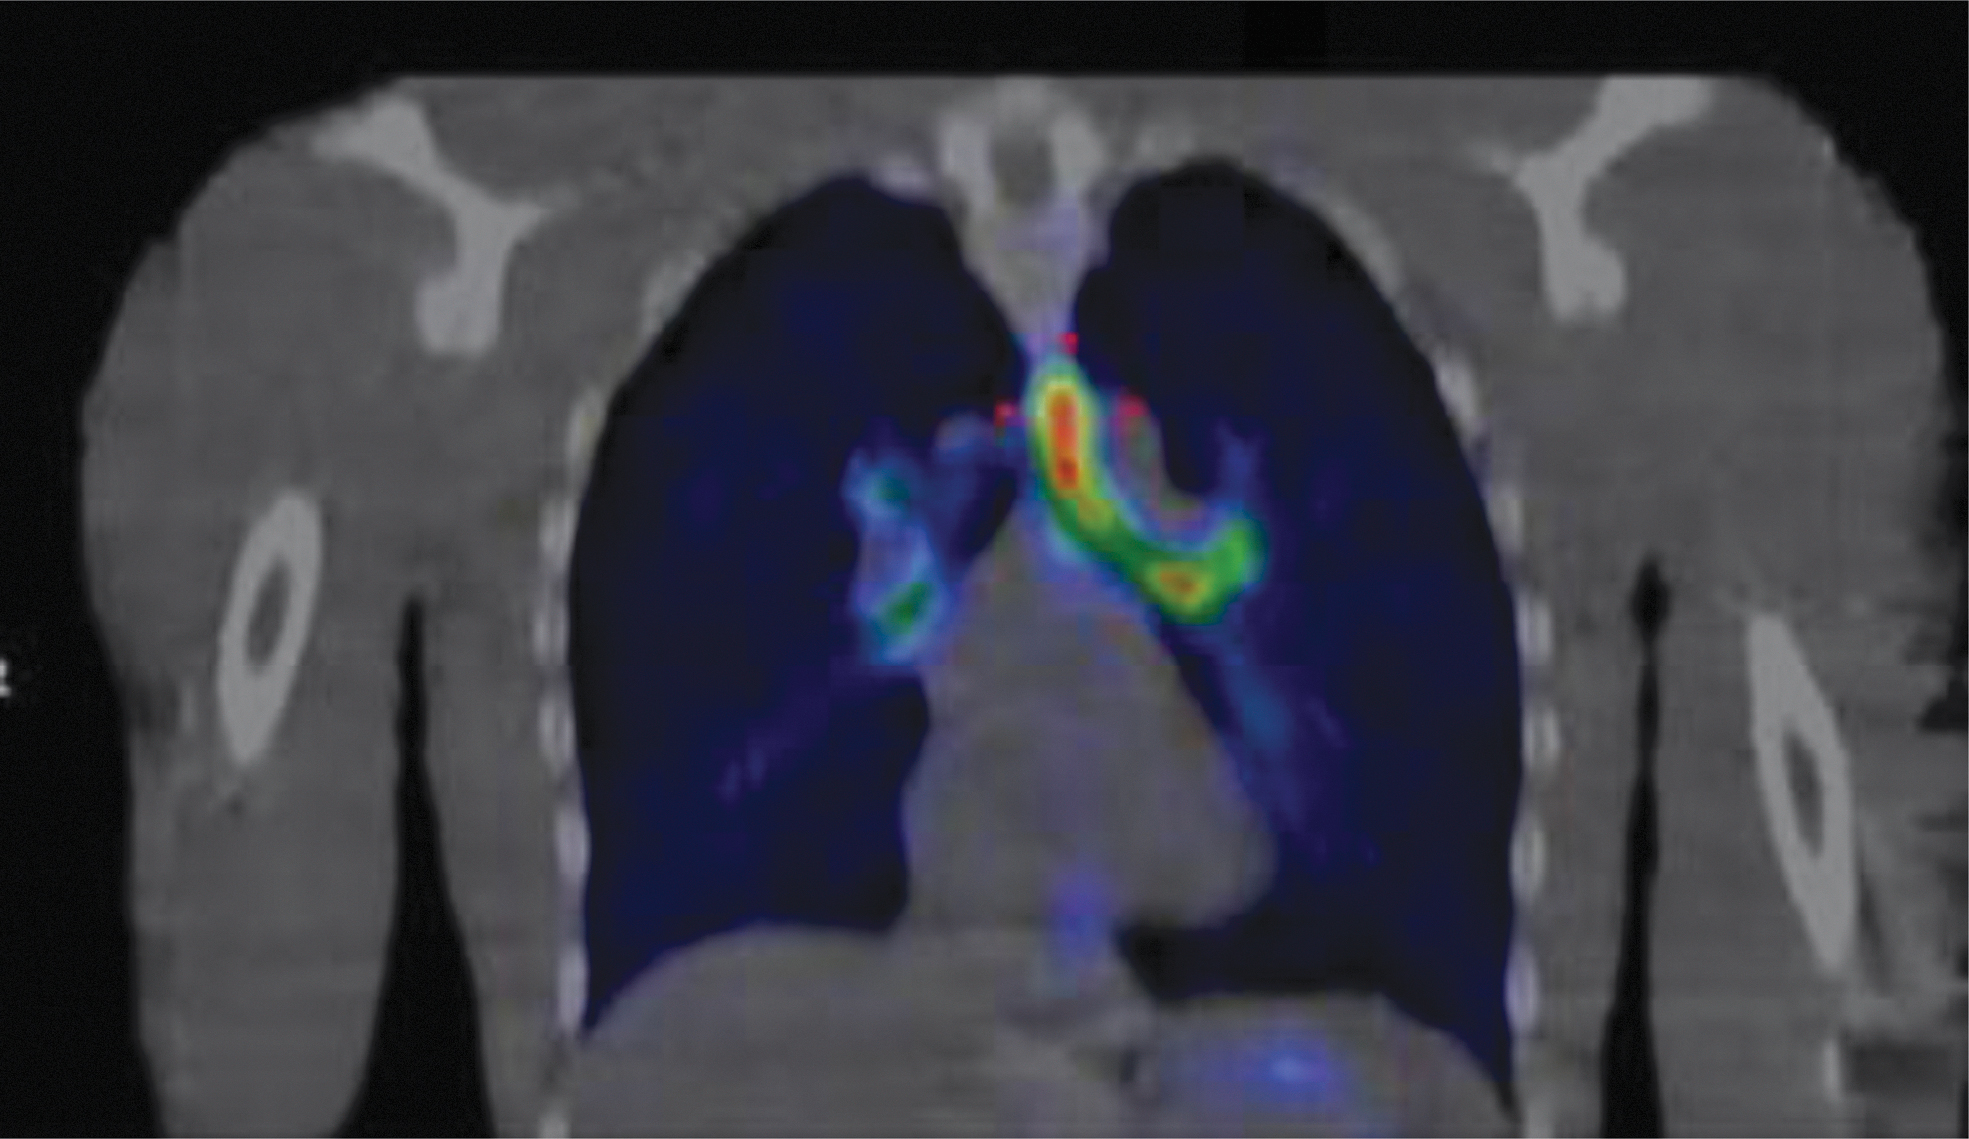
Example of a SPECT image of aerosol distribution shown in color overlaid on a low resolution CT image obtained at mid-tidal breathing. The image is a coronal slice at the position of the hilum of the left lung. The enhanced deposition concentration in the trachea and main bronchus is clearly shown.
SPECT imaging of aerosol distribution to date relies exclusively on 99mTc imaging, and therefore uses the same radiolabeled aerosols that are used in planar imaging. When imaging labeled drugs, it therefore has the same disadvantage that the radiolabel is not directly incorporated into the drug molecule. Radionuclide imaging makes the approximation that the distribution of radioactivity is stationary during the imaging period. In aerosol imaging, the validity of this approximation is affected by the processes of mucociliary clearance and absorption across the epithelium. Since SPECT imaging times are generally longer than for planar imaging, these effects are potentially more important for SPECT. The imaging time required to acquire good quality SPECT images of aerosol distribution is typically around 10 minutes with a dual-head gamma camera. This is sufficiently short to acquire images of aerosol cleared only by mucociliary clearance such as nebulized aerosol with a non-absorbable tracer. By using higher sensitivity collimators and different reconstruction techniques, imaging times of as low as 1 minute have been achieved. 16 This Fast SPECT technique can be used for pertechnetate or diethylene triamine pentacetic acid (DTPA)-based radioaerosols such as those used in pressurized metered-dose inhalers (pMDIs) or dry powder inhalers (DPIs). Alternatively, loss of activity from the lung during the imaging period can be corrected by measuring planar images before and after the SPECT acquisition to assess the clearance rate and extrapolating measured SPECT activity back to mid-inhalation time. 12
Image acquisition for clearance measurements
There has been very little use to date of SPECT for measurement of mucociliary clearance. 16 Eberl and coworkers 17 explain how this can be done using a three-headed gamma camera with transmission source for attenuation correction. This enables both a SPECT image of the aerosol and a map of attenuation coefficients to be obtained. Performing serial measurements of both images is possible, because the additional radiation dose from serial transmission measurements is low. Most SPECT cameras now use CT to obtain the attenuation map. 13 Even using low dose CT, the radiation dose from multiple SPECT-CT scans would be too high. In principle, multiple SPECT-CT would be possible using a single CT scan at the start of the experiment and then registering this to the imaging position of subsequent SPECT images. This would assume that the anatomy is constant throughout the study.
Analysis of image data
Determining the lung outline
The first step in analyzing SPECT data on aerosol deposition in the lung is to outline the lung from the anatomical image. The lung has much lower density than the surrounding tissue and on a CT or transmission scan can be segmented out using simple threshold techniques using the difference in image value between lung and soft tissue. Several methods have been described for using either fixed 18 or adaptive thresholds.19,20
Assessment of total activity in the lung
Having obtained the lung envelope, it is then possible to get measures of total lung activity and its regional distribution. One problem with this is the partial volume effect (PVE). This is caused by the limited resolution of the gamma camera, which is of the order of 15 mm. The images are blurred, causing some counts due to activity in the lung to appear outside the sharp outline of the lung obtained from an anatomical image. A simple way of correcting for this is to expand the volume of interest by dilation to include the blurred counts. More elegantly, the geometric transfer matrix technique can be employed. This uses knowledge of the degree of blurring to correct the counts in the lung region. 21
Having corrected the counts for the PVE, it is necessary to convert them into a measure of radioactivity and therefore aerosol. The conversion factor is found by imaging a test object with known activity. 12
Assessment of spatial distribution of aerosol in the lung
The spatial distribution of aerosol in the lung is measured by dividing the lung into a number of subvolumes. Most methods of doing this assume that the airways branch radially from the hilum (Fig. 3) so that the radial variation of aerosol concentration approximates to the distribution by airway generation.

Cast of the pulmonary airway tree illustrating the approximately radial branching arrangement.
One such approach was to define planar inner (central) and outer (peripheral) regions on 2D sections through the 3D image database. 14 However, the method recommended in the recently published guidelines for SPECT aerosol measurement 12 is to use a fully 3D subdivision of the lung volume. 22
Each lung is divided into ten concentric shells centered on the hilum (Fig. 4). The measured activity in each shell will be affected by the PVE, but this can be corrected using the geometric transfer matrix approach. 21 The corrected shell data can then be used to provide a detailed description of the aerosol deposition from center to periphery of the lung (Fig. 5).
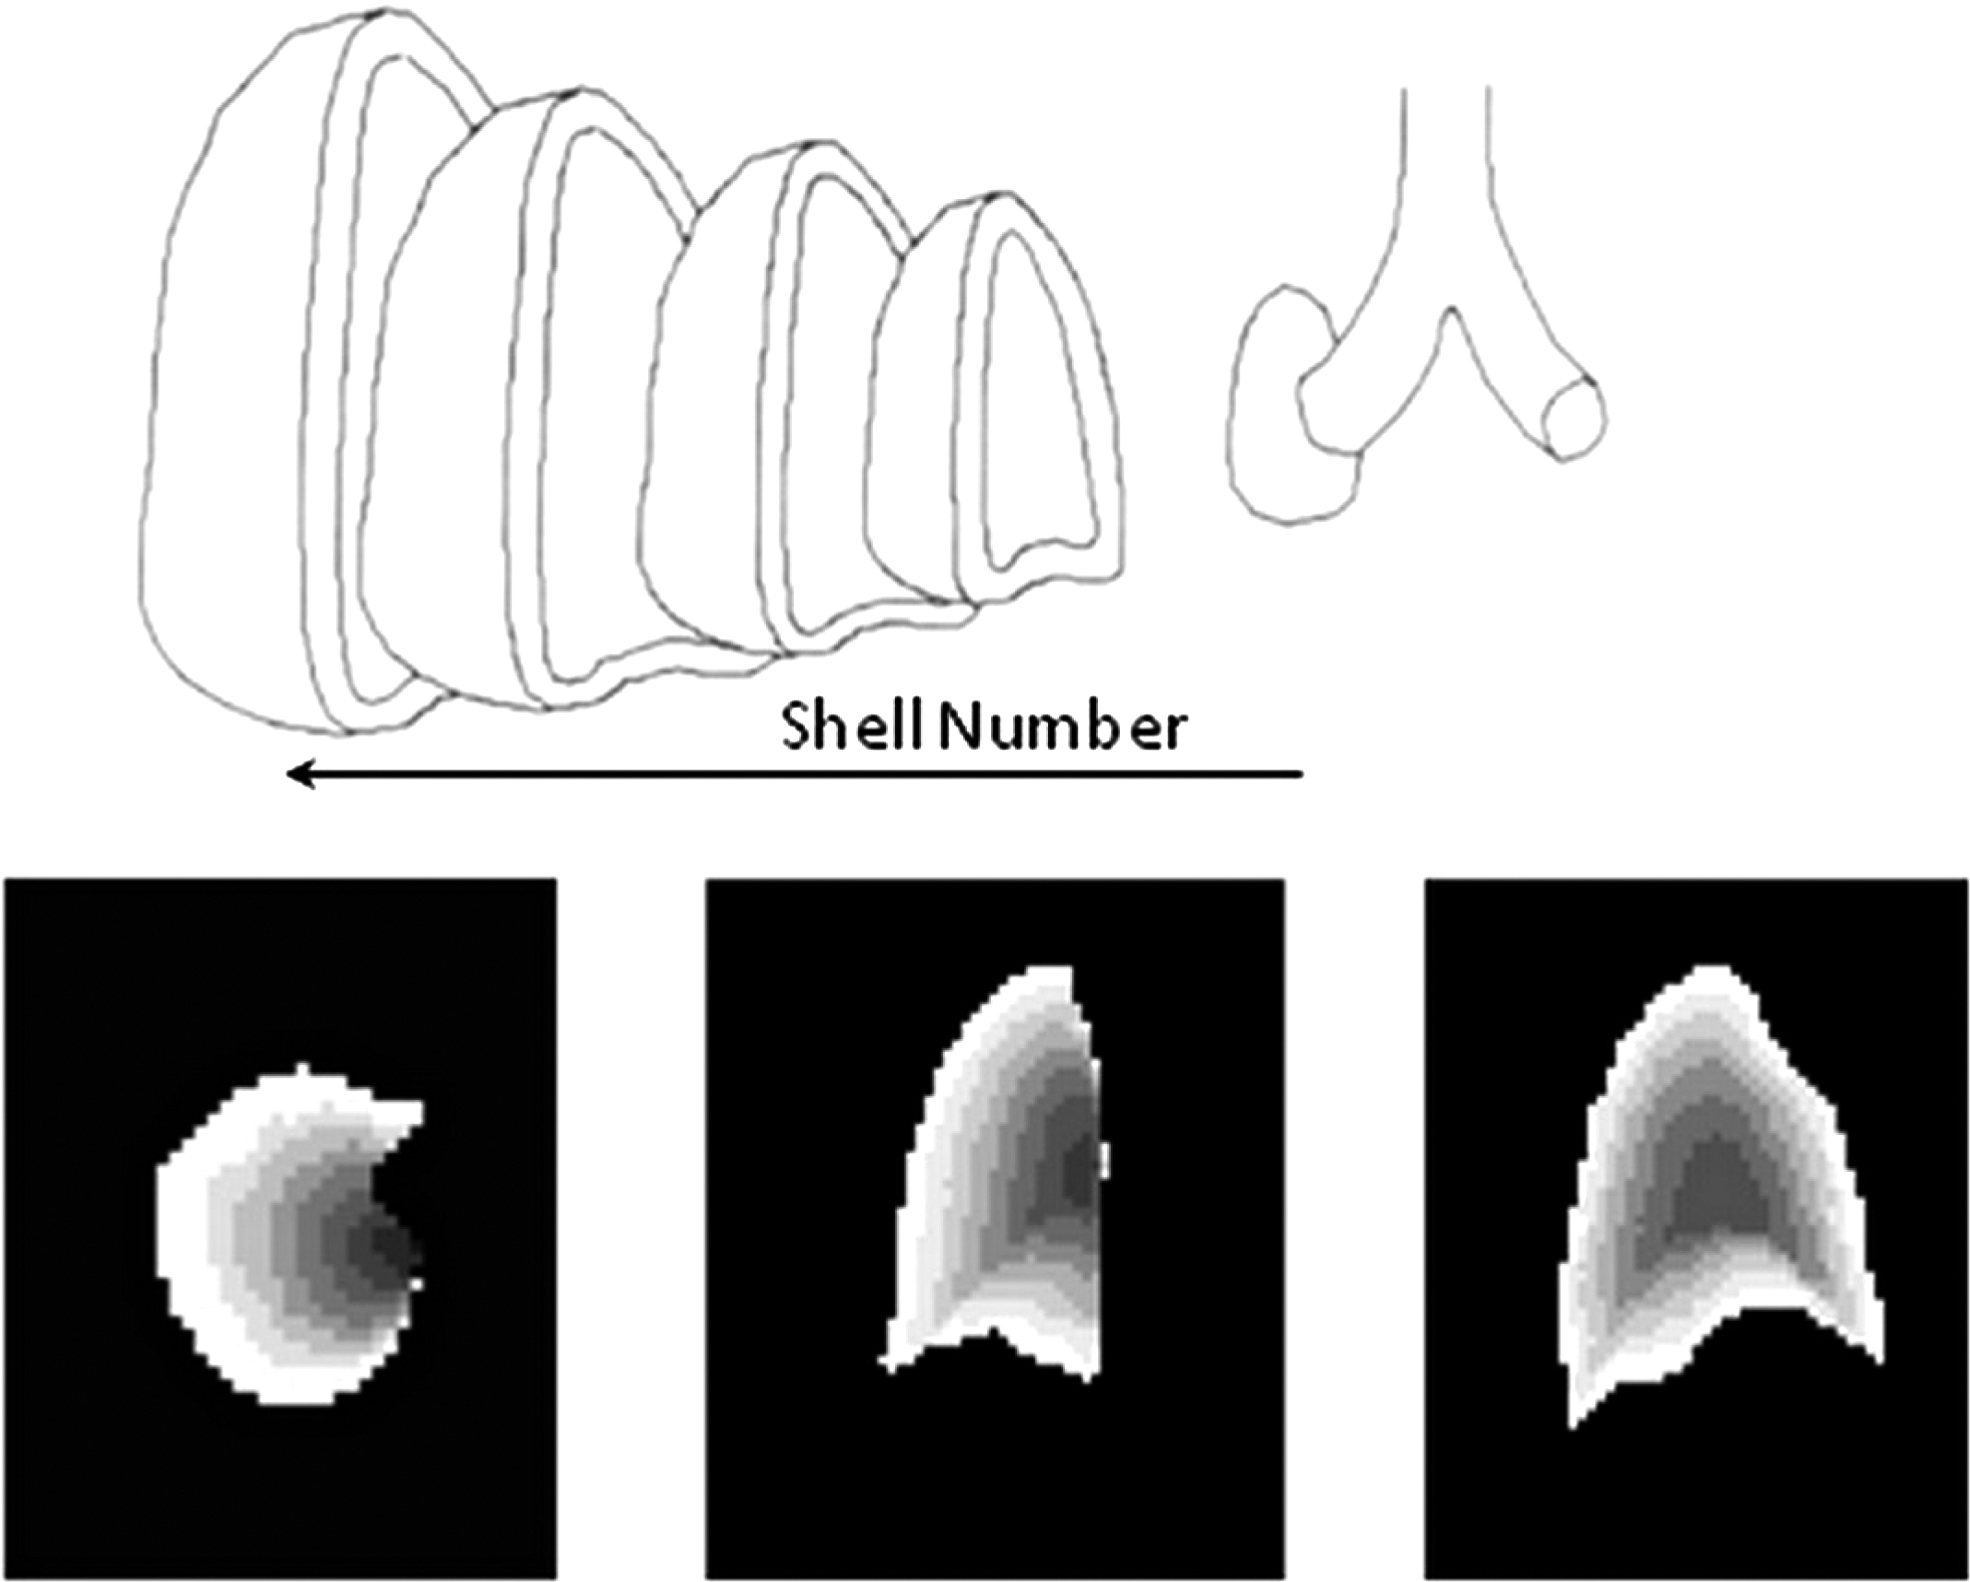
The top image illustrates the concept of dividing the lung into concentric shells based on the position of the hilum of the lung. The bottom set of images illustrates transverse, coronal and sagittal cuts through the 3D shell volume, depicting the different shells in shades of gray (Reprinted by permission of Mary Ann Liebert Inc., Publishers from Ref. 12 )
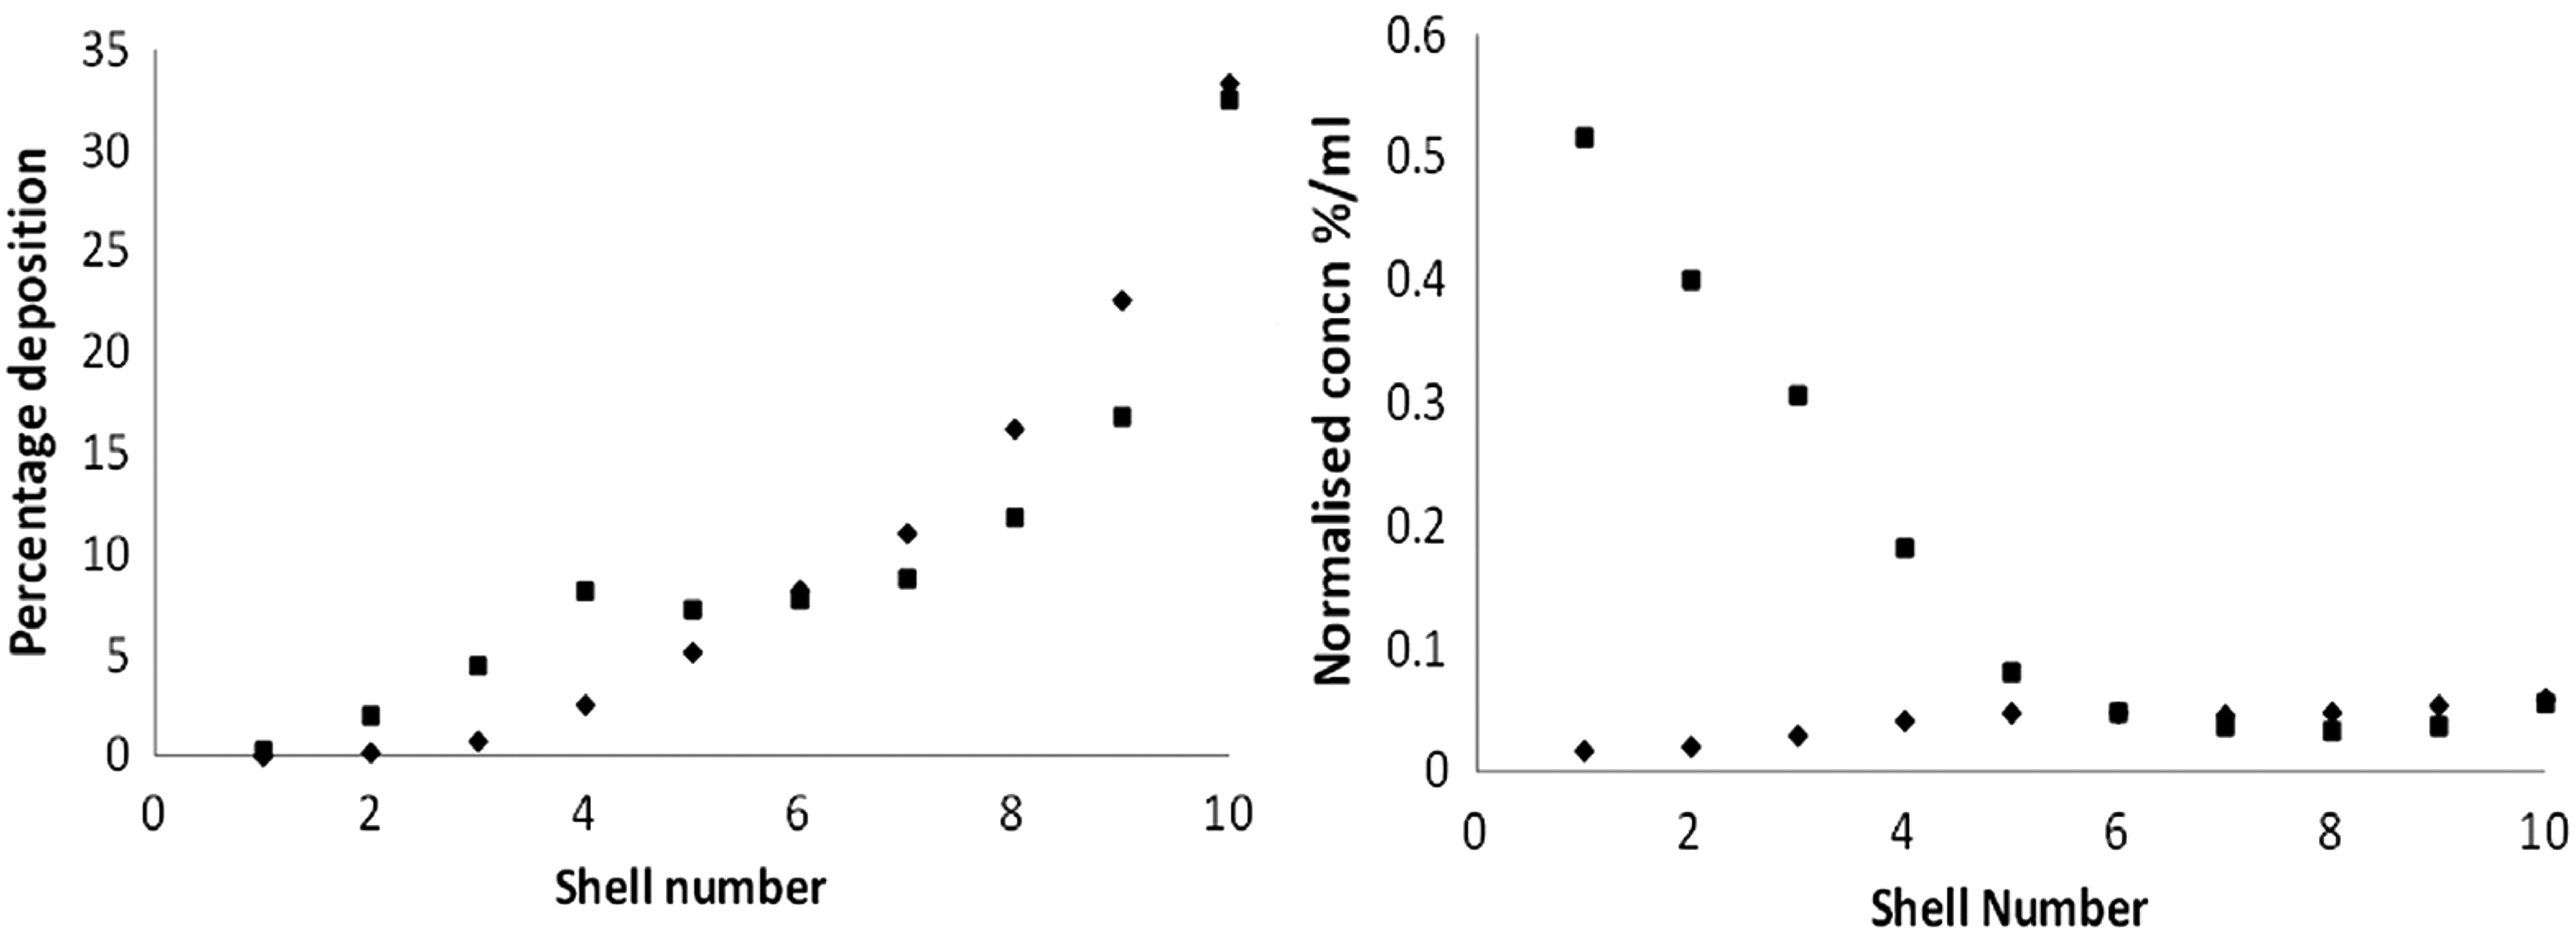
Example curves showing (left) the total deposition per shell and (right) the normalized concentration deposition per shell for the right lung for two different aerosol deposition distributions: (i) a normal subject inhaling relatively small particles (2.0 μm mass median aerodynamic diameter, MMAD) (◊), and (ii) a moderately asthmatic subject inhaling larger particles (6.0 μm MMAD) (▪) (Reprinted by permission of Mary Ann Liebert Inc., Publishers from Ref. 12 )
Alternatively, the data can be summarized by deriving outer to inner ratios (O/I). These combine defined shells to describe the inner and outer volumes, which approximate to central and peripheral airways respectively. Several different definitions have been used, but the new guidelines recommend that the inner five shells should describe the inner volume and the outer five shells, the outer volume. 12 These O/I ratios can then be normalized to lung volume to obtain a penetration index. (It should be noted that the penetration index defined in this way is simply the reciprocal of the normalized central to peripheral ratio, which is also widely used to describe 3D aerosol distribution).
Measuring aerosol distribution relative to lung anatomy
3D indices of the spatial distribution of aerosol relate more directly to deposition in the different airways than do 2D values. However, there is still considerable overlap between shells and airway generations, with many alveoli in the inner volume and many small conducting airways in the outer. Knowledge of the spatial location of different airway generations makes it possible, in principle, to estimate the deposition by generation from the imaging data. Three types of anatomical lung model have been developed: (1) conceptual models, 23 (2) deterministic models24,25 and (3) hybrid models 26 (Fig. 6).

Figure illustrating different spatial models of the lung that can be used in the estimation of deposition by airway generation: Left: The conceptual model of the lung in which specific airways are not defined but rather generic values for the air volume of each generation in each concentric shell of the lung. Center: Generic models of the actual positions of each airway in space. Right: Hybrid models which use individual definition of the first few generations from CT and fill the rest of the lung with generic definition of the airways using either the conceptual or deterministic approach. (Reprinted by permission of Mary Ann Liebert Inc., Publishers from Ref. 12 )
To date, only the conceptual model has been used to estimate deposition per generation. 13 This describes the air volume of each generation in each shell, enabling an equation to be defined relating the unknown deposition in each generation to the measured deposition in each shell. Solution of this equation provides an estimate of the deposition per generation. Figure 7 contains example data derived from the shell data shown in Figure 5.

However, it should be noted that validation work to date indicates that this can only be done with relatively large errors. 13
Anatomical images also allow definition of the lobar and segmental geometry of the lung (Fig. 8), enabling deposition by lobe and segment to be estimated. To date there is limited data on the application of this technique. 27
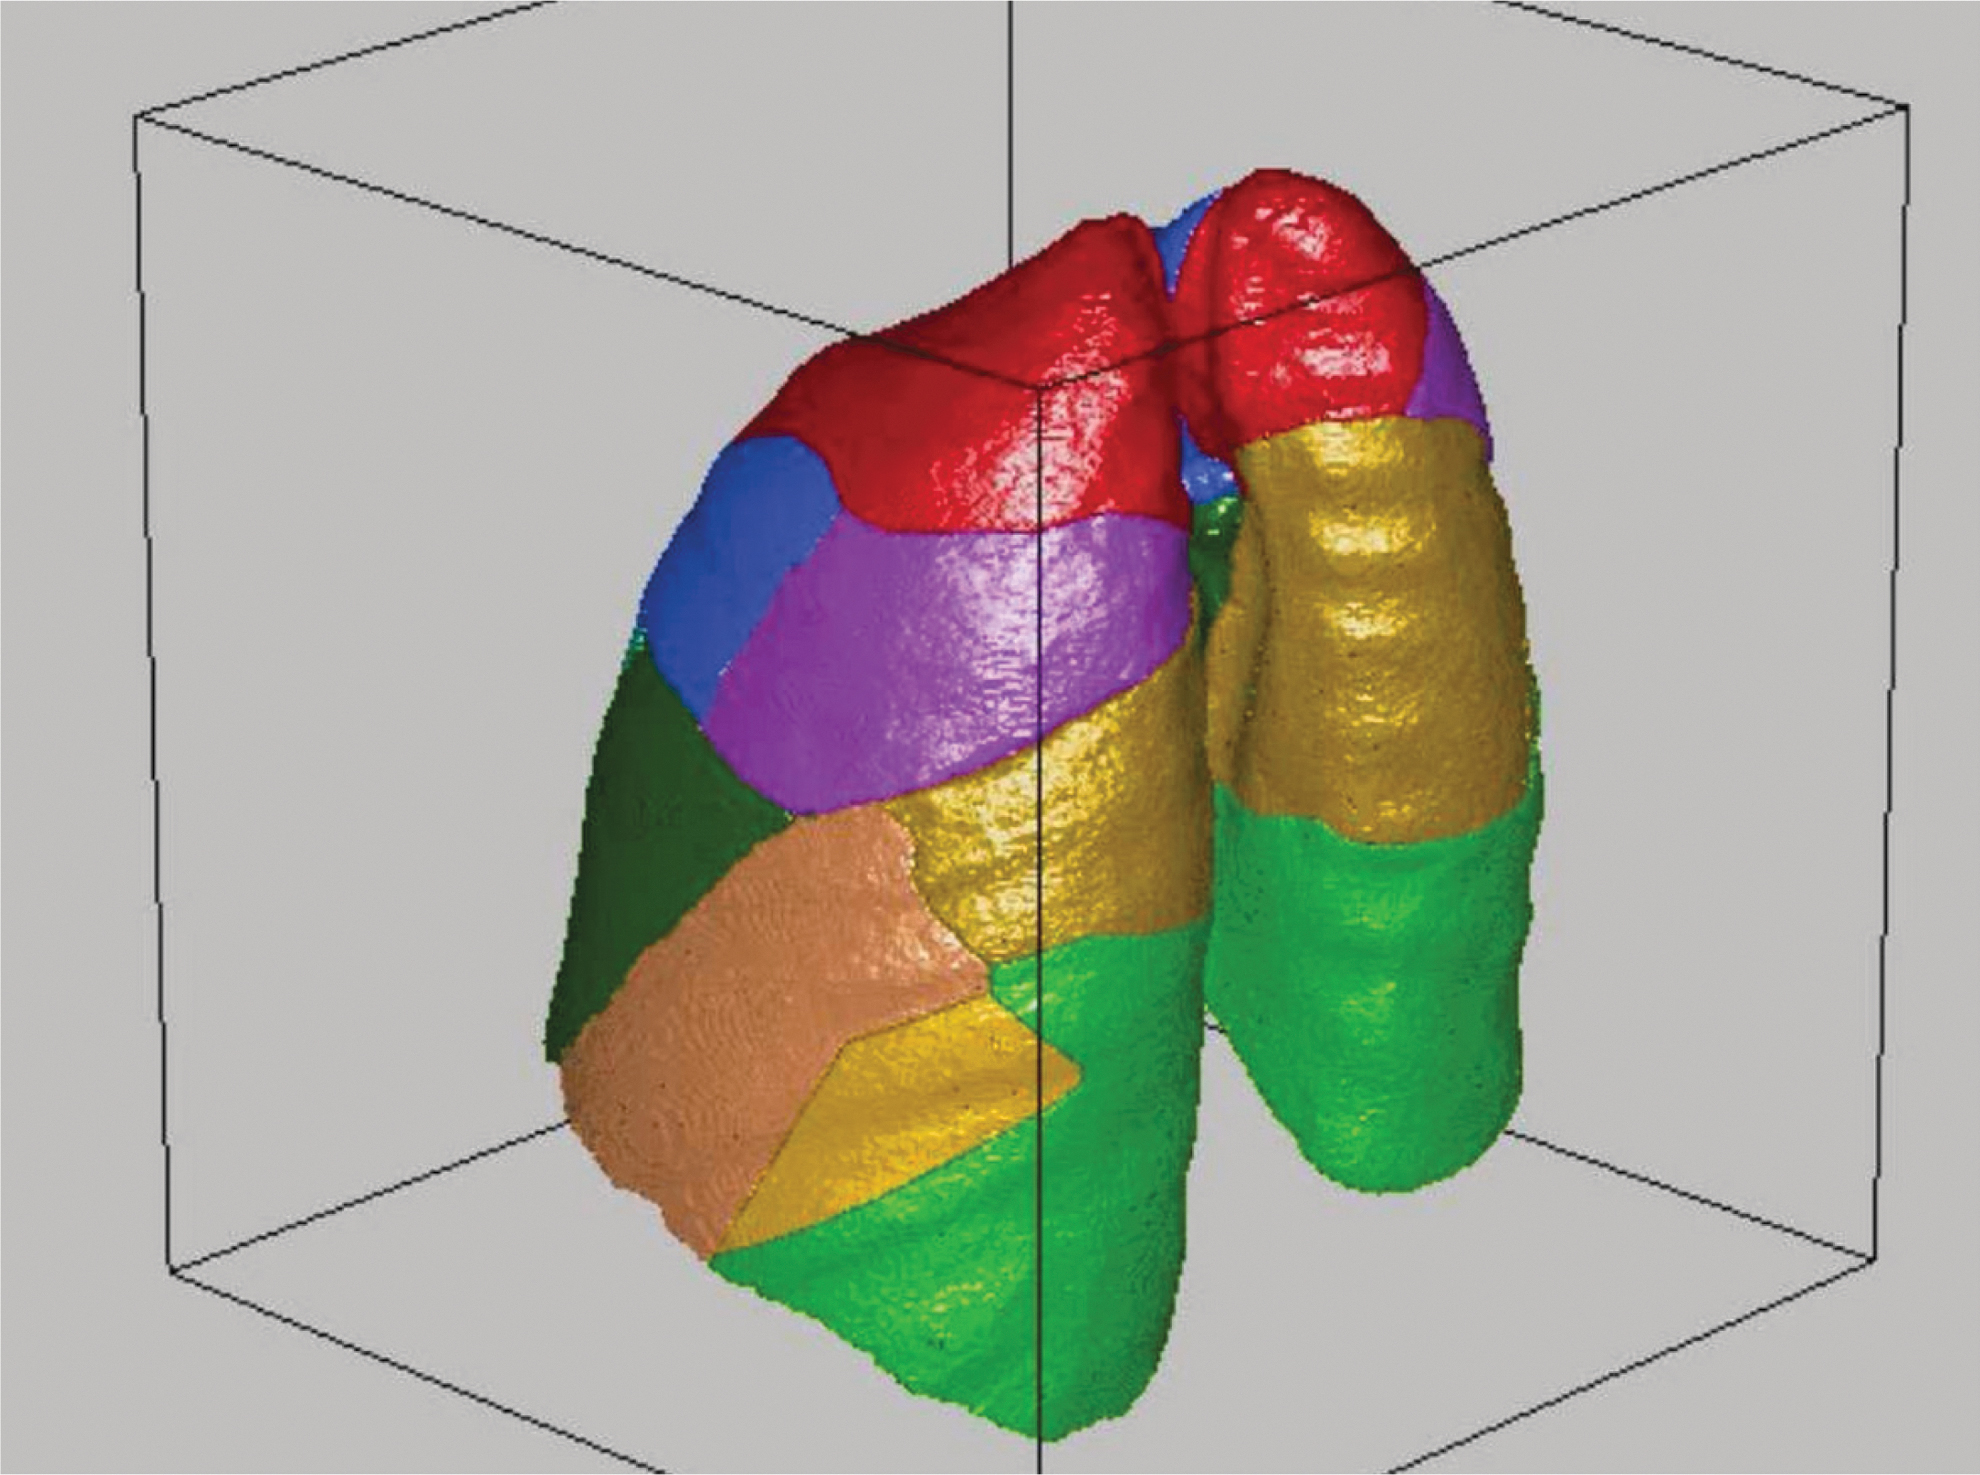
Illustration of the division of the lung into lobes and segments, which is now possible using high resolution computed tomography
Analysis of SPECT data for mucociliary clearance
Currently, there is very little data published on the use of SPECT for mucociliary clearance, 17 but in principle all the techniques used to determine the regional distribution of the initial sites of aerosol deposition could be used on a time series of SPECT images to study mucociliary clearance. Thus, for example, it is possible to study regional clearance by measuring the variation of activity with time in each of ten concentric shells (Fig. 9).

Example of the influence of mucociliary clearance on the three-dimensional distribution of aerosol in the right lung of a healthy control subject. The upper panel shows the deposition in each shell as a percentage of the total original deposition in the lung immediately after inhalation (♦) and 1 hour later (▪). The lower panel shows the percentage clearance from each shell at 1 hour relative to the original deposition in the shell. This illustrates the rapid removal of aerosol from the inner shells containing predominantly conducting airways compared to the much slower removal from the outer shells. (This is preliminary data from a trial being carried out at the author's centre supported by AstraZeneca).
SPECT provides better measures of regional deposition compared to planar imaging 6 and, thus, should be able to monitor regional mucociliary clearance more accurately.
Validation of analysis techniques
Validation of SPECT measurements of radioactivity can be carried out using phantom experiments or computer simulation. Both these methods show that errors in measuring activity in an organ are less than 10%, provided care is taken in both experimental procedure and analysis. The simulation studies demonstrated that SPECT gave improved precision compared to planar imaging. 21 Accurate quantification is not always possible with the software provided with gamma camera computer systems, 28 and careful quality control is required. 12
Regional analysis techniques also require validation. The geometric transfer matrix technique which compensates for the PVE has been evaluated using phantom measurements 29 and computer simulation 21 and has been shown to provide accurate correction.
The ability to derive data on deposition per generation from imaging is much more difficult to validate, as the true distribution cannot be easily modeled in either phantom or computer model experiments. Limited validation has been carried out using computer simulation techniques.23,30 In this case, however, there is an alternative method of comparison using planar imaging measurements of 24-hour clearance of aerosol. This gives a measure of fractional deposition of aerosol in the conducting airways and has been compared to assessments of deposition by generation from SPECT (Fig. 10). 13 Both simulation and 24-hour clearance comparisons suggest that deposition per generation can only be determined with relatively large random errors at present. Both methods of validation give the coefficient of variation of estimating the percentage deposition in the conducting airways to be about 20%.30,31 Simulation shows that estimating the bronchial airways deposition fraction (generations 2–8) should be more precise, with a coefficient of variation (COV) of 13%. 30

Comparison of 24-hour clearance with the Weibel conducting airways deposition fraction (wdf) derived from SPECT in a series of healthy male control subjects. Calculation of the wdf used the Weibel definition of the conducting airways, which assumes that a fraction of the airways in generations 17–19 are conducting. There was no systematic difference between the two estimates of conducting airways deposition, but there is a large random difference between them. The line is the line of identity.
Applications of SPECT
In this section, the practical applications of SPECT measurement of aerosol deposition are considered in the context of information provided by other complementary imaging techniques.
Evaluation and optimization of inhaled therapy
Both total lung deposition of drug 2 and its regional distribution 32 influence the clinical effectiveness of inhaled treatments. The accuracy with which total lung deposition can be measured with SPECT is, in principle, better than planar imaging. It deals better with the influence of attenuation of gamma rays and also provides improved definition of the lung outline. This enables the influence of overlap of counts from adjacent organs such as trachea and stomach to be minimized. However, this is offset by the disadvantage of having a longer imaging time. This is particularly relevant for imaging aerosols from portable inhalers, which may be cleared rapidly from the lungs. In addition, carefully performed planar imaging can achieve around 10% accuracy, which is not substantially worse than that achievable by SPECT and is sufficient for many clinical applications. Therefore, it is hard to justify the extra cost and complexity of SPECT in projects where total lung deposition is the endpoint.
The regional distribution of many drugs in the lungs is also an important determinant of both efficacy and safety. 33 It is assumed that drugs need to be targeted towards their receptors for maximal effect. Receptor sites for inhaled drugs are not distributed uniformly within the bronchial tree; for instance, the receptors for anti-muscarinic bronchodilators are concentrated most densely in the large conducting airways. 34 Regional distribution of drug is also likely to be relevant for systemically acting drugs; the alveolar epithelium is usually assumed to be the major absorption site of inhaled peptides and proteins, because the alveolar surface is adjacent to the lung capillaries, being separated by a thin layer of epithelial cells. 35
SPECT provides superior information on regional distribution of aerosol compared to planar imaging. Simulation studies have shown that three-dimensional indices describing aerosol distribution reflect the real distribution accurately while 2D indices significantly underestimate differences between different distributions. 13 This has been demonstrated in practice by the superior ability of SPECT to detect the influence on deposition of particle size,14,36 tonicity 37 and concentration 38 in normal volunteers and the difference between healthy controls and subjects with asthma.39,40 Therefore, in studies where assessment of regional deposition is the endpoint, SPECT is preferable to planar imaging. It has been used to study the deposition pattern of nebulizers, 36 pMDIs41,42 and DPIs.43–45 The more recent studies on DPIs have used co-spray drying with 99mTc DTPA to label the drug. 44 This enables the radiolabel to be incorporated inside the particles, and absorption is slower than pertechnetate-based labels. 46
Validating lung models
Computer models of the fate of aerosol within the airway tree represent another source of knowledge on deposition. They potentially provide a means of predicting deposition and hence optimizing treatment on an individual basis. However, validation of these models is limited, particularly in their ability to predict regional lung deposition. By providing improved data on regional aerosol deposition, 3D imaging can go some way in answering that unmet need. Recent studies have focused on collecting SPECT data on aerosol deposition with carefully controlled inhalation regimes. 47 These allow detailed comparison of model predictions with imaging measurements.27,48 The acquisition of aligned anatomical information on the lungs 49 is useful both in assisting analysis of the imaging data and in allowing individualized modeling of the airway tree for improved deposition prediction.
Mucociliary clearance and epithelial permeability as biomarkers
Evidence for the effectiveness of a drug requires good biomarkers which are able to demonstrate the influence of the treatment. Mucociliary clearance (MCC) and epithelial permeability are affected in several lung diseases and are therefore potential biomarkers. Measurements of MCC, however, have yielded conflicting results in different centers and have wide intersubject variability. 10 Currently, SPECT has only been used to a very limited extent for this purpose, but SPECT measurements of clearance and permeability have the potential to provide more accurate measurement of these parameters, and this is an area for future development.
Future Developments
SPECT provides unique information on regional deposition of inhaled aerosol and its clearance. However, it is currently not widely used for aerosol deposition measurement, and its application to assessing clearance has been even more limited. There is clearly potential for wider application, as there are few alternative methods. The 3D data from SPECT provides better information on deposition than planar imaging, while PET imaging presents greater technical challenges. However, PET has clear advantages; it offers better resolution images than SPECT and also a wider range of radionuclides. SPECT is restricted to Tc-99m, which cannot be used to directly label drugs, whereas PET uses radionuclides such as F-18 and C-11 which can be incorporated into drug molecules. 8 For clearance studies, however, the longer half-life of Tc-99m means that measurements over a longer period are possible. Magnetic resonance imaging is beginning to be used for aerosol deposition measurement but is being mainly carried out in animal models at present 50 and is some way from competing with radionuclide methods. 51
Aerosol deposition
There are a number of areas where developments are required to improve both the methodology of using SPECT in aerosol deposition measurements and its applications.
Tc-99m radiolabels of portable inhalers tend to rapidly pass through the epithelium, limiting the time available for imaging and therefore image quality, so new methods are required to provide radiolabels that remain longer in the lungs. In the acquisition of SPECT data, respiratory gating to capture the lungs during various phases of the respiratory cycle will reduce blurring due to motion. This technology is moving from the preserve of research laboratories into the clinical setting and should be standard within the next few years. This should give sharper images that are more accurately quantifiable but will require longer acquisition times.
Further work needs to be done to improve the analysis of SPECT data. This includes developments in spatial models of the airways and conversion of spatial data to deposition per segment and airway generation. Further investigation of the value of measures of deposition variability such as coefficient of variation and skew should also be fruitful. In addition, more work is required on validating all aspects of 3D analysis of aerosol deposition.
SPECT has application in measuring regional deposition of aerosol, and this will be of value in optimizing inhalation treatment regimes. More studies are required to establish the links between clinical effectiveness of drug and the regional deposition pattern in the lung for different diseases and between inhaler in vitro performance, in vivo deposition and clinical outcome. SPECT imaging is also providing valuable data for validating and developing aerosol deposition modeling and further work in this area is indicated.
Mucociliary clearance
Current methods of measuring MCC from imaging rely on measuring the rate at which the amount of aerosol in a region of interest reduces with time. The result is usually presented as the percentage cleared per unit time. The process of MCC describes the movement of aerosol particles along airways, with the rate being measured as a speed (mm/s). This means that the conventional imaging measurements of clearance are really only indices of the actual mucociliary movement. Three-dimensional radionuclide imaging (SPECT and PET), particularly used in combination with aligned anatomical imaging, has the potential to be able to make more accurate measurements of the change of distribution within the lung over time. By combining this improved spatial data with mathematical modeling, it might be possible to estimate mucociliary speeds. The mathematical model would have to describe variation of concentration of aerosol in different spatial regions of the lung with time C i (t) as a function, F, of the mucociliary speeds in different generations:
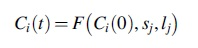
where sj and lj are the mucociliary speed and length of each generation, j.
This equation provides the potential of estimating the mucociliary speed in each generation. A useful definition of the different regions of the lung might be the three-dimensional shell approach described above. 22 This divides the lung into volumes on the basis of their position from the center to periphery of the lung and may therefore be well suited to describe mucociliary movement, which occurs essentially in a radial direction from the periphery towards the hilum of the lung.
SUMMARY
SPECT imaging provides three-dimensional images of the distribution of inhaled aerosol labeled with a gamma emitting radionuclide.
SPECT may be used to study both the initial deposition sites of an aerosol and its clearance.
SPECT is more complex to use than planar imaging but provides better information on regional deposition and has application in studies where this is the endpoint.
SPECT is easier to use than PET but has some disadvantages, particularly in the inability to directly label aerosols in portable inhalers with technetium-99m, the most commonly used radionuclide.
SPECT has a role in assessing the influence of regional deposition pattern on the clinical effectiveness of inhaled therapy.
When combined with high resolution computed tomography, SPECT provides excellent information on deposition pattern in relation to lung anatomy and is useful in validating computer models of aerosol deposition.
Future work should particularly be aimed at: (1) improving analysis techniques to enhance the interpretation of the wealth of data available from three-dimensional images of aerosol related to anatomy and (2) on its use for mucociliary clearance measurement, where it should provide considerably improved accuracy compared to existing planar methods.
Footnotes
Acknowledgments
The author would like to acknowledge the support of Professor Joy Conway and the other members of the Southampton Respiratory Imaging Group of the National Institute of Health Research Biomedical Research Unit in Respiratory Disease, Southampton, UK. He is also indebted to Air Liquide Santé International and AstraZeneca, who have financially supported his work in this area.
Author Disclosure Statement
The author was employed by the National Institute of Health Research, Biomedical Research Unit in Respiratory Disease, Southampton, and also acted as a consultant for Air Liquide Santé International. His work in the field has also been supported by AstraZeneca.