




Abstract
Background:
Understanding the geometries of the human upper airway and their impact on drug particle transport is important. This study investigates the impact of inhaler mouthpiece size on extrathoracic airway geometry across a diverse body mass index (BMI) range.
Methods and Materials:
Magnetic resonance imaging (MRI) was performed on 28 participants. Subjects were asked to bite on replicas of inhaler mouthpieces with incisal openings of 13.5 mm and 27 mm, and the effects of mouthpiece size on upper airway geometry were analysed.
Results:
Mouthpiece size affects the oral space, and the results show a significant linear correlation between oral space and BMI, with a reduction in the cross-sectional area (CSA) between the soft palate and the tongue of approximately 0.08 cm2 per BMI unit increase. This trend contrasts with an increase in anterior-posterior (AP) length across three other pharyngeal regions of interest, with the largest increase observed in the oropharynx, where AP length increased by approximately 0.042 cm/(kg·m2). While the impact of device size was significant in the oral space across all participants, its effect in the oropharynx was significant only in the high BMI cohort. This group exhibited an expansion in the oropharynx when using the larger mouthpiece compared to the smaller one.
Conclusion:
These findings may have implications for inhaler design and prescription. The knowledge presented has the potential to improve inhaler efficacy in high BMI populations when accounting for mouthpiece size.
Introduction
Chronic respiratory diseases (CRD) have a significant global impact on human health. In 2017, it was reported that CRD affected 545 million people, with 62 million incident cases. 1 The understanding of the relationship between body mass index (BMI) and CRD, particularly asthma, is growing, with obesity being linked as a risk factor for asthma development and being further associated with poor asthma control. 2 Understanding the effects of high BMI and their potential implications on treating and managing respiratory diseases is important given the high prevalence of obesity, with two billion people worldwide being either obese or overweight, with these numbers only slated to increase. 3
The prevalence of respiratory diseases necessitates effective treatment and disease management. Metered-dose inhalers (MDI) and dry powder inhalers (DPI) are widely used to manage chronic obstructive pulmonary disease (COPD) and asthma, delivering drug doses to the lower airways through device actuation and voluntary inhalation, respectively. Despite the availability of over 40 types of DPI on the market, 4 the effectiveness of many of these devices depends on the dispersion of active ingredients bound to lactose carriers into fine particles. 5 Conversely, MDIs require good hand-breath coordination and utilize propellants, most of which are environmentally detrimental and progressively banned. The effectiveness of respiratory drug inhalers and formulations in delivering fine particles to the lower airways is commonly validated using cascade impactors (CI), which segregate particles based on their aerodynamic particle size diameter (APSD). However, CIs were not designed to mimic the lower airways, and they have significant differences in airflow dynamics compared with the respiratory tract.6,7
A typical CI system includes an induction port, such as the European Pharmacopoeia (Ph. Eur.)/United States Pharmacopeia (USP) throat model, which rudimentarily represents the human pharynx. More advanced models such as the “Alberta” idealized adult throat offer more physiologically realistic anatomical features and better in vivo particle deposition matching.8–11 The use of these models is crucial for understanding how drug particles behave as they pass through the upper airways, directly impacting the effectiveness of inhalers in delivering medication to the lower airways. Deposition studies using CIs have shown that particle deposition in physiologically realistic upper airway geometries is higher when compared with the standardized USP throat model. 12 However, the impact that different anatomical features have on aerosol delivery is still not fully understood.
While properties that affect the effectiveness of inhalers, such as their internal design and resistance, have been fairly well studied, less is known about their interaction and influence on the tongue and pharynx geometry. Pritchard and McRobie 13 utilized MRI to demonstrate the effects of inhaler size and resistance on upper airway geometry for a broad demographic, but delineating the implication of the above on subject subpopulation based on their physiological features (e.g., BMI) was not part of the study design. Their study demonstrates that the size of the inhaler device had a significant impact on the oral cavity space, in which an increase in the cross-sectional size of the mouthpiece increased the oral cavity volume. The study showed that device size elicited variable reactions among participants in the oropharynx regions, and this airway section could expand, contract, or not respond. What is unclear, though, is whether these reactions of the pharynx geometry could be limited to a subpopulation. Other studies have stipulated that mouthpiece size is likely to affect tongue position, and the potential effects of tongue position on oropharyngeal drug deposition have been studied by Kondo et al. 14 The series of works show that tongue position at the oral cavity affects the cross-sectional area (CSA) along the oropharynx in both healthy and asthma subjects and infers their potential impact on the transportation of drug particles across the pharynx. A recent computational study from Cai et al. 11 demonstrated that mouthpiece size changes humans’ oropharyngeal geometry, which could subsequently produce different particle deposition profiles along the human pharynx. The main findings of their study showed that a larger mouthpiece size, when combined with a low peak flow rate, was associated with higher deposition in the pharynx region, of up to 80% when compared with the smaller mouthpiece size. This was further emphasized at higher flow rates, with the larger mouthpiece resulting in higher deposition rates through the oral cavity.
Cheng et al. 15 used MRI to measure the CSA of the upper airway near the soft palate in a fairly wide population of healthy subjects (n = 52) across a broad age group (22–68 years old) and showed that an increase in a unit of BMI is equivalent to a narrowing of the airway by ∼5 mm2 based on a linear regression model. Another study has also linked other geometrical changes in the extrathoracic airway to weight gain by demonstrating that significant fat infiltration in the tongue could cause the hyoid to move downward and lengthen the airway in patients. 16 Indeed, existing studies have generally determined a strong correlation between tongue volume and BMI, with higher BMI being associated with higher fat infiltration in the muscle and BMI appearing to be a strong predictor for tongue volume.17–19 A few recent studies20,21 proposed that the ratio of tongue volume to oral cavity volume is negatively correlated to the oropharyngeal volume. According to the studies, the tongue is likely to move posteriorly to decrease oropharyngeal space downstream of the oral cavity when the limited and confined space in the oral cavity fails to accommodate the increase in tongue volume from higher fat depositions.20,21 It is unclear how these observations may change with inhaler mouthpiece sizes, specifically whether this differs between low and high BMI individuals.
Detailed descriptions of how inhaler device size affects upper airway dimensions remain scarce, especially in the context of BMI, despite its high interrelation with the diseases. With the understanding that tongue position is affected by inhaler mouthpiece size, tongue volume is affected by BMI, and both tongue volume and position affect the volume of the oral cavity and oropharynx, this study aims to investigate the interplay between mouthpiece size, the individual’s BMI and the geometry of their airways. This is achieved through a MRI campaign which provides relevant anatomical geometrical information for future modeling studies and inhaler designs, potentially allowing a more individualized approach to inhaler prescription, which could lead to an improvement in poor asthma or COPD control and management.
Materials and Methods
Thirty participants were initially recruited via local poster advertisements—their biomarkers can be seen in Table 1; two of these participants were subsequently withdrawn from the study due to an inability to adhere to the breathing protocols. All participants had no history of respiratory illness and were nonsmokers. The Macquarie University Human Research Ethics Committee approved the study, conducted according to the Declaration of Helsinki, and all participants provided written consent.
Participant Biomarker Data
BMI, body mass index.
Experimental protocol
Participants used two commercially available low-resistance oral inhaler device replicas (see Fig. 1), Device A (13.5 mm incisal opening, elliptical) and Device B (27 mm incisal opening, cylindrical). Participants were trained to use the devices correctly and maintain consistent tidal oral breathing. Devices were inserted 3 cm past the participant lips, perpendicular to the mouth, with their tongue rested against the base of the lower teeth.
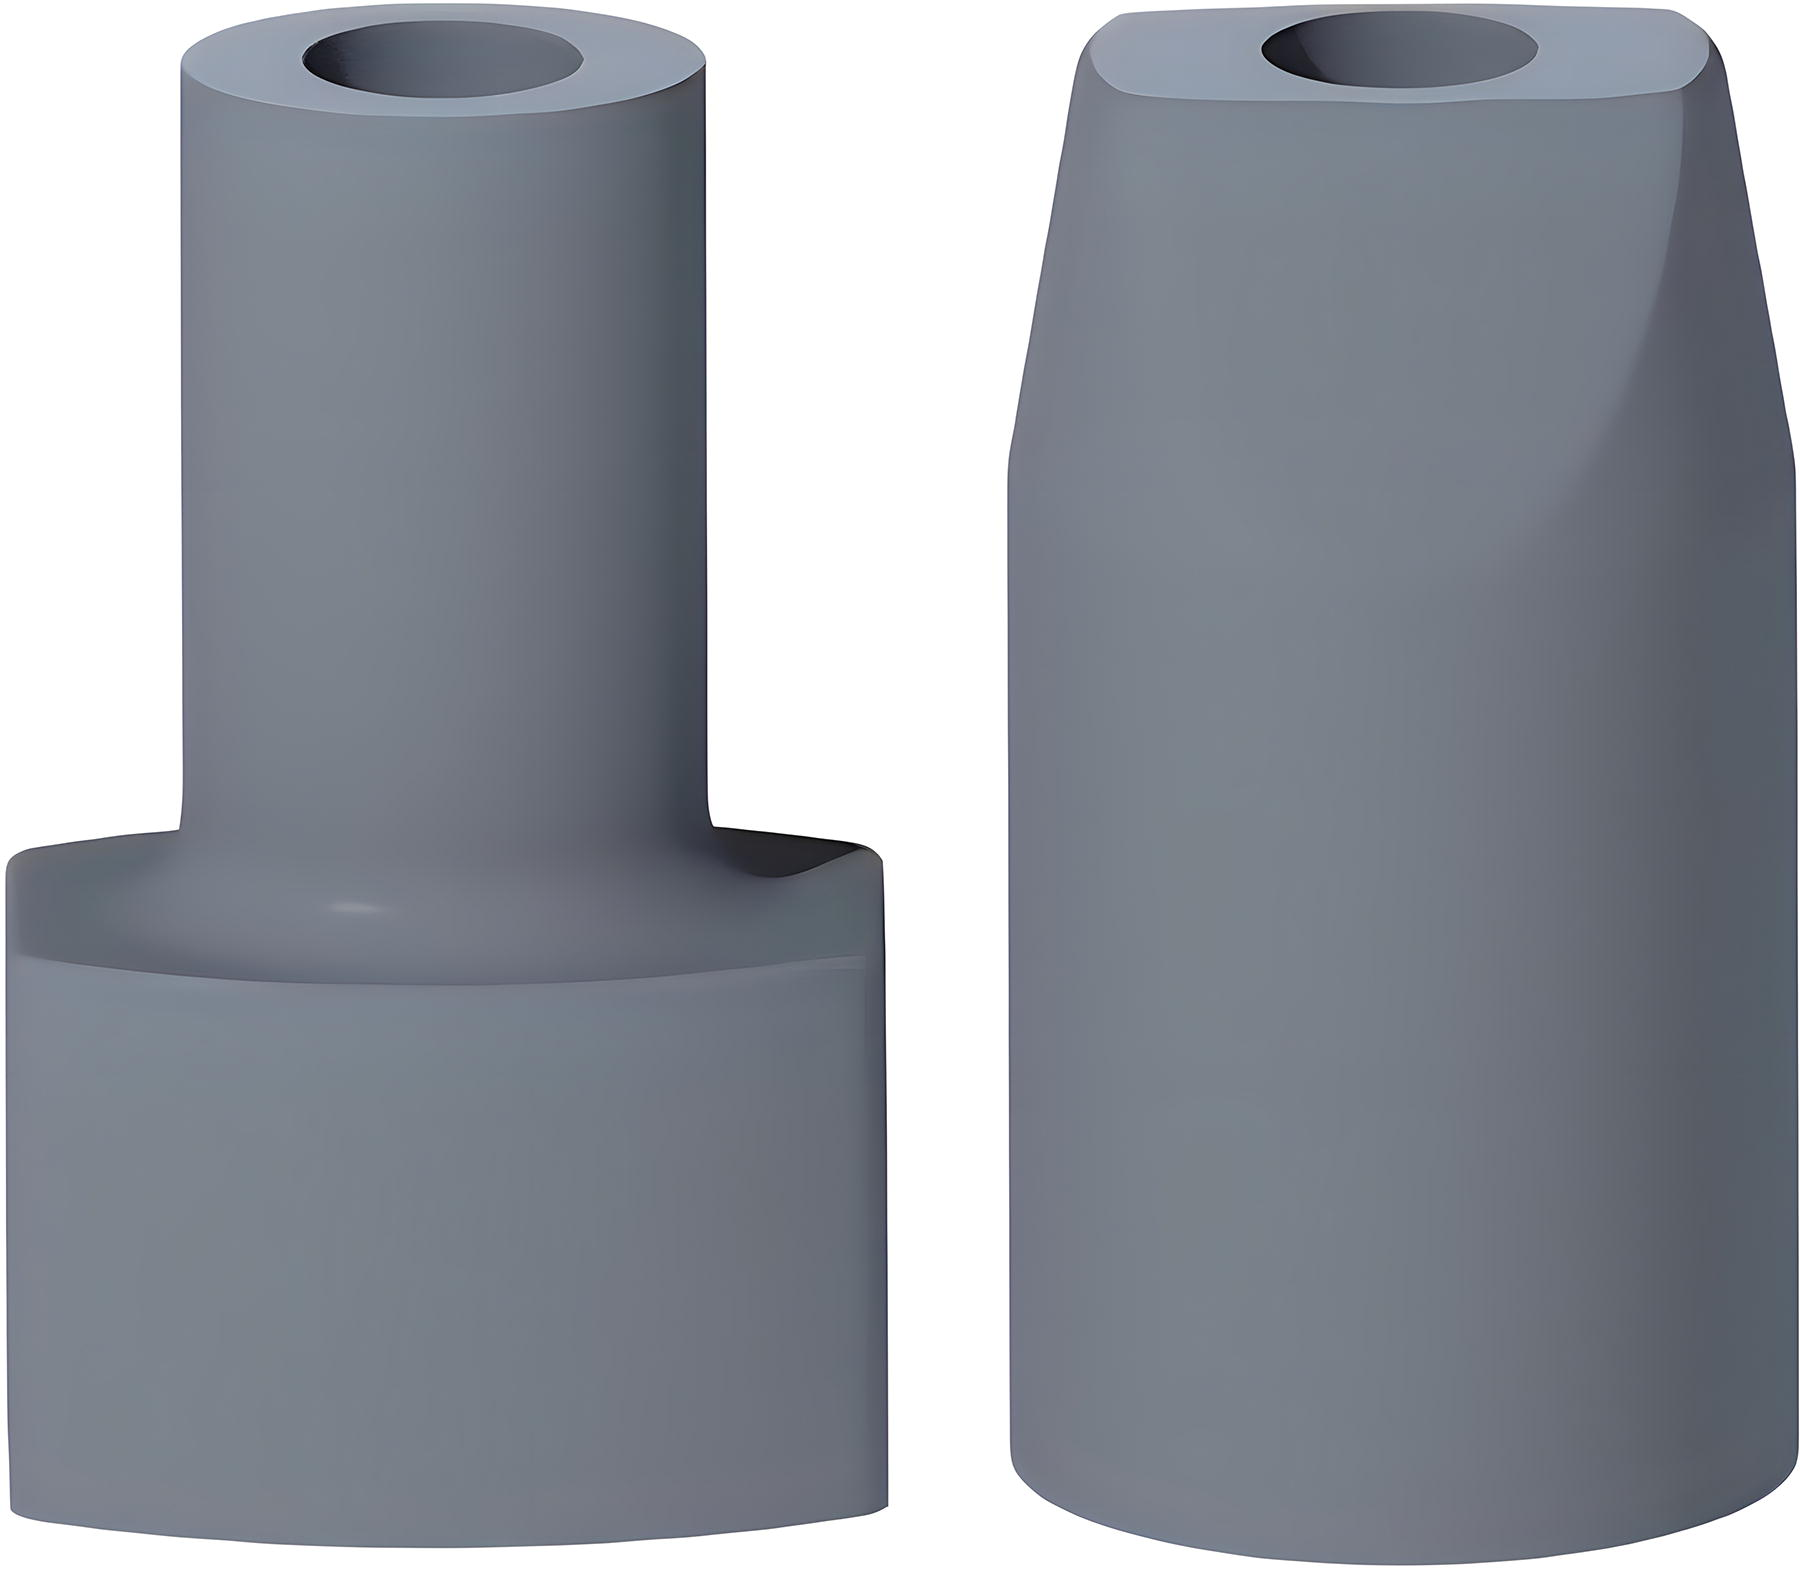
Inhaler mouthpiece replicas (rendered image). Device A (left) was formed of an elliptical cross-sectioned mouthpiece with a cross-sectional area (CSA) of 190·85 mm2, comprising a width of 18 mm and a height of 13·5 mm, which represented the incisal opening. Device B (right): a cylindrical tube tapering down to an ellipse; the tube had an CSA of 69.39 mm2 and a diameter of 26.97 mm, representing the incisal opening; the ellipse-like tip presented an area of 238.87 mm2, which was situated posteriorly to the teeth upon insertion.
Scan protocol
Scans were performed using a Siemens 3T MRI scanner with participants supine and heads braced. Key parameters included; a 256 mm field of view, 256 × 256 matrix (1 mm × 1 mm pixel size), 6.8 ms repetition time, 3 ms echo time, 144 × 108 scan resolution, and 1 mm slice thickness. Mouthpieces were swapped between scans without head movement. Participants were reminded to adhere to breathing instructions. Each participant underwent three scans (two with an inhaler and one without).
Regions of interest (measurements and locations)
Measurements were taken using Radiant DICOM viewing software to analyze the volumetric MRI anatomical scans. Each region of interest (ROI) was reoriented to ensure measurements were perpendicular to the upper airways’ flow path, with three measurements taken at each ROI for both devices.
Six ROIs were identified for analysis, and their anatomical regions and identifiers are listed below (see Fig. 2):

Region of interest locations. Inset: Region of interest 4 (ROI 4) image, with X and Y measurement axis.
Measurements at these ROIs included (see Fig. 2: inset ROI cross-section):
Statistical analysis
IBM SPSS Statistics 22 was used for linear regression and two-tailed t-tests. Participant data were split into low BMI (<25 kg/m2) and high BMI (>25 kg/m2) cohorts. Significance was set at p < 0.05.
Results
Airway dimensions related to BMI (regression)
CSA measurements and their characteristic X and Y measurements were analyzed across six ROIs from the oral cavity to the larynx. The following section discusses findings shown in Table 2 and Figure 3 for CSA findings and Table 3 and Figure 4 for the X and Y measurement related findings; the ROIs and measurements referred to are depicted in Figure 2. Through ROI 1, occurring in the retro palatal region, both devices A and B showed a decrease in CSA with increasing BMI, with slopes of −0.041 cm2/(kg·m2) and −0.049 cm2/(kg·m2), respectively, though these were not statistically significant. Device A showed a significant decrease in relation to BMI for the available width (X measurement) through the oral cavity of −0.04 cm/(kg·m2) This indicates a trend where higher BMI correlates with a smaller retropalatal airway region.
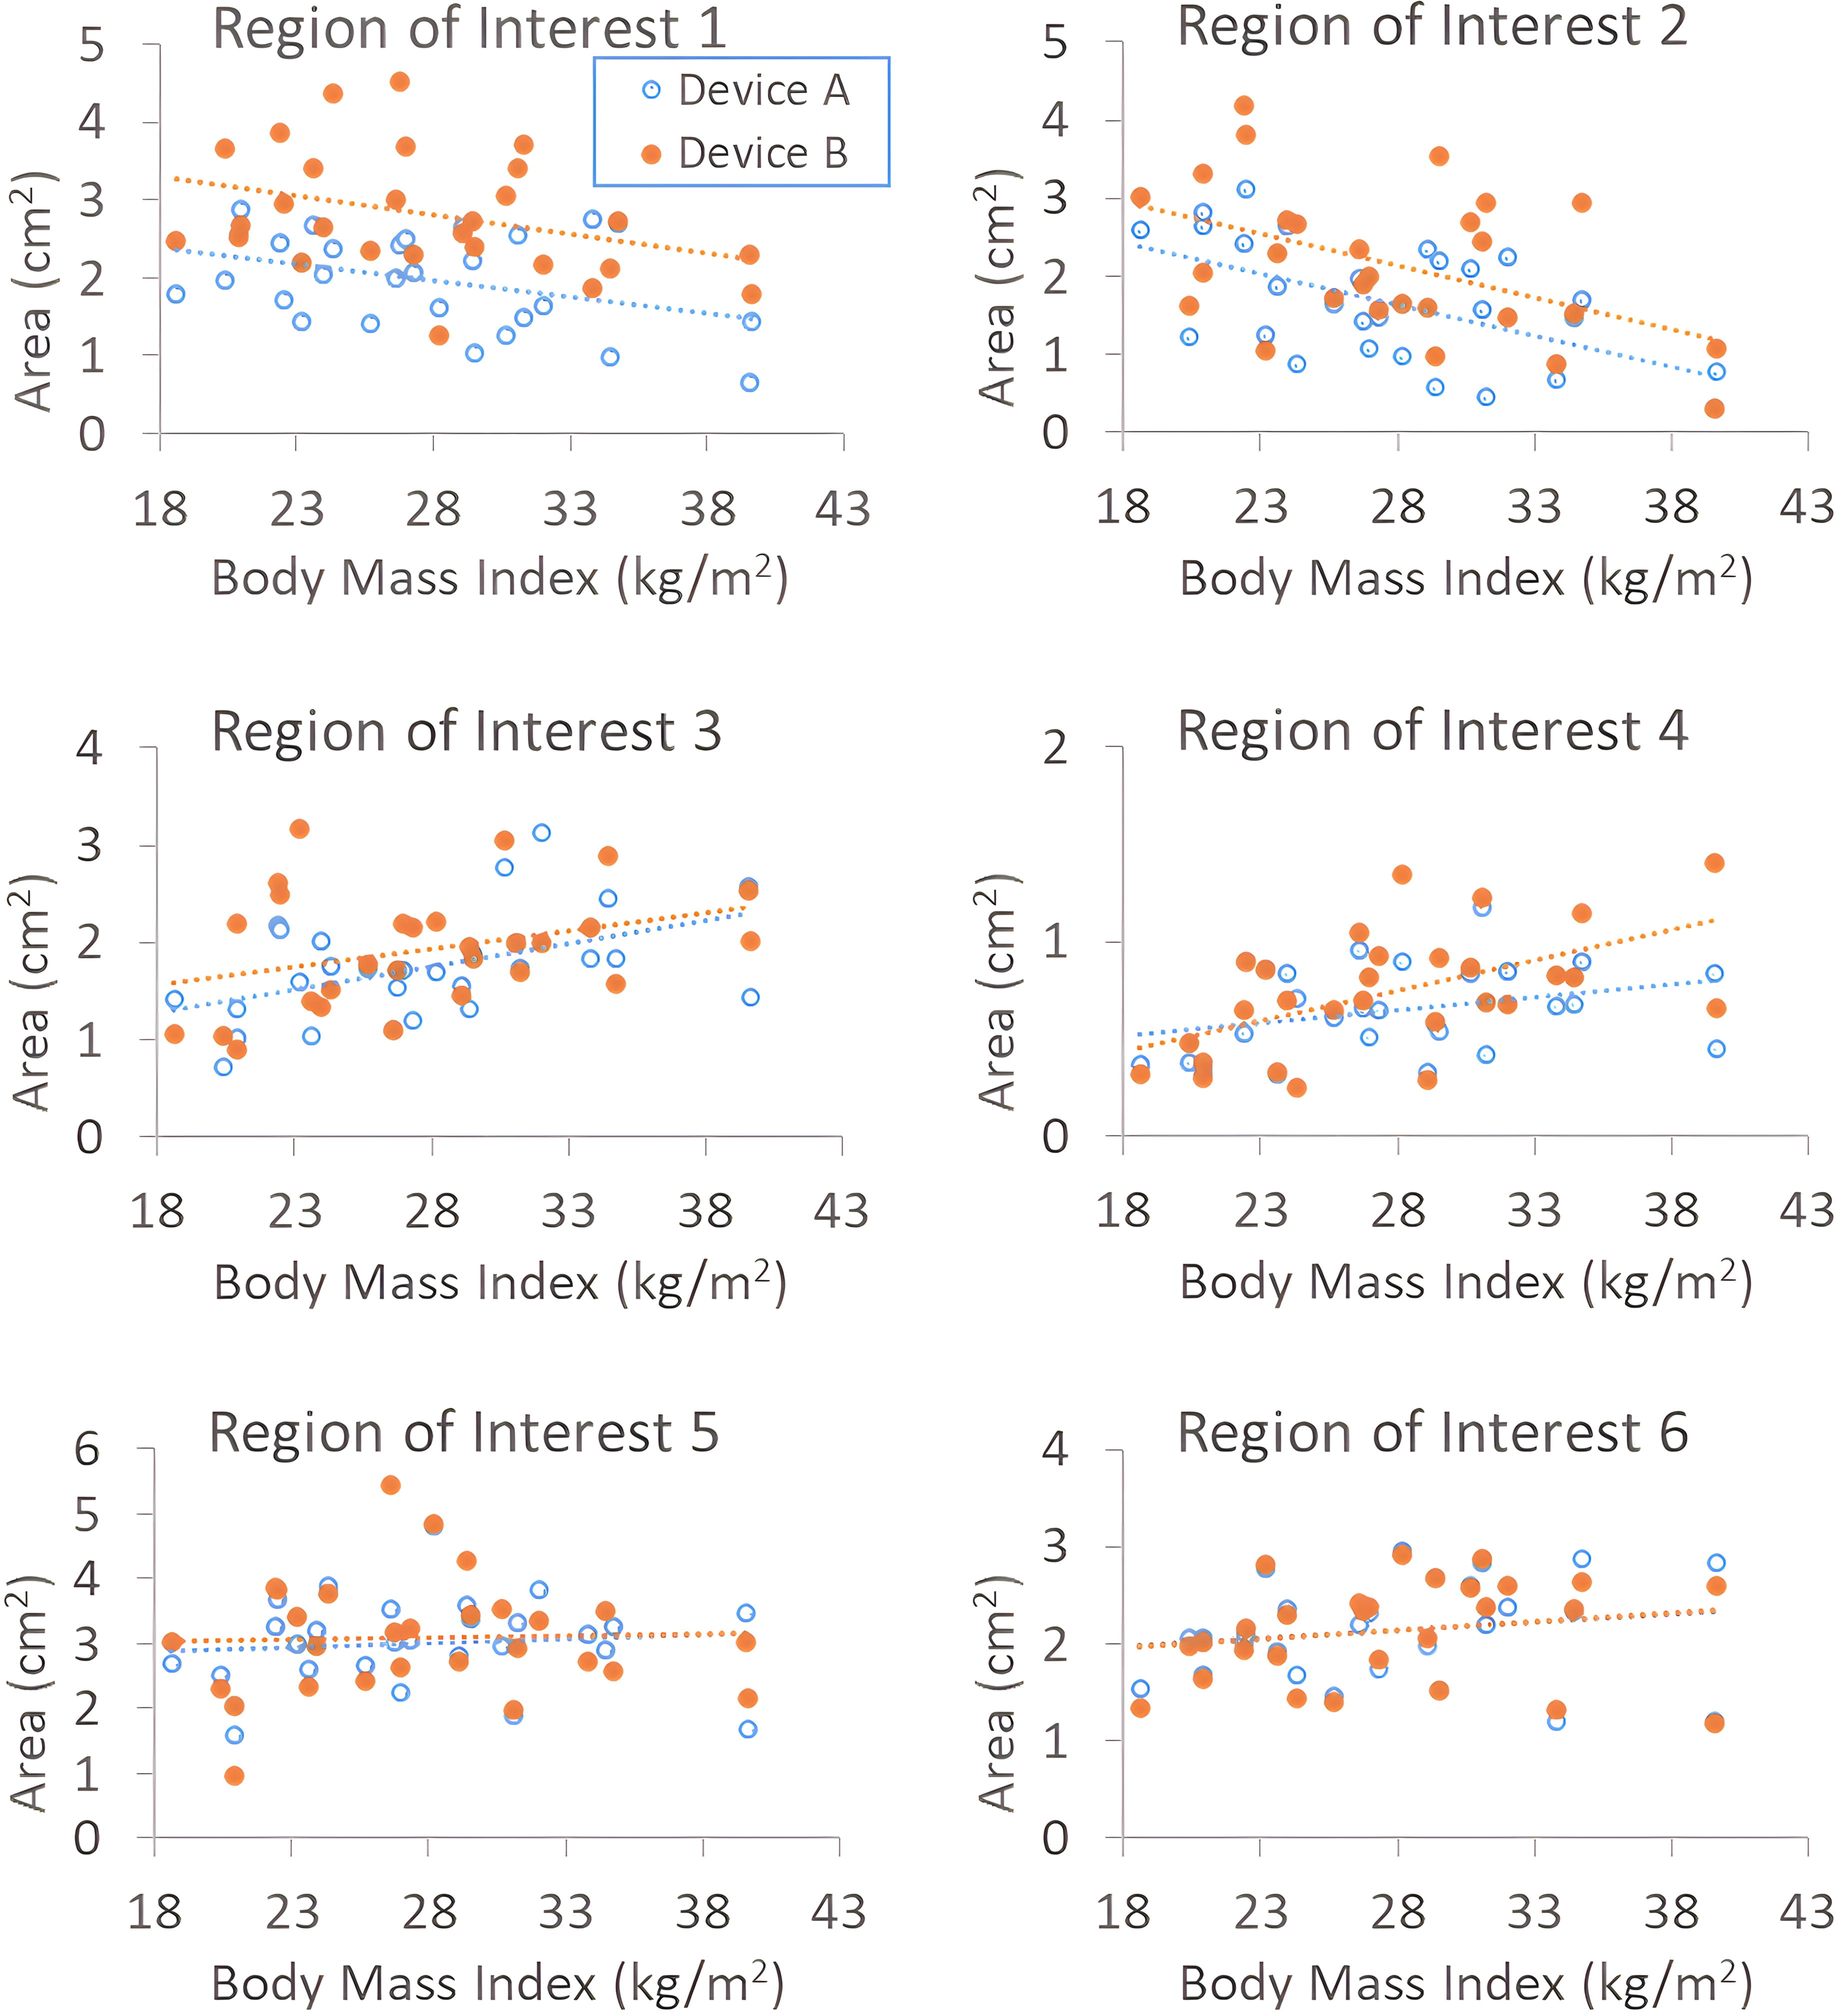
Cross-sectional area (cm2) versus body mass index (kg/m2) for all subjects. ROI 1: Transition from hard to soft palate, located at the tip of the posterior nasal spine in the palatine bone. ROI 2: Between tongue and soft palate, defined by the mental spine (posteriorly along the mandible) to the clivus (upper spine bone). ROI 3: Midway between the epiglottis tip and soft palate, bounded by the posterior pharyngeal wall and the tongue. ROI 4: At the epiglottis tip where it contacts the posterior pharyngeal wall, with the anterior border defined by the posterior surface of the epiglottis. ROI 5: Along the hypopharynx, two-thirds of the way down its length from the epiglottis tip to its end. ROI 6: In the larynx, 2 cm downstream from the vocal cords before transitioning to the trachea.
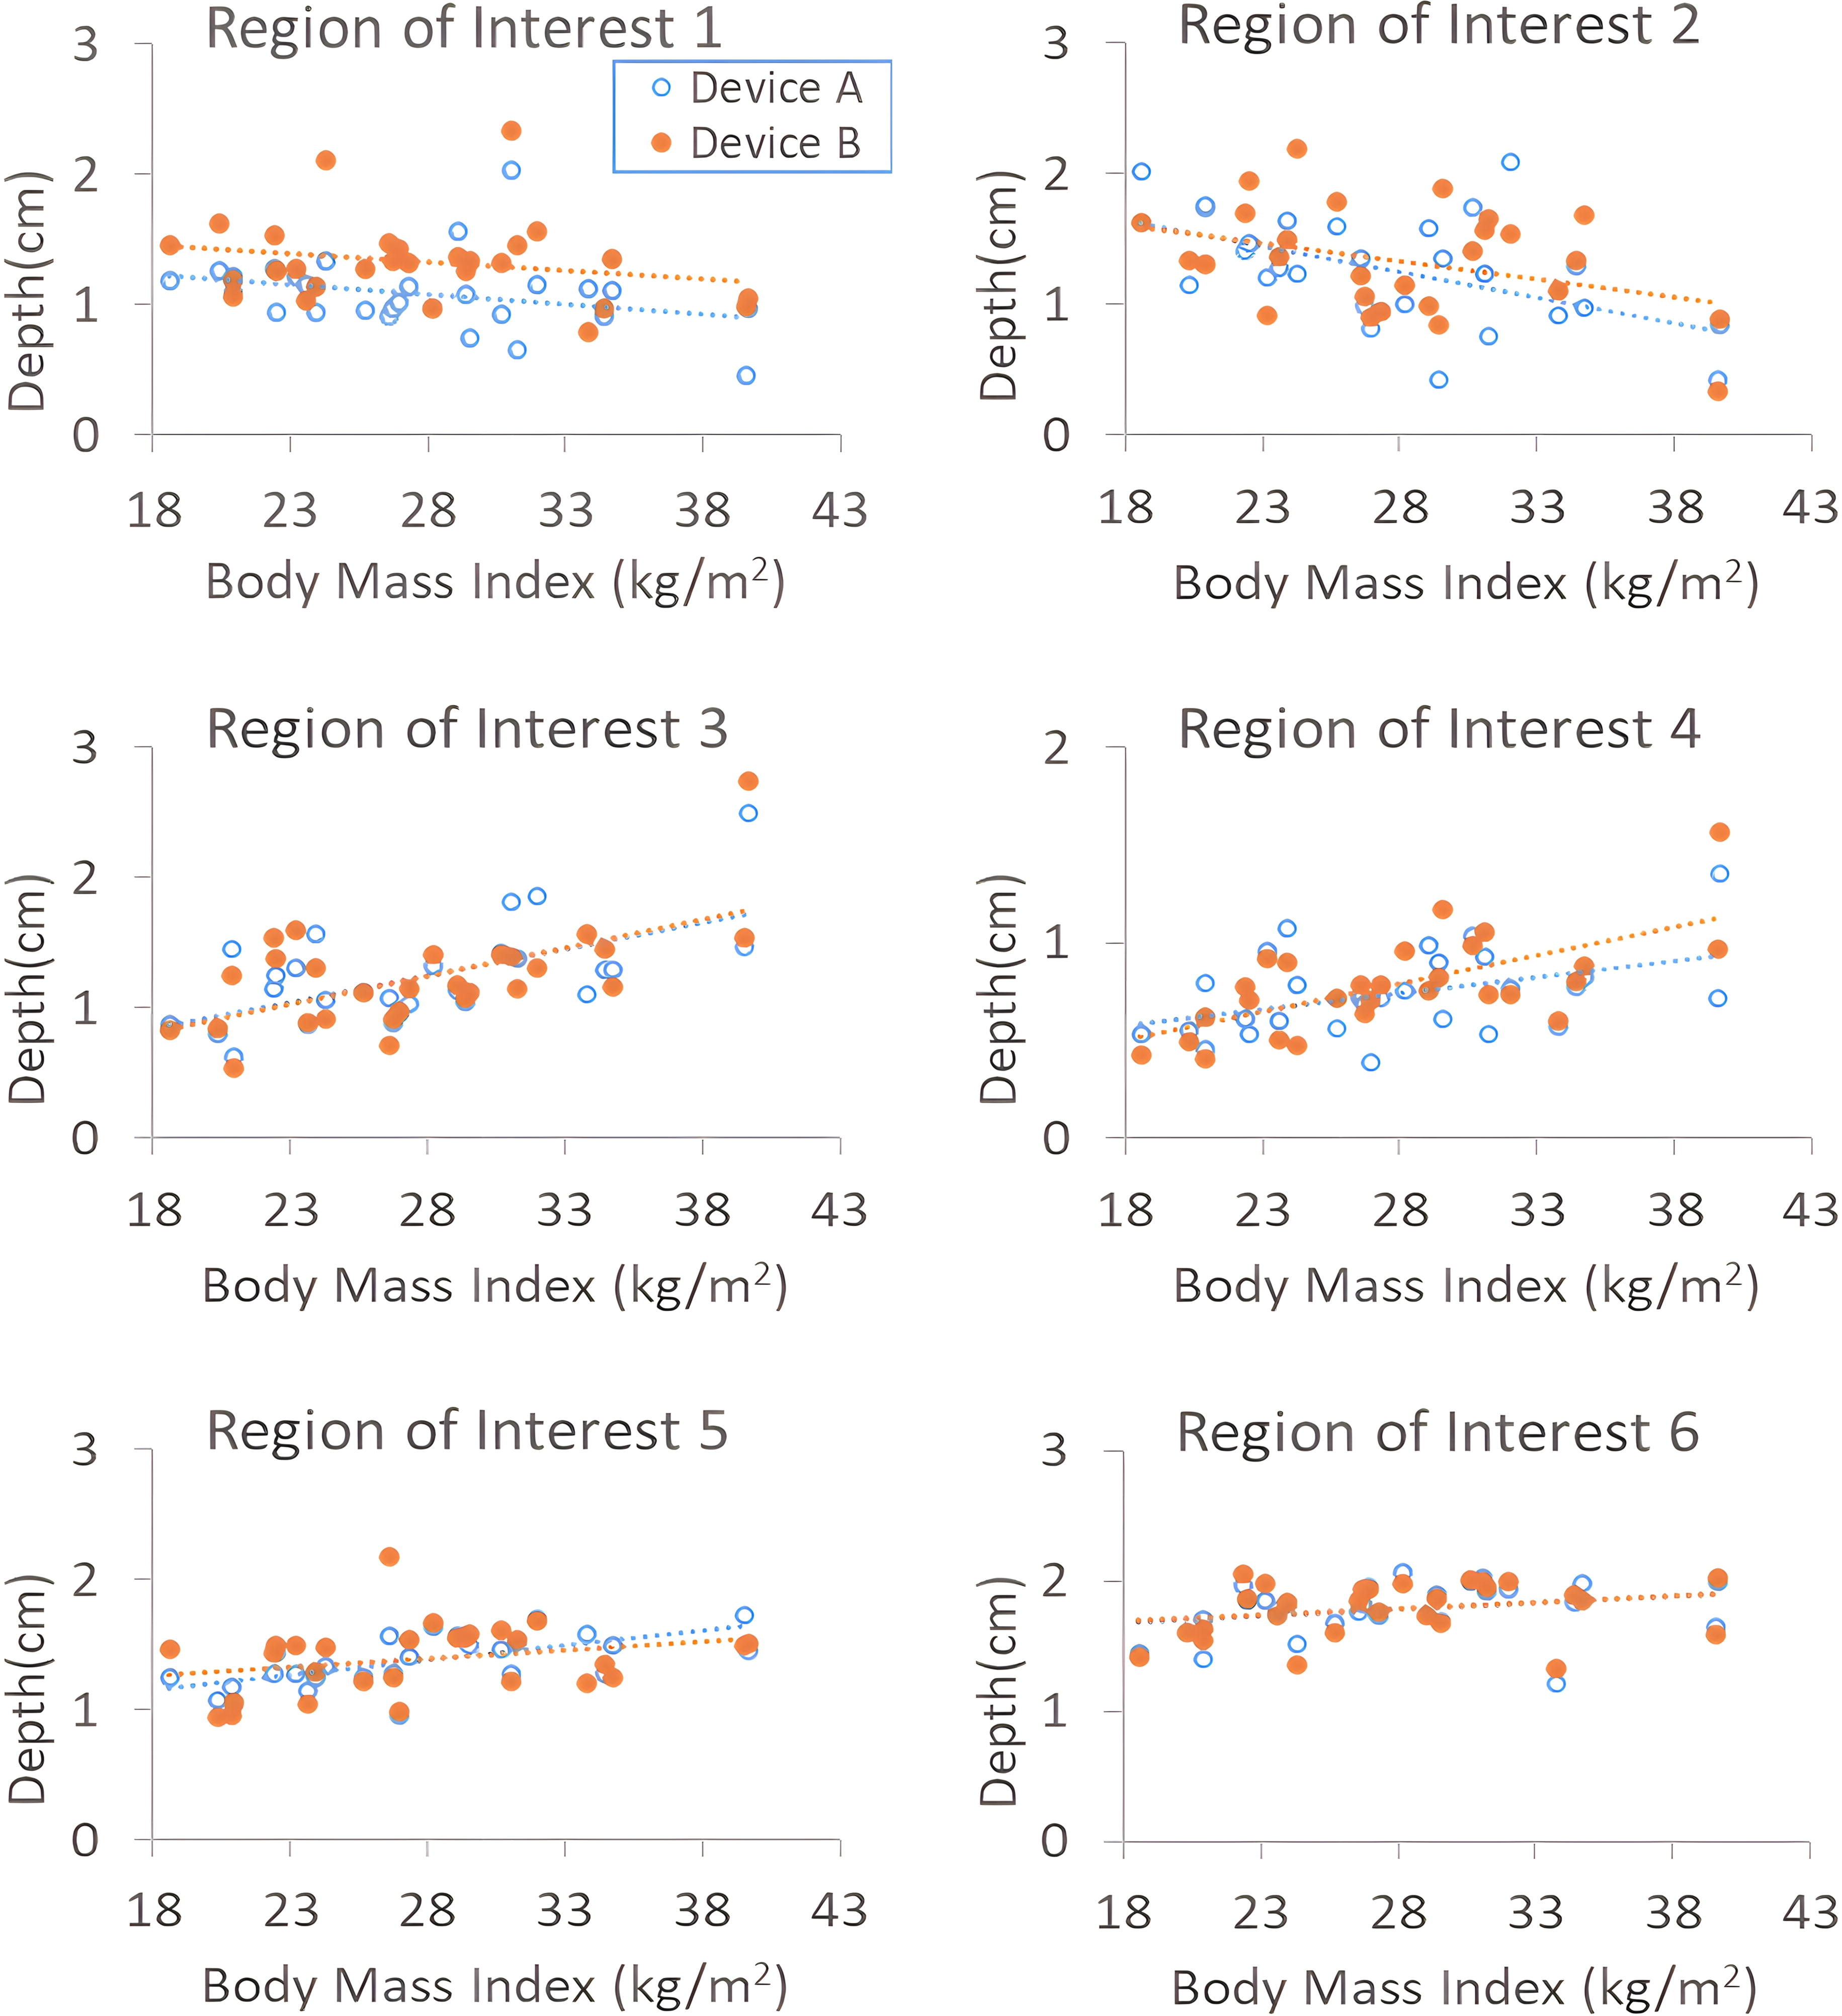
Scatterplots of Y measurement (depth) (cm) versus body mass index (kg/m2) for each ROI. ROI 1: Transition from hard to soft palate, located at the tip of the posterior nasal spine in the palatine bone. ROI 2: Between tongue and soft palate, defined by the mental spine (posteriorly along the mandible) to the clivus (upper spine bone). ROI 3: Midway between the epiglottis tip and soft palate, bounded by the posterior pharyngeal wall and the tongue. ROI 4: At the epiglottis tip where it contacts the posterior pharyngeal wall, with the anterior border defined by the posterior surface of the epiglottis. ROI 5: Along the hypopharynx, two-thirds of the way down its length from the epiglottis tip to its end. ROI 6: In the larynx, 2 cm downstream from the vocal cords before transitioning to the trachea.
(Left): Data Processed from Figure 3 Giving Cross-Sectional Area Measurements for Each Region of Interest Relative to the Measurement Plane, as Well as Regression Slope Versus Body Mass Index (kg/m2)
p < 0.05.
p < 0.005.
SD, standard deviation.
This is then linearly regressed against body mass index (kg/m2) giving a slope in units [cm/(kg.m2)].
p < 0.05.
p < 0.005.
p < 0.001.
ROI, region of interest.
In ROI 2, through the velopharynx, significant negative correlations were observed between BMI and CSA for both devices [Device A: −0.079 cm2/(kg·m2), p = 0.0018; Device B: −0.082 cm2/(kg·m2), p = 0.0099], indicating a reduction in airway space as BMI increases. This was further reinforced by the significance of the reduction in the X and Y measurements, with Device A having a significant reduction of −0.039 cm/(kg·m2) in the y direction and a significant reduction in the lateral dimension for both devices [Device A: −0.066 cm/(kg·m2), p = 0.002; Device B: −0.06 cm/(kg·m2), p = 0.0031]. This was the only region that had significance for the x measurements in relation to BMI. This is critical as it suggests that the velopharyngeal space becomes more constricted in individuals with higher BMI.
Through the oropharynx at ROI 3, CSA increased with BMI for both devices, with Device A showing a significant positive slope of 0.047 cm2/(kg·m2) (p < 0.05). There was further significance for both devices’ Y measurements [Device A: 0.041 cm/(kg·m2), p < 0.005; Device B: −0.044 cm/(kg·m2), p < 0.005]. This suggests that the oropharyngeal airway compensates for the narrowing observed in the retropalatal area by expanding as BMI increases by expanding in the anterior-posterior (AP) direction.
At ROI 4, defined by the epiglottis tip, and its contraction of the airways, Device B’s CSA showed a significant positive correlation with a slope of 0.031 cm2/(kg·m2) (p < 0.005), suggesting an increase in airway space with BMI. This was further reinforced by significance in the increase of both devices’ Y measurements [Device A: 0.016 cm/(kg·m2), p < 0.05; Device B: 0.029 cm/(kg·m2), p < 0.0005). This shows similar trends to ROI 3 where the change in dimensions is significant in the AP dimension.
ROI 5 showed no significance between CSA and BMI; however, Device A showed a significant increase in the AP direction [Device A: 0.023 cm/(kg·m2) with p < 0.0005]. Device B failed to show significance in this region, suggesting that the AP change is predictable with BMI changes and linked to the device size used, however the overall size of the airway is not significantly affected in relation to BMI.
No significant trends were observed with BMI for either device in the larynx (ROI 6). This lack of significant findings suggests that the lower airway regions may be less affected by BMI or that the compensatory mechanisms in the upper airway are sufficient to maintain airflow.
Device impact
Significant differences were observed in airway dimensions between the two devices, particularly in high BMI participants; this did not extend through every ROI; however, when the high BMI population was isolated, trends emerged that were not present for the low BMI or full population cohorts, suggesting that there are impacts that are only present within the higher BMI population. These results are depicted in Table 4. Figure 2 shows the reference regions of interest and their component measurements.
t-Test Comparison Between Device Data for the Cross-Sectional Area, X and Y Measurements of the Full Population, Low Body Mass Index Cohort (<25 kg/m2), and High Body Mass Index Cohort (>25 kg/m2)
p < 0.05.
p < 0.005.
p < 0.001.
CSA, cross-sectional area.
For ROI 1, Device B was significantly larger than Device A in the full population for all component measurements (CSA: 42%, p < 0.0005; X: 22%, p < 0.0005; Y: 22%, p < 0.0005), likely due to the larger incisal opening expanding the airway. This indicates that mouthpiece size can significantly impact the airway space at the retropalatal area, which correlates with Pritchard and McRobbie’s work. When the low BMI and high BMI demographics were isolated, there was again a significant increase in CSA for all measurements. Indicating that regardless of BMI, mouthpiece size strongly effects this region.
ROI 2 showed a significant difference in the lateral direction and CSA with Device B experiencing a mean increase of 19% (p < 0.0005) and 30% (p < 0.005) respectively. This relationship was also present in the high BMI cohort (p < 0.0005, measurement x, p < 0.05, CSA) but not for the low BMI demographic, suggesting that the impact of device size that is isolated to high BMI individuals begins through the oral cavity.
ROI 3 presented the last significant X measurement for the full population, an increase of 14% when using Device B, p = 0.0042. this relationship was also present in the high BMI cohort (p = 0.0081) but not the low BMI cohort, further emphasizing the impact of device size on higher BMI individuals.
Through ROI 4, occurring at the epiglottis tip, both the full population and the high BMI cohort demonstrated a significant increase in CSA when using Device B, with a mean CSA increase of ∼14% (p = 0.021) for the full cohort and 24% for the high BMI cohort (p = 0.0012). There was an additional significance increase of the AP dimensions for the high BMI cohort of 13%, p = 0.027. This suggests a substantial effect of mouthpiece size on airway geometry on high BMI individuals alone. There was no significance for the full cohort or low BMI cohort.
Discussion
This study explored the impact of inhaler mouthpiece size on airway geometries in individuals with varying BMI, revealing significant findings and several limitations. The investigation demonstrated that increased BMI potentially correlates with compensatory mechanisms within the upper airways. Specifically, as BMI increases, the available CSA between the tongue and soft palate decreases, whereas the CSA in the oropharynx to the epiglottis tip increases. This compensatory mechanism indicates that larger mouthpieces notably affect the oropharyngeal geometries of individuals with higher BMI, particularly at the epiglottis opening, a trend not observed in the low BMI cohort.
Previous studies have highlighted the impact of mouthpiece size on airway geometry but lacked focus on subpopulations such as those with high BMI. 13 Our findings extend this understanding, demonstrating that a larger mouthpiece increases the volume of the oral cavity more significantly in individuals with higher BMI. This observation aligns with and extends the work of Pritchard and McRobbie, 13 confirming that a larger mouthpiece increases the volume of the oral cavity and impacts airway geometries more in higher BMI individuals.
The findings of this study have significant implications for the usage of existing throat models in validating inhaler performance. Current models such as the Ph. Eur./USP throat and the “Alberta” idealized adult throat have demonstrated better in vivo particle deposition matching due to their realistic anatomical features. However, our study suggests that the compensatory mechanisms in the upper airways, particularly in high BMI individuals, can significantly alter airway geometries, which these models may not fully account for. This highlights the need for more dynamic and adaptable throat models that can simulate the varying anatomical and physiological conditions of diverse populations. Incorporating such variability into throat models could enhance the accuracy of APSD measurements and better predict the efficacy of inhalers in delivering drugs to the lower airways. Future research should focus on developing throat models that can replicate these dynamic changes, thereby improving the validation process of respiratory drug delivery systems and ensuring more effective treatment for patients with different BMI profiles.
Some insights as to how mouthpiece size could affect particle transport behavior can be observed in a recent computational modeling study. 11 In that study, computational fluid dynamics was utilized to investigate the expansion in the oral cavity in relation to a larger mouth piece size and its effects on deposition in the upper airway. 11 They investigated two participants in which each individual was imaged while breathing through both a Diskhaler and the Aerohaler replica. They determined that the increase in CSA in the oral cavity when using a larger mouthpiece was associated with greater recirculation through these regions, resulting in higher deposition through the upper airway. Additionally, they found that these effects varied strongly between patients, indicating that the deposition profiles are heavily dependent on the individual’s underlying geometry, with patient A experiencing a 51% increase in mean particle deposition through the upper airways when going from a small to large mouthpiece, and patient B exhibiting a 19% reduction in mean particle deposition in the upper airway. From this, we can infer that the larger oral cavity dimensions present in the high BMI population, determined in this study, as well as decrease in dimensions through the pharynx would have large implications on deposition profiles. The higher BMI cohort would experience more recirculation through the oral cavity, while the constricted dimensions through the pharynx would further influence these behaviors, more work is required to determine the exact relationship between these factors. While this study showed a significant interaction between BMI, mouthpiece size, and the geometries through the pharynx, there is still understanding to be gained on the effects these changes have on aerosol delivery to the lungs, further research can build upon this study’s findings to determine how these parameters affect particle delivery for individuals of differing body compositions.
Several limitations should be noted from this study. Data variability could be attributed to participants’ difficulties with inhaler devices and scanner claustrophobia. Some data were unusable due to artifacts or failure to adhere to training maneuvers. Measurements were taken over multiple tidal breathing cycles, not accounting for dynamic airway deformation. The study focused on cross-sectional measurements, which, while detailed, do not fully capture volumetric changes in airway geometries. Measurements were conducted in the supine position, affecting airway geometry, though this impact is likely minimal compared with upright measurements. 23 The study only compared between two mouthpiece sizes, and while these represent some of the smallest and largest mouthpiece diameters available in the market, future studies could elucidate the impact of a greater range of mouthpiece sizes and additionally combine this with the interaction of differing internal device resistances, mouthpiece size, and BMI. Finally, the study involved healthy participants, necessitating further research to verify these findings in diseased populations with reduced upper airway muscular function, such as patients with COPD.
Conclusions
The study highlights the complex interplay between BMI, inhaler mouthpiece size, and upper airway geometries. The results suggest that high BMI individuals experience significant changes in airway dimensions when using larger mouthpieces, particularly at the epiglottis tip and oropharynx. These findings have potential implications for inhaler design and prescription, particularly for optimizing device efficacy in high BMI populations.
Footnotes
Authors’ Contributions
C.B.: Conceptualization, data curation, formal analysis, investigation, methodology, resources, project administration, validation, visualization, and writing (original draft, review, and editing). A.K.: Methodology, conceptualization, interpretation, and writing (review and editing). S.C.: Methodology, conceptualization, funding acquisition, project administration, supervision, methodology, and writing (original draft, review, and editing). H.-K.C.: Interpretation and writing (review and editing). S.D.: Interpretation and writing (review). T.M.: Interpretation and writing (review). H.G.: Interpretation, validation, and writing (review). X.C.: Interpretation, writing, investigation, and recruitment (review).
Author Disclosure Statement
No competing financial interests exist.
Funding Information
Funding for the research was made possible by the Australian Research Council through grant DP220100764. The first author is funded by a PhD scholarship from the Australian Government Research Training Program. There are no conflicts of interest to disclose.