
Abstract
Purpose:
Adolescents with cancer have had less improvement in survival than other populations in the United States. This may be due, in part, to adolescents not receiving treatment at Children's Oncology Group (COG) institutions, which have been shown to increase survival for some cancers. The objective of this ecologic study was to examine geographic distance to COG institutions and adolescent cancer mortality.
Methods:
We calculated cancer mortality among adolescents and sociodemographic and healthcare access factors in four geographic zones at selected distances surrounding COG facilities: Zone A (area within 10 miles of any COG institution), Zones B and C (concentric rings with distances from a COG institution of >10–25 miles and >25–50 miles, respectively), and Zone D (area outside of 50 miles).
Results:
The adolescent cancer death rate was highest in Zone A at 3.21 deaths/100,000, followed by Zone B at 3.05 deaths/100,000, Zone C at 2.94 deaths/100,000, and Zone D at 2.88 deaths/100,000. The United States-wide death rate for whites without Hispanic ethnicity, blacks without Hispanic ethnicity, and persons with Hispanic ethnicity was 2.96 deaths/100,000, 3.10 deaths/100,000, and 3.26 deaths/100,000, respectively. Zone A had high levels of poverty (15%), no health insurance coverage (16%), and no vehicle access (16%).
Conclusions:
Geographic access to COG institutions, as measured by distance alone, played no evident role in death rate differences across zones. Among adolescents, socioeconomic factors, such as poverty and health insurance coverage, may have a greater impact on cancer mortality than geographic distance to COG institution.
Introduction
O
One reason adolescents are enrolled in clinical trials at low rates is referral patterns. Approximately 90% of children under the age of 14 years diagnosed with cancer are treated at one of the 191 Children's Oncology Group (COG) member institutions in the United States. 15 The COG is a National Cancer Institute-supported clinical trials group focused on childhood and adolescent cancer research. 15 While younger children are almost always referred to COG institutions for cancer care, the majority of adolescents are referred to adult oncology centers, and the referral of adolescents to COG institutions diminishes with increasing age.14,16,17
Most community oncologists at adult institutions, where most adolescent patients receive treatment, may not have deep expertise in cancer types commonly seen among adolescents. Improved outcomes on pediatric protocols, which are available at COG institutions, have been reported for cancers more common in adolescence.18–21 In addition, treatment at a COG institution means that the patient will more likely be offered enrollment on clinical trials, which is associated with a better outcome, presumably because of tighter adherence to treatment protocols and delivery of what is believed to be best available therapies. COG institutions also have more access to and higher rates of clinical trial enrollment compared to adult institutions. COG institutions also collectively facilitate race and ethnicity-specific childhood cancer research, given the limited absolute numbers of children who are diagnosed and survive cancer in any one racial/ethnic minority population.22,23 Finally, COG institutions have large psychosocial support teams that can help overcome barriers associated with poorer outcomes, including low clinical trial enrollment and adherence. 24 Specialized psychosocial support services at these institutions may also help patients address school and work-related issues, as well as psychological and physical impairments due to late effects.24,25
While there is extensive research on how sociodemographic characteristics affect pediatric cancer care, less is known about how geographic barriers affect outcomes among adolescents.14,26–30 Previous studies have examined geographic associations with site of cancer specialty care and cancer-related financial burden among children and adolescents.14,31 Albritton et al. found that the distance a patient lived from pediatric oncology care had a negligible effect on the likelihood of an adolescent being seen there. 14 Fluchel et al. reported greater social and financial burden among caregivers of children with cancer who lived far from treatment centers. 31 However, there is little research examining how geographic access to care affects cancer mortality among adolescents.
We took an ecologic approach to focus on geographic and contextual factors related to adolescent cancer mortality. Our purpose was to make large-scale comparisons of adolescent cancer mortality between geographic areas on potential predictors such as distance to healthcare and other sociodemographic characteristics. Thus, we examined whether increasing distance to COG institutions was associated with higher cancer death rates and whether adolescent cancer mortality varied by sociodemographic and healthcare access factors.
Patients and Methods
We obtained COG locations from the COG website and compiled multiple geospatial data sets at differing geographic scales. 32 We received the most recent (1999–2011) county-level mortality data, for adolescents aged 15–19 years, available from the National Center for Health Statistics (NCHS). 33 All NCHS Cause of Death codes related to cancer were included and represent cancers of the brain and central nervous system (ICD-10 codes C70–C72), Hodgkin disease (C81), non-Hodgkin lymphoma (C82–C85), leukemia (C91–C95), and other cancer types (C17, C23–C24, C26–C31, C37–C41, C44–C49, C51–C52, C57–C60, C62–C63, C66, C68–C69, C73–C80, C97). 34 We also obtained tract-level 100% count population data from the 2000 and 2010 United States Census, tract-level poverty for individuals, household access to a private vehicle, and median household income estimates from Census SF3 2000 and American Community Survey (ACS) 2006–2010.35–39 We acquired health insurance data for individuals at tract level from 2008 to 2012 ACS, and we obtained 2011 tract-level primary care physician data from the Health Resources and Services Administration.35–37,40
To validate the results of the combined population and areal weighting estimation, we compared publicly available residence point-level mortality data from the state of Georgia to results of the estimation technique for males and females within each of the zones. 41 We found a high correlation between the summed Georgia counts at the zone level and the proportion estimates (r = 0.63).
We established four mutually exclusive geographic zones at selected Euclidean (straight-line) distances surrounding COG facilities. COG institutions are largely located in metropolitan cities. The four zones represent an effort to define each COG institution's city core, an inner suburban ring, an outer suburban/exurban ring, and the balance of land beyond. Zone A encircles an area within 10 miles of any COG institution. Zones B and C are concentric rings with distances from the nearest COG institution of 10–25 miles and 25–50 miles, respectively. Zone D comprises the remaining United States. The theoretical basis for the zones originates in several geographic concepts although the specific zone diameters were arrived at as reasonable delineations of the urban–rural continuum.39–42 We characterized each zone by race, ethnicity, sex, health insurance status, poverty, vehicle access, primary care physician access, and income. We included whites without Hispanic ethnicity, blacks without Hispanic ethnicity, and persons with Hispanic ethnicity in our analyses. Other racial and ethnic populations were excluded due to insufficient samples sizes.
Because of the challenge of integrating differing spatial scales of data sets,
42
we used combined population and areal weighting technique to estimate mortality. The death rate for a zone was calculated as the number of deaths over the 13-year study period for a specified group (numerator), divided by the total population of that specific group weighted by census year (denominator):
To compare death rates between zones, we calculated rate ratios and evaluated 95% confidence intervals to determine ratio significance using OpenEpi. 43 We calculated confidence intervals for the rate ratios using the Byar Method, which gives accurate approximations to the Poisson probabilities of these events. 44 Rates with rate ratio confidence intervals that excluded 1.00 in their bounds were statistically significant and are displayed in bold in Tables 1 and 2.
Rates in bold are significantly different from at least one other zonal rate for the specified variable. All significance testing is at the 95% confidence level.
Different from rates in all other zones.
Different from Zone A rate.
Different from Zone B rate.
Different from Zone C rate.
Different from Zone D rate.
Different from United States overall rate.
COG, Children's Oncology Group.
All deaths and rates comprise only white, non-Hispanic; black, non-Hispanic; and Hispanic.
Rates in bold are significantly different from at least one other zonal rate for the specified variable. All significance testing is at the 95% confidence level.
United States overall deaths are calculated directly from National Center for Health Statistics (NCHS) Compressed Mortality Files.
Includes multiple myeloma and immunoproliferative neoplasms, unspecified malignant neoplasms of lymphoid, hematopoietic, and related tissue, and all other and unspecified malignant neoplasms.
Different from Zone A rate; BDifferent from Zone B rate; CDifferent from Zone C rate; DDifferent from Zone D rate; TDifferent from United States overall rate.
Because Zones A, B, C, and D are independent of any standard enumeration unit, we estimated numerators and denominators for each zone. To approximate the population for the denominator, we used the Geospatial Research and Services Program Population Estimator tool. 45 The population of each tract was multiplied by the proportion of the tract area that falls within the zone. The resulting population proportions were summed to estimate a population total for the zone.
Because we only had mortality by county, each tract was assigned a mortality likelihood weighted by the proportion of the specified county population that falls within the tract. The formula is:
The output of the formula was then multiplied by the proportion of the tract that falls within the zone. We summed the resulting proportions to estimate the number of deaths for the zone.
Reassigning county-level mortality counts to zone-level counts required a combination of disaggregation and aggregation of spatial data. For health insurance, poverty, and vehicle access rates, we used a similar method to that described above for estimating population for the denominator of the death rate. To estimate median household income, we first used the areal proportion of each tract that falls within the zone as a weight to estimate the number of households in each tract. Then we multiplied the estimated number of households for each tract by its median income, summed the estimated median incomes for the zone, and then divided by the total estimated number of households to estimate a mean household income for the zone. Finally, we weighted the estimated mean median income for years 2000 and 2010 to account for the 13-year time frame. We calculated primary care physician accessibility score using a simple two-step floating catchment method, assuming a 10-mile Euclidean travel distance. 46 A higher primary care physician accessibility score indicates greater overall accessibility.
Results
The distribution of the 191 COG institutions across the United States is presented in Figure 1. Each mapped COG institution is surrounded by Zones A through D, with the zones representing set distances from a COG location (Fig. 2).
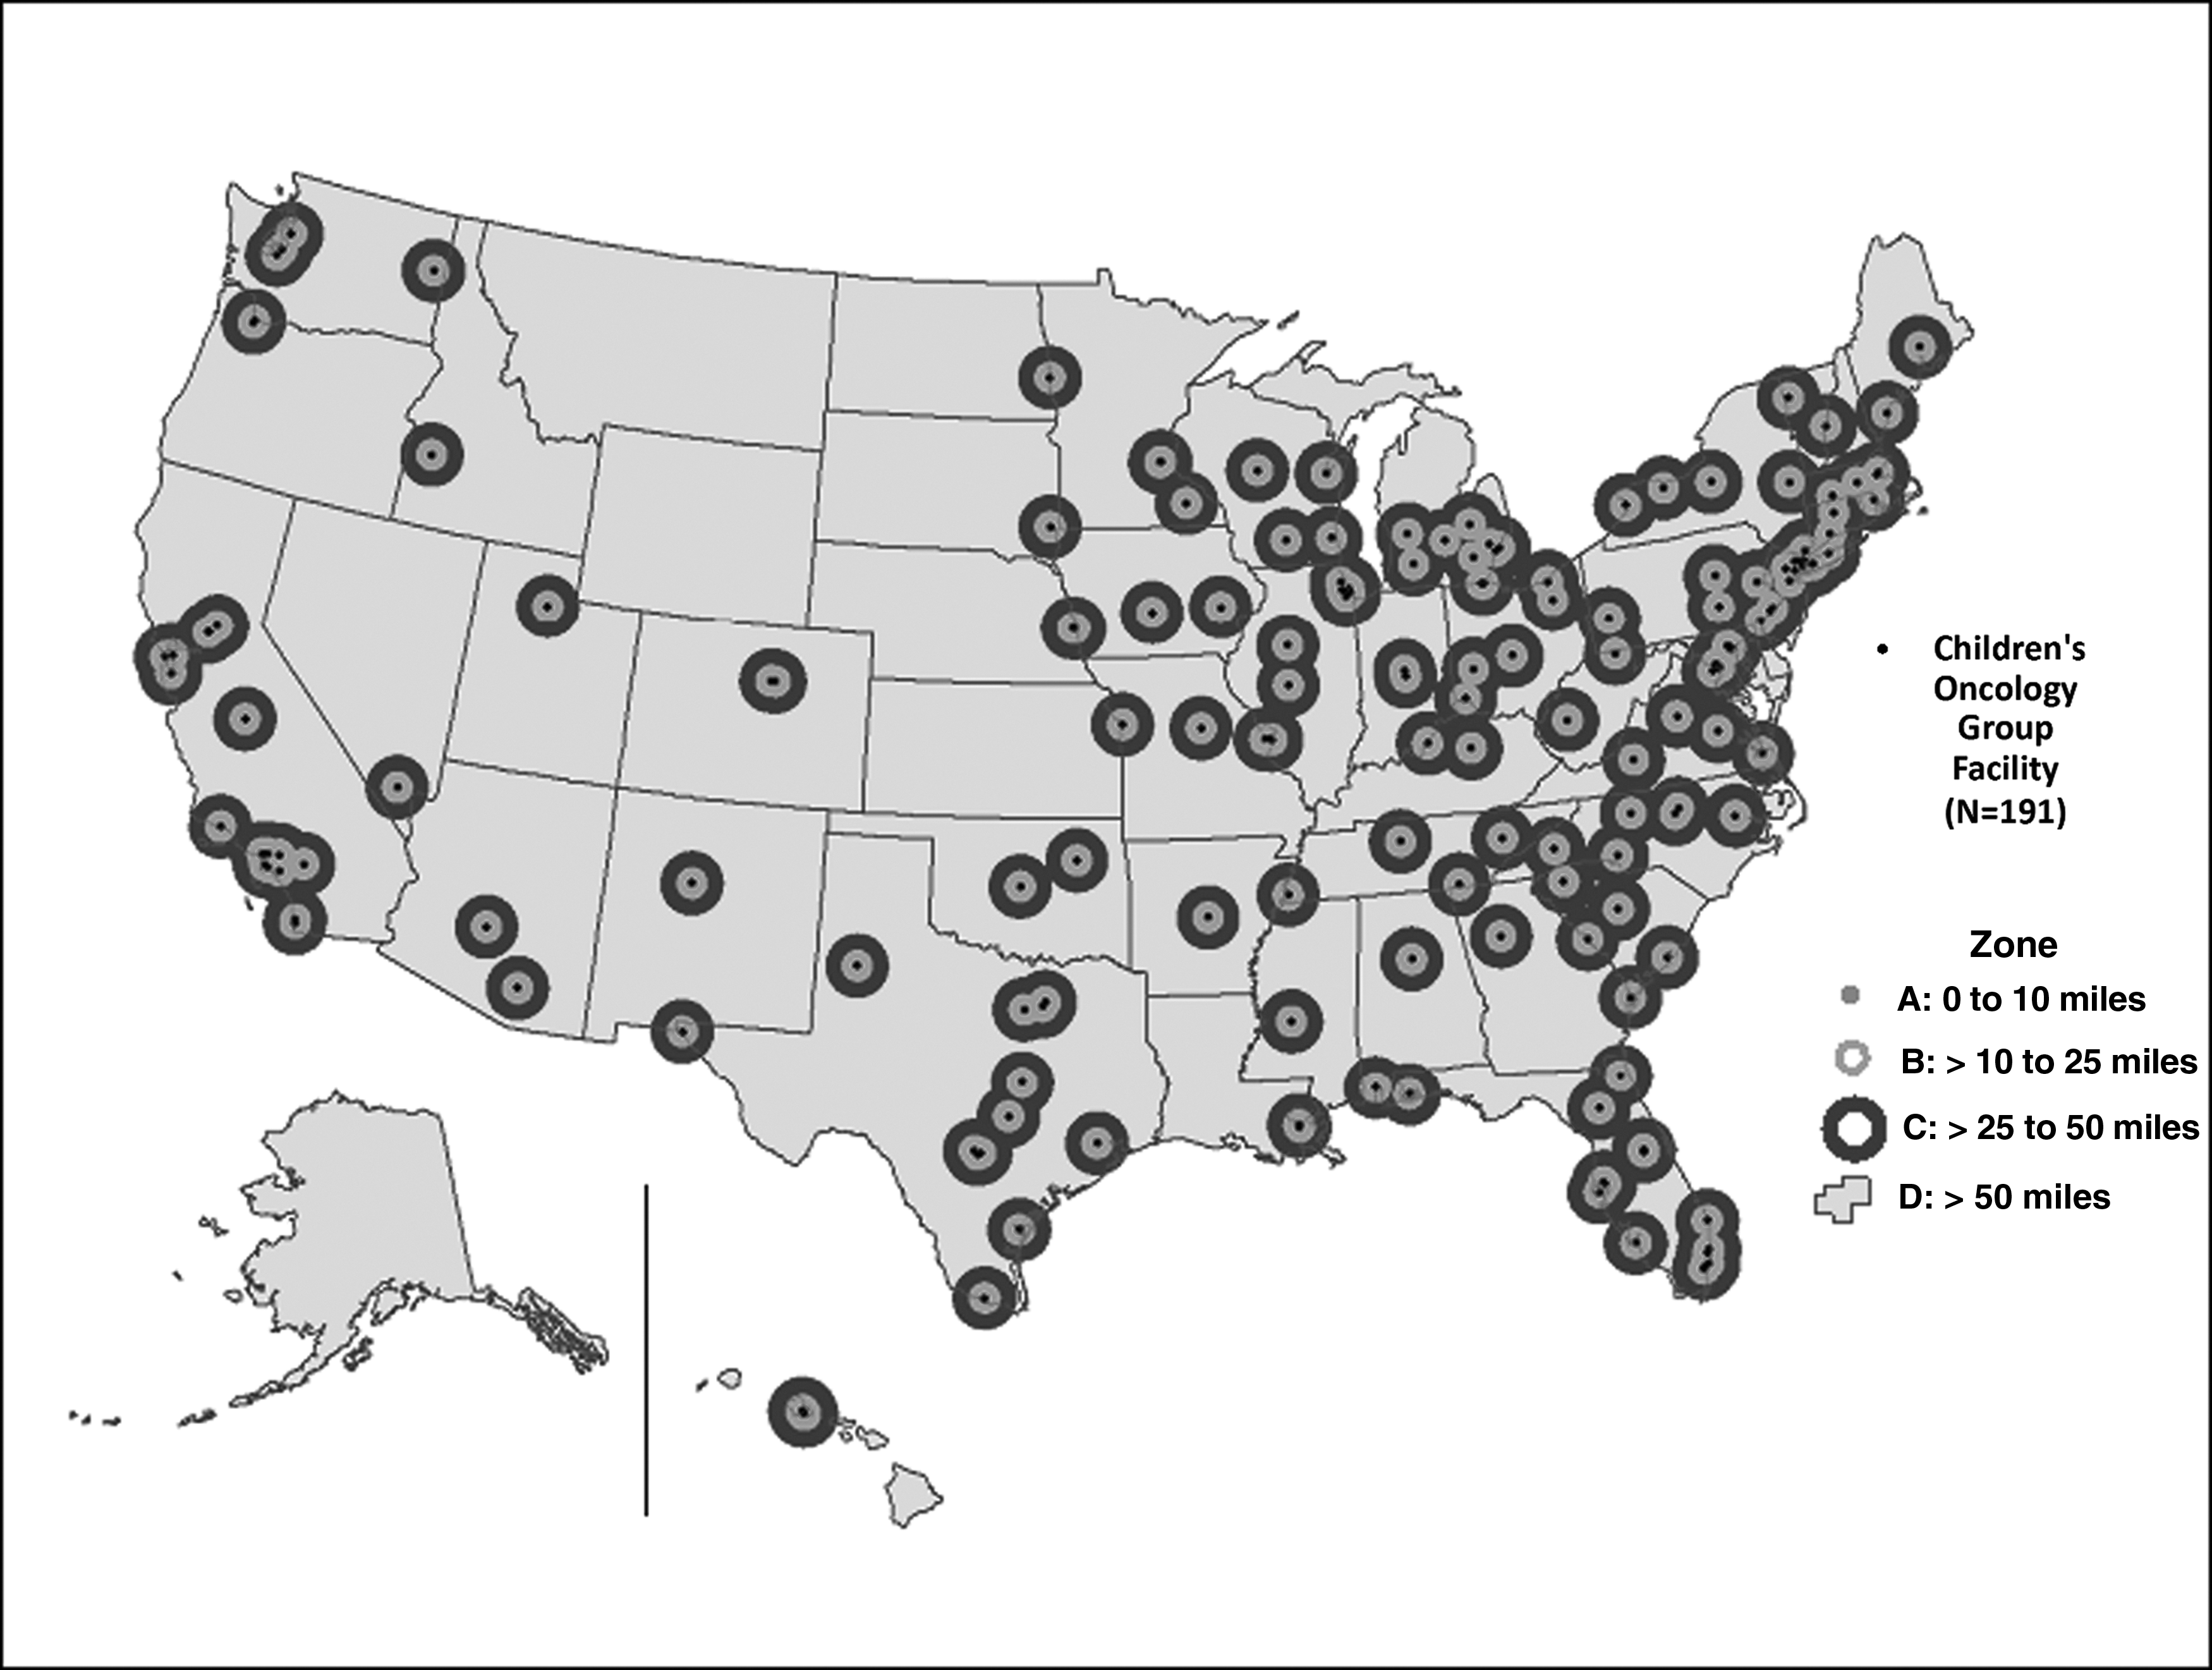
Children's Oncology Group Institutions and Zones.

Children's Oncology Group Institutions and the Urban/Rural Continuum.
Sociodemographic characterization and overall adolescent cancer mortality by zone are presented in Table 1. A total of 20.5% of the population in Zone A (area closest to the COG facility) were persons with Hispanic ethnicity, 18.3% were blacks without Hispanic ethnicity, and 51.6% were whites without Hispanic ethnicity. The proportion of persons with Hispanic ethnicity and blacks without Hispanic ethnicity decreased across the zones, as distance increased from COG facilities. In Zones C and D, 78.12% and 75.96% of the population was white, respectively.
Percent poverty was highest in Zones A and D (15.10% and 15.71%, respectively) as was percent with no health insurance at the time of survey (16.4% and 16%, respectively). The proportion with no access to a private vehicle at the time of survey was highest in Zone A (15.6%). Access to primary care decreased substantially across the zones. Median household income was highest in Zone B, at more than $62,000, and lowest in Zone D, at <$40,000. The adolescent cancer death rate varied significantly by zone: it was highest in Zone A at 3.21 deaths/100,000, followed by Zone B at 3.05 deaths/100,000, then Zone C at 2.94 deaths/100,000, and lowest in Zone D at 2.88 deaths/100,000.
Adolescent cancer mortality by selected characteristics for each zone is shown in Table 2. Death rates among whites without Hispanic ethnicity did not significantly differ by zone. Among blacks without Hispanic ethnicity, the death rate was highest in Zone A (3.31 deaths/100,000). Among persons with Hispanic ethnicity, the death rate was highest in Zone A (3.43 deaths/100,000) and lowest in Zone D (2.73 deaths/100,000). Death rates for females were considerably lower than for males. Death rates for brain and central nervous system, as well as for Hodgkin disease, did not significantly differ by zone. Conversely, death rates for leukemia were highest in Zone A (1.13 deaths/100,000) and lowest in Zone D (0.88 deaths/100,000).
Discussion
In this report we examine the association between Euclidean distance to COG institutions and cancer mortality among adolescents with cancer. Contrary to what we expected, adolescent cancer mortality decreased with increasing distance from a COG institution. Geographic access to COG institutions, as measured by distance alone, played no evident role in death rate differences across zones. However, we found several sociodemographic characteristics that represent other key dimensions of access to care that may affect mortality among adolescents with cancer.
COG institutions providing specialized cancer care for children are primarily located in urban centers, 47 in which we found the highest adolescent cancer death rates (Zone A). Zone A also had the highest minority population percentage, the highest percentage without health insurance coverage, the highest percentage without access to a vehicle, and high poverty rates. Race and ethnicity are strong determinants of both individual- and community-level poverty. Blacks without Hispanic ethnicity and persons with Hispanic ethnicity across the United States have nearly threefold higher rates of poverty compared to whites.35–37,48 Blacks without Hispanic ethnicity lack health insurance at a rate of 1.7 times greater than whites, while persons with Hispanic ethnicity lack health insurance at a rate nearly thrice greater than whites.35–37 Blacks without Hispanic ethnicity are also more than thrice as likely to lack vehicle access as whites, and persons with Hispanic ethnicity are more than twice as likely as whites to lack vehicle access.35–37
Reliance on public transportation within urban areas has been associated with barriers to preventive healthcare and treatment and may be a contributing factor to lack of healthcare access for blacks and persons with Hispanic ethnicity who live in city cores.49–51 This is consistent with our finding that blacks without Hispanic ethnicity and persons with Hispanic ethnicity had the highest death rate in the zone closest to a COG institution, Zone A, whereas death rates among whites without Hispanic ethnicity did not differ by zone. In contrast to these indicators of vulnerability are the relatively high median income and very high primary physician access in Zone A. The discrepancy between high mortality and higher income may be potentially explained by income and wealth inequalities whereby the middle class has largely moved to the suburbs, leaving the city to the very wealthy and the poor. Those with the lowest incomes may have difficulty accessing the healthcare system, resulting in poor medical and social outcomes.52,53
Zone A also had the highest primary care physician accessibility score by a considerable margin. Although specialists deliver cancer treatment, the role of primary care physicians in referring patients to specialty care is critical. Timely referrals to the correct specialists result in higher likelihood of obtaining earlier diagnosis, optimal treatment, and better outcomes for patients.54,55 In addition, urban areas with more primary care physicians are also typically locations with more medical specialists. Because of specialist availability or experience with specialists, urban physicians refer patients more often than do rural physicians. 56 Nevertheless, the abundance of physicians in the city core may be less available to the poor and minorities, in some measure, because households in these communities are less likely to have access to a vehicle. Public transportation, when available, adds considerably to the time and effort involved in accessing medical care.49–51 Moreover, access to specialist care can be hampered by lack of insurance or insurance that the specialist does not accept.57,58 The net result in Zone A is a large population with a more limited attachment to the healthcare system than would be expected given the preponderance of primary physicians and the presence of COG institutions.
A key issue for this population is access to primary and specialty care in association with health insurance status. Many urban centers rely on federally qualified health centers (FQHCs) to treat poor and/or uninsured patients, including adolescents. One potential factor in this disparity is the low rates of access to private-sector physicians in association with the low reimbursement rates from state Medicaid programs. FQHCs may have diminished ability to coordinate care with providers outside of the practice, particularly specialist care.59–61 This may play a role in decreased access to COG institutions among adolescents living in Zone A. While access to high-quality primary care has been improving for most children, the degree of improvement has tended to be slower and more volatile for higher risk children. 62 Since primary care access for adolescents may be problematic in Zone A despite a higher presence of primary care physicians, this gap is arguably increasing over time compared to less vulnerable adolescents who likely reside in Zones B and C.
Among adults, previous literature has linked travel barriers in access to care, physician, or specialist density and travel distance to adverse cancer outcomes.63,64 Among children, long travel times to a treatment center is associated with significant negative financial and social impacts on patients and families. 31 Our results suggest that, among adolescents, socioeconomic factors, such as poverty and health insurance coverage, may have a greater impact on cancer mortality than geographic distance to treatment facility.
When examined by cancer type, death rates did not significantly differ across zones for Hodgkin disease, brain, and central nervous system cancers across the geographic zones, which were consistent with previous literature. 17 In contrast, death rates from leukemia were highest in Zone A. Survival from acute lymphoblastic leukemia has been shown to be lower among blacks and persons with Hispanic ethnicity compared to whites. 65 This is consistent with our finding of higher death rates for leukemia in Zone A which correspond to higher proportions of minority populations. This discrepancy in mortality may represent differences in treatment since cancer incidence is lower among black children and children with Hispanic ethnicity compared to white chidren. 66
This study had several limitations. We did not have cancer deaths at the point level to aggregate to our nonstandard analysis zones, so we estimated zone counts based on a combination of population and areal weighting at the tract level. The disaggregation from county to tract followed by aggregation from tract to zone likely introduced some error, particularly in locations where counties were split by zones. Due to small numbers, we were unable to examine some cancer types by zone, as well as racial-specific mortality other than black and white. Mortality rates could have also been affected by geographic differences in cancer death rates in the United States, with rates highest in the West and lowest in the Northeast. 67 We measured distance in a straight line. Actual travel distance could be substantially different from this, but more likely may have corresponded well with our zones of increasing distance because of the central urban location of most COG institutions. Finally, we did not have data on the facility where individual cancer cases received treatment. Adolescent patients with cancer may or may not receive care from a COG institution, regardless of geographic proximity to such an institution. Distance from a COG institution is not necessarily representative of rates of care by the most proximate COG center.
Because this is an ecologic study, the patterns we observed may not hold true at the individual level. Nevertheless, using this approach, we were able to demonstrate that geographical distance was not a factor in access to care as measured by adolescent cancer mortality. Another limitation of this study is that we did not account for public transportation or evaluate cancer aggressiveness in our analysis.
Conclusion
This study adds to the literature on geography, healthcare access, and socioeconomic factors affecting adolescent cancer mortality. Although we did not find geographic distance to COG institutions to be associated with adolescent cancer mortality, sociodemographic characteristics such as the availability of private transportation, poverty, and health insurance may have a significant impact on cancer mortality among adolescents. This study provides evidence that sociodemographic factors need to be considered in the effort to address outcome disparities through further research and health service initiatives.
Future research can extend this analysis to examine specific features of the clinical settings in which adolescents receive cancer care and could directly compare outcomes of adolescents treated at a comprehensive cancer center versus adolescents treated in other settings. Another approach could be to link cancer mortality data to cancer registry data. This would provide individual-level data that would allow improved characterization of the patient which along with contextual variables such as system and neighborhood characteristics could provide a more comprehensive analysis of cancer mortality. This research suggests that addressing underlying socioeconomic disparities is needed to ensure that all adolescents with cancer can access and receive the highest standard of oncology care available.
Footnotes
Acknowledgment
All funding was provided by the Centers for Disease Control and Prevention. The findings and conclusions in this report are those of the authors and do not necessarily represent the official position of the Centers for Disease Control and Prevention.
E.T., L.A.P., N.B.L., B.F., E.H., and S.G. conceptualized and designed the study, drafted the initial article, revised the article, and approved the final article as submitted. B.F., E.H., and S.G. also carried out the analyses. G.W. carried out the analyses, reviewed the article, and approved the final article as submitted.
Author Disclosure Statement
No competing financial interests exist.