
Abstract
Purpose:
Metabolic syndrome (MetS) and obesity have increasingly been reported in survivors of childhood cancer. Osteopontin (OPN) is primarily synthesized in adipose tissue and is thought to have a role in obesity and the development of insulin resistance (IR). The aim of this study was to investigate the frequency of MetS in survivors of acute lymphoblastic leukemia (ALL) and to establish the relationship between serum OPN levels and anthropometric measurements and glucose metabolism.
Methods:
A total 50 survivors of ALL (median age: 10.5 years; post-treatment interval 4.54 ± 2.48 years), and 20 healthy children (median age: 11 years) were included in the study. Anthropometric measurements were taken, and serum glucose, insulin, homeostasis model assessment and IR index (HOMA-IR index), lipoprotein, thyroid hormone levels, and OPN levels were measured.
Results:
Twenty-one (42%) survivors were overweight/obese, 2 (5.1%) survivors had MetS, 7 (14%) survivors had IR, and 19 (38%) survivors had dyslipidemia. Fasting insulin levels and HOMA-IR of the overweight/obese survivors were significantly higher than those of the normal-weight survivors (p < 0.05 and p < 0.01) and control group (p < 0.01 and p < 0.01). The serum OPN level was significantly lower in the overweight/obese survivor than in the normal-weight survivor and control group (37.42 ng/mL [range, 27.32–62.07], 69.02 ng/mL [range, 40.29–88.21], and 85.7 ng/mL [range 67.7–102.3]; p < 0.01, p < 0.001, respectively). Serum OPN levels were inversely correlated with anthropometric measurements and HOMA-IR index in all the subjects.
Conclusion:
Our results showed that obesity and IR are associated with decreased serum OPN levels in childhood survivors of ALL.
Introduction
I
The aim of this study was to demonstrate the frequency of MetS and its components in survivors of childhood ALL and to establish the relationship between serum OPN levels and anthropometric measurements and glucose metabolism.
Methods
Study population
Fifty-eight children who were treated for ALL at Eskişehir Osmangazi University Faculty of Medicine, Pediatric Hematolgy/Oncolgy Unit between 2003 and 2013 were included in the study. All of the survivors were children who had at least 2 years of follow-up and had complete remission of their disease. The control group comprised healthy children of similar age and sex. All subjects were examined for parameters of MetS, serum OPN level, and biochemical parameters between May 2015 and August 2016. Approval of the local ethics committee (ethics approval no: 80558721/10) and written informed consent from the survivors and their parents were obtained for the study.
Exclusion criteria
In addition to ALL, those with other systemic disease and using different medication were excluded from the study [three survivors: asthma (n = 1), epilepsy (n = 1), cerebral palsy (n = 1)]. In addition, among the survivors, one had Down syndrome, two survivors refused to participate, and laboratory analyses were missing for two; all were excluded from the final analysis. A flow diagram for survivors included and excluded from the study is presented in Figure 1.
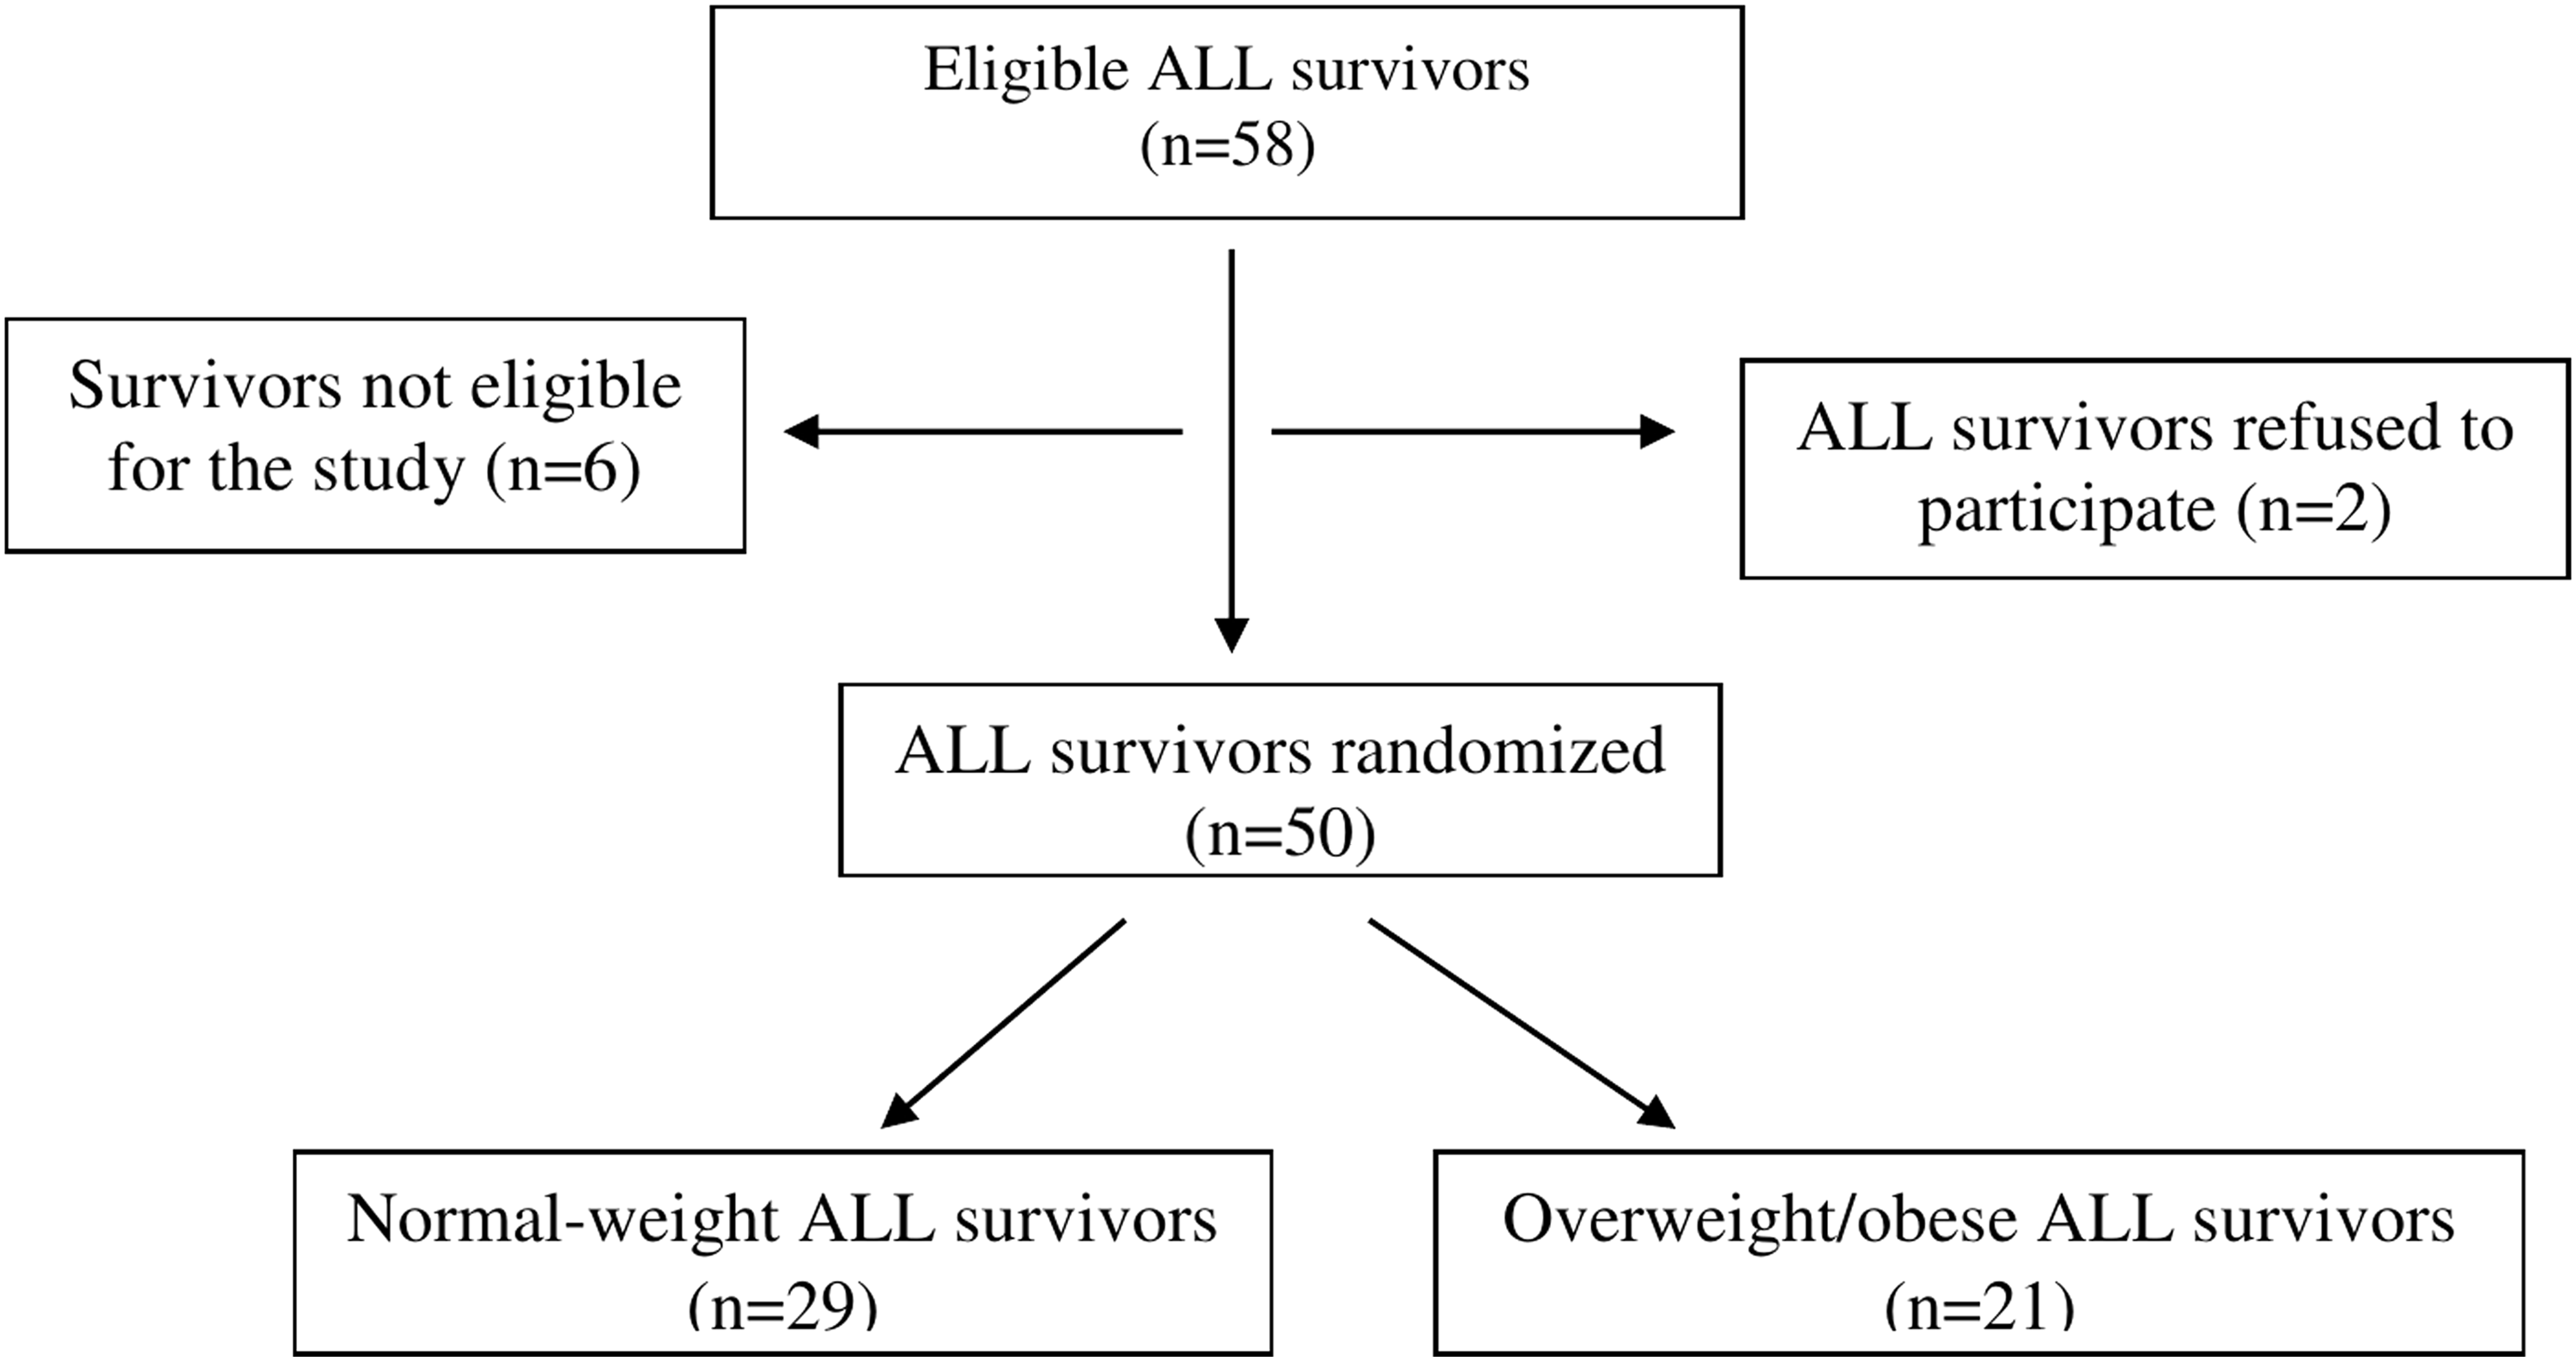
Recruitment diagram for survivors of ALL who were eligible for inclusion in the study. ALL, acute lymphoblastic leukemia.
Measurements
At the beginning of the study, measurements of height, weight, waist and hip circumference, and blood pressure were taken. Body mass index (BMI) was calculated as weight in kilograms divided by height in meters squared. The obtained values were compared with the reference values of Turkish children. 8 BMI in the 85–95th percentile was accepted as overweight, over the 95th percentile as obese, and in the 5–85th as normal weight. 8
Hip circumference was measured at the most prominent area of the hip. Waist circumference was measured at the narrowest part between the endpoints of the ribs and the iliac bone with a nonelastic paper measuring tape. The children's waist circumferences were evaluated using reference values of Turkish children. 9 Values above the 90th percentile were regarded as representing abdominal obesity. 9 Blood pressure measurements were conducted using a mercury sphygmomanometer. Hypertension was identified as two different systolic and diastolic blood pressure values at or above the 95th percentile for age, sex, and height.
Basal glucose, insulin, lipoprotein, and thyroid hormone levels were performed in all children after overnight fasting. Standard oral glucose tolerance tests were performed with the survivors (1.75 g/kg or a maximum of 75 g glucose). Blood samples were obtained 120 min after glucose administration for glucose and insulin measurements. Impaired glucose tolerance was defined as a fasting glucose level ≥100 mg/dL and/or 120-min glucose level of 140–200 mg/dL. 10 The homeostasis model assessment index (HOMA-IR) was used to evaluate IR. HOMA-IR was calculated using the equation HOMA-IR = fasting insulin (μU/mL) × fasting glucose (mg/dL)/405. 10 The threshold values for IR were set at 2.22 for prepubertal girls, 2.67 for prepubertal boys, 3.82 for pubertal girls, and 5.22 for pubertal boys. 10 Thyroid-stimulating hormone (TSH) levels exceeding 5 μU/mL was considered elevated. 11
There were no specific diagnostic criteria for MetS in any survivor children under 10 years (n = 11) of age. MetS diagnoses were made by a pediatric endocrinologist in children older than 10 years (n = 39) of age in accordance with the criteria of the International Diabetes Federation (IDF). In addition to abdominal obesity, the findings of two or more of the other components (elevated triglycerides of >150 mg/dL, low high-density lipoprotein (HDL-C) cholesterol of <40 mg/dL, high blood pressure, impaired glucose tolerance test) were required to diagnose MetS. 12
Laboratory analysis
Serum glucose, low-density lipoprotein cholesterol (LDL-C), HDL-C, triglyceride (TG) levels, and alanine transaminase (ALT) and aspartate transaminase (AST) activities were determined through a colorimetric method using a Roche Cobas 8000 modular system (Roche, Mannheim, Germany). Insulin, TSH, and free thyroxine (fT4) concentrations were determined using electrochemiluminescence (Roche Cobas 8000; Roche, Mannheim, Germany). Serum OPN was measured by enzyme-linked immunosorbent assay (ELISA) (the Human Osteopontin Platinum ELISA Kit; eBioscience, Vienna, Austria), according to the manufacturer's protocol.
Statistical analyses
All analyses were performed using the SPSS 15.0 statistical software package (SPSS for Windows 15.0; SPSS, Chicago, IL). The descriptive statistics used were mean and standard deviation for variables with normal distribution, and median and interquartile distribution range was used for other variables. Categorical data were compared using the Chi-square test. The Kolmogorov–Smirnov test was used to verify the normality of distributions of continuous variables. Continuous variables conforming to normal distribution were compared using the independent t-test and analysis of variance (one-way ANOVA); otherwise the Mann–Whitney U and Kruskal–Wallis tests were used. When an overall significance was observed, post-hoc multiple comparisons were performed with Tukey's HSD and the Bonferroni test. A p-value of ≤0.05 was considered statistically significant.
Results
A total 70 children were enrolled in this study. The mean time after the end of treatment was 4.14 ± 2.48 years (range, 2–13 years). The median age at diagnosis of the survivor was 5 years (range, 3–11 years). The median age of the survivor at the beginning of the study was 10.5 years (range, 7–15), 20 (40%) were girls and 30 (60%) were boys; 27 were prepubertal and 23 were in the pubertal period. The control group comprised 20 healthy children with a median age of 11 years (range, 8–13), 9 (45%) were girls and 11 (55%) were boys; 11 were prepubertal and 9 were in the pubertal period. There were no differences between the two groups in terms of age, sex, and puberty status (p > 0.05, for all). The BMI and hip circumference of the survivors (19.4 kg/m2, [range, 17–23.3] and 83.9 ± 2.10 cm, respectively) were significantly higher than those of the control group (17.0 kg/m2, [range, 15.2–20.2] and 71.0 ± 4.0 cm, respectively) (p < 0.05, for both). The serum OPN level was significantly lower in the survivors than in the control group (52.3 ng/mL [range, 26.8–85.9] vs. 85.7 ng/mL [range, 67.7–102.3]; p < 0.05). There were no significant differences between the survivors and the control group in terms of other biochemical parameters (p > 0.05, for all). The clinical characteristics, anthropometric measurements, and biochemical parameters of the survivors and the control group are shown in Table 1.
OPN, osteopontin; HOMA-IR, homeostasis model assessment and insulin resistance index; BMI, body mass index; TSH, thyroid-stimulating hormone; TG, triglyceride; LDL, low-density lipoprotein; HDL, high-density lipoprotein; ALT, alanine transaminase; AST, aspartate transaminase.
Seven (14%) of the survivors were overweight/obese before receiving treatment, and 21 (42%) were overweight/obese at the beginning of the study. Thirteen (26%) survivors had abdominal obesity, and 7 (14%) had IR. In total, 19 (38%) patients had dyslipidemia. Seven (14%) patients had reduced HDL-C (HDL-C ≤40 mg/dL), 3 (6%) had hypertriglyceridemia (TG ≥150 mg/dL), 2 (4%) had raised LDL-C (LDL-C≥130 mg/dL), 3 (6%) had reduced HDL-C and hypertriglyceridemia, 2 (4%) had hypercholesterolemia (total cholesterol ≥200 mg/dL), and 2 (4%) had hypertriglyceridemia and hypercholesterolemia. According to the description of the IDF, 2 children (5.1%) were diagnosed as having MetS. MetS could not be identified with any degree of certainty in any of the 11 patients <10 years of age owing to their young age. None of the survivors had developed hypertension or impaired glucose metabolism. The results of the survivors in terms of MetS and its components are shown in Table 2.
MetS, metabolic syndrome.
Thirty-five (70%) survivors had received only chemotherapy (CT). Fifteen (30%) survivors had received CT plus craniospinal radiotherapy (CRT). Among the survivors who had CT, 15 were overweight/obese. Seven survivors had abdominal obesity, one had MetS, and four had IR. Among the survivors who had CT plus CRT, six were overweight/obese. Six survivors had abdominal obesity, one had MetS, and three had IR. No difference was found regarding the frequency of MetS, obesity, and IR between the two groups (p > 0.05, for all). Among the survivors who received CT only, 3 (8.5%) had thyroid dysfunction with elevated TSH and normal fT4. The median TSH levels were found to be lower in the survivors who received CT plus CRT than those who received CT only ([1.8 μU/L [range, 1.3–2.1] and 3 μU/L [range, 1.84–3.5]; p = 0.001). There was no statistical difference in terms of serum OPN levels and other biochemical parameters between survivors who received CT only and those who received CT plus CRT (p > 0.05, for all). The frequency of MetS and its components, biochemical parameters, and serum OPN levels according to treatment modalities are shown in Table 3.
CT, chemotherapy.
When the survivors were separated into those who were normal weight (n = 29) and those who were overweight/obese (n = 21), the BMI, waist, hip circumference, fasting insulin levels, and HOMA-IR indices of the overweight/obese survivors were significantly higher than those of the normal-weight survivors and control group (p < 0.001, p < 0.01, p < 0.05, p < 0.05, p < 0.01 and p < 0.001, p < 0.01, p < 0.01, p < 0.01, p < 0.01). The serum OPN level was significantly lower in the overweight/obese survivors than in the normal-weight survivors and control group (37.42 ng/mL [range, 27.32–62.07], 69.02 ng/mL [range, 40.29–88.21] and 85.7 ng/mL [range 67.7–102.3]; p < 0.01, p < 0.001, respectively) (Table 4). The anthropometric measurements, biochemical parameters, and serum OPN levels of the overweight/obese survivors, normal-weight survivors, and control group are shown in Table 4.
Overweight/obese survivors and control group.
Normal-weight survivors and overweight/obese survivors.
There was found a negative correlation between serum OPN levels and BMI (r = −0.40, p < 0.001), waist circumference (r = −0.231, p = 0.031), hip circumference (r = 0.25, p = 0.016), fasting insulin level (r = −0.34, p = 0.001), and HOMA-IR index (r = −0.36, p = 0.001) in all subjects (Fig. 2).
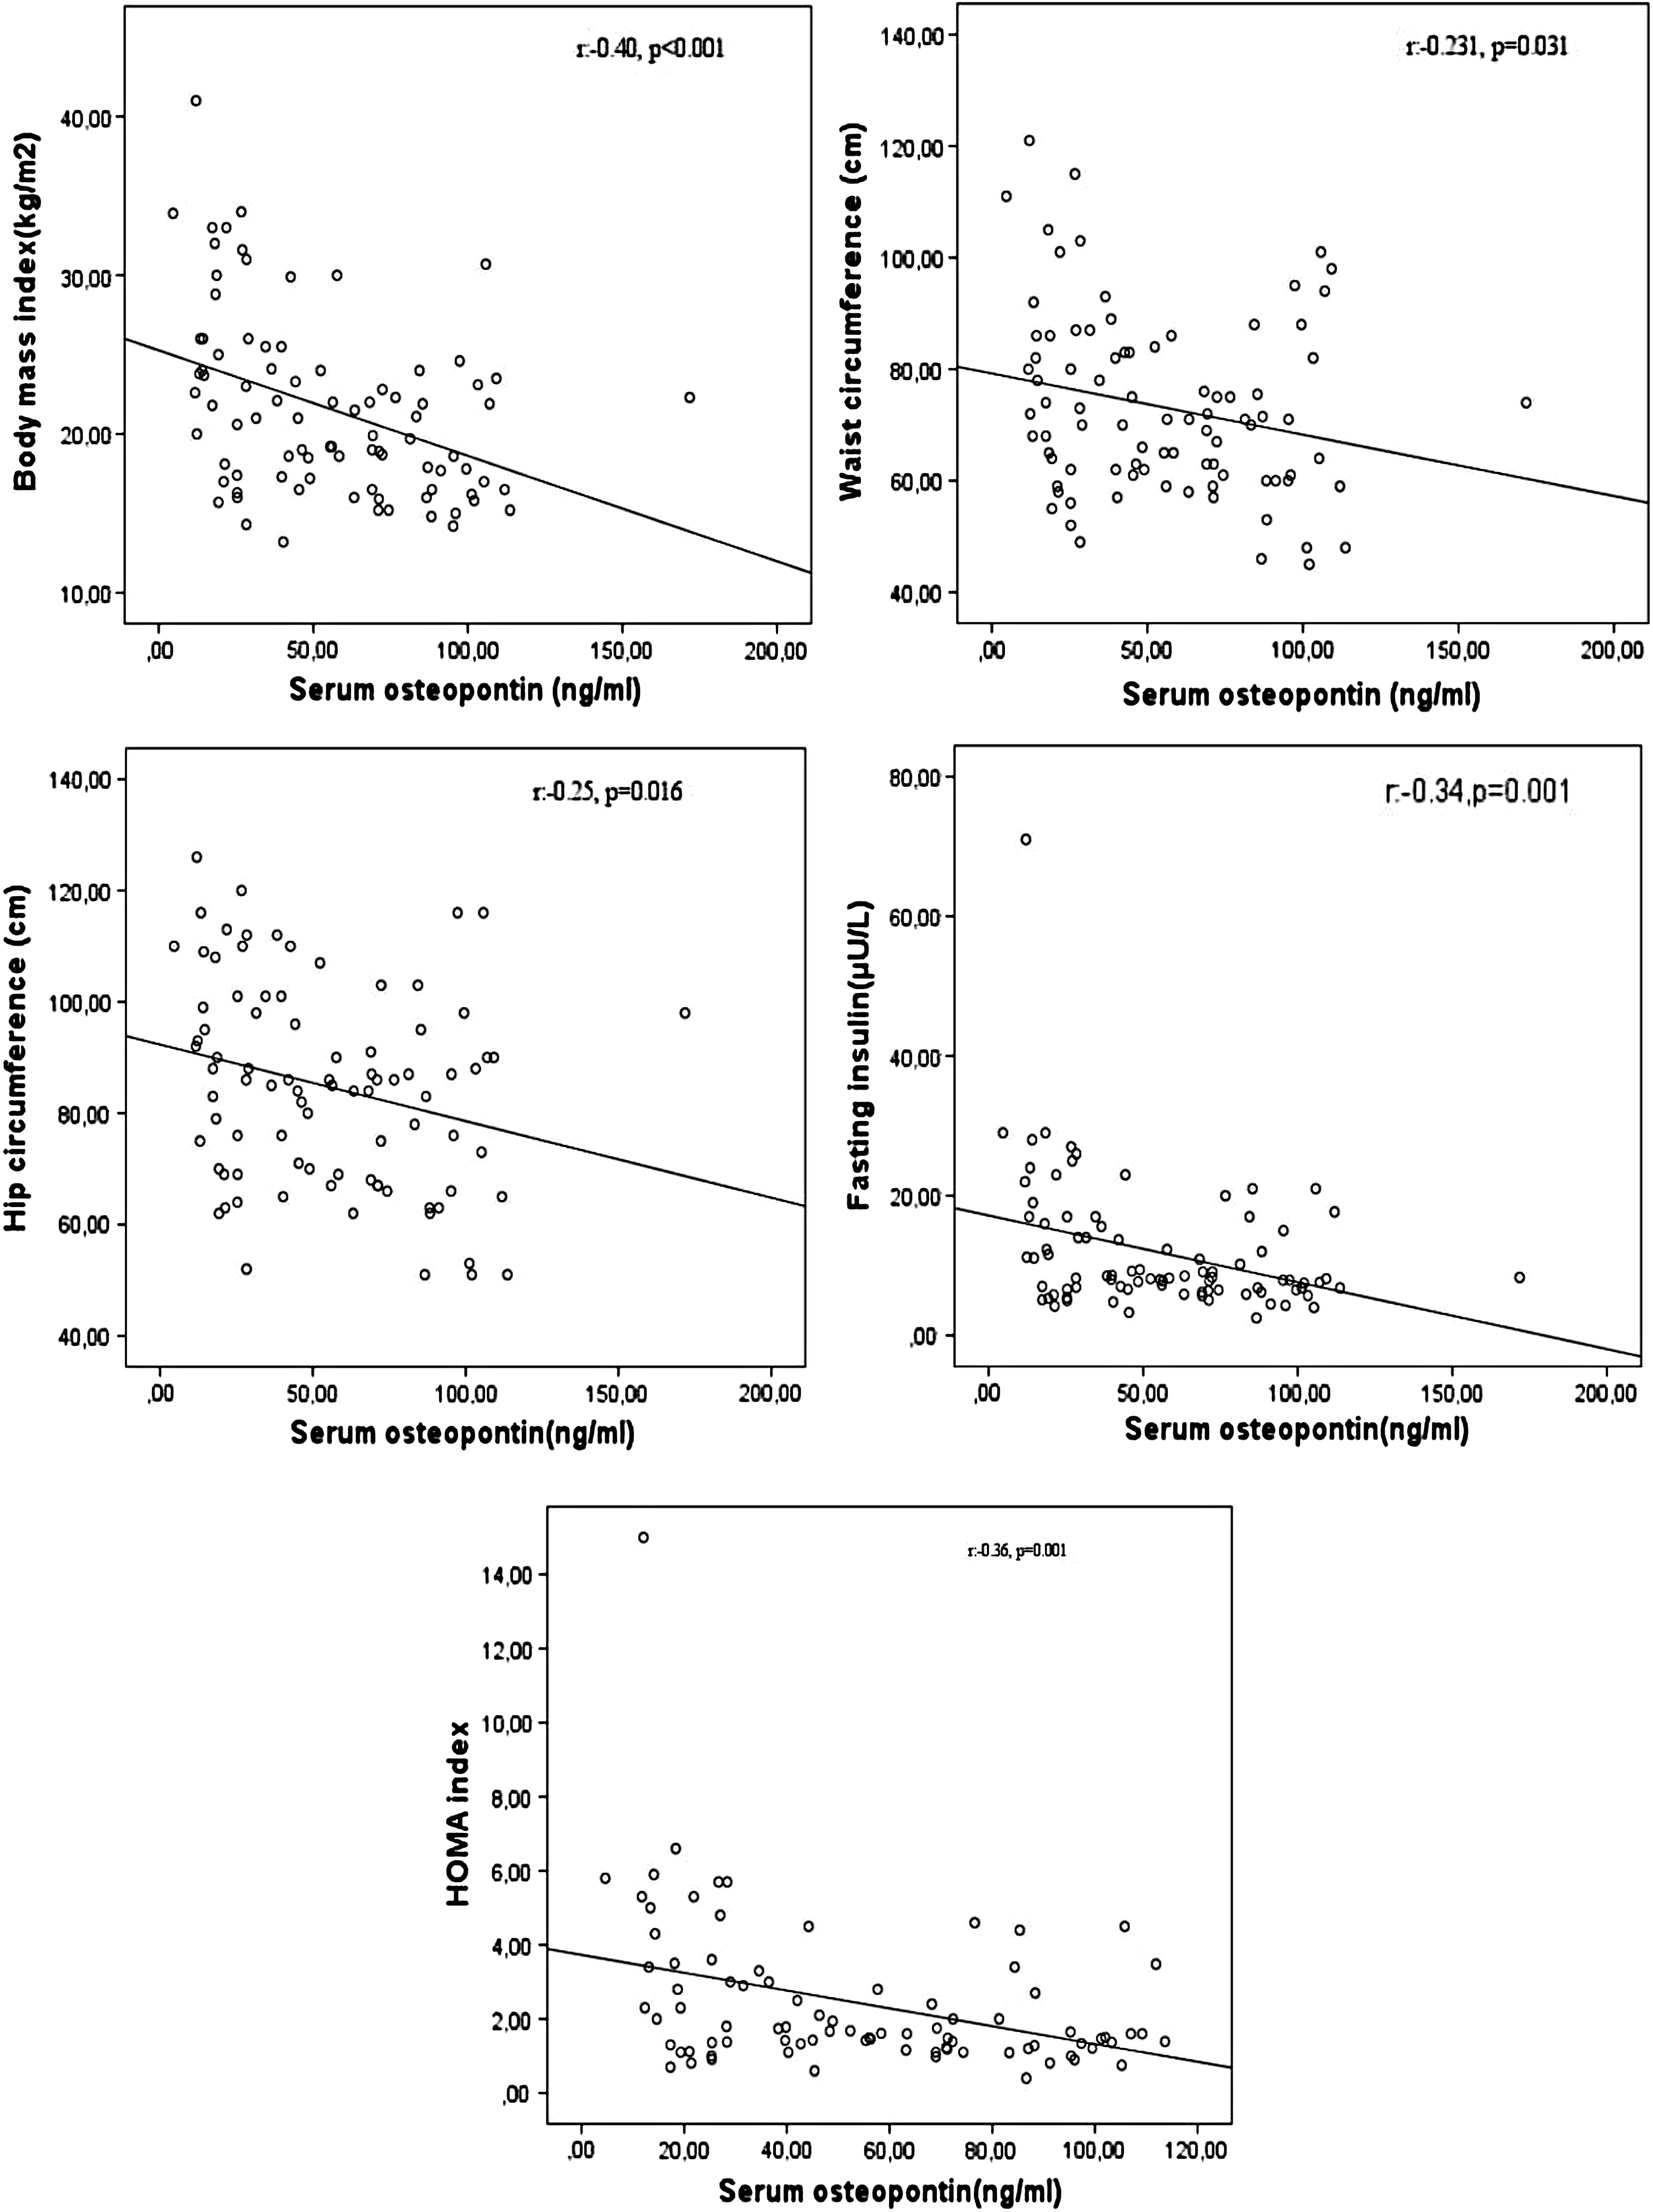
Negative correlations between serum osteopontin level and body mass index, waist circumference, hip circumference, fasting insulin, HOMA-IR index. HOMA-IR, homeostasis model assessment and insulin resistance index.
Discussion
In our study, the prevalence of overweight/obesity and MetS was 42% and 5.1%, respectively, in the early period (mean 4.14 years) after treatment cessation. This result suggests that ALL survivors are under high risk in the early period after discontinuation of treatment against the development of MetS and its components. On the other hand, according to the other studies, MetS and obesity has also been found as an important problem in the long term for ALL survivors after treatment. Saultier et al. 13 found that the cumulative incidence of MetS increased with age in a median of 16 years after diagnosis, and Nottage et al. 14 showed that cardiovascular risk and MetS frequency were higher in cohorts with long-term follow-up than those with short-term follow-up.
MetS, obesity, and IR frequency in survivors have been reported to change according to the treatment regimens. Some studies have reported higher rates of obesity in survivors receiving CRT.15,16 Conversely, the frequency of obesity was found to be higher in survivors receiving only CT in other research.17,18 Reisi et al. 19 reported no difference between survivors who did and did not receive CRT in terms of BMI and insulin levels. Trimis et al. 2 assessed MetS in 80 survivors of ALL; the authors found a 2-fold increased prevalence of MetS in patients treated with CT only and a 5-fold increase in patients treated with CT and CRT compared with the normal population. Our study found no difference between survivors who did and did not receive CRT in terms of the frequency of MetS, obesity, and IR (Table 3).
CT and CRT may lead to multiple endocrine disturbances. 20 The underlying mechanisms for weight gain and IR may include various hormone deficiencies, changes in insulin sensitivity and lipid metabolism, inflammatory mediators, adipokines, and reduced physical activity. 21 Hypothalamic-pituitary dysfunction and growth hormone deficiency were seen in both those who received CRT and in those who did not. 22 Hypothalamic-pituitary dysfunction may also lead to hypothalamic dysregulation of food intake control. Increased energy intake and reduced energy expenditure may contribute to obesity. 20
The long-term use of high-dose steroids in CT protocols is one of the important reasons of the development of obesity and IR. 23 In addition, L-Asparaginase affects glucose metabolism and may result in decreased insulin secretion. 23 It has been reported in the literature that the frequency of IR in ALL survivors is between 11% and 52%.4,24 In our study, the frequency of IR was 14%.
Thyroid dysfunction is an important late adverse effect of cancer therapy, particularly following CRT. CT has also lead to thyroid function by affecting the hypothalamus–pituitary–thyroid axis. 25 The frequency of hypothyroidism in ALL survivors was reported by Karakurt et al. 4 as 11.5%, Mohapatra et al. 11 as 18.4%, and Brabant et al. 26 as 5.2%. In our study, the frequency of thyroid dysfunction was found as 8.5%. It has been determined that thyroid dysfunction develops only survivors who receive CT.
The prevalence of changes in lipid profile in ALL survivors is different. However, the prevalence of hypertriglyceridemia is more frequently reported. 27 Morel et al. 28 showed that the frequency of dyslipidemia in childhood ALL survivors was 50% and was characterized by elevated triglyceride levels and LDL cholesterol, as well as decreased HDL cholesterol. Our study showed that 19 (38%) survivors had dyslipidemia and 9 had mixed-type lipid disturbances. In addition, in our study, no difference was found in terms of blood lipid levels between survivors who received CT only and those who received CT plus CRT (Table 3).
OPN has been identified as a key regulatory molecule in many metabolic and inflammatory diseases such as obesity, diabetes, diabetic nephropathy, and cardiovascular disease. 29 Furthermore, studies have suggested that OPN plays a major role in regulating adipose tissue inflammation, IR, and diabetes. 5 However, the results of animal studies remained inconsistent in explaining the relationship between serum OPN concentrations and obesity. In some studies,30,31 significant increases in serum OPN levels were observed in high-fat diet-induced obese mice, whereas in another study, difference in serum OPN levels was not observed in a murine model of diet-induced obesity. 5 It is also reported that serum OPN levels are increased in obese subjects in human studies compared with lean subjects.5,6,32
In our study, serum OPN levels in overweight/obese ALL survivors were lower than normal-weight survivors and control group. Kiefer et al. 5 stated that OPN expression significantly increased in omental and subcutaneous adipose tissue, independent of age and sex, in morbidly obese adults when compared with healthy individuals. The same study demonstrated a correlation between OPN gene expression and BMI, body fat ratio, waist circumference, leptin, insulin, and HOMA-IR index, but no correlation with fasting glucose. 5 They assessed the effect of increased OPN gene expression in fat tissue on plasma OPN concentration and showed that plasma OPN concentrations were 1.7-times higher in morbidly obese patients than in lean control and did not correlate with OPN gene expression in adipose tissue and plasma OPN concentrations. These findings indicate that the specific pathophysiological role of OPN in obesity is mainly found in adipose tissue. 5 By contrast, one recent study found a negative correlation between obesity grade and serum OPN levels in children and that BMI is an independent strong determinant for serum OPN level. A positive correlation has also been found between OPN gene expression level in adipose tissue and BMI and HOMA-IR index. This study suggested that because there was no correlation between OPN levels in circulation and OPN gene expression in adipose tissue, unknown factors other than adipose tissue may affect systemic OPN levels. 33
Our study demonstrated that serum OPN levels were lower in overweight/obese survivors when compared with normal-weight survivors and healthy children (Table 4). Additionally, there was a strong negative correlation between serum OPN levels and BMI, waist and hip circumference, fasting insulin, and HOMA-IR index. Our results showed that the serum OPN profile of children may be different from that of adults in MetS-related processes, such as obesity and IR. You et al. 7 found that serum OPN levels significantly decreased in obese adolescents who lost weight with exercise, and found there was a negative correlation between serum OPN levels and body fat ratio at body fat percentages >33%. These results suggest that serum OPN levels are mostly regulated by OPN released from other tissues, which implies that there is no correlation between elevated OPN expression in adipose tissue and serum OPN levels.
OPN is important in bone turnover and activation of the resolution cascade. 34 However, the relationship between bone metabolism and serum OPN levels is not clear. It has been suggested that changes in the bone mineral density associated with age are likely to be associated with serum OPN levels. 35 In contrast to obese adults, low serum OPN levels in obese children suggest that serum OPN levels are influenced by physiological processes, such as childhood-specific growth and development patterns.
The limitations of our study include the heterogeneity of the study group and the small sample size. In addition, we were unable to evaluate MetS frequency in 11 children because of their young age.
Conclusion
There is an inverse relationship between anthropometric measurements and IR and serum OPN levels in children. Survivors of childhood ALL are at high risk for the development of MetS and its components in the early post-treatment period. To protect these individuals from future possible cardiovascular diseases that may develop, it may be appropriate to recommend a healthy lifestyle that includes regular exercise and good eating habits.
Footnotes
Acknowledgment
This study was supported by the Eskişehir Branch of the Turkish Pediatric Association (project no.:2016/3).
Author Disclosure Statement
No competing financial interests exist.