
Abstract
This brief report describes the burden of cancer among adolescents and young adults (AYAs), aged 15–39 years, in Massachusetts from 2004 to 2014 using data from the Massachusetts Cancer Registry and Registry of Vital Records and Statistics. In Massachusetts, 4.6% of cancer cases and 1.3% of cancer deaths occurred among AYAs. The incidence rate of cancer among AYAs was 77.6 cases per 100,000 and the mortality rate was 8.0 deaths per 100,000. The incidence rates of melanoma and Hodgkin lymphoma have been decreasing annually. The incidence rate of thyroid cancer has been increasing for females aged 15–24 years and males aged 25–39 years.
Introduction
C
In the United States, the incidence of cancer among AYAs increased from 1975 to 2000, including a rise in colorectal cancer among young adults.1,10 This study aims to examine trends in cancers among AYAs using data from the Massachusetts Cancer Registry (MCR) for 2004–2014. Massachusetts is a unique state to examine due to its mandatory health insurance since 2006. As a result, only 3.3% of the population younger than 65 years did not have health insurance in 2015. 11 While the Affordable Care Act helped reduce the number of uninsured young adults in the United States more recently, using data from Massachusetts allows us to look at trends in AYA cancers in a population where there are high levels of insurance coverage and reduced barriers to accessing care, resulting in better ascertainment of AYA cancer rates. 12
Methods
Data on primary incident cancer cases in Massachusetts came from the MCR. The MCR is part of the Massachusetts Department of Public Health and has been collecting cancer data since 1982. The North American Association of Central Cancer Registries has estimated that the MCR case ascertainment is >95% complete. 13 Information on new cancer cases diagnosed from 2004 to 2014 was obtained from the MCR for AYAs aged 15–39 years at diagnosis. The cancers were identified and grouped based on the AYA site recode/WHO 2008 groupings. 14 Data on cancer deaths occurring from 2004 to 2014 for AYAs came from the Massachusetts Registry of Vital Records and Statistics (MRVRS). The MRVRS has legal responsibility for collecting reports of death on Massachusetts residents. We categorized cancer deaths among AYAs using the ICD-10 codes C18-21, C43-33, C46.1, C49-50, C53-56, C62, C70-73, C81-85, and C91-95. For deaths from germ cell and trophoblastic neoplasms, we restricted to the testis and ovary since histology was not available in the MRVRS and most incident cancer cases occurred in the gonads (92%). The MCR and MRVRS were not linked for this analysis.
Cancer numbers, percentages, incidence rates, and mortality rates were calculated overall, by gender, 5-year age groups, and race/ethnicity for all cancers combined and the top cancer sites. Age groups were dichotomized into younger (ages 15–24 years) and older (ages 25–39 years) groups. Rates were age standardized to a truncated version of the 2000 U.S. standard population using 5, 5-year age categories. Incidence and mortality rates for cancers with <10 cases or deaths are not shown. To assess trends, we used joinpoint regression to calculate the annual percent change (APC) and perform hypothesis tests. 15 All other statistical analyses were performed using SAS 9.3 (SAS Institute, Inc., Cary, NY). Results were considered statistically significant if p < 0.05 or if the 95% confidence intervals (CIs) of the rates did not overlap.
Results
Incident cancers overall
In Massachusetts, of the 392,042 incident cancer cases diagnosed from 2004 to 2014, 18,094 (4.6%) were diagnosed among AYAs. The most common cancers among AYAs were thyroid, breast, melanoma of skin, germ cell and trophoblastic, and Hodgkin lymphoma (Table 1). These accounted for 58% of cancers among this age group. The incidence rate of cancer in AYAs was 1.6 times higher among females, 6.4 times higher among the oldest (35–39 years old) than the youngest group (15–19 years old), and 1.3 times higher among non-Hispanic whites than non-Hispanic blacks. The incidence rate of melanoma of the skin decreased by 3.9% annually from 2004 to 2012 (95% CI: −6.1% to −1.7%; p = 0.006), after which the incidence rate decreased without statistical significance by 17.1% annually from 2012 to 2014 (95% CI: −36.4% to 8.2%; p = 0.14) (Fig. 1a). The incidence rate of Hodgkin lymphoma decreased by 1.8% annually from 2004 to 2014 (95% CI: −3.2% to −0.5%; p = 0.014).
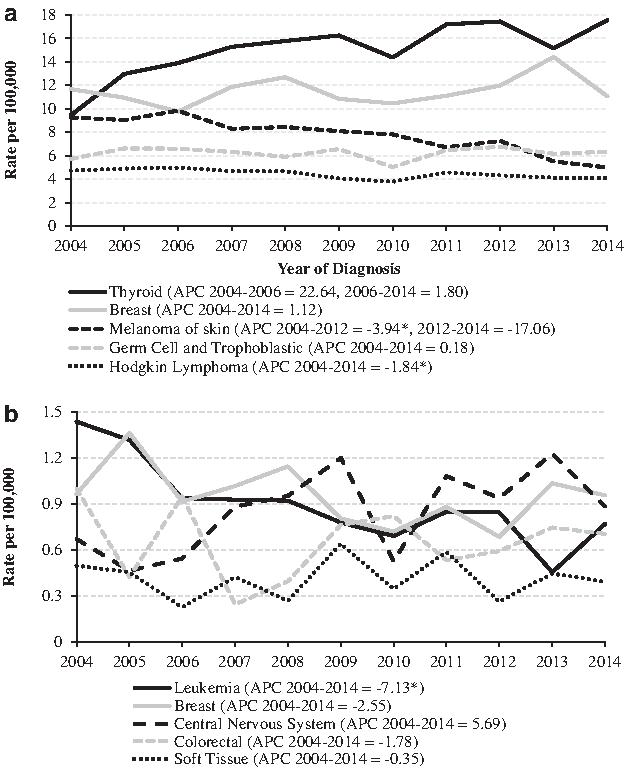
Trends in the truncated age-adjusted incidence and mortality rates per 100,000 of cancer in Massachusetts among AYAs aged 15–39 years, 2004–2014.
Rates are per 100,000; numbers may not add up due to missing gender or unknown race/ethnicity; non-Hispanic American Indians not shown since numbers were too small; cells with <10 cases not shown; rates are age standardized to a truncated population from the 2000 U.S. census; age-specific rates are shown for each age group.
CI, confidence interval.
Incident cancers among 15–24-year-olds
The cancers with the highest incidence rates among males aged 15–24 years were germ cell and trophoblastic neoplasms (7.3 cases per 100,000 males), Hodgkin lymphoma (4.2), and leukemia (3.3) (Table 2). From 2004 to 2014, the incidence rate of central nervous system cancers among males aged 15–24 years increased by 5.0% annually (95% CI: 0.2% to 10.0%; p = 0.043).
Rates are per 100,000; incidence rates are crude age-specific rates per 100,000; multiple annual percent change values are shown when the regression indicated a statistically significant breakpoint.
APC, annual percent change; CI, confidence interval.
The cancers with the highest incidence rates among females aged 15–24 years were thyroid cancer (9.7 cases per 100,000 females), Hodgkin lymphoma (4.8), and melanoma of the skin (4.3). From 2004 to 2014, the incidence rate of thyroid cancer among females aged 15–24 years increased annually by 5.3% (95% CI: 1.7% to 9.0%; p = 0.009). From 2004 to 2008, the incidence rate of melanoma among females aged 15–24 years increased by 7.6% annually without statistical significance (95% CI: −9.9% to 28.4%; p = 0.35), but then decreased from 2008 to 2014 by 18.2% annually (95% CI: −27/4% to −7.9%; p = 0.006).
Incident cancers among 25–39-year-olds
The cancers with the highest incidence rates among males aged 25–39 years were germ cell and trophoblastic neoplasms (14.8 cases per 100,000 males), melanoma of the skin (7.9), and thyroid cancer (7.3) (Table 2). From 2004 to 2014, the incidence rate of thyroid cancer among males aged 25–39 years increased by 5.8% annually (95% CI: 1.5% to 10.3%; p = 0.013). From 2004 to 2014, the incidence rate of melanoma among males aged 25–39 years decreased by 5.3% annually (95% CI: −7.9% to −2.7%; p = 0.001), and the incidence rate of non-Hodgkin lymphoma decreased by 2.7% annually (95% CI: −5.1% to −0.2%; p = 0.037).
The cancers with the highest incidence rates among females aged 25–39 years were breast cancer (34.7 cases per 100,000 females), thyroid cancer (33.5), and melanoma of the skin (13.5). From 2004 to 2006, the incidence rate of thyroid cancer among females aged 25–39 years increased by 29.6% annually (95% CI: 7.2% to 56.6%; p = 0.015), but then remained constant from 2006 to 2014 (APC = 0.05%; 95% CI: −1.7% to 1.8%; p = 0.95). The incidence rate of melanoma decreased by 4.4% annually (95% CI: −7.5% to 1.3%; p = 0.012).
Incident cancers by race/ethnicity
When compared with non-Hispanic blacks aged 15–39 years, non-Hispanic whites had statistically significantly higher incidence rates of thyroid cancer (15.9 vs. 9.1 cases per 100,000, respectively), germ cell and trophoblastic neoplasms (7.4 vs. 1.5), and Hodgkin lymphoma (5.1 vs. 2.6) (Table 1). Non-Hispanic whites aged 15–39 years had similar incidence rates of breast cancer as non-Hispanic blacks (12.0 vs. 12.7, respectively). Of note, Asians aged 15–39 years had incidence rates of thyroid (13.1) and breast cancer (11.1) that were similar to the rates of non-Hispanic whites.
Cancer deaths overall
Of the 143,143 cancer deaths from 2004 to 2014 in Massachusetts, only 1836 (1.3%) occurred among AYAs. The mortality rate of AYA cancers was 8.0 per 100,000 from 2004 to 2014. The cancers with the highest mortality rates among AYAs were leukemia (0.9 per 100,000), breast (0.96), central nervous system (0.85), colorectal (0.65), and soft tissue cancers (0.41) (data not shown). These accounted for 47% of cancer deaths among AYAs. The mortality rate of cancer in this age group was similar among genders and race/ethnicities. The trend in cancer deaths differed somewhat by age group and gender; however, due to the small number of deaths, we are only showing aggregate numbers and these rates should be interpreted with caution. The mortality rate of leukemia decreased by 7.1% annually (95% CI: −10.5% to −3.7%; p = 0.0013) from 2004 to 2014. There were no statistically significant trends for the mortality rates of any other common causes of death among AYAs (Fig. 1b).
Discussion
In Massachusetts, the most common cancers among AYAs were thyroid, breast, and melanoma of the skin, and incidence rates varied by age and gender. Overall, the incidence rates of melanoma and Hodgkin lymphoma have decreased from 2004 to 2012 and from 2004 to 2014, respectively. While no statistically significant trends in mortality rates were seen for 2004–2014, other than a decreasing mortality rate of leukemia, this may be due to the small number of cancer deaths occurring in this population.
Trends in the incidence rates of cancer among AYAs in Massachusetts generally agree with trends seen in the United States. 16 In Massachusetts, the incidence rate of melanoma and Hodgkin lymphoma has been decreasing, and the incidence rate of thyroid cancer has increased among males aged 25–29 years and females aged 15–24 years. The reasons for these trends in AYA cancers are not fully known and need to be further examined. 16 The decrease in Hodgkin lymphoma may be due to changes in risk factors; however, Hodgkin lymphoma among AYAs tends to be negative for Epstein–Barr virus and the nodular sclerosis subtype making identifying risk factors more difficult.16–19 For the increase in thyroid cancer, it is possible that it is due to increased screening; however, this has not been studied much in the AYA population.16,20 Another study found that larger tumors in the younger population have been increasing over time, so a change in screening is not likely to be the only explanation. 21 We were unable to examine data on subtypes and tumor sizes in this study due to limited numbers by cancer sites and age group.
The incidence rate of melanoma has been decreasing in Massachusetts from 2004 to 2014. A study on melanoma in the United States found that the incidence rate of melanoma decreased by 3% annually from 2004 to 2012 among non-Hispanic whites aged 15–29 years, while non-Hispanic whites aged 30–49 years have seen stabilizing incidence rates of melanoma. 22 It is possible that this decreasing incidence rate may reflect better sun protection and less tanning bed use by teens; however, this association has not yet been studied. 23 The decrease could be due to underreporting of melanoma in the cancer registry; however, we do not believe this is the reason for the decreasing rates. Finally, the decrease could be due to a higher rate of in situ melanomas resulting in a decreasing rate of invasive melanomas; however, we are unable to assess this as in situ melanomas are likely underreported in the registry.
While a recent study found an increase in the incidence rate of colorectal cancer among young adults, we did not find a statistically significant increase among males or females aged 25–39 years. 10 However, the incidence rate of colorectal cancer in Massachusetts has increased from 2004 to 2014 (males 1.32%, females 2.31% annually for ages 25–39 years) without statistical significance. This could be due to the smaller sample size of Massachusetts or the result of a slower growth in colorectal cancer incidence rates in Massachusetts.
This study is subject to a number of limitations. Data on cancer incidence may be underreported in areas of Massachusetts close to neighboring states. However, the MCR has a reciprocal agreement with 41 states that helps reduce the problem of underreporting. The rates of melanoma may be underreported due to the lack of complete data from nonhospital reports. It seems unlikely that the rate of underreporting has increased from 2004 to 2014, so we do not believe that the decrease in melanoma rates is due solely to underreporting. Due to the small number of cancer deaths and incident cancers among AYA subgroups, differences in rates may be due to chance, and caution should be used when interpreting findings with smaller sample sizes. The information on cancer deaths did not include any histology data. The cancer death ICD-10 codes used did not include nongonadal sites for germ cell and trophoblastic tumor deaths, so these numbers may be underestimates. Finally, the MCR does not contain any risk factor information for these cancers, and so, we are unable to fully understand the reasons for these trends with this data set alone.
This study found that the distribution of cancers among AYAs varies by age and gender in Massachusetts. The decreasing incidence rates of melanoma and Hodgkin lymphoma and increasing incidence rate of thyroid cancer should be further examined to understand the factors behind these trends. Public health officials and healthcare providers should be aware of these trends and use them to help improve early detection and the standard of care for AYA cancers.
Footnotes
Acknowledgments
We thank Nancy Weiss for her help in editing this article and Richard Knowlton for his help with the data. We acknowledge the funding sources from Harvard T.H. Chan School of Public Health: R25 CA 98566-10, T32 CA 009001-40, and T32 ES 007069. This journal article was supported by the Grant or Cooperative Agreement Number, NU58D006271-01-00, funded by the Centers for Disease Control and Prevention. Its contents are solely the responsibility of the authors and do not necessarily represent the official views of the Centers for Disease Control and Prevention or the Department of Health and Human Services.
Author Disclosure Statement
The authors do not have any conflicts of interest and no competing financial interests exist.