
Abstract
Objective:
Analyze cancer mortality and trends among adolescents and young adults (AYAs) according to the population size of Brazilian municipalities.
Methods:
Ecological study on cancer mortality time trends between 1996 and 2012. Brazilian municipalities were stratified according to the number of inhabitants: ≤49,999; 50,000–99,999; 100,000–499,999; and ≥500,000. Death data were collected from the Mortality Information System. Time trends were estimated with the Joinpoint Regression Program.
Results:
Age-standardized cancer mortality rates for AYAs according to the population size of the municipality were: 4.5/100,000 (1996) and 6.1/100,000 (2012) for municipalities with under 49,999 inhabitants; 5.5/100,000 (1996) and 5.8/100,000 (2012) for municipalities with 50,000–99,999 inhabitants; 6.6/100,000 (1996) and 6.9/100,000 (2012) for municipalities with 100,000–499,999 inhabitants; and 7.3/100,000 (1996) and 7.8/100,000 (2012) for municipalities with ≥500,000 inhabitants. An increasing mortality time trend was detected in municipalities with under 49,999 inhabitants (average annual percentage change [AAPC]: 2.0%) and for the country overall (AAPC: 0.7%). Mortality increased in small municipalities of the North, Northeast, and Midwest regions.
Conclusion:
Cancer mortality among AYAs, according to the population size of Brazilian municipalities, was high in municipalities with under 49,999 inhabitants and unequal across Brazil for all tumors.
Introduction
In 2018, global age-standardized cancer mortality (World population) rates among adolescents and young adults (AYAs; aged 15–29 years) were estimated to be 7.3/100,000 in men and 6.6/100,000 in women. 1 Variations in cancer mortality patterns among AYAs were observed in Australia, 2 United States, 3 and Japan. 4 Malignant neoplasms in AYAs are rare events, 5 which can hinder diagnosis and access to specialized treatment. 6
In Brazil, estimated age-standardized cancer mortality (World population) rates varied between 8.1 and 6.8/100,000, respectively, in men and women. 1 Socioeconomic inequalities have been associated with cancer incidence and mortality patterns around the world,7–11 which is also verified in Brazil12,13 and its geographic regions.14,15
Analysis of mortality in large geographic areas can smooth or hide disparities when municipalities with different population sizes are considered. The 2010 demographic census revealed socioeconomic differences in Brazilian municipalities according to the population size, such as more rural areas in smaller municipalities (up to 50,000 inhabitants) and more urban areas in larger municipalities (over 500,000 inhabitants). The nominal total monthly income per capita in small municipalities was half of that observed in larger municipalities. Illiteracy rates were four times higher in smaller municipalities when compared with larger municipalities. 16 Studies have already highlighted unequal distribution of specialized health assistance, which is related to these characteristics and more pronounced in larger urban centers.17–19
Delay in diagnosis and treatment can be related to the main cause of mortality and can be employed as a good indicator to describe these disparities. A systematic review that included 117 studies analyzed opportunistic cancer diagnosis and favorable outcomes and evidenced favorable outcomes for breast, colorectal, head and neck, testis, and melanoma cancers despite the heterogeneity of the studies. 20
Identification of AYA cancer mortality patterns in Brazil according to the population size has not been investigated yet, nor the mortality trends, and therefore, the objectives of this study are to describe AYA cancer mortality patterns in Brazil according to the population size of Brazilian municipalities and describe the time elapsed between diagnosis and beginning of treatment.
Methods
A study on the temporal series for cancer mortality (except nonmelanoma skin cancer [C44]) is presented herein, considering AYAs aged 15–29 years. The analysis period was 1996–2012. Data on cancer-related deaths were extracted from the Mortality Information System (available at www2.datasus.gov.br/DATASUS/index.php?area=0205&id=6937) and demographic data were available at www2.datasus.gov.br/DATASUS/index.php?area=0206&id=6942 Neoplasms were codified according to the International Statistical Classification of Diseases and Related Health Problems, 10th Revision, 21 and deaths were grouped into 25 cancer sites (lip oral cavity and pharynx [C00–14]; esophagus [C15], stomach [C16]; colon, rectum, and anus [C18–21]; liver and biliary passages [C22–24]; pancreas [C25]; larynx [C32]; lung, trachea, and bronchus [C33–34]; bone [C40–41]; melanoma of skin [C43]; mesothelioma [C45]; breast-female [C50]; cervix uteri [C53]; corpus uteri [C54]; ovary [C56]; prostate [C61]; testis [C62]; kidney and renal pelvis [C64–65]; bladder [C67]; brain and central nervous system [CNS; C70–72]; thyroid [C73]; Hodgkin lymphoma [C81]; non-Hodgkin lymphoma [C82–86, C96]; multiple myeloma [C88, C90]; leukemia [C91–95]); unspecified malignant neoplasms (C76, C80); and all cancers excluding nonmelanoma skin cancer (C00–96/C44). 22
Municipalities were stratified into four groups according to the size of the population 16 : ≤49,999 inhabitants, 50,000–99,999 inhabitants, 100,000–499,999 inhabitants, and ≥500,000 inhabitants.
Absolute and relative frequencies were described and crude mortality rates were calculated (Supplementary Tables S1 and S2) per 100,000 inhabitants. Age-standardized incidence rates were calculated using Segi's world standard population (age-standardized rate [ASR]), as modified by Doll, 23 according to sex, geographic region, cancer sites, and population size.
The average annual percentage change (AAPC) was calculated to identify mortality trends. AAPC is the weighted average of the angular coefficients of the regression line, with weights equal to the length of each segment throughout the interval. An increase or decrease in trend is statistically significant when different from 0 (p ≤ 0.05) and stable when equal to 0 (p > 0.05). 24 Trend analysis was carried out by linear regression using the Joinpoint Regression Program, version 4.5.0.1 of June 2017, from the Surveillance, Epidemiology and End Results program (SEER) of the National Cancer Institute. 25
The proportional distribution of the number of hospitals that offer cancer treatment was compared with the proportion of municipalities, overall population, and AYA population (for year 2010), according to population size, testing for equality of proportions.
Data from the Integrated Hospital Cancer Registry, available at https://irhc.inca.gov.br/RHCNet by the National Cancer Institute, provided the median number of days elapsed between the date of diagnosis and beginning of treatment. These time periods were compared for the trienniums before (2010–2012) and after (2013–2015) sanction of the law 12732/2012 (which requires cancer treatment to start up to 60 days after diagnosis for Brazilian states and the Federal District) for the AYA population. Cases with treatment date before the diagnosis date or date not available were excluded. The medians were calculated along with maximum and minimum values, and the Wilcoxon signed-rank test with continuity correction was applied. These analyses were carried out using the RStudio software.
This study was approved by the Research Ethics Committee of the Federal University of Goiás under protocol number 055291/2013.
Results
In Brazil, in 2010, the population was distributed across 5565 municipalities, where 33.5% of the Brazilian population resided in municipalities with ≤49,999 inhabitants and 29.3% resided in municipalities with ≥500,000 inhabitants. In this period, AYA population distribution was 33.1% (n = 16,997,284) in municipalities with ≤49,999 inhabitants and 20.2% (n = 15,000,097) in municipalities with ≥500,000 inhabitants. Municipalities with 50,000–99,999 inhabitants presented the smallest AYA population (11.9%; n = 6,096,337) (Table 1).
Distribution According to Municipality by Population Size: Brazil, 2010
Source: Brazilian Institute of Geography and Statistics.
Between 1996 and 2012, there were 55,410 deaths due to malignant neoplasms in Brazil among AYAs (15–29 years). Of these, 29,654 (53.5%) occurred in males (Table 1). The majority of deaths occurred due to leukemia (21.1%); brain and CNS cancers (13.6%); non-Hodgkin lymphoma (7.7%); bone (7.2%); and colon, rectum, and anus (3.7%) cancers. Relative frequencies of cancer sites as the cause of death in AYAs did not vary substantially by population size of municipality (Fig. 1).
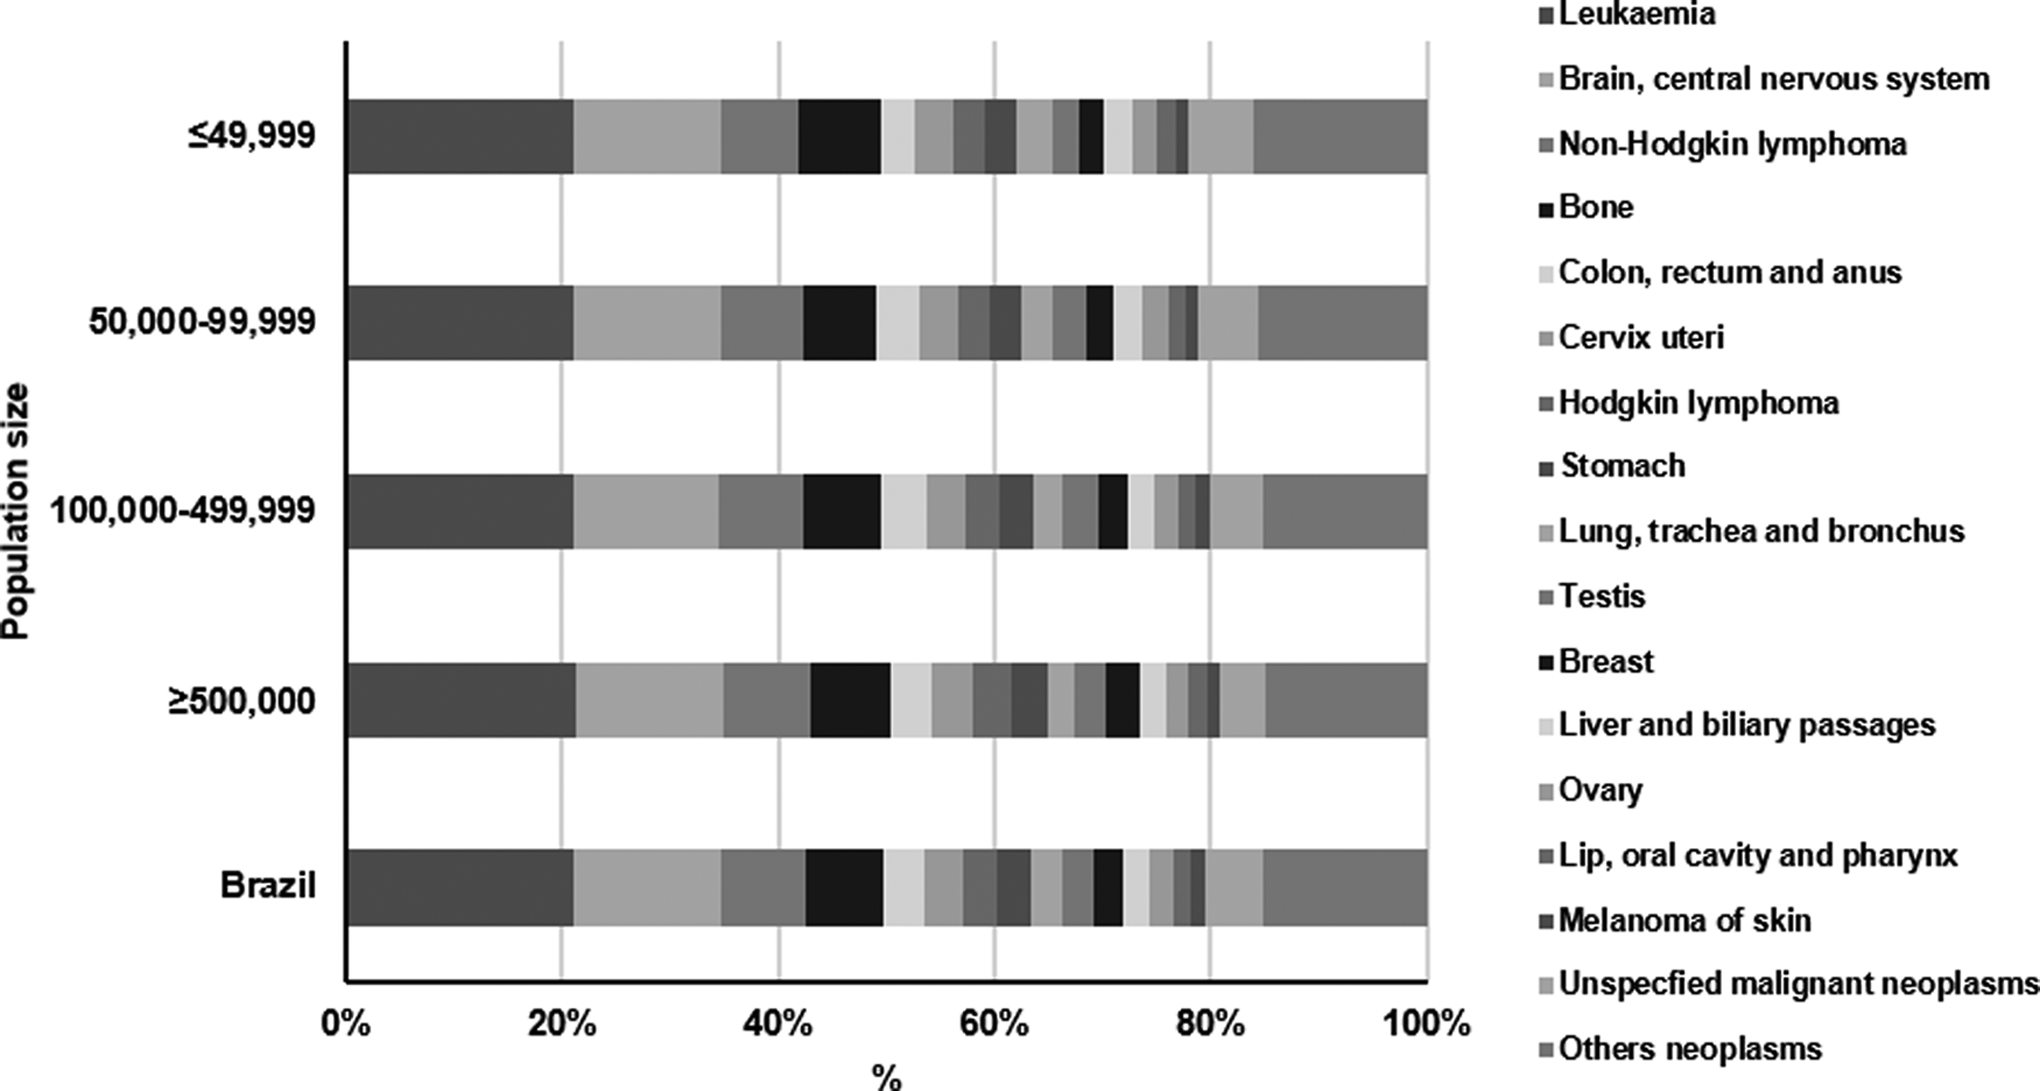
Proportional distribution of cancer mortality (except nonmelanoma skin cancer) in AYAs (14–29 years) by population size. Brazil, 1996–2012. AYAs, adolescents and young adults.
In Brazil, mortality rates according to the municipality size varied between 4.5 and 7.3/100,000 in 1996 and between 6.1 and 7.8/100,000 in 2012 for small (≤49,999 inhabitants) and large (≥500,000 inhabitants) municipalities, respectively. The highest rates were observed in municipalities with ≥500,000 inhabitants. The lowest mortality rates occurred in the Northeast region, 4.4/100,000 (1996) and 6.4/100,000 (2012). The highest mortality rates were verified in the North region in municipalities with ≥500,000 inhabitants, 11.7/100,000 (1996) and 12.1/100,000 (2012) (Table 1).
Cancer treatment was offered by only 2.0% of hospitals in municipalities with ≤49,999 inhabitants, 7.8% of hospitals in municipalities with 50,000–99,999 inhabitants, 45.4% of hospitals in municipalities with 100,000–499,999 inhabitants, and 44.8% of hospitals in municipalities ≥500,000 inhabitants (p < 0.001). Cancer treatment in specialized hospitals was concentrated in the South and Southeast regions (Figs. 2 and 3).
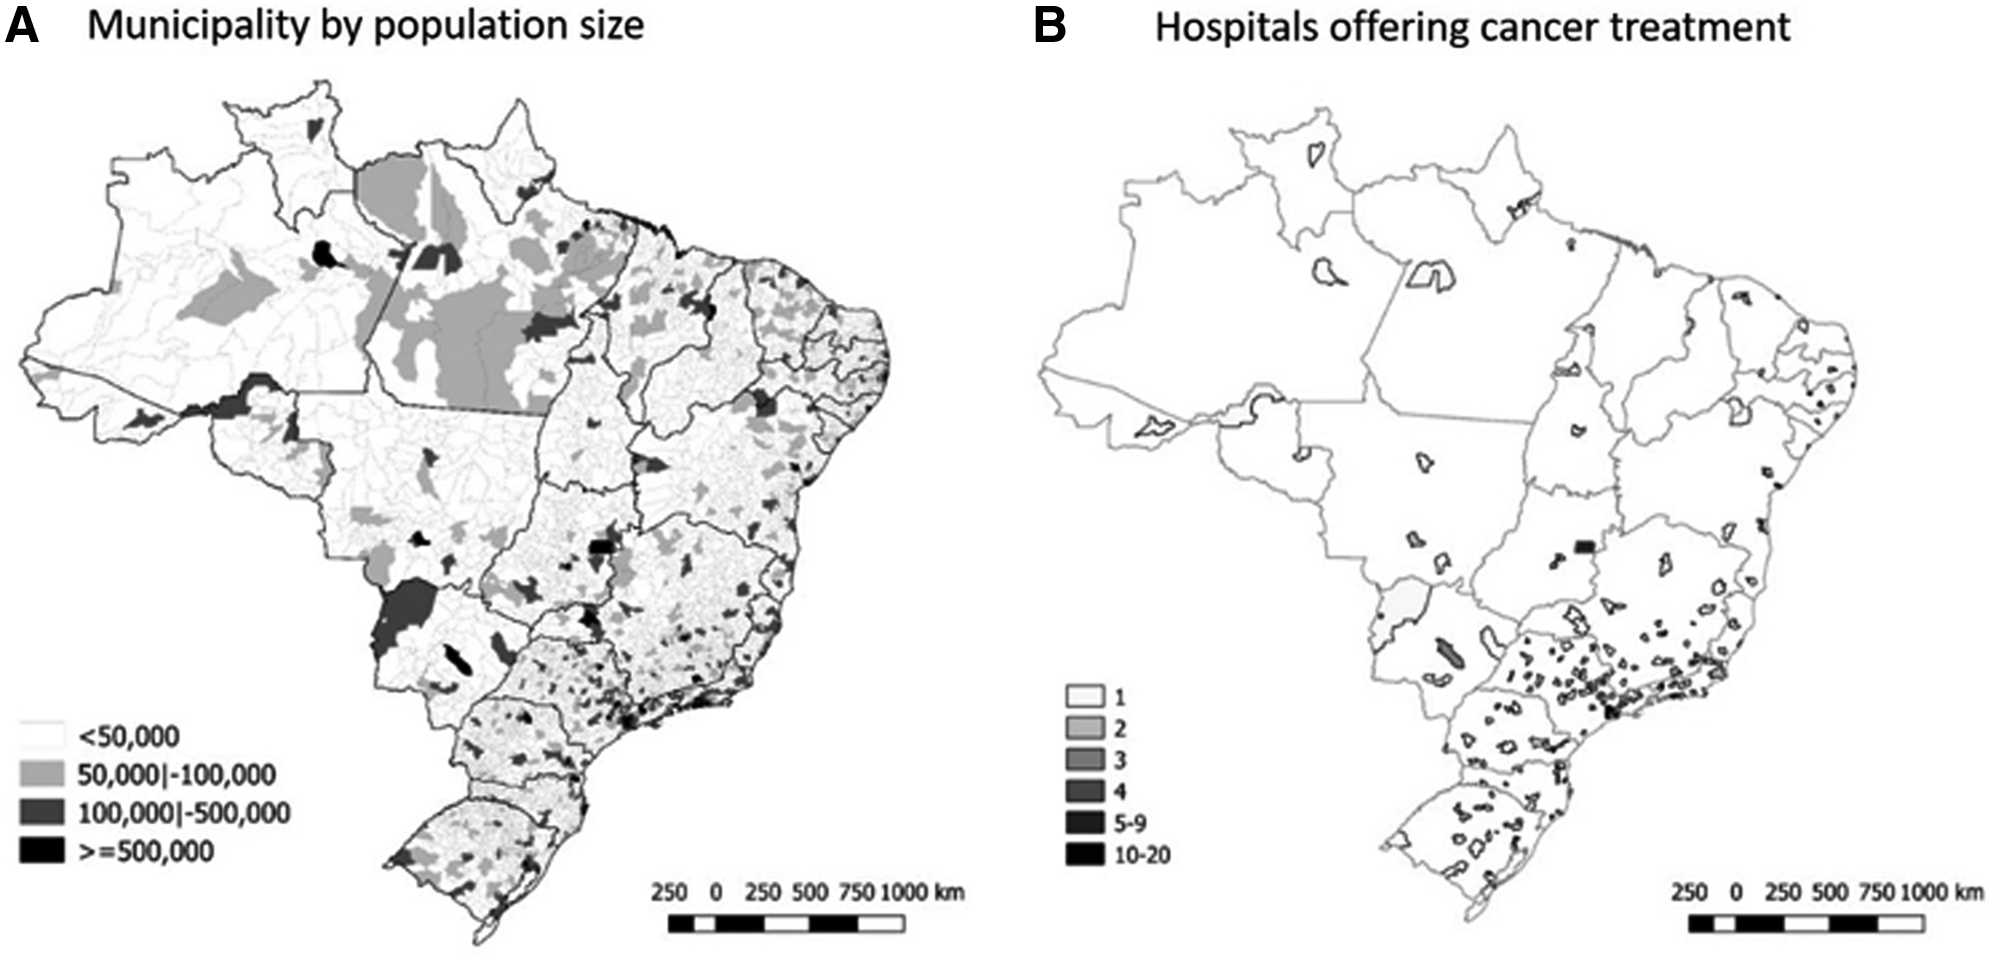
Distribution of municipalities by population size
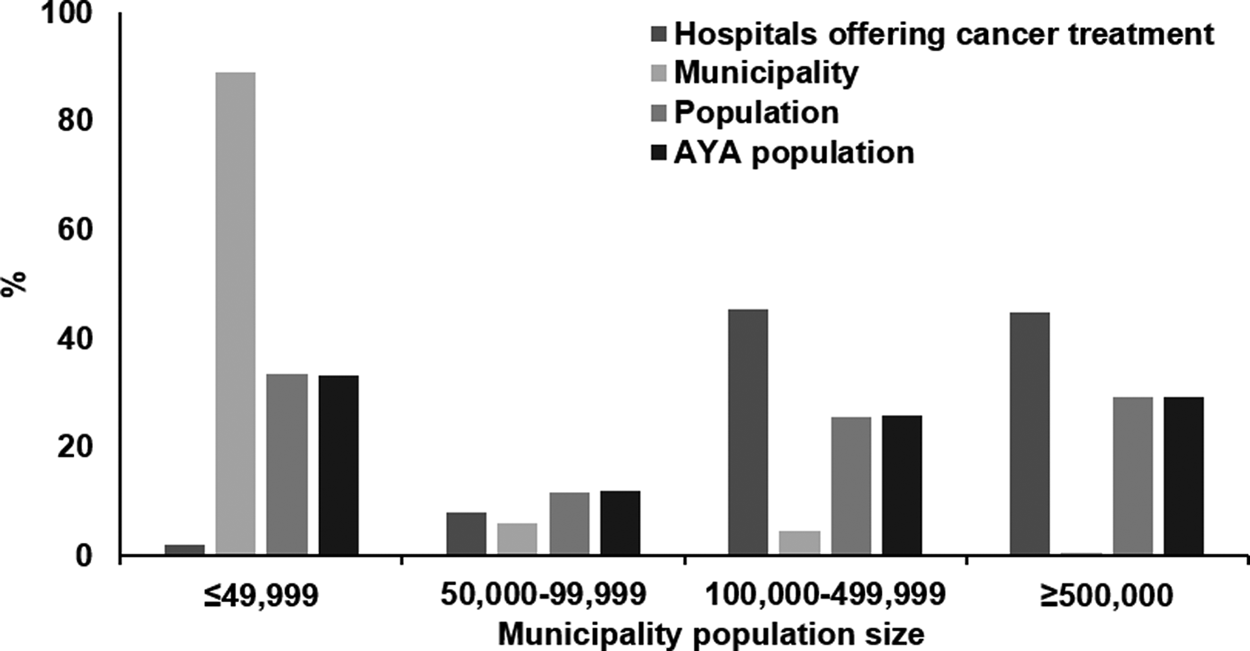
Proportional distribution of the number of hospitals that offer cancer treatment, municipalities, population, and AYA population by municipality population size.
Cancer mortality ASR according to population size varied between 4.9 and 8.0/100,000 in 1996 and between 6.5 and 8.4/100,000 in 2012 for males. For females, rates varied between 4.1 and 6.6/100,000 in 1996 and between 5.6 and 7.3/100,000 in 2012. These differences in mortality rates per sex, always higher for males, were maintained independently of the size of the municipality in Brazil. By geographic region, the difference in mortality rates between males and females was negligible in the North, small in the Northeast, moderate in the Southeast, and considerably larger in the South and Midwest regions (Table 2).
Age-Standardized Cancer (Excluding Nonmelanoma Skin Cancer) Mortality Rates in Adolescents and Young Adults (15–29 Years) According to Municipality by Population Size, Region, and Sex: Brazil, 1996–2012
In bold: statistically significant difference (p < 0.05).
95% CI, 95% confidence interval; AAPC, Average Annual Percent Change; ASR, age-standardized rate.
There was an increased cancer mortality temporal trend in municipalities with under 49,999 inhabitants in the North (AAPC: 6.5%), Northeast (AAPC: 4.6%), and Midwest (AAPC: 2.4%) regions. Increasing mortality time trends were detected in municipalities with 50,000–99,999 and 100,000–499,999 inhabitants in the Northeast and in municipalities with over 500,000 inhabitants in the Southeast region. Decreasing mortality time trends were observed in municipalities with 100,000–499,999 inhabitants in the South (Table 2 and Supplementary Fig. S1).
Brazilian cancer mortality time trends among AYAs presented differences according to the population size of the municipality considered. In Brazil, for all population sizes, there was an increase in mortality for bone; colon, rectum, and anus; cervix uteri; testis; breast; and lip, oral cavity, and pharynx cancers. However, the observed increase in testis cancer mortality must be highlighted in most municipalities, except for those with 100,000–499,999 inhabitants (Table 3).
Age-Standardized Cancer (Excluding Nonmelanoma Skin Cancer) Mortality Rates in Adolescents And Young Adults (15–29 Years) According to Cancer Group and Municipality by Population Size: Brazil, 1996–2012
In bold: statistically significant difference (p < 0.05).
Data are not available for all years.
ASR <0.01/100,000.
ICD10, International Classification of Diseases, 10th Revision.
Between 2010 and 2015, 48,947 cancer cases were registered. Of these, 14.1% (6888 cases) were excluded according to exclusion criteria. In the period before the 60-day law (2010–2012), when considering the 22,919 cases included, the median for beginning treatment after diagnosis was 38 days (minimum: 2 days; maximum: 281 days). In the period after implementation of the law (2013–2015), considering the 19,140 cases, the median was 36 days (minimum: 0 days; maximum: 97 days). There was no statistically significant difference in the beginning of cancer treatment in the two analyzed periods (p = 0.124), as shown in Figure 4.
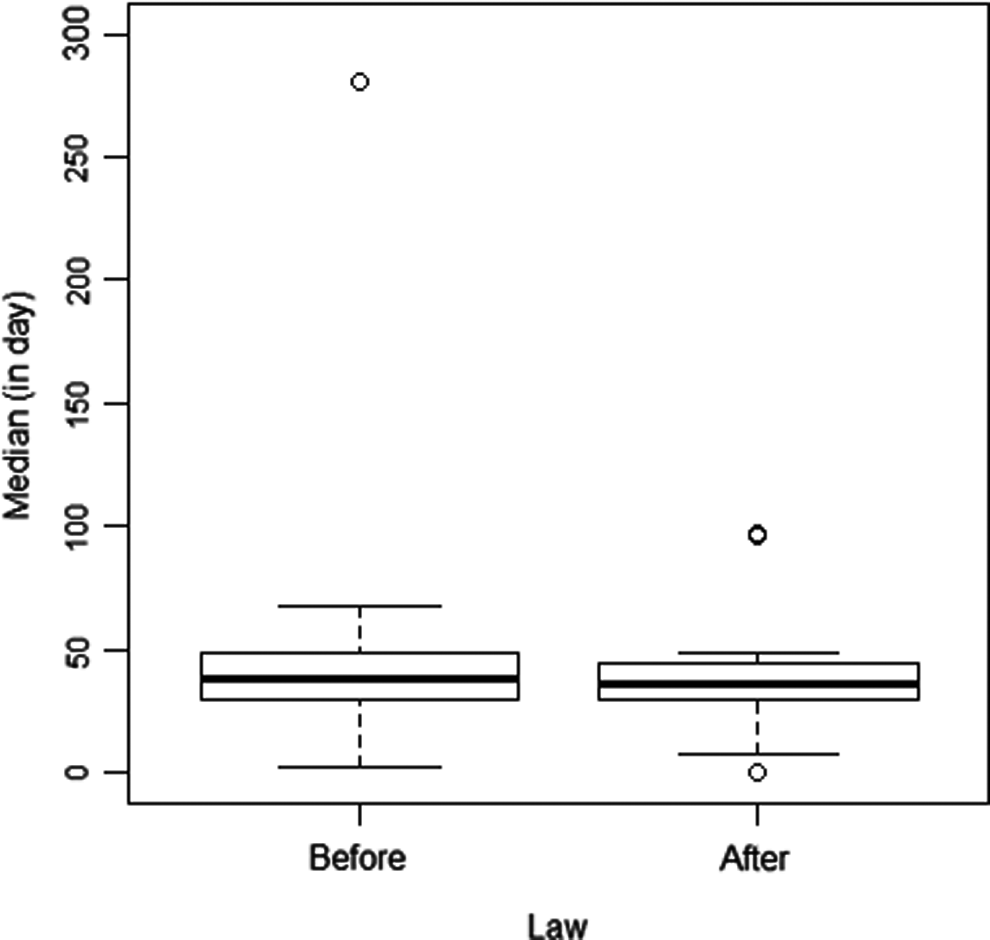
Median number of days between diagnosis and beginning of cancer treatment in AYAs (15–29 years), before and after enforcement of the 60-day law on the beginning of cancer treatment, in Brazilian states and the Federal District. o, outliers.
Discussion
The results presented herein show that cancer mortality rates among AYAs in Brazil were higher in males, and these results were similar to those found in the United States. 26 Leukemia, lymphomas, and CNS tumors presented the highest mortality rates in AYAs, for both sexes, in Brazil. 15 It is estimated that the new treatment approaches avoided more than 45,000 cancer-related deaths in adolescents between 1975 and 2010, in the United States, due to acute lymphoblastic and acute myeloid leukemia, Hodgkin and non-Hodgkin lymphomas, neuroblastoma, and CNS cancers. 27
Leukemia-related deaths were, proportionally, more common in AYAs, independently of the population size of Brazilian municipalities. Our data indicate stable mortality rates for leukemia, independently of the size of Brazilian municipalities. Globally, leukemia is the main cause of death in AYAs, with higher frequency in men. 28 In Latin America, mortality rates for leukemia increased for both sexes in Mexico (15–24 years), with a decrease in Argentina in males and females, and remaining stable in Brazil for both sexes. 29 In Brazil, between 1980 and 2002, there was a drop in leukemia-related mortality for both sexes and negative significant correlations were identified with social inequality in both sexes. 30 The factors associated with mortality reduction are efficacy of treatment and socioeconomic level.31,32
In Brazil, mortality was higher for lymphomas in males and increased with age, doubling in the age group of 20–24 years in comparison with adolescents. 26 Herein, stability was observed for Hodgkin lymphoma mortality, except in large municipalities. In Australia 2 as well as Japan, 4 there was a reduction in mortality for this neoplasm.
For CNS neoplasms, increasing mortality time trends were detected in small municipalities. There is a clear unequal pattern around the world, with decreasing time trends in Australia 2 and the United States 3 and increasing time trends in Japan. 4
Testis cancer mortality decreased in Chile, Canada, the United States, 33 Australia, 2 and Europe. 34 In Brazil, there was an increase in mortality for all municipalities, except municipalities with 100,000–499,999 inhabitants—this could be related to late diagnosis and lack of access to treatment.
Stability in ovarian cancer mortality could be related to the regular practice of AYAs consulting with gynecologists and undergoing pelvic ultrasounds more frequently. 35
The findings for head and neck, respiratory, and gastrointestinal tract cancers suggest increases in cancer incidence among adolescents, attributable to lifestyle changes36,37 and differences in access to diagnosis, besides rarity in this age group.
An increase in cervix uteri cancer mortality was verified in small (≤49,999 inhabitants) and large (≥500,000 inhabitants) municipalities. Mortality for this type of cancer is unequally distributed even among high-income countries, with increased mortality (4.0%) in Japan (1970–2006) 4 and reduced mortality (6.8%) in Australia. 2 In Brazil (2009–2013), the highest cervical cancer mortality rates among AYAs are in the 25–29 years age group for all regions and higher in the North and Northeast regions. 14 Brazil presents a structured program for monitoring precursor lesions; however, cervical cancer mortality rates remain high. 38 Implementation of measures that broaden the coverage of the HPV vaccine should be reinforced.
It was observed that mortality time trends increased in Brazil for small municipalities, while for the remaining municipalities, AYA mortality was stable. The North and Northeast Brazilian regions presented higher death risk, with an average increase between 1.5% per year and 2.5% per year, respectively. According to Balman, 14 Brazilian cancer mortality rates (1,000,000) between 1999 and 2013 were 13.29 in the age group of 15–19 years, 10.58 in the age group of 20–24 years, and 10.08 in the age group of 25–29 years. Brazil is a large country and there are disparities when comparing small municipalities with small populations in the South with corresponding municipalities in the North and Northeast regions, even for the Amazon region. More pronounced increasing mortality time trends were observed in regions with low offer of medical services for cancer treatment. According to our analysis, the reasons for increased mortality are difficult access and distance from specialized cancer centers and lack of early diagnosis at local community health centers, as shown in Figures 2 and 3.
Access to treatment in specialized cancer centers can favor survival. In Brazil, there are inequities in the distribution of health professionals, doctors, and number of beds across municipalities of the different Brazilian regions. There are also inequalities in the offers of specialized cancer services, with few units and centers qualified by Brazil's publicly funded health system (SUS)—47% of these services are located in the Southeast region. 39 Therefore, there is unequal access to health services in Brazil.40,41
As shown in Figure 2, many small municipalities are far from specialized treatment centers. Access to health services is limited in rural regions where smaller municipalities are concentrated. However, these results are unequal because they are worse for the North and Northeast regions. 42
Evaluation of the 60-day law for beginning treatment after diagnosis did not present differences in the trienniums before and after its sanction among adults and young adults. The time elapsed until treatment starts is essential to understand the mortality rates in the following years. In a systematic review on the delay between the diagnosis date and beginning of treatment, the importance of the delay in starting treatment is stressed, which leads to worse prognosis in cancer patients. 20 Therefore, monitoring the 60-day law is the first step in the evaluation of access to cancer treatment centers.
Differences in the quality of death certificates can also explain results of mortality according to the population size of Brazilian municipalities. Mathers et al. 43 classified the quality of mortality data until year 2000 as average, considering 79% coverage and 20% ill-defined causes of death. However, Balmant et al. 15 identified, for AYAs, reduction in ill-defined mortality between 1979 and 2013 for all Brazilian regions, except the Midwest. For the population aged between 0 and 14 years, there was also a reduction in ill-defined mortality causes. 44 When evaluating the mortality percentage due to ill-defined causes between 1996 and 2012, a reduction was observed (1996: 15.1% and 2012: 6.3% for Brazil). For the population aged between 15 and 29 years, this analysis was carried out as per municipality size and for Brazil overall (1996: 7.0% and 2012: 3.9%), with decreasing percentages according to the size of the population (Supplementary Fig. S2). Brazilian studies suggest stable mortality rates for some diseases, including cancer, due to better coverage of death certificates.45,46 It is important to mention that stable time trends were verified when analyzing the International Classification of Diseases (ICD) related to unspecified malignant neoplasms, independently of the size of the municipality.
Among the limitations of this study, deaths were evaluated according to municipality of residence. However, there can be migration of the family to large urban centers during cancer treatment, as already described in Europe (Italy). 47
In Brazil, census data and intercensus estimations are provided by the Brazilian Institute of Geography and Statistics. Statistical strategies are employed to minimize errors associated with estimations, especially in smaller populations. 48 According to the 2000 and 2010 censuses, there was an increase of 12% in the Brazilian population. 49 Mortality rates were calculated herein on an annual basis to minimize the impact of population growth and according to the size of municipalities.
Despite these limitations, this work studied cancer-related deaths in AYAs according to the population size of Brazilian municipalities and demonstrated that mortality was higher across population sizes. However, the geographic region of residence has an effect on the outcome, as well as the size of the municipality. It is necessary to train professionals in the primary attention for small-sized municipalities, aiming at prevention and early diagnosis for the young adult population.
References
Supplementary Material
Please find the following supplemental material available below.
For Open Access articles published under a Creative Commons License, all supplemental material carries the same license as the article it is associated with.
For non-Open Access articles published, all supplemental material carries a non-exclusive license, and permission requests for re-use of supplemental material or any part of supplemental material shall be sent directly to the copyright owner as specified in the copyright notice associated with the article.