
Abstract
Purpose:
Delays in diagnosis can affect the short-term survival outcomes of adolescent and young adult (AYA) cancer patients. We sought to determine the extent to which delayed diagnosis, health insurance type, and income status are associated with the long-term survival of AYA cancer patients.
Methods:
We reviewed an institutional cohort of 268 patients age 15–29 years who were diagnosed with the most common neoplasms of the AYA population between 2001 and 2003. We grouped patients by the time of onset of cancer symptomatology to verified diagnosis (lagtime to diagnosis; short or long), health insurance type at diagnosis (public or private), zip-code–based median household income (≤U.S. $50,000 or >U.S. $50,000), and demographic variables. Overall survival (OS) and late OS (LOS; the time from the 5-year anniversary of cancer diagnosis to death from any cause) were the outcomes of interest.
Results:
OS and LOS did not differ between those with short or long lagtimes to diagnosis for all cancer and for specific cancer types. Among patients with long lagtimes, those with private insurance had significantly better LOS than those with public insurance (p = 0.03). Compared with those who had public insurance, patients who had private insurance at diagnosis had significantly better LOS (p = 0.008). Patients with household incomes >U.S. $50,000 had better LOS than those with household incomes ≤U.S. $50,000 (p = 0.02). Patients with public insurance and household incomes ≤U.S. $50,000 had the poorest LOS.
Conclusions:
AYA cancer patients with either public health insurance or a low household income at diagnosis are at risk of an inferior LOS.
Introduction
For many types of cancers, adolescent and young adult (AYA) patients have shorter survival durations than pediatric cancer patients.1–3 Previous studies have shown that these survival disparities are likely due to multiple factors, including AYA cancer patients' higher rates of delayed diagnoses and lower rates of clinical trial participation and biospecimen donation for translational research; health care professionals' unfamiliarity with essential aspects of AYA oncology; the distinct distribution and biology of the cancers that most commonly affect AYA patients; and the unique psychosocial, educational, vocational, familial, and financial challenges AYA patients face.4–8
AYA patients who experienced delays in cancer diagnosis, who are un- or underinsured, and those with economic challenges have been found to present with later disease stage at diagnosis.9–14 The impact of each of these factors on AYA patients' long-term survival outcomes remains mostly unknown. 9
We performed an institutional retrospective review to determine the extent to which diagnosis lagtime, income level, and health insurance type are associated with the long-term survival of AYA cancer patients 15–29 years of age. Filling this knowledge gap will allow us to identify the long-standing implications of each of these prevalent elements over time. We understand that some factors under investigation might be more amenable to intervention development by the health care delivery system (i.e., diagnosis lagtime) compared with others, which remain in the realm of health policy (i.e., type of insurance and income). Ultimately, we hope to aid in the development of interventions intended at reducing these adversities that characterize the AYA cancer population.
Methods
Patients
A cohort of 268 patients 15–29 years of age who were diagnosed with cancer between June 2001 and June 2003 at our institution (The University of Texas MD Anderson Cancer Center) were included in the study. The study analysis was reviewed and approved by the Institutional Review Board of MD Anderson Cancer Center. This cohort, identified from our Tumor Registry, was reported previously in an analysis of the impact of health insurance on time to diagnosis (lagtime) from the onset of cancer-specific symptoms or signs. 9
Diagnosis lagtime was defined as the interval (in days) between the onset of an existing malignancy (sign or symptomatology) and the date on which a specific cancer type was pathologically confirmed. The date of first sign or symptom and date of diagnosis were collected for every patient. Patients in the cohort had brain tumors, Hodgkin lymphoma, leukemia, non-Hodgkin lymphoma, thyroid cancer, or bone or soft-tissue sarcomas. The number of primary tumors was established. Disease stage was defined through the Ann Arbor Staging System and the American Joint Committee on Cancer criteria. For further details on staging methodologies, reference the prior article by Martin et al. 9 Patients' demographic data, including self-reported race/ethnicity, sex and age, and current survival status, were obtained from their electronic medical records. Patients' health insurance data had been obtained from billing records at the time of initial cancer diagnosis.
The median annual household income for each patient's zip code of residence had been determined from the U.S. census 2000 data. The cohort did not include international patients who had been excluded owing to the distinct characteristics of their countries' health care systems and travel times to the United States. Self-pay patients (those without health insurance who paid with personal or private funds) or those who were uninsured were excluded from the analysis. Patients without cancer-specific symptomatology were inevaluable for lagtimes and were excluded from the analysis.
Definitions
Overall survival (OS) was defined as the time from the date of cancer diagnosis to the date of death from any cause; patients who are alive at the end of the study according to the data collected are censored at the last follow-up date. Late OS (LOS) 15 was defined as the time from the date of the 5-year anniversary of cancer diagnosis to the date of death from any cause (also known as 5-year conditional survival). 16 Lagtime to diagnosis was operationalized as the number of days from the date of an initial cancer-specific symptom or sign to the date of pathological diagnosis. 9 Patients reporting symptoms as beginning a week, month, or a year ago were provided lagtime values of 7, 30, and 365 days, respectively. If signs or symptoms had initiated in a given month, the midpoint of the month was used. The median lagtime by each cancer type was calculated and used as the threshold for short versus long lagtime calculation.
Health insurance type was defined as private insurance (managed care plans, health maintenance organizations [HMOs], and military), public insurance (state/national programs such as Medicaid, Medicaid HMOs, and county programs), or uninsured and self-pay, which were excluded from the present analysis as described previously. Median annual household income by zip code of residence was classified as low income (≤U.S. $50,000) or high income (>U.S. $50,000). A cutoff of U.S. $50,000 was chosen to define these groups based on previous publications of AYA patients with cancer.17,18
Statistical analysis
The patients' demographic and clinical characteristics, such as age, gender, race/ethnicity, income, and tumor type, were summarized using frequencies and proportions. Differences in the demographic and clinical characteristics between insurance types (private vs. public) were assessed using Fisher's exact test. Lagtimes were summarized using mean with standard deviation (SD), as well as median with range, for each of cancer types and the entire cohort. Binary lagtimes type (long vs. short) were defined with reference to the median of lagtimes of each cancer type, and was summarized using frequencies and proportions. The Kaplan–Meier estimates of OS rates were plotted as a function of time.
We used the log-rank test to assess the extent to which OS or LOS was associated with sex, age category, race/ethnicity, insurance type, income, lagtime, insurance type by lagtime, or insurance type by income for all patients and for patients with specific cancer types, or tumor types. The OS and LOS rates and corresponding 95% confidence intervals (CIs) 19 were calculated. Multivariate time-to-event models for OS and LOS were considered but ruled out due to absence of significant association between demographic variables (sex, age, race/ethicity) and OS or LOS, and the lack of independence among race/ethnicity, income, and insurance type. A two-sided p-value <0.05 was considered statistically significant. SAS for Windows version 9.4 software (SAS Institute, Inc., Cary, NC) was used for all analyses.
Results
Patient characteristics
Of the 268 patients in the initial study cohort, 67 were excluded because they were uninsured, self-pay patients, or did not have evaluable lagtimes; the remaining 201 patients (101 females and 100 males) were included in the present analysis. The characteristics of these patients grouped together and by insurance type at diagnosis are given in Table 1. Of the 201 patients, 50 (24.9%) had public insurance, and 151 (75.1%; including 5 patients with military insurance) had private insurance. Among all patients, the most common cancers were brain tumors (20.9%), Hodgkin lymphoma (18.9%), and soft tissue sarcoma (16.4%); the proportions of patients with specific cancer types did not differ significantly by insurance type. For all patients, the mean age at diagnosis was 22.4 years (SD, 4.3 years); the mean age at diagnosis did not differ significantly by insurance type. Insurance type was significantly associated with race/ethnicity and income level.
Demographic and Baseline Characteristics
Private insurance included managed care plans, HMOs, and military.
Public insurance included state/national programs such as Medicaid, Medicaid HMOs, and county programs.
HMO, health maintenance organization; SD, standard deviation.
Survival by lagtime
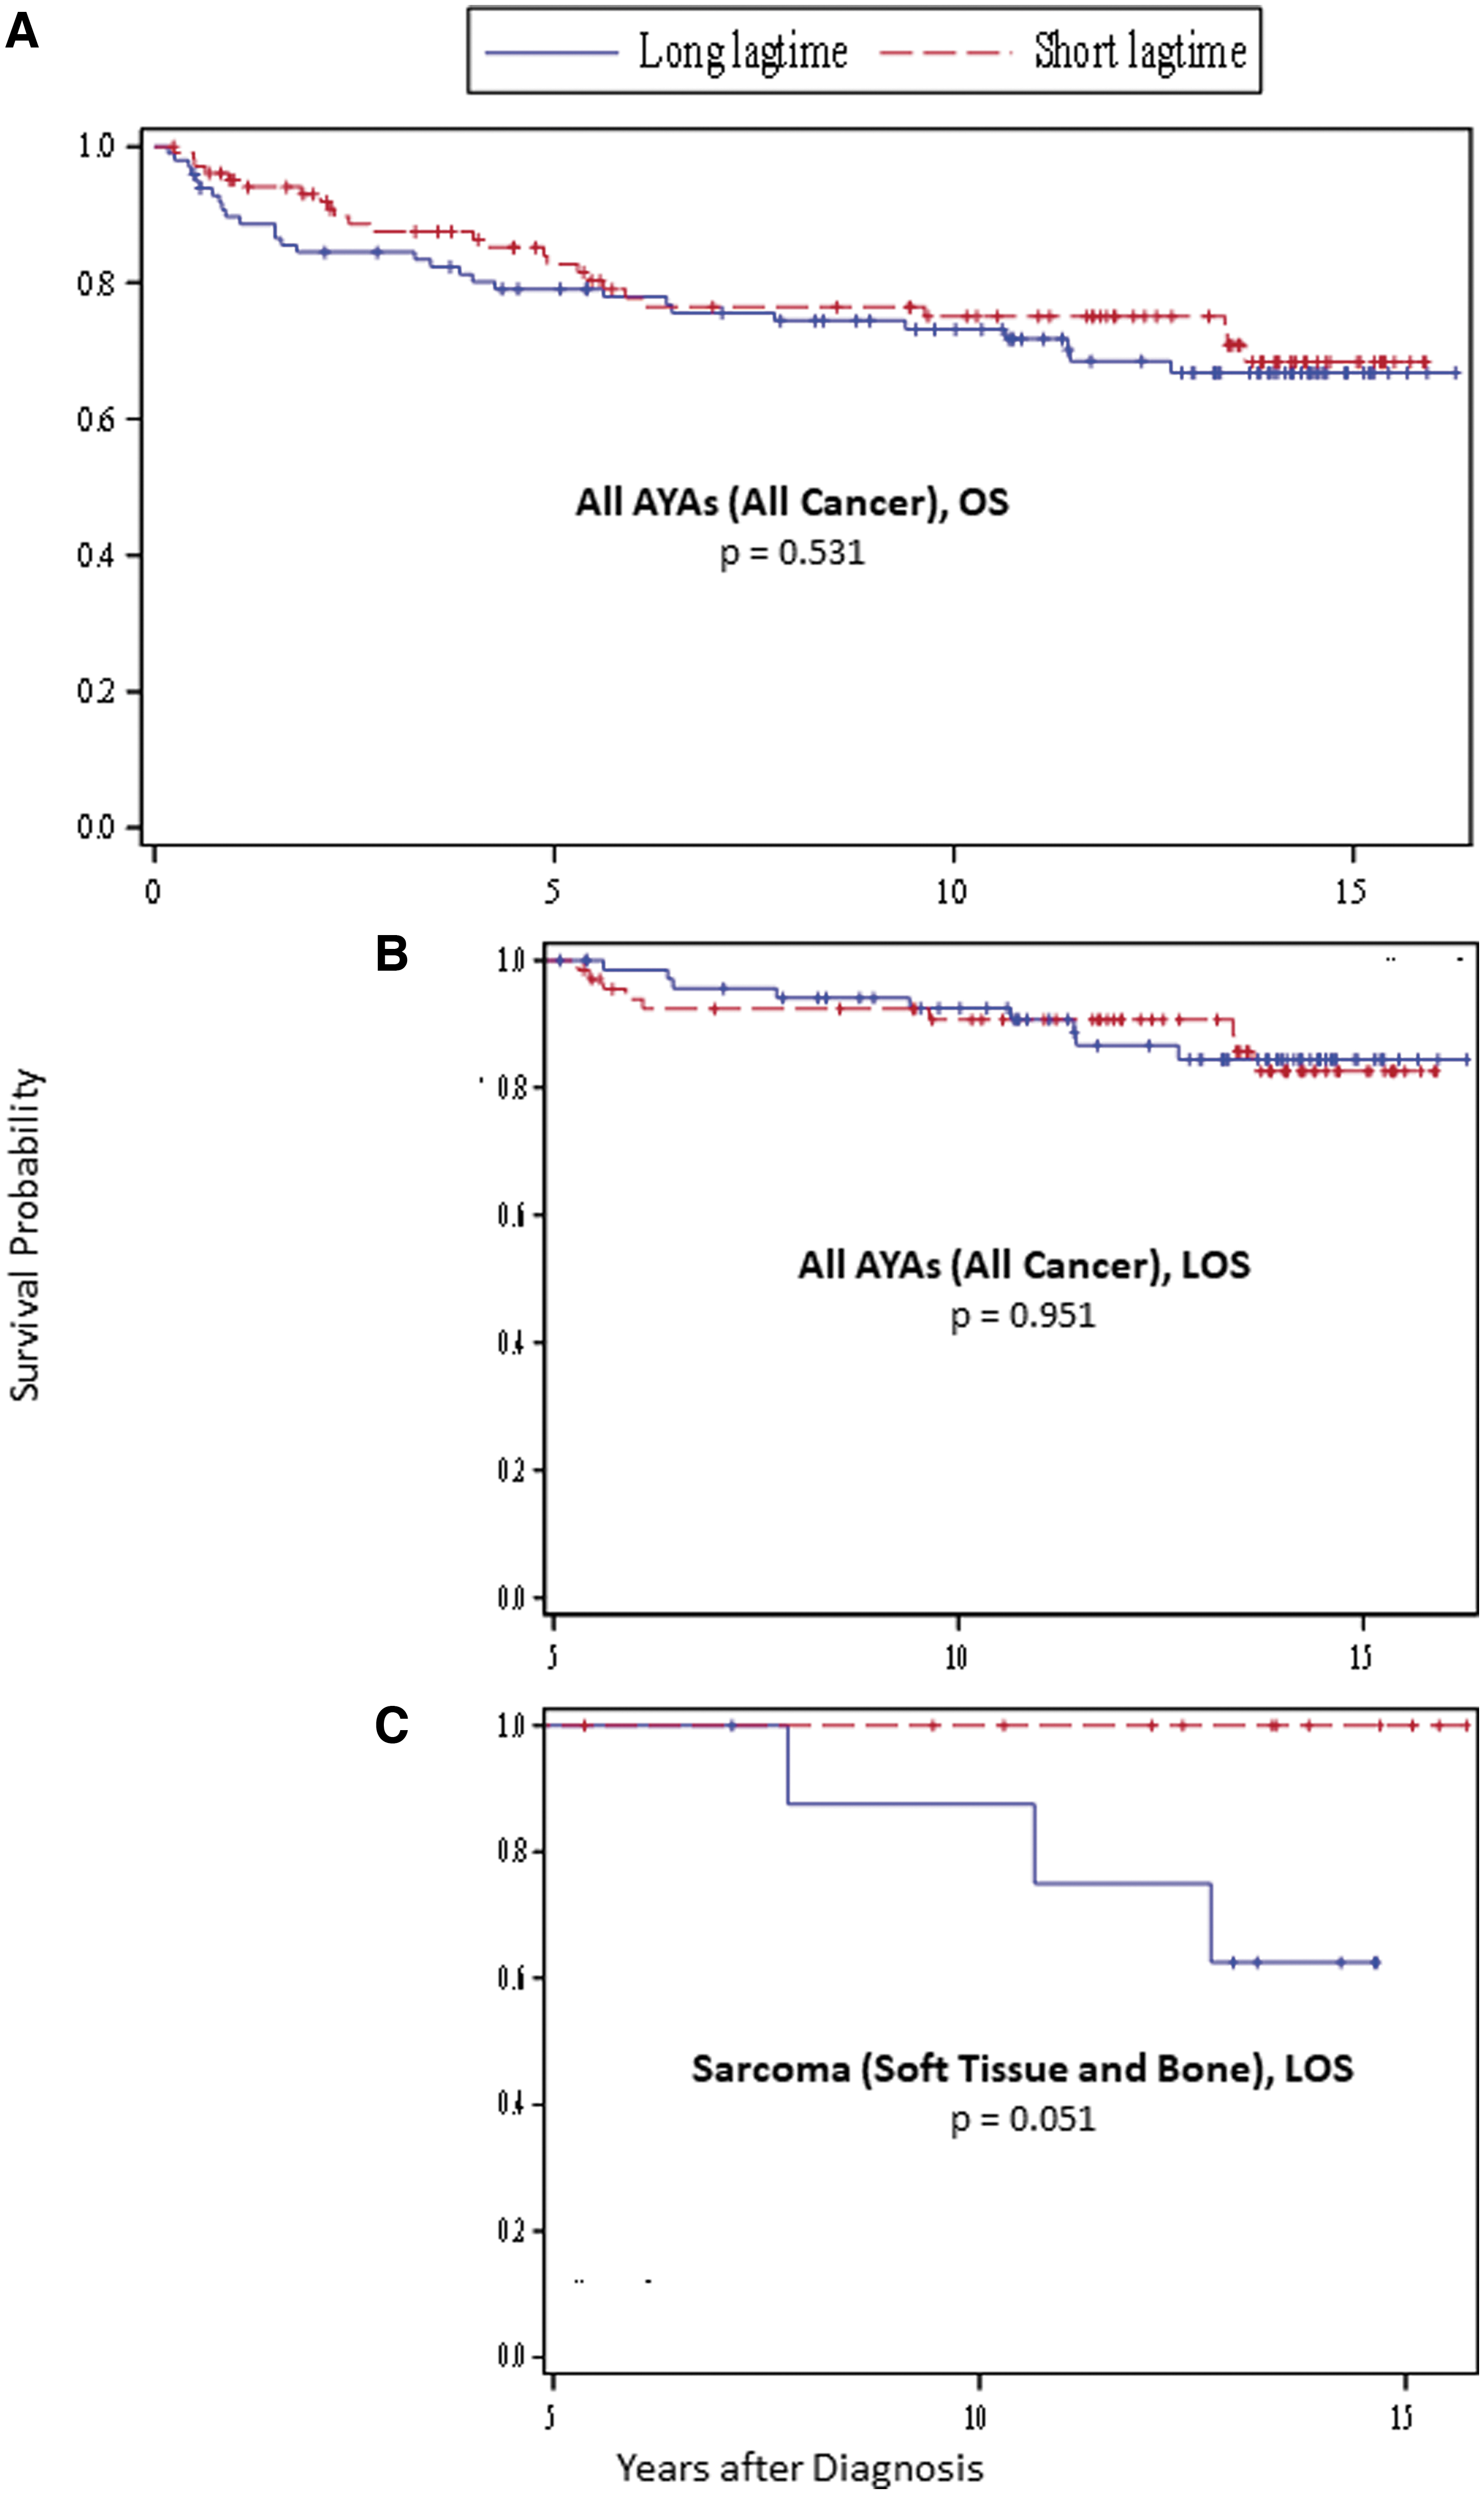
Lagtime data are given in Table 2. For all patients, the median lagtime was 87 days; for patients with specific cancer types, the median lagtimes ranged from 21 to 203 days. Among all patients, those with short lagtimes and those with long lagtimes did not have a significantly different OS or LOS (Fig. 1A, B). This was also true among patients with specific cancer types. However, among soft-tissue sarcoma patients, those with long lagtimes demonstrated worse LOS than those with short lagtimes, though the difference was not significant (p = 0.051) (Fig. 1C).
Lagtime by Tumor Type
Medians were used to define the short and long lagtimes for different tumor types, respectively.
Survival by insurance type
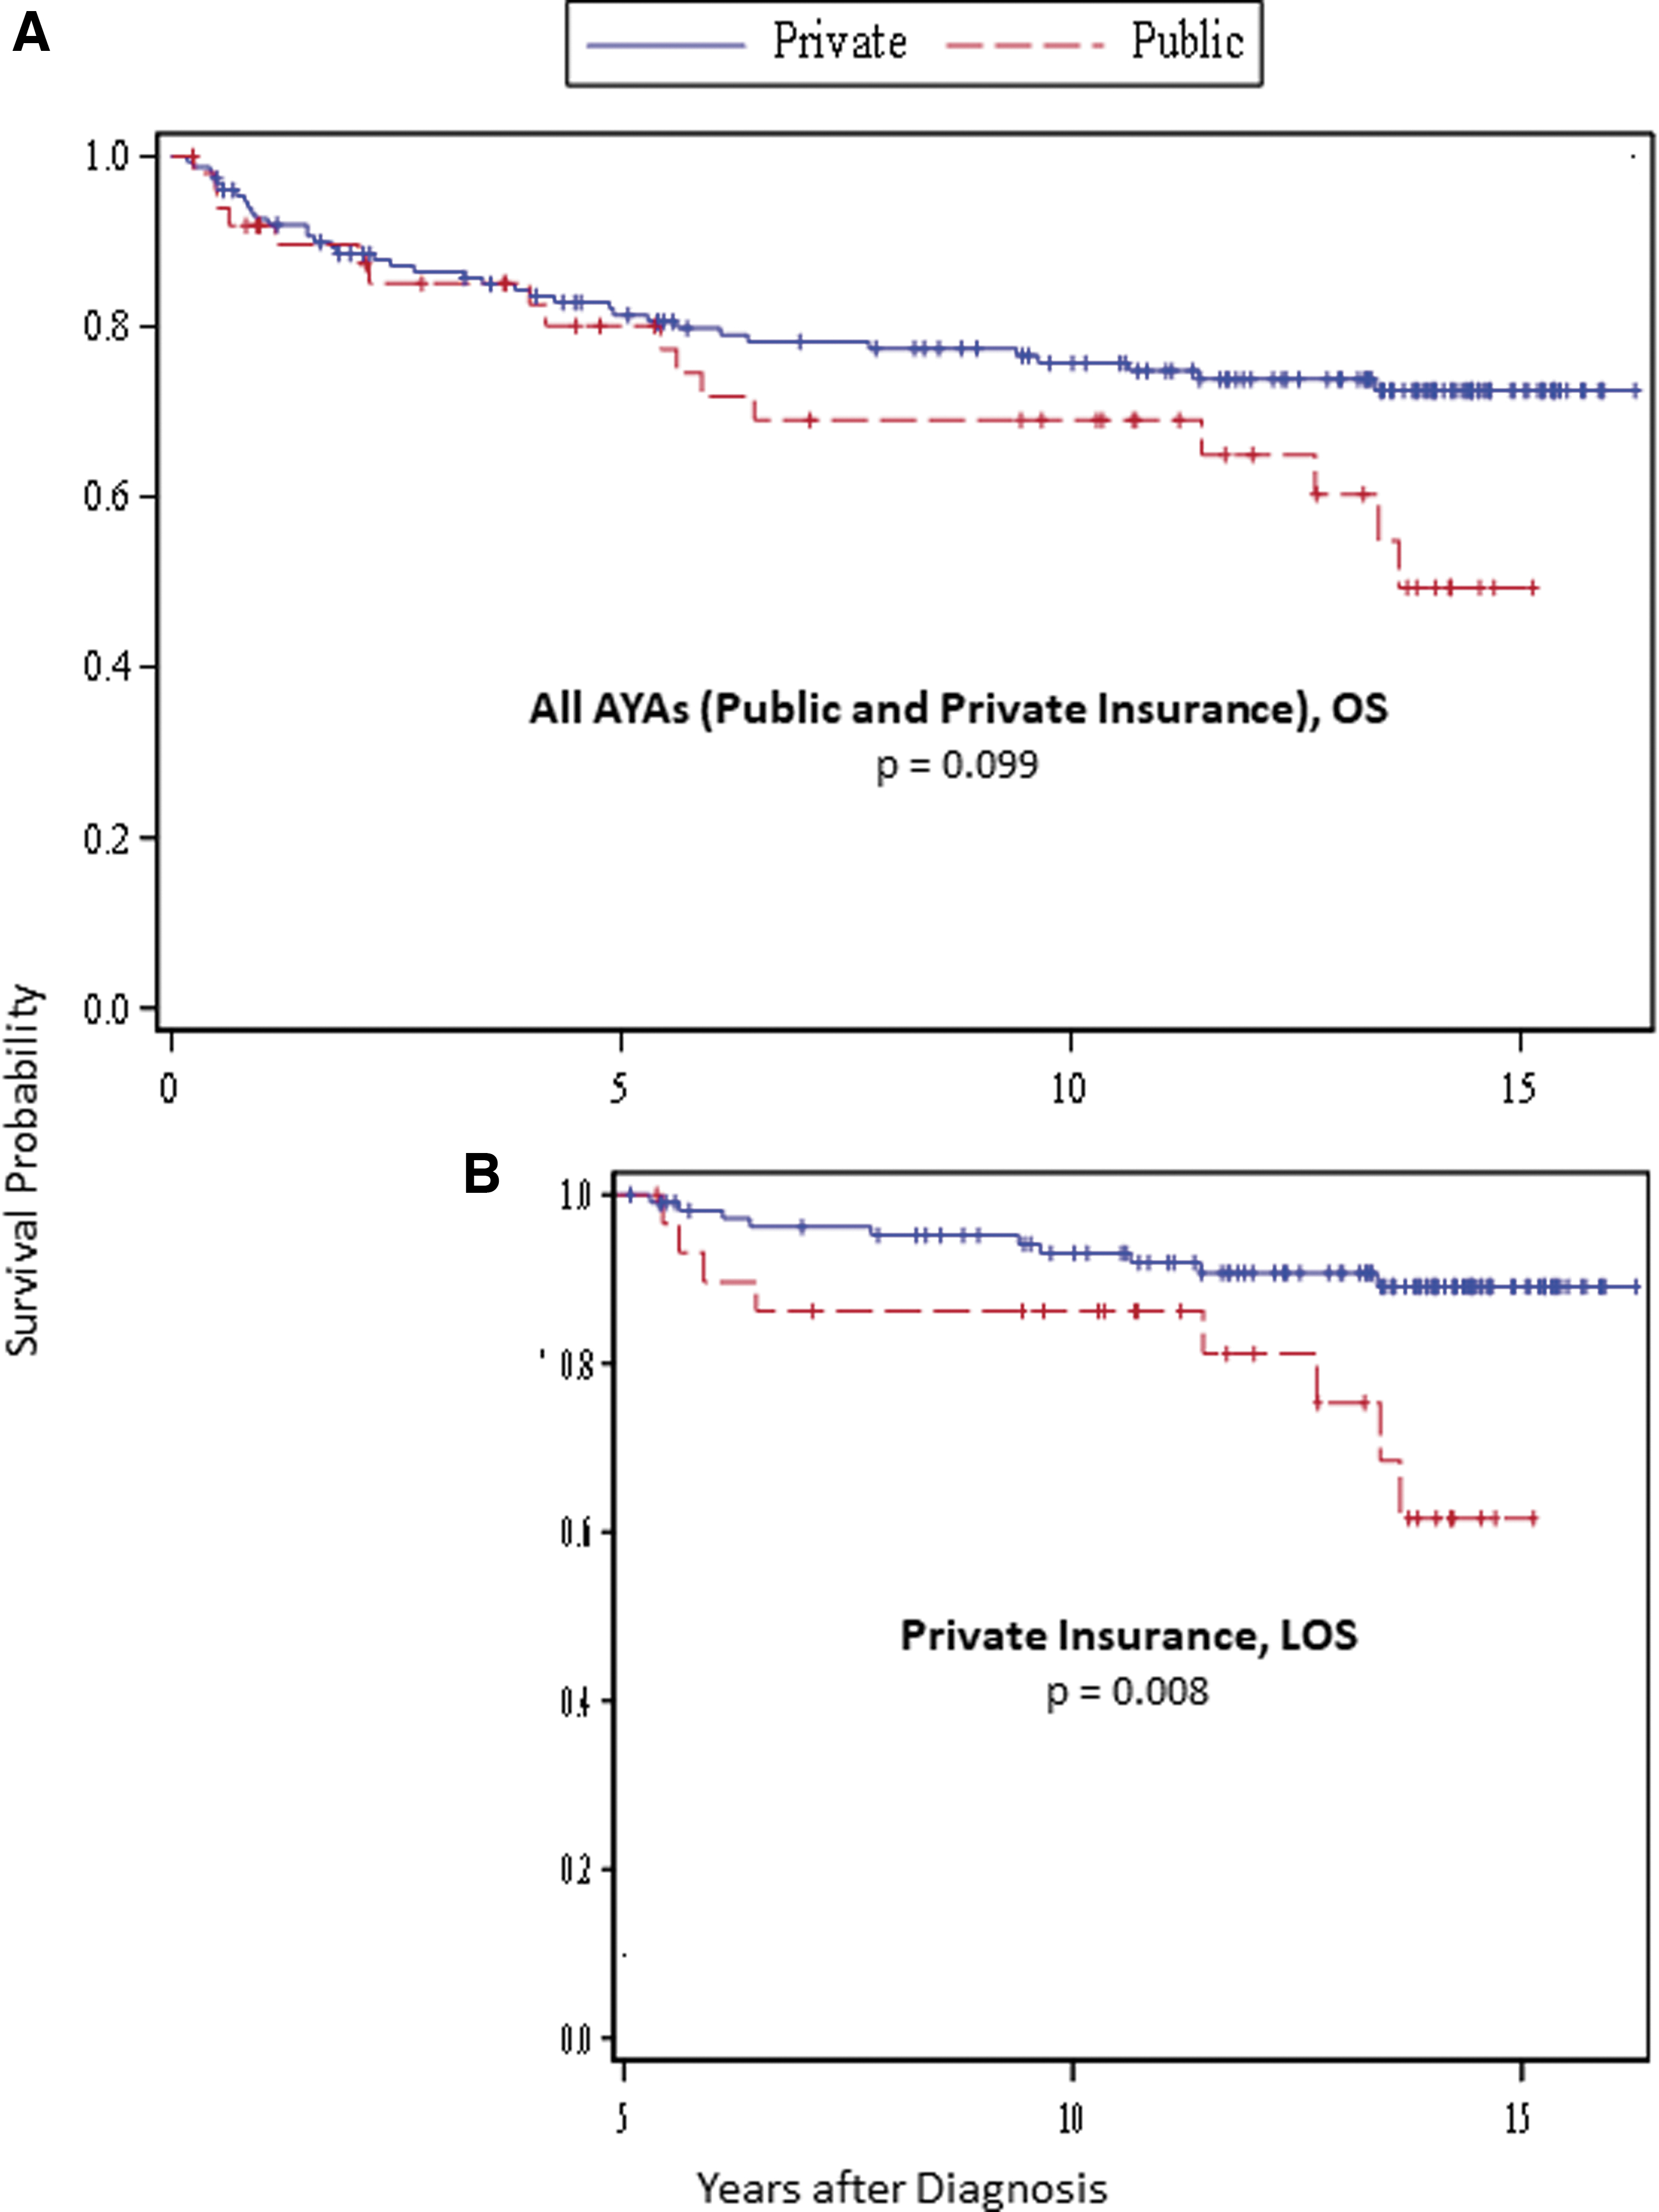
Among all patients, OS did not differ significantly by insurance type at diagnosis (p = 0.099) (Fig. 2A), but the LOS of those who had private insurance was substantially better than the LOS of those who had public insurance (p = 0.008) (Fig. 2B). The LOS at 15 years (95% CI) postdiagnosis of those who had private insurance (89%; 0.80, 0.94) was significantly higher than that of those who had public insurance (62%; 0.36, 0.80) (p = 0.0219). Among patients with brain tumors or leukemia, those who had private insurance had better OS than those who had public insurance (p = 0.037 and 0.035 for brain tumor and leukemia, respectively), and among thyroid cancer patients, those who had private insurance had significantly better LOS than those who had public insurance (p = 0.037) (Supplementary Fig. S1).
Survival by insurance type and lagtime
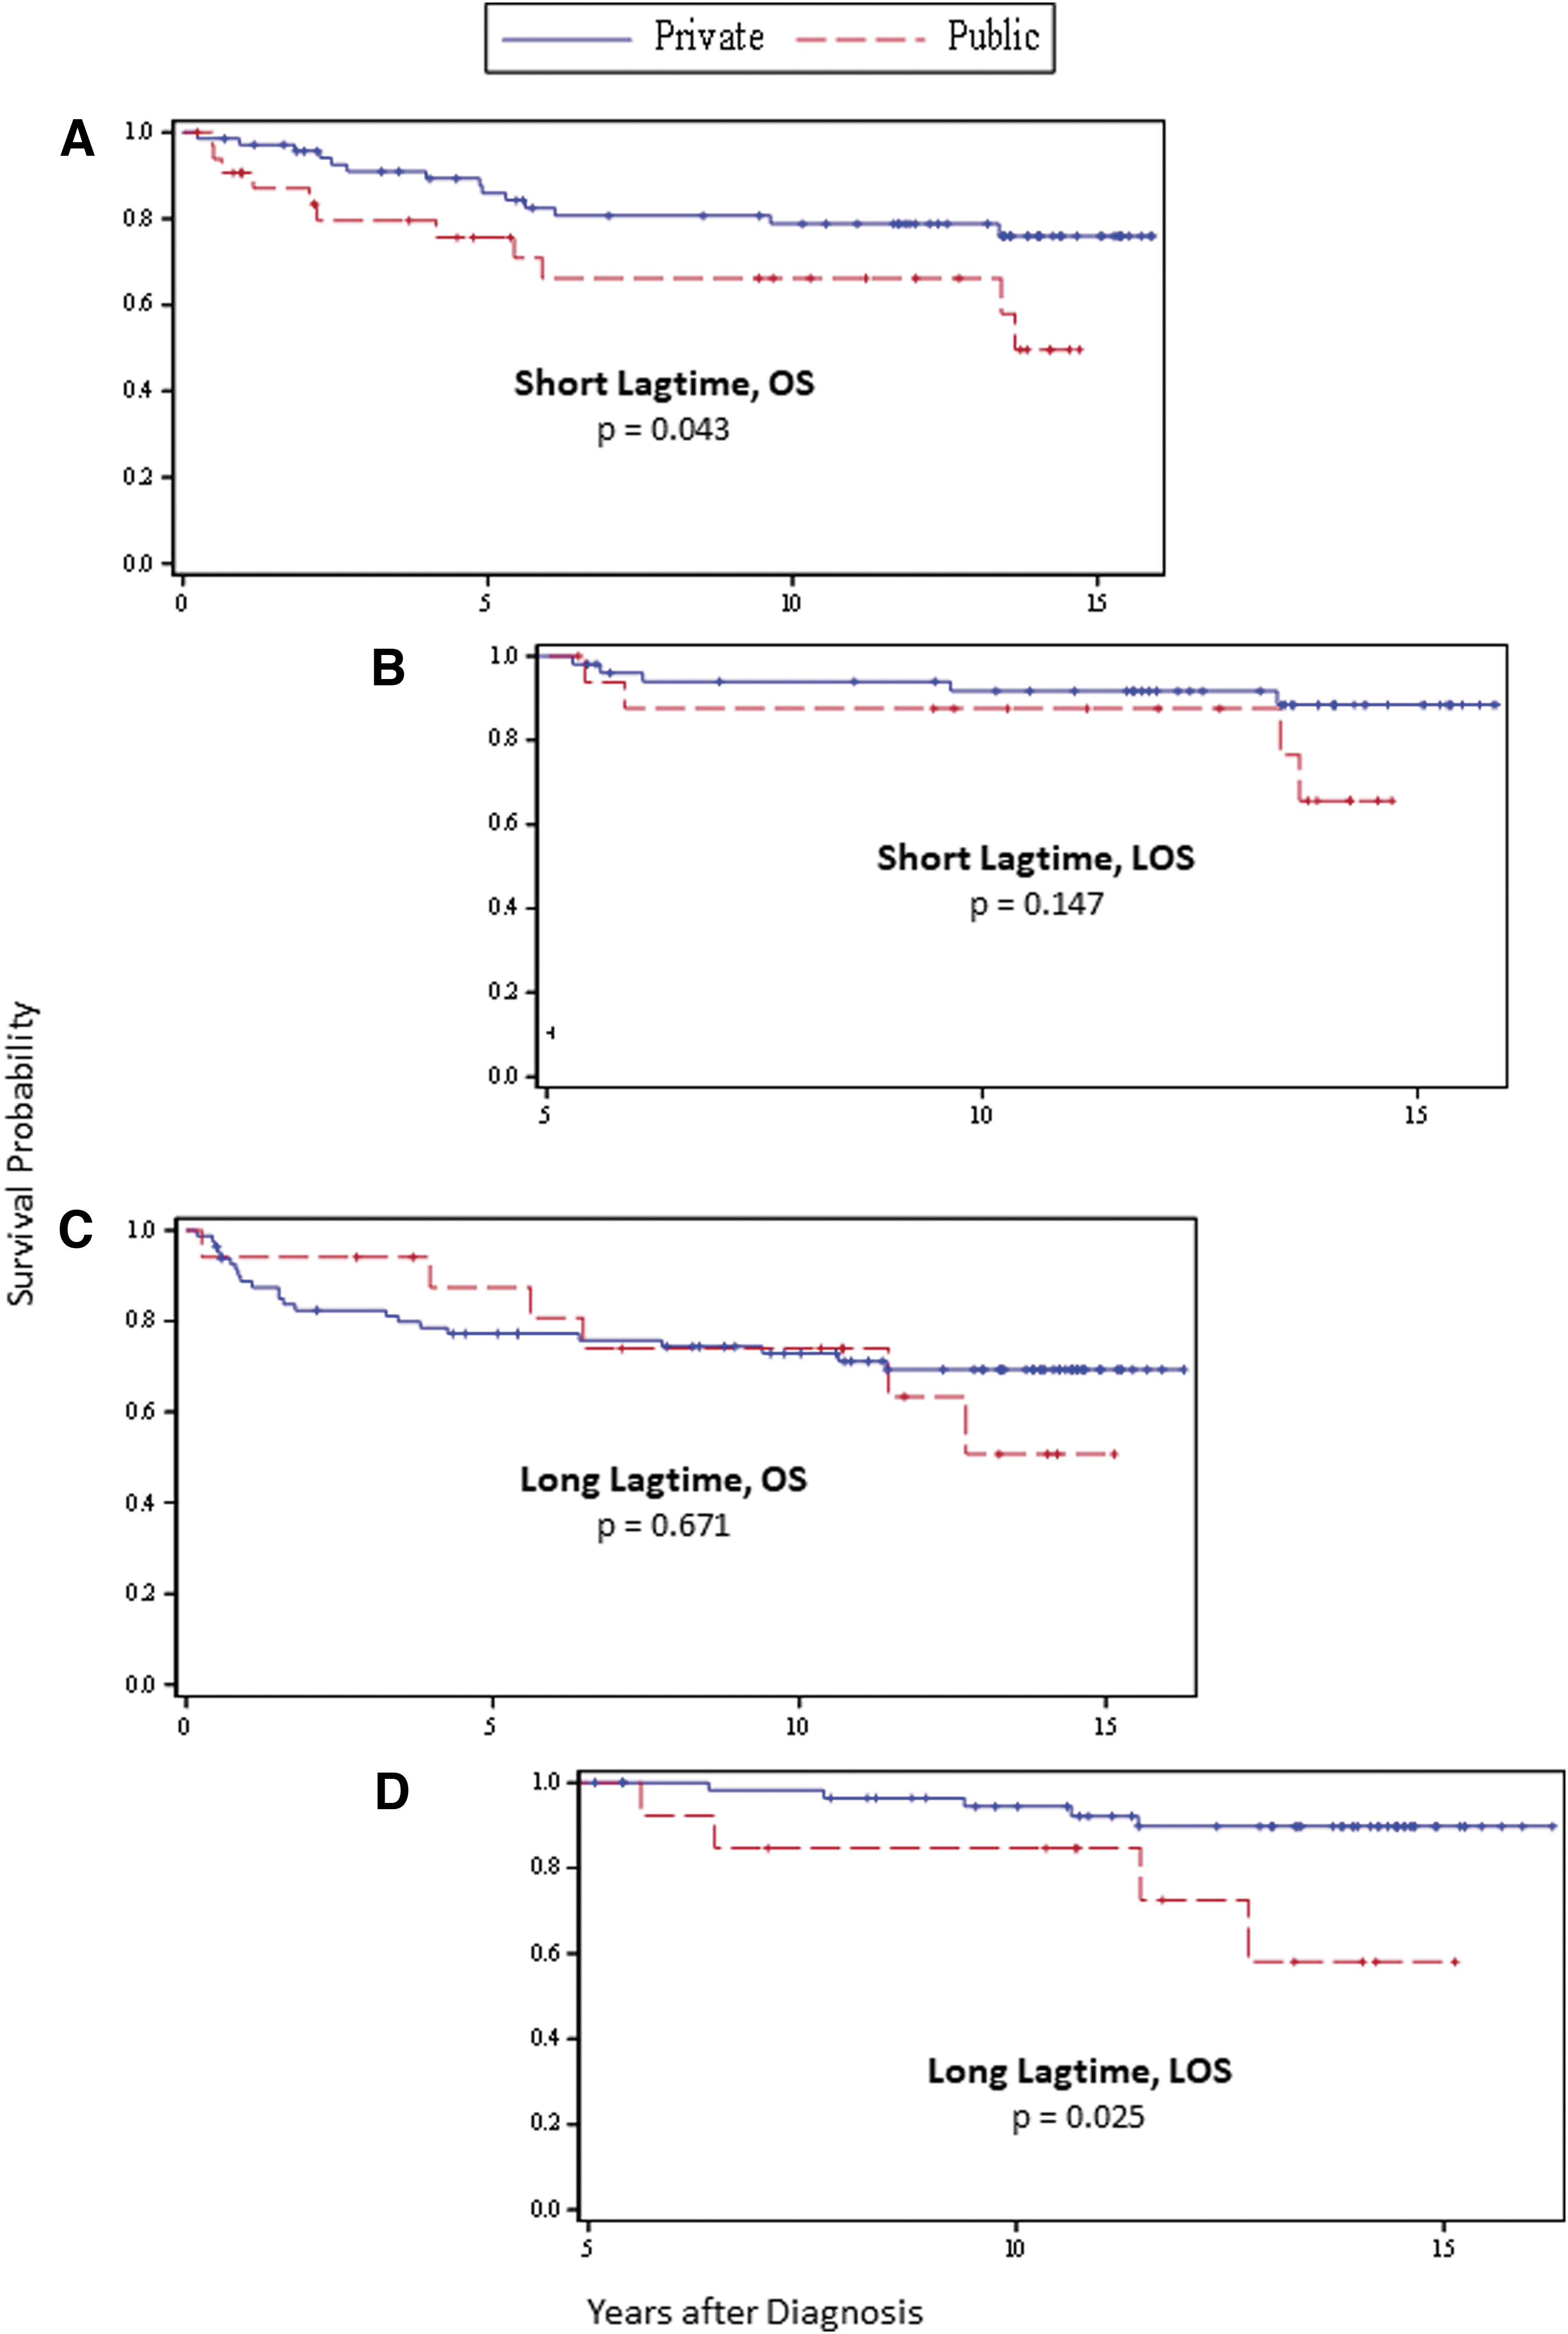
Among all patients with short lagtimes to diagnosis, those with private insurance had significantly better OS than those with public insurance (p = 0.043) (Fig. 3A); however, LOS did not differ significantly between these groups (p = 0.147) (Fig. 3B). Conversely, among all patients with long lagtimes, OS did not differ significantly by insurance type (p = 0.671) (Fig. 3C), but the LOS of those who had private insurance was significantly better than the LOS of those who had public insurance (p = 0.025) (Fig. 3D).
Survival by household income
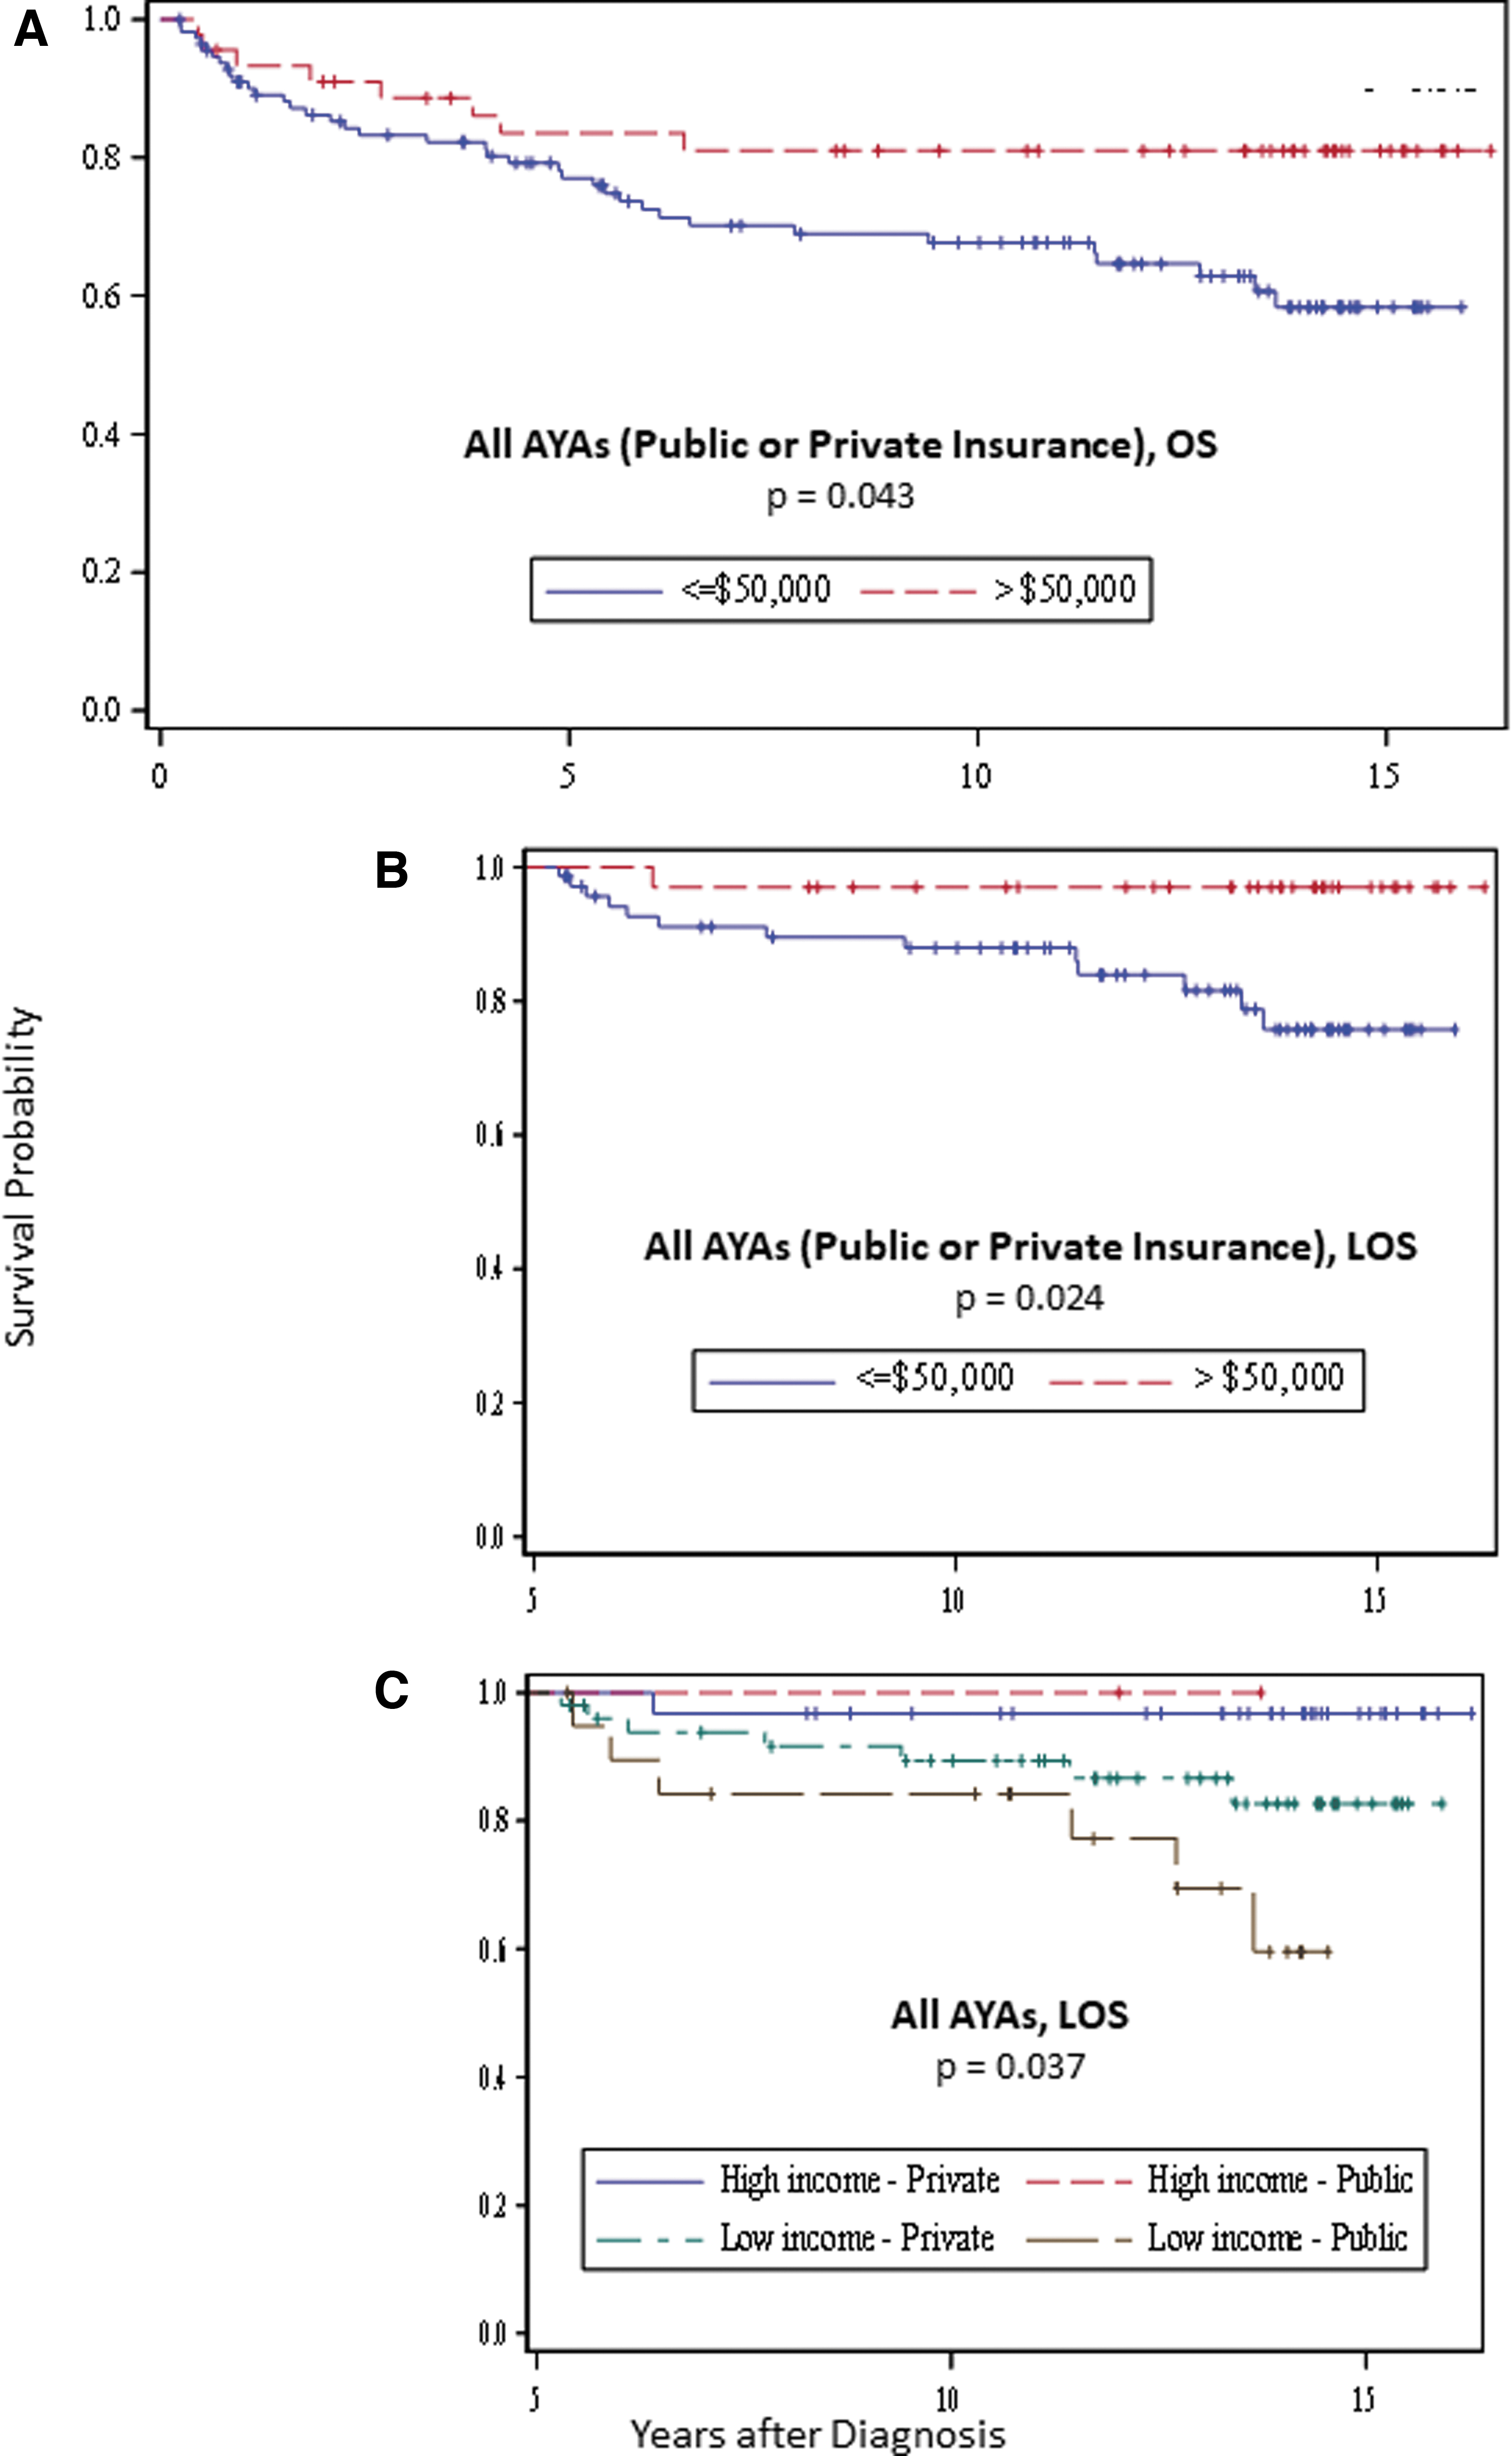
Among all patients, those residing in zip code areas with median annual household incomes >U.S. $50,000 had a significantly better OS and LOS than those residing in zip code areas with household incomes ≤U.S. $50,000 (p = 0.043 and p = 0.024, respectively) (Fig. 4A, B). Regardless of insurance type, AYA cancer patients residing in high-income zip code areas had significantly better LOS than those residing in low-income zip code areas (p = 0.037) (Fig. 4C).
Survival by demographics
OS and LOS showed no evidence of significant association with demographic factors sex, age, and race/ethnicity (Supplementary Tables S1–S6).
Discussion
In this study, we found that insurance type and income status at diagnosis are associated with LOS among AYA cancer patients, which suggests that each of these factors may impact AYA cancer patients many years after their initial diagnosis. However, lagtime to diagnosis was not associated with our patients' survival outcomes.
Private insurance at the time of initial cancer diagnosis was associated with superior LOS but not OS. Interestingly, having private insurance at diagnosis was associated with superior outcomes even for patients who experienced delays in diagnosis. Our findings add to a growing body of literature highlighting the influence of insurance status on treatment variables and outcomes among AYA cancer patients. Further, findings demonstrate that insurance status is a stronger predictor of survival than lagtime. Previous studies have found that, compared with those who have private insurance, AYA cancer patients who have public insurance or who do not have insurance are diagnosed at later disease stages, are more likely to present with metastatic disease, are less likely to be treated at a specialty cancer center, are less likely to be enrolled in a clinical trial, and have increased risk of disease-related mortality.12,20–25 Thus, these patients may receive more intense treatment that increases their risk of late toxicities and comorbidities.
The adverse effects of treatment have been demonstrated among survivors of Hodgkin lymphoma diagnosed in adolescence and young adulthood; those who had public or no insurance are more likely than those who had private insurance to have circulatory system, renal, endocrine, liver, and/or respiratory system diseases. 26 In addition, AYA patients who have public insurance are at increased risk of losing insurance coverage as they transition into adulthood and they age out of the system as well as of their parental coverage. 27 Such a loss may impact the long-term outcomes of AYA cancer patients who have public insurance at diagnosis, as AYA cancer survivors without health insurance are less likely to access and implement survivorship care, thus further increasing their risk of morbidity and mortality from disease recurrence and/or late toxicities.28–30
In general, AYAs with many cancer diagnoses have experienced limited improvement in LOS. 28 For all cancers and for 11 of their 14 most common cancers AYAs have had a lower LOS improvement after diagnosis than either younger or older patients, the most notable exception being leukemia. 28 Since young adults in the United states are the least insured age group, the effect of insurance and low household income we observed may explain some of the previously reported relative lack of LOS improvement in AYAs.
Our results demonstrated an association between geographic measures of household income and survival, with residing in a high-income zip code area associated with increased OS and LOS. These results are consistent with previous studies showing socioeconomically driven disparities in the survival of AYA cancer patients.21,25,31–34 Treatment differences between AYA cancer patients based on socioeconomic status have been noted,35,36,34 and could contribute to disparities in survival. For example, Derouen et al. found that, among AYA breast cancer patients, those residing in low-income neighborhoods were less likely to receive radiation after breast-conserving surgery, less likely to receive chemotherapy, and more likely to undergo mastectomy than those residing in high-socioeconomic neighborhoods. 35 In addition, AYA cancer patients are more likely than the general population to spend a higher percentage of their income on out-of-pocket medical costs, and those with a lower socioeconomic status may have to ration their health care spending by deferring care and/or skipping tests, treatments, and/or follow-up visits, thus potentially contributing to their poorer health outcomes. 14
In addition to the unique financial challenges that AYA cancer patients face, diagnosis lagtime is an essential consideration for this subset of patients.37–39 Martin et al. had shown previously that time to diagnosis, and thus potential presentation at a higher stage of disease, may impact the survival of patients with specific types of cancers. 9 Analogous to other types of AYA cancers such as breast, testicular, and colon,40–44 this study revealed that for patients with soft-tissue sarcoma, lagtime may matter more as it negatively impacted LOS. This finding is similar to those reported for both the older adult and childhood cancer populations.45,46,47 A delayed diagnosis of soft-tissue sarcoma could lead to patients presenting with larger tumors and metastatic disease that is nonsalvageable despite aggressive multimodal therapy.9,47–51 Interestingly, this study demonstrated that delayed diagnosis among AYA cancer patients did not impact OS or LOS when the entire cohort was evaluated as a whole. Some of the advanced-stage neoplasms investigated probably are more responsive to therapy than others and can still achieve favorable outcomes with aggressive treatment. Among lymphoma patients, for example, those diagnosed with early- or late-stage disease have similar survival rates largely owing to the introduction and widespread use of modern radiotherapy and combination chemotherapy.15,52,38 Though, these intensive treatments can also have late effects, particularly second malignancies and cardiovascular morbidity.53,54,41
This study had some potential limitations. Because the cohort was derived from a large academic single institution with a high proportion of privately insured patients, the study's results may not be generalizable. Also, since these data were collected, the awareness regarding disparities and outcomes for AYAs has increased. In addition, the U.S Affordable Care Act has been established, and has enhanced awareness of unmet needs and the impact of health policy on the general population. Due to an unequal distribution of patients with different cancer types, the study was not powered to determine the impact of demographic factors on survival for each cancer type. Similarly, we did not have large enough populations of patients who were self-pay or uninsured in our study cohort to have significant power to measure the impact of each of these variables on long-term survival. In addition, the study did not include data regarding the patients' insurance statuses beyond their initial diagnoses or the causes of their mortality. The study assigned each patient a median annual household income based on the patient's zip code of residence, an approach that may not have captured all patients' income levels accurately. However, it has been shown that neighborhood-level measures of socioeconomic status likely account for both individual and neighborhood effects; thus, using zip-code−based income data may have provided a more complete picture of these patients' socioeconomic status. 55 Finally, the study demonstrates associations and not necessarily cause and effect relationships, and results, particularly those related to lagtime, may be subject to bias due to potential unmeasured confounders. Despite its potential limitations, this study included a representative cohort of patients with the most common AYA cancers, and our analysis as a whole was more powerful than those of some previous studies of smaller, cancer-type−specific cohorts of AYA patients. Based on the findings in the cohort analyzed, further studies are needed increasing the age of AYAs up to 39, the diversity of diagnoses included, and the total sample size.
Conclusion
In summary, our findings show that among AYA cancer patients, lagtime to diagnosis is not associated with OS or LOS, whereas having public insurance and having a low household income at diagnosis are associated with worse LOS. Elucidating the ways in which insurance type affects the survival of AYA cancer patients alive 5 years after their initial diagnosis requires additional studies investigating the extent to which transitions in insurance coverage over time are associated with specific causes of death. Such information could be used to determine the times at which AYA patients are particularly vulnerable to insurance loss, identify specific disease processes affected by insurance status, and ultimately develop interventions aimed at reducing these risk factors.
Precis
For AYA cancer patients, public health insurance and a low household income at diagnosis are associated with worse LOS that extends far beyond from the 5-year anniversary of cancer diagnosis. Mitigating this disparity requires additional studies to identify the ways in which care patterns differ between AYA patients with different insurance types and household incomes.
Authors' Contributions
B.C., A.B., and M.R. have made substantial contributions to conception and design and acquisition of data. B.C., S.D., J.W., C.R.A., and M.R. have analyzed and interpreted data. B.C., A.M.B., J.G., J.A.L., A.B., and M.R. have been involved in drafting the article and revising it critically for important intellectual content, and have given final approval of the version to be published.
Footnotes
References
Supplementary Material
Please find the following supplemental material available below.
For Open Access articles published under a Creative Commons License, all supplemental material carries the same license as the article it is associated with.
For non-Open Access articles published, all supplemental material carries a non-exclusive license, and permission requests for re-use of supplemental material or any part of supplemental material shall be sent directly to the copyright owner as specified in the copyright notice associated with the article.