
Abstract
Purpose:
Malnutrition is commonly observed during cancer treatment, while some cancer survivors are at risk of overweight and obesity. This study investigated nutritional status during and after treatment in adolescents and young adults (AYA) with cancer.
Methods:
A retrospective chart review of AYA diagnosed with cancer was conducted. Data were collected monthly during treatment, then annually for 3 years of follow-up.
Results:
Of 93 AYA, 8% were underweight at diagnosis versus 20% during treatment (p = 0.012). Forty-four percent experienced ≥5% loss of weight (LOW) during treatment, and 23% of those were not referred to a dietitian. While 47% were referred to a dietitian at some point during treatment, 77% did not have dietetic involvement in the month after reaching greatest percentage LOW. Different tumor types were associated with different risks of LOW. Eighty-six percent with acute lymphoblastic leukemia (ALL)/lymphoblastic lymphoma (LL) and 86% with acute myeloid leukemia had ≥5% LOW during treatment, compared with 17% with Hodgkin lymphoma (p < 0.0001). In year 3 of follow-up, 36% of all AYA were overweight or obese versus 25% at diagnosis (p = 0.2). Overweight/obesity was more common in ALL/LL survivors than other tumor types (67% vs. 14%, p = 0.037). No patients had dietitian involvement in year 3 of follow-up.
Conclusions:
AYA, particularly those with ALL/LL, are at risk of significant weight loss during treatment and overweight and obesity during survivorship. Dietetic involvement was inconsistent in this cohort. These data may guide which diagnoses warrant preemptive dietetic input during treatment and highlight the importance of dietetic involvement in survivorship.
Introduction
Malnutrition in the form of undernutrition is a well-recognized complication of pediatric cancer and its treatment,1–3 with a reported incidence of up to 50%, depending on the type, stage, and location of the malignancy and parameters used to define malnutrition. 2 Malnutrition in adult cancer patients is also well recognized, with the prevalence ranging between 40% and 80%.4–6 Similar to pediatric studies, this variation is due to different malnutrition classification systems and factors associated with the malignancy itself, including tumor type, stage, and location. 7 Malnutrition during cancer treatment has been associated with decreased chemotherapy tolerance, 8 increased infection rates,9,10 inferior event-free survival, 11 and poorer overall survival. 12
While the term malnutrition is most often used synonymously with undernutrition, overweight and obesity are well recognized problems for survivors of pediatric cancer. Many studies have demonstrated an increased prevalence of overweight and obesity in survivors of pediatric acute lymphoblastic leukemia (ALL).13–16 Studies have also shown that children and adolescents and young adults (AYA) with leukemia who are overweight during treatment have poorer event-free survival and overall survival compared to their normal weight counterparts.11,12,17,18 Overweight and obesity are well known risk factors for the development of certain adult cancers, 17 as well as being associated with survival rates.18,19
While nutritional issues are well described in both children and adults with cancer, there is a lack of literature specific to AYA. AYA experience a unique distribution of cancer types and undergo different physiological changes compared to their older and younger counterparts. Studies have shown that AYA cancer survivors are interested in weight loss and healthy eating programs and report that their nutritional needs are often unmet.20,21 Given that most AYA cancer patients will be long-term survivors, 22 and that young adult survivors of childhood cancer exhibit higher rates of obesity, 23 dyslipidemia, hypertension, 24 and insulin resistance, 25 it is important to consider factors contributing to healthy survivorship, such as nutrition, from early in the treatment course.
This study aimed to further define the prevalence of undernutrition during treatment and overweight and obesity after treatment in AYA cancer patients, as well as investigating the extent and timing of dietetic referrals. For the purposes of this article, the term malnutrition will be used to describe undernutrition, and overweight and obesity will be used to describe overnutrition.
Methods
A retrospective case note review of AYA patients diagnosed with cancer over a 6-year period from two South Australian hospitals (Women's and Children's Hospital and the Royal Adelaide Hospital) was undertaken. AYA patients were defined as those diagnosed between their 14th and 26th birthdays, reflecting the Australian definition of AYA patients as those treated between age 15 and 25 years. 26 Patients were identified from cancer registries at the two hospitals and were eligible if they received chemotherapy or radiotherapy. Patients who underwent a stem cell transplant were included. Patients who had not yet completed treatment, had previously had a cancer diagnosis, had part or all of their treatment completed at another hospital, were treated with surgery only, had a diagnosis of chronic myeloid leukemia, or had an unrelated condition known to affect weight were excluded.
Age, sex, and diagnosis information was collected. Available weight (in kg) and height (in cm) measurements from medical review appointments were collected at diagnosis, at monthly (±7 days) intervals during treatment, at the end of treatment, and in the first, second, and third year of follow-up. When a weight measure was missing, it was treated as missing data.
When a height measure was missing or appeared inaccurate (>2 cm from previous measure), an average of the height from the month before and the month after was used. When consecutive height measures were missing for patients aged <20 years and therefore potentially still growing, the Centers for Disease Control and Prevention (CDC) percentile data tables 27 were used to estimate height values for missing values that tracked along the same height percentile as at diagnosis. When consecutive height measures were missing for patients aged ≥20 years, the previous height value was used.
When a height measure was lower than the previous month, the value from the previous month was used. If a height measure was missing at the 1-, 2-, or 3-year follow-up appointment for patients aged <20 years, it was treated as missing data. For patients ≥20 years, a previous height measure was used in this circumstance.
Based on weight and height measures, body mass index (BMI) 28 (for ≥20-year olds) or BMI z-scores 27 (for <20-year olds) were calculated for each time point. Malnutrition (or underweight) was defined as a BMI of <18.5 kg/m2 or BMI z-score <−2, while overweight/obese was defined as a BMI >25 kg/m2 or BMI z-score >+1. Percentage loss of weight (LOW) from diagnosis weight was also calculated. Information on whether a dietitian had been involved in the month after each review and mention of weight and oral intake on the day of each medical review was collected. If the patient was an inpatient at the time of medical review, mention of weight and oral intake during the length of their inpatient stay was collected.
Information on date referred to a dietitian, reason for referral, and dietetic involvement during treatment and in year 1, 2, and 3 of follow-up was collected.
The study was reviewed and approved by the Human Research Ethics Committees at both sites, and was undertaken in accordance with the National Health and Medical Research Council National Statement on Ethical Conduct in Human Research.
Statistical analyses
All data were analyzed with SAS 9.3 (SAS Institute, Inc., Cary, NC, USA). BMI z-scores were calculated using the CDC year 2000 growth reference. 27 p-Values of <0.05 were considered significant. Descriptive statistics and frequency tables were used to describe baseline characteristics and to summarize diagnosis and nutritional status (underweight, normal weight, and overweight or obese). Differences in nutritional status at diagnosis compared to other time points during treatment were analyzed using contingency tables and chi-square p values. Many of the analyses involved frequency tables for subgroups, with associated n and % values.
Results
Ninety-three patients were eligible for inclusion (Fig. 1). Baseline characteristics are shown in Table 1.
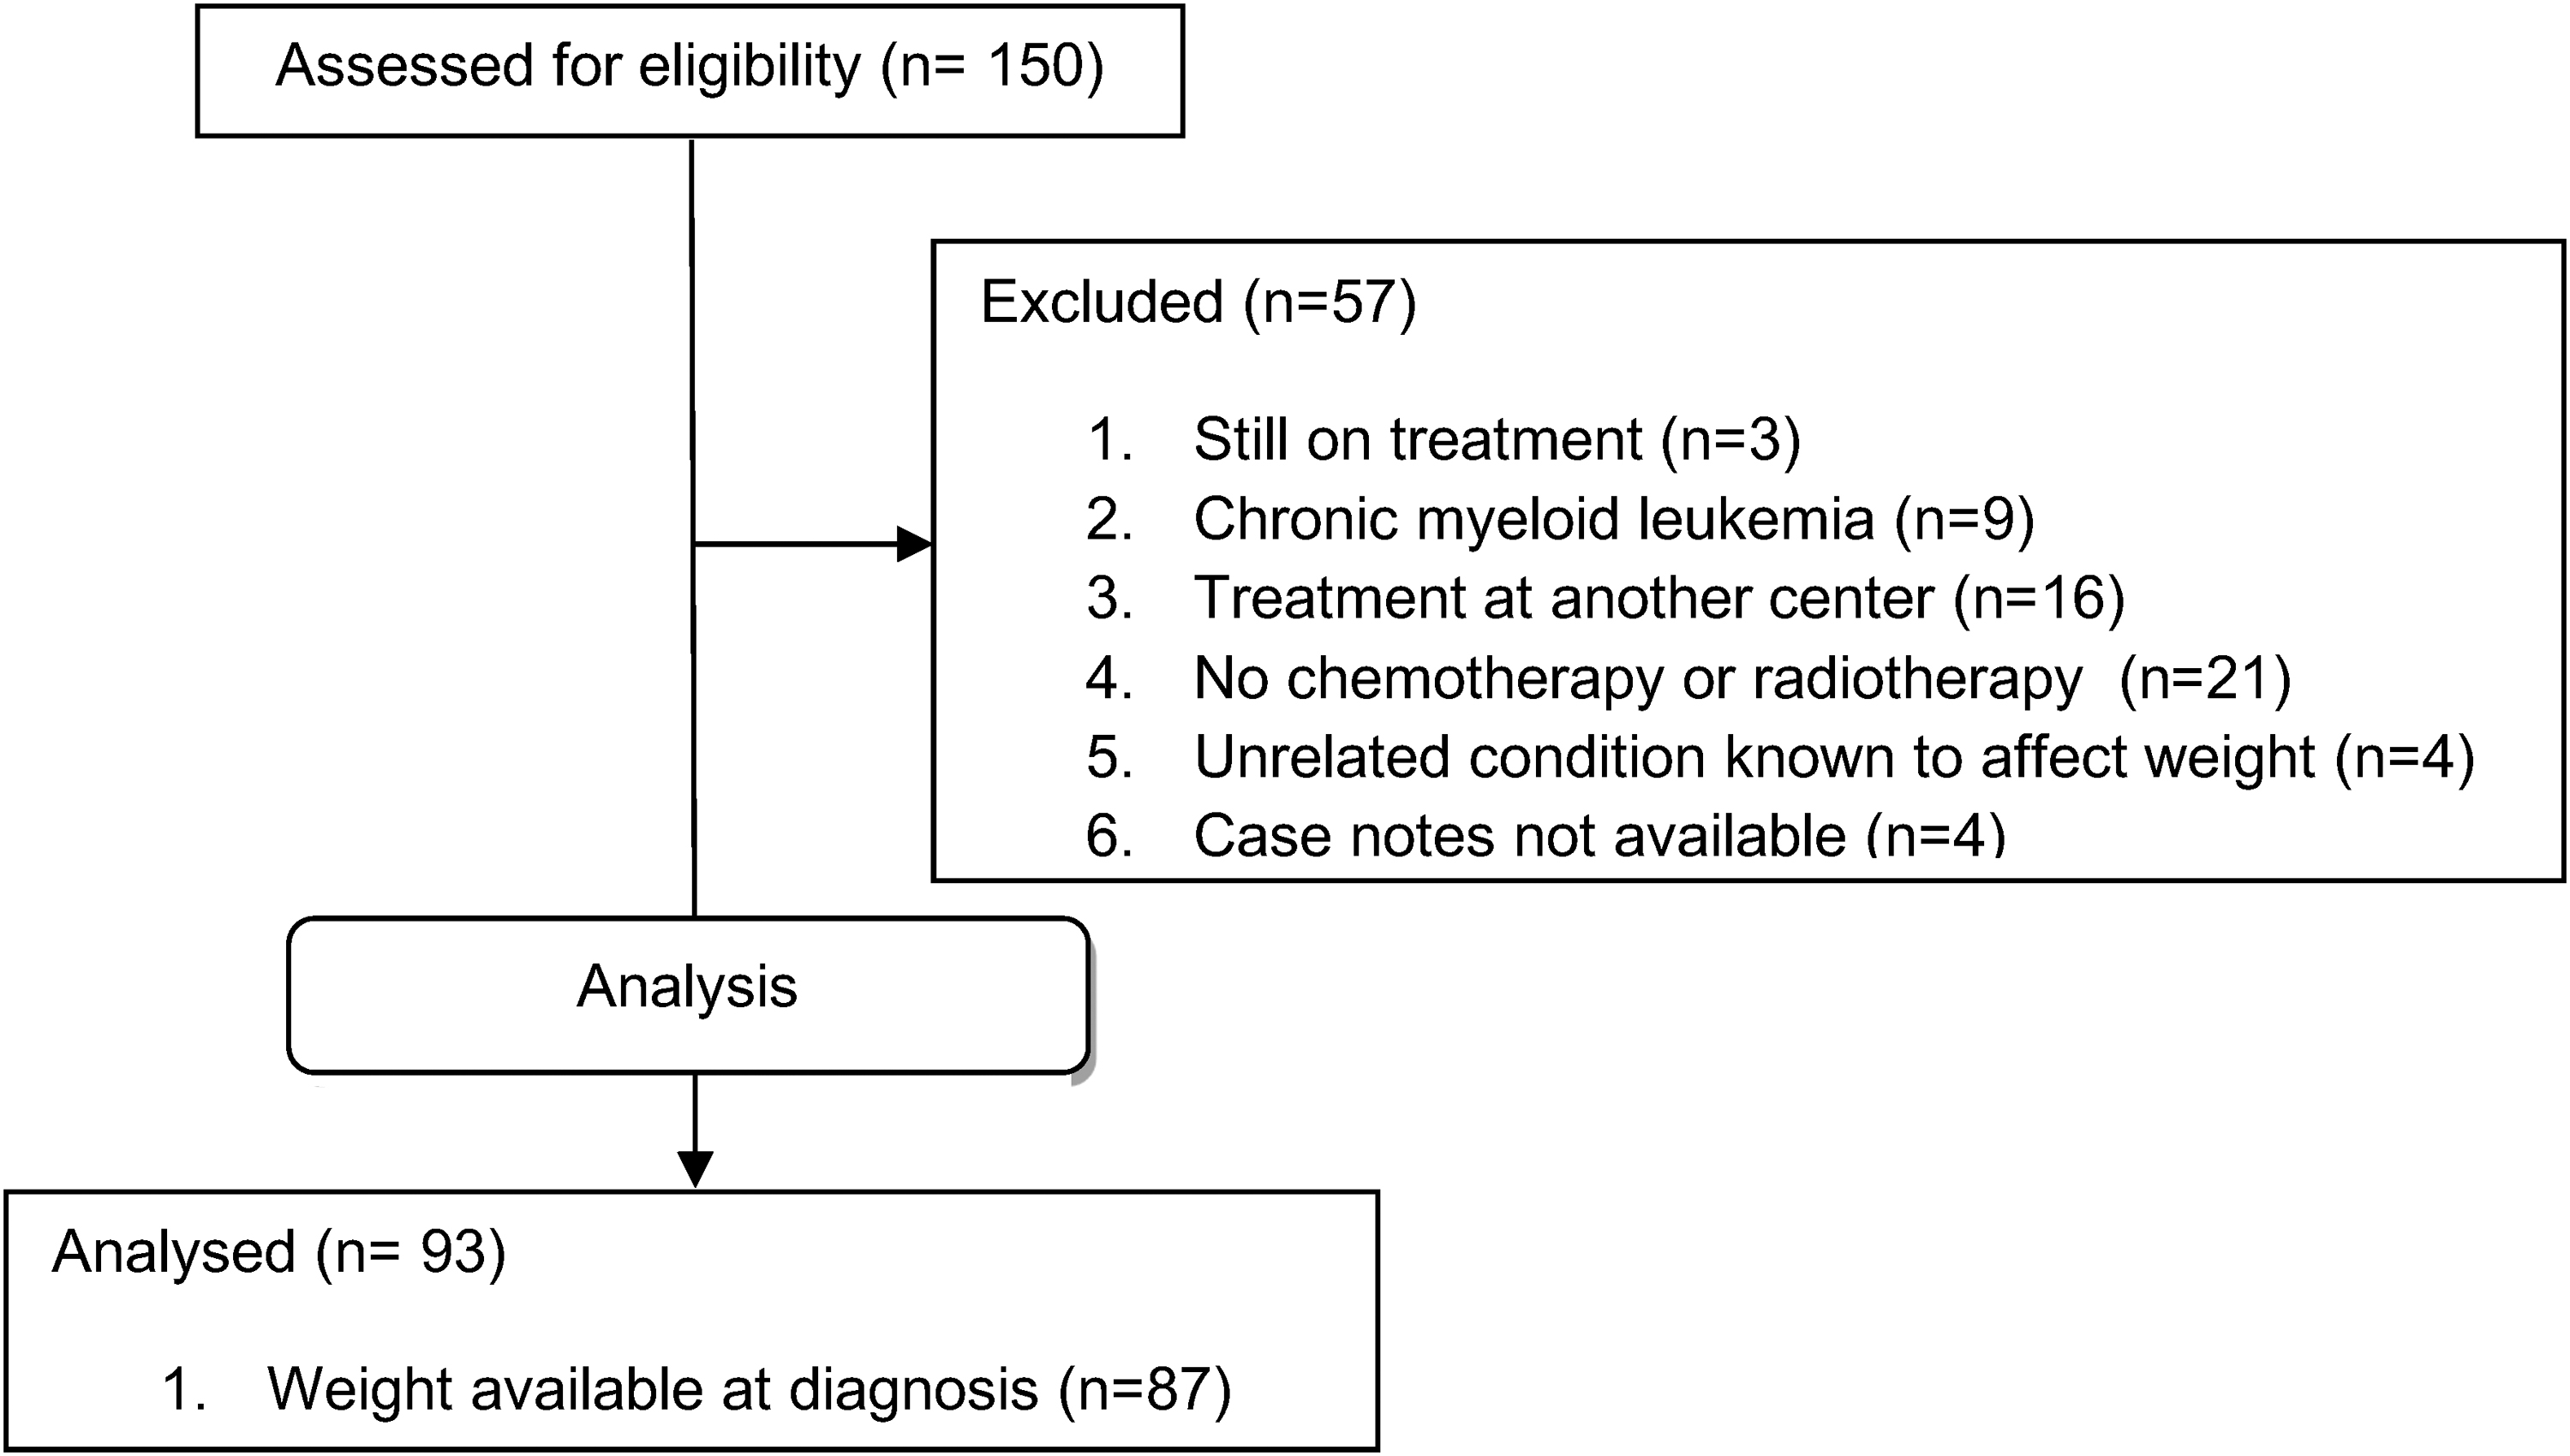
CONSORT diagram depicting the patients selected for analysis.
Baseline Characteristics
The sum of percentages for this variable did not equal 100% due to rounding.
Malnutrition/percentage LOW
Weight at diagnosis, and therefore BMI and percentage LOW data, was available for 89 patients. Table 2 shows the number and percentage of patients malnourished at diagnosis, end of treatment, and during 1-, 2-, and 3-year follow-up, and who reached ≥5% LOW during treatment for each diagnosis. As a group, there was no significant difference in the percentage of patients meeting the formal definition of malnutrition at diagnosis (8%, 7/89) versus end of treatment (9%, 7/78) (p = 0.078), year 1 of follow-up (5%, 3/57) (p = 0.460), year 2 of follow-up (5%, 2/40) (p = 0.408), or year 3 of follow-up (8%, 3/36) (p = 0.905).
Rate of Malnutrition Over Time and Proportion Experiencing ≥5% Loss of Weight During Treatment According to Cancer Subtype
Fisher's exact test.
Percentage of patients malnourished at diagnosis versus during treatment.
ALL, acute lymphoblastic leukemia; AML, acute myeloid leukemia; APML; acute promyelocytic leukemia; LL, lymphoblastic lymphoma; LOW, loss of weight; NHL, non-Hodgkin lymphoma; SCC, squamous cell carcinoma.
Malnutrition rates during treatment ranged from 0% for those with non-Hodgkin lymphoma (NHL) to 75% for those with head and neck squamous cell carcinoma (SCC). Twenty percent (18/89) of all patients, including 21% (3/14) of those with ALL/lymphoblastic lymphoma (LL), were underweight at some point during treatment. As a group, significantly more patients were malnourished during treatment (20%, 18/89) than at diagnosis (8%, 7/89) (p = 0.012).
Forty-four percent (39/89) of subjects reached ≥5% LOW during treatment with the proportion again varying with tumor type (Table 2). AYA with ALL or LL, acute myeloid leukemia (AML)/acute promyelocytic leukemia (APML), and head and neck SCC were more likely to reach ≥5% LOW than those with Hodgkin lymphoma (HL), high-grade NHL, and testicular cancer (p < 0.0001) (Table 2). Of those who reached ≥5% LOW during treatment, the median greatest percentage LOW was 10.7%, range 5.0%–32.7%.
The median time to greatest percentage LOW was 3 months, range 1–14 months. The maximum weight loss experienced in the group of patients with ALL/LL and brain tumors during treatment was 23% and 33%, respectively. Thirty-five percent (6/17) of patients who received head and/or neck radiotherapy remained at ≥5% LOW at the end of treatment.
Weight loss was not commented on in the case note entries of 69% of medical reviews where LOW was ≥5%. Oral intake was not mentioned in the case note entries of 33% of medical reviews where LOW was ≥5%.
Overweight and obesity
As a group, there was no significant difference between the percentage of patients overweight at diagnosis (25%, 22/89) versus end of treatment (28%, 22/78) (p = 0.610), year 1 of follow-up (26%, 15/57) (p = 0.829), year 2 of follow-up (35%, 14/40) (p = 0.229), or year 3 of follow-up (36%, 13/36) (p = 0.200) (Table 3). In patients with ALL or LL, there was a significant difference in the percentage of patients who were overweight or obese at 3-year follow-up (67%, 4/6) versus at diagnosis (14%, 2/14) (p = 0.037) (Table 3).
Overweight/Obesity at Diagnosis, End of Treatment, and After Treatment
All p values were >0.05 for the difference in percentage overweight/obese at diagnosis vs. all other time points.
p = 0.037 for percentage of patients with ALL/LL overweight/obese at 3-year follow-up versus at diagnosis.
Dietitian involvement
Forty-seven percent (44/93) of subjects were referred to a dietitian during treatment. The median time to first referral to a dietitian was 11 days after diagnosis, range: 0–288 days. The most common reason for first referral to a dietitian was poor weight gain or weight loss (41%, 18/44) followed by low-bacteria diet education (30%, 13/44). Seventy-seven percent (30/39) of subjects with ≥5% LOW had no dietetic involvement in the month after reaching their greatest percentage LOW, including 83% (5/6) of those with AML and APML and 75% (9/12) of those with ALL or LL.
Twenty-three percent of patients who had ≥5% LOW during treatment were not referred to a dietitian during treatment. Eighty-three percent (5/6) of patients who received head and neck radiotherapy and remained at ≥5% LOW at the end of treatment did not have a dietitian involved at this time. Five percent of patients (3/67) had dietetic involvement in either year 1 or 2 of follow-up. These patients all had a low or normal BMI and no overweight/obese patient had dietitian involvement at end of treatment, or in year 1 and 2 of follow-up. No patient had dietetic involvement in their third year of follow-up.
Discussion
This study investigated the nutritional status of AYA at the time of cancer diagnosis, during treatment, and into survivorship, as well as dietetic involvement during each of those phases. Our data demonstrate that significant weight loss is common in AYA during cancer treatment, with almost half developing ≥5% LOW. The risk of weight loss varied according to cancer type and phase of care, suggesting that there is opportunity for targeted dietetic intervention. Our data also demonstrated a risk of overweight and obesity posttreatment, particularly in those with ALL/LL.
The influence of tumor type (and the associated treatment regime) in determining risk of malnutrition has also been observed in childhood cancer. A systematic review evaluating the results of studies investigating malnutrition in childhood cancer estimated prevalence rates to be 5%–10% at diagnosis in leukemia diagnoses, and up to 30% both at diagnosis and during treatment for other malignancies such as solid tumors and lymphoma. 2 This is consistent with our data showing that the rate of malnutrition ranged from 0% to 75% depending on tumor type, highlighting the varying impact of different diagnoses and treatments on nutritional status. Specifically, patients in our cohort with acute leukemias, bone sarcomas, and head and neck SCC were at greatest risk of malnutrition during treatment.
While ALL/LL patients had a high rate of weight loss during treatment, none in our cohort was malnourished at the time of diagnosis. This low rate of malnutrition at diagnosis in ALL is consistent with studies of younger children. Reilly et al. reported that at initial diagnosis only 7%–8% of children aged 0–15 years with ALL met their definition of malnutrition (BMI < −2 standard deviation scores). 29 A large subsequent study found that in 2008 patients aged 1–20 years, 5.8% had malnutrition defined as BMI <5th percentile at diagnosis. 11
Little is known about the rates of malnutrition during treatment in ALL, and there is no reported literature on malnutrition rates specific to AYA with this disease. Two studies found that ∼20% of younger children with ALL were malnourished during treatment, similar to the 21% observed in our cohort of ALL/LL patients.30,31 A more recent study showed that in 1581 children with ALL, 16% spent some time underweight (BMI <5th percentile) during premaintenance treatment. 11 However, just measuring the rate that develops malnutrition can underestimate the proportion of patients experiencing a significant LOW. Demonstrating this fact, 21% of those with ALL or LL in our study met the definition of malnutrition during treatment, but 86% experienced ≥5% LOW. The greatest percentage weight loss in ALL/LL patients was reached by 3 months after starting treatment. Taken together, these data support the view that AYA with a diagnosis of ALL/LL may warrant preemptive and regular dietetic input during the early intensive phases of treatment to minimize the detrimental effects of therapy on nutritional status.
While it may seem superficially reassuring that 79% of patients with ≥5% LOW were referred to a dietitian with a median time to first referral of only 11 days post diagnosis, it is striking that 77% of these patients had no dietetic involvement in the month after reaching their greatest percentage LOW, and 83% of patients who received head and/or neck radiotherapy who remained at ≥5% LOW at the end of treatment did not have a dietitian involved at this time. This indicates poor adherence to current guidelines recommending that adult cancer patients who reach ≥5% LOW should be referred to a dietitian. 32
While most patients in our study had a dietitian referral early in their treatment course, many may not have experienced significant LOW by this point or may have been referred for a single dietetic session for low-bacteria diet education. The underrecognition of the significance of ≥5% LOW by clinicians, evidenced by little mention of weight and oral intake at medical reviews, coupled with this inconsistent dietetic input in our cohort argues further for a more organized approach and better referral pathways based on tumor type and careful surveillance for weight loss. Given the limited time allocation and funding available to most hospital dietetic services, 3 it would seem prudent that a risk-stratified approach be adopted with preemptive and regular dietetic input targeted toward the patients at the greatest risk of significant weight loss.
Although the numbers of patients in each disease category in our cohort was small, the data indicate that patients with acute leukemias, SCC of the head and neck, and bone sarcomas have more than 50% chance of developing ≥5% LOW and therefore warrant early and ongoing dietitian involvement. There are also a number of screening tools available for use by clinicians to identify patients at risk of malnutrition, with the nutrition screening tool for childhood cancer (SCAN) 33 being a simple, quick, and valid tool for use in the pediatric population and the Malnutrition Screening Tool (MST) being a simple tool that has been validated for use in the adult cancer population. 34
The paradoxical finding of a high rate of early dietitian referral but low dietetic input in the month after the greatest percentage LOW may indicate that services were placing disproportionate emphasis on education regarding low-bacteria diet at the expense of addressing significant weight loss. Randomized studies have failed to demonstrate a benefit from low-bacteria diet in all cancer patient populations that have been investigated, including adults, children, transplant, and nontransplant patients. 35 Consequently, in a resource-limited environment, dietitian time is arguably better spent on preemptive and ongoing management of cases at high risk of significant weight loss.
Although not statistically significant as a group, this study found higher rates of obesity in AYA in year 3 of follow-up compared to initial diagnosis. While little is known about rates of obesity at diagnosis and during treatment in AYA with cancer, the increased rate of obesity in survivors of childhood ALL is well established. A large meta-analysis reported an overweight/obesity prevalence of greater than 40% in survivors <5 years after completing treatment and up to 69% at 5–9 years after treatment. 36 Tai et al. reported that 31% of survivors of cancer diagnosed between 15 and 29 years were obese compared with 27% of their noncancer cohort, but they did not examine the risk according to tumor type. 23
While the number of ALL survivors in our study was low, we also found an increased incidence of overweight in this group during posttreatment follow-up, with 67% of ALL/LL patients being overweight or obese in year 3 after treatment completion compared to 14% at diagnosis. This is highly relevant, first, because obesity presumably further increases the risk of late effects such as metabolic syndrome and cardiac complications posttreatment, 37 and second, worse outcomes have been observed in AYA with a BMI >30 kg/m2 who relapsed. 38
Particularly, striking was the fact that even though almost half of our total cohort saw a dietitian during active treatment, only 5% saw a dietitian in the first 2 years of follow-up and no patient saw a dietitian in year 3 of follow-up. Despite the increase in overweight/obesity posttreatment, particularly in those with ALL/LL, no overweight/obese patient had a dietitian involved at end of treatment or in years 1–3 of follow-up.
It is well established that 62% of young adult survivors of childhood cancer exhibit obesity, dyslipidemia, hypertension, or insulin resistance 25 and adult survivors of childhood cancer have also been shown to consume diets exceeding recommendations for total calories, fat, sodium, and sugar and inadequate in fruit, vegetable, and wholegrain intake.39–42 Consequently, there is a clear role for dietetic involvement in survivorship, which our data suggests may be currently unmet. This is consistent with studies in AYA, where young people repeatedly report access to a dietitian as an unmet need during survivorship.20,21
A limitation of our study was the small numbers of patients in each cancer subtype. Consequently, it is difficult to confidently ascribe the risk of nutritional compromise for AYA with rarer cancer subtypes from our data. Another limitation was the retrospective design of this study, where the reliability of weight and height records from medical records may be limited and incomplete. Future research could address the prospective validation of our proposed stratification of cancer subtypes according to nutritional risk in a larger cohort of AYA across a number of centers.
In conclusion, this retrospective case note review found that almost half of AYA experience significant weight loss of ≥5%, and 20% became malnourished during treatment. AYA with ALL or LL, and AML (including APML) were most likely to be affected, and patients with bone sarcomas and SCC of the head and neck were also at high risk. Despite significant weight loss, weight loss and malnutrition were not mentioned in a large number of medical reviews. After treatment, those with ALL or LL were at significant risk of becoming overweight or obese. Dietetic involvement was suboptimal during times of significant weight loss and overweight and obesity. These data highlight the need for targeted nutrition support and a risk-stratified approach for dietetic services in the AYA population.
Footnotes
Author Disclosure Statement
No competing financial interests exist.
Funding Information
This study was funded by CanTeen Australia. Youth Cancer Services are funded by the Australian Government. The SA/NT Youth Cancer Service is also funded by the Government of South Australia and RedKite.