




Abstract
Background:
Adolescents and young adult (AYA) patients with sarcoma are at heightened risk of reduced physical capacity and disease-related weakness. Sit-to-stand (STS) performance correlates with lower extremity functionality and activities of daily living; however, little is known regarding the relationship between muscular status and STS performance in patients with sarcoma. This study assessed STS performance in patients with sarcoma and the association between STS performance and the skeletal muscle index (SMI) and skeletal muscle density (SMD).
Methods:
This study included 30 patients with sarcoma (15–39 years old) treated with high-dose doxorubicin. Patients performed the five-times-STS test before starting treatment and 1 year after the baseline test. STS performance was correlated with SMI and SMD. SMI and SMD were quantified using computed tomography scans taken at the level of the 4th thoracic vertebra (T4).
Results:
Mean performance on the STS test at baseline and 1 year was 2.2-fold and 1.8-fold slower than the age-matched general population, respectively. A lower SMI was associated with worse performance on the STS test (p = 0.01). Similarly, lower SMD at baseline was also associated with poorer STS performance (p < 0.01).
Conclusion:
Patients with sarcoma have very poor STS performance at baseline and 1 year, which was accompanied by low SMI and SMD at T4.The inability for AYAs to return to healthy age normative STS standards by 1 year may indicate a need for early interventions to enhance skeletal muscle recovery and promote physical activity during and after treatment.
Introduction
Adolescents and young adult (AYA) patients with sarcoma are treated with high doses of anthracycline agents such as doxorubicin (DOX) as part of chemotherapy treatment. While cure rates correlate with the dose of DOX received, there are deleterious off-target effects on skeletal muscle resulting in muscle wasting and fatigue in survivors. 1 In addition to DOX chemotherapy, many patients receive radiation and/or surgery; these treatments cause further damage to skeletal muscle and contribute to weakness and loss of physical function.2,3
Presently, there is no physical function examination that is routinely performed in AYA patients with sarcoma upon diagnosis or during treatment to assess poor physical function of the patient before the start and throughout cancer treatment. The sit-to-stand (STS) physical function test assesses lower body strength and endurance, transitional movements, and is associated with balance, and fall risk.4,5 STS performance is a known predictor of disability, hospitalization, and mortality in older individuals. 6 Moreover, there is a strong association between STS performance and independence in activities of daily living. 7 Therefore, the use of the STS test in AYA patients with sarcoma before the start and during their cancer treatments may allow for the early identification of individuals who are at risk of muscle wasting and fatigue and who may benefit most from the early implementation of strategies to prevent further skeletal muscle deterioration. There is no physical function examination that uses STS performance scoring as a risk factor to predict anthracycline-induced skeletal muscle wasting in AYAs.
Recently, computed tomography (CT) imaging has been used and validated for the assessment of skeletal muscle loss through quantification of skeletal muscle area (skeletal muscle index [SMI]) and composition (skeletal muscle density [SMD]). 8 AYA patients with cancer routinely receive surveillance chest CT for lung metastases (the most common site of relapse and metastatic spread) and cardiotoxic side effects of treatment. Therefore, in conjunction with STS monitoring, the use of chest surveillance CT scans to quantify SMI and SMD of muscle groups, such as the erector spinae muscles (which activate phase 1 of the STS motion), 9 may be a novel way to further identify those individuals most at risk for experiencing reduced physical function from therapy-induced skeletal muscle damage. This would facilitate early physical therapy intervention to build muscle and reduce the late effects of fatigue and weakness. While the natural inclination would be to correlate lower-body CT scans with STS performance, in the present clinical population full-body and/or lower-body CT scans are not routinely taken given the diversity of tumor locations.
Moreover, request for scans outside of regions of interest, unlike CT scans assessing for pulmonary disease, would expose patients to additional radiation and create financial and time burdens for the patient. Therefore, the purpose of this study was to assess physical function in AYA patients with sarcoma using the STS physical performance test and to correlate STS performance with SMI and SMD using surveillance CT chest scans that include thoracic vertebra 4 (T4).
Methods
Patients and assessments
Individuals 15 to 39 years of age who were diagnosed with sarcoma and whose treatment plans at MD Anderson Cancer Center included chemotherapy with DOX were included in the present study. This study was approved by the Institutional Review Board at The University of Texas MD Anderson Cancer Center (PA18-0462). Patients' informed consent was obtained before participation in the study. Thirty AYA patients (15 male, 15 female) participated in the study (Fig. 1). The average age and body mass index were 26 ± 6 years and 27.1 ± 10.3 kg/m2, respectively (Table 1). Osteosarcoma was the most common cancer type among the cohort. Although, diagnoses varied considerably (Table 2).
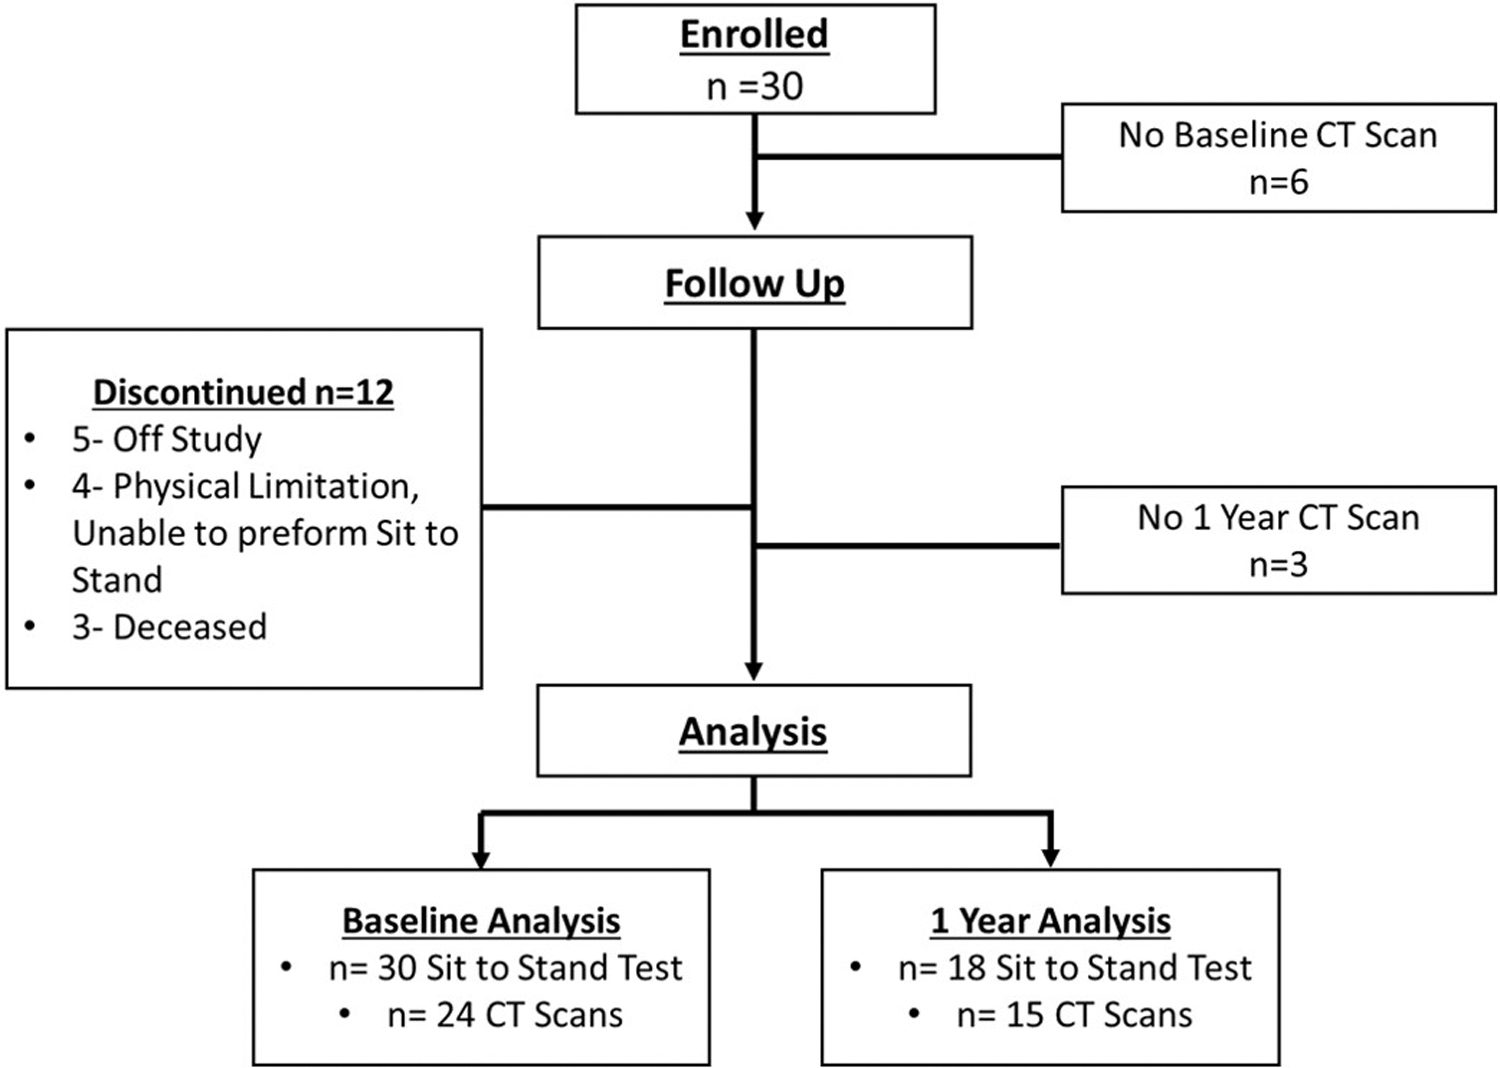
Study consort chart.
Participant Characteristics
p < 0.05.
BMI, body mass index; EST, erector spinae and transversospinales; HUs, Hounsfield units; PMM, pectoralis major and minor; SD, standard deviation; SMI, skeletal muscle index; SMD, skeletal muscle density; STS, sit-to-stand; TRM, trapezius and rhomboid major.
Patient Cancer Type and Tumor Location
Before the start of DOX treatment, patients performed the five-times-STS test, in which participants were asked to stand up from a seated position five times in a row as quickly as possible.5,10 The time to completion was recorded to the tenth of a second. Patients subsequently began DOX treatment, and the STS examination was repeated 1 year later. Routine CT images, taken before DOX-based chemotherapy (baseline) and 1 year later, were used to quantify indices of skeletal muscle cross-sectional area (SMI) and skeletal muscle composition as quantified through SMD, with muscle attenuation represented as Hounsfield units (HUs) at the T4 level. 11 The T4 region previously has been used to determine cancer cachexia and sarcopenia in various populations.12–15 Once T4 CT images were identified, exported, and anonymized, a web toolkit for analytic morphomics CoreSlicer (coreslicer.com) was used to manually outline (completed by a single trained investigator) and generate SMI and SMD values for the muscle groups of interest. 16
Muscle groups of interest at the T4 level included the erector spinae and transversospinales (EST), trapezius and rhomboid major (TRM), pectoralis major and minor (PMM) muscles, and total muscle, which was defined as the sum of the three areas (EST+TRM+PMM). More specifically, total SMI was calculated by summing area/height 2 for the three segments. Total SMD was calculated by summing the HU for each of the three segments, which was first multiplied by the segment area (a) and then divided by total area ([HU1Xa1]+[HU2xa2]+[HU3 × a3])/Total Area.
Statistical analyses
Pearson correlation analyses were used to assess the relationships between STS performance and the SMI and SMD. A one-way analysis of variance was performed to determine the differences in STS, SMI, and SMD between female and male participants. To rule out the potential influence of radiation or surgery and understand the impact of tumor location on STS performance additional one-way analysis of variance was conducted. All statistical analyses were performed using SPSS software, version 21.0 (IBM Corporation, Armonk, NY). A p-value <0.05 was considered statistically significant.
Results
STS and skeletal muscle at baseline
The mean performance time for the baseline STS test was 14.5 ± 5.8 seconds (Fig. 2). Age-matched average normative performance has been previously reported as 6.0–6.5 seconds. 4 Mean performance on the sit-to-stand test at baseline was 2.2-fold slower than the age-matched general population. Although female participants took, on average, ∼3 seconds longer for STS completion than male counterparts, this difference in completion time was not statistically significant (p = 0.14) (Table 1). Male patients had a greater baseline PMM SMI value than female patients (15.31 ± 5.18 cm2/m2 vs. 10.95 ± 4.82 cm2/m2, p = 0.04), which contributed to greater total SMI in males compared with females (27.50 ± 6.63 cm2/m2 vs. 20.92 ± 6.18 cm2/m2, p = 0.02). No other significant SMI nor SMD muscle group differences were found at baseline (Table 1). Moreover, no significant differences in SMD were detected between male and female patients (Table 1).

Five times sit-to-stand participant performance frequency.
STS and skeletal muscle at 1 year
At 1 year, the mean performance on the STS test was found to moderately improve (11.5 ± 4.5 seconds, p = 0.07) (Fig. 2). Nevertheless, mean performance on the STS test at 1 year was 1.8-fold slower than the age-matched general population. Males were found to perform significantly better than females at 1 year (8.9 ± 2.3 seconds vs. 14.6 ± 4.7 seconds; p < 0.01; Table 1). Males saw a 31% improvement in STS performance, whereas females experienced a 9.9% improvement at 1 year. At 1 year, males had significantly greater PMM (p < 0.01) and total muscle (p < 0.01) SMI values than females (Table 1). Males also had better PMM SMD than females (47.33 ± 6.03 HU vs. 37.18 ± 7.12 HU; p = 0.01) at 1 year. Neither female nor male participants had significant total SMI loss at 1 year when compared with baseline (1 year—Baseline = Mean Diff. ± SE; Females; −2.29 ± 2.61 cm2/m2, p = 0.38; Males 0.24 ± 2.79 cm2/m2, p = 0.94). Similarly, no significant reduction in total SMD was found for females or males at 1 year (1 year—Baseline = Mean Diff. ± SE; Females; −7.58 ± 4.17 HU, p = 0.08; Males 2.78 ± 4.44 HU, p = 0.53).
However, when comparing Male versus Female loss at 1 year, females had significantly greater reductions in total muscle SMD than males (p < 0.01). No significant difference between females and males was found regarding change in total SMI (p = 0.08).
The PMM and total muscle SMI values were significantly correlated with STS performance at baseline and 1 year (Table 3). Specifically, lower SMI values at baseline and 1 year were associated with worse performance on the STS test. This finding was indicated by moderately negative associations between the PMM (r = −0.42; p < 0.01) and total muscle (r = −0.40; p = 0.01) SMI values and STS test performance. A similar relationship was seen between SMD and STS performance. Strong negative associations were found for PMM SMD (r = −0.61; p < 0.01), and moderate negative associations were found for total muscle SMD (r = −0.53; p < 0.01) (Table 3), indicating that lower SMD was associated with poorer STS performance.
Association Between Sit-to-Stand Performance and Skeletal Muscle Index and Density at Baseline and 1 Year Combined
p < 0.05.
Baseline STS performance was not associated with a reduction in SMI or SMD at 1 year (p > 0.05 for both variables; data not shown). Lastly, a reduction in SMI or SMD was not correlated to a reduction in STS performance (Table 4).
Association Between Baseline Sit-to-Stand Performance and Change in Skeletal Muscle Index and Density
Δ = 1-year muscle mass – baseline muscle mass.
STS, cancer treatment, and tumor location
Patients were more frequently diagnosed with upper-body cancers (n = 20) than lower-body cancers (n = 10) (Table 2). At baseline, individuals with upper-body cancers performed similarly to those with lower-body cancers on the STS test (12.46 ± 3.33 seconds vs. 15.09 ± 5.64 seconds, p = 0.23). However, at 1 year, individuals with lower-body cancers were found to perform significantly worse on the STS than individuals with upper-body cancer (13.73 ± 6.74 seconds vs. 10.34 ± 2.52 seconds, p < 0.01).
Nine out of 18 patients had surgery between baseline and 1 year STS performance; 4 Resections, 1 Above Knee Amputation, 1 Arm Amputation, 2 Laminectomy, 1 Adrenalectomy, and 1 Skin Sparing Surgery/Mastectomy. Four out of 18 patients received radiation between baseline and 1 year STS performance. STS performance at 1 year was not significantly different between patients who received surgery and patients who did not receive surgery (No Surgery-Surgery ± standard error mean (SEM) = 0.31 ± 2.18 seconds, p = 0.90). Similarly, no difference in 1 year performance was found for patients who received radiation versus no radiation (No Radiation-Radiation ± SEM = 3.60 ± 2.47 seconds, p = 0.16).
Discussion
This study demonstrated that the average STS performance in the AYA patient cohort was outside of the healthy age- and sex-matched normative values before DOX therapy and 1 year later, emphasizing the state of poor physical function of this patient population. This study investigated the relationship between physical performance test through STS and SMI and SMD using CT scans in AYA patients with sarcoma. SMI and density at T4 correlated with STS performance before DOX therapy and 1 year later. Worsening of STS performance was not associated with skeletal muscle deterioration as quantified through chest CT scan. Moreover, STS performance before chemotherapeutic treatment was unable to identify at-risk individuals for skeletal muscle loss.
Previous studies of healthy individuals have reported normative five-times-STS performance values of 6.5 ± 1.2 seconds in individuals 14 to 19 years of age and 6.0 ± 1.4 seconds in patients 20 to 29 years of age. The range in performance for both age groups combined was 3.9 to 11.2 seconds. 4 In contrast, the average baseline performance of the present AYA sarcoma patient cohort (14.5 ± 5.8 seconds) was comparable to that of a geriatric, community-based cohort of individuals 80 to 89 years of age. 17 The correlation between STS performance and lower extremity function, lower extremity strength, and a decreased ability to perform the activities of daily living has been well established in older populations, 4 and the frail state of our AYA patients before DOX therapy, as determined by their STS performance, indicates that they are likely to experience similar limitations. Moreover, poor performance on the five-times-STS test, classified as a completion time greater than or equal to 10 seconds, predicts disability, hospitalization, and death in the elderly. 6
While these relationships have yet to be established for AYA patients with sarcoma, the incorporation of basic physical function tests such as the STS test at diagnosis may help identify patients who are at an increased risk of adverse events during cancer treatment. Successful early identification of these individuals would allow for early interventions such as physical and occupational therapies.
A significant reduction in STS performance has been seen previously 3 months after diagnosis in children with leukemia undergoing cancer treatment. 18 Muscle atrophy induced by cancer treatment has been hypothesized to be one of the primary causes of performance limitations, 19 and reductions in musculoskeletal strength and postural control are common among survivors of childhood cancer who have been treated with chemotherapeutics.20,21 In our AYA cohort, although some recovery of physical function took place at 1 year, on average, the mean STS performance (11.5 ± 4.5 seconds) remained well outside the known age- and sex-matched normative performance. The average performance of our patients at 1 year was comparable to that of individuals 60 to 69 years of age. 17 AYA cancer survivors' inability to return to the age- and sex-normative STS performance at 1 year may indicate an inability to recover adequate skeletal muscle function after therapy is completed. This finding supports the need for appropriate interventions such as exercise or physical therapy to rebuild muscle strength.
Such interventions may prevent the development of late comorbidities associated with decreased muscle strength, such as fatigue, inactivity, and cardiovascular disease. Given the paucity of literature investigating STS performance in AYA and pediatric populations, other than in patients with cerebral palsy, 22 larger studies are needed to understand STS performance in AYA patients with cancer during and after cancer therapy. Moreover, given that males experienced a 31% improvement in STS performance and women only 9.9% at 1 year, our data also suggest that emphasis should be placed on determining why female AYA patients with sarcoma experience greater physical performance disparities. Although statistically insignificant, female AYA patients experienced greater absolute loss of total SMI at T4 than their male counterparts at 1 year. Physical performance disparities may be in part explained by taking into consideration this finding alongside significantly greater reductions in SMD at 1 year and overall lower skeletal muscle area found in female AYAs.
This study of AYA patients with sarcoma found a significant relationship between skeletal muscle at T4 using surveillance chest CT scans and STS performance. Specifically, patients with greater PMM and total muscle SMI and SMD were found to have better STS performance. The erector spinae muscles are intricately involved in the biomechanical movements required during an STS test. 9 These muscles initiate phase 1 of the STS motion and are responsible for 14.6% of the movement. 9 While no known direct biomechanical relationship exists between the STS motion and the TRM and PMM muscle groups, one can hypothesize that such a connection exists because of a kinetic and synergistic relationship between the muscle groups at the T4 level. Both the erector spinae muscles and the TRM muscles function synergistically as postural muscle groups.23,24 Collectively, these muscle groups influence each other directly and indirectly during static postural control and movement, which may explain their relationship to STS performance.
Although we found that skeletal muscle status and STS performance are correlated, our data suggest that all AYA patients with sarcoma may be at risk of musculoskeletal loss, regardless of their performance on the STS test, before cancer treatment. The present study found that, even in cases in which participants performed well on the STS test at baseline, skeletal muscle loss still occurred as defined by chest CT. This finding suggests that STS physical performance may not be a good predictor of skeletal muscle loss. Moreover, neither a reduction in SMI nor a reduction in SMD was associated with a reduction in STS performance. This unexpected lack of association indicates some of the limitations of using chest CTs to link muscle status to STS physical performance. The STS motion can be categorized into three phases. Phase 1 is the weight-shift phase, characterized by forward leaning of the torso and lumbar and pelvic flexion. Phase 2 is the transition phase, in which momentum is transferred from forward to upward motion. Finally, phase 3 is the lift phase, in which the trunk and knees are extended to achieve full standing posture. 9
Given that the nature of the STS performance movement pattern is predominantly driven by lower body function, atrophy of total body lean mass or the muscles of the lower limbs such as the quadriceps, which are known to be the most important muscle for STS, may be more closely correlated to the changes seen in STS performance than atrophy of muscles at the T4 level. Differential or inconsistent atrophy is expected as different skeletal muscle groups experience variable rates of gain and loss. 25 Moreover, more than half of variance in STS performance is attributed to other significant factors such as physiological (sensorimotor function and balance) and psychological (pain, depression, anxiety, and vitality) processes, which additively represent transfer skills 26 that were not measured in the present study.
There are several limitations, which should be considered in the present study. First, our investigation was limited to 2-D muscle imaging analysis using surveillance CT scans. Future studies should consider muscle architecture and neuromuscular function variability as potential confounding factors affecting STS performance. Second, the patient cohort consisted of individuals with various tumor locations and sarcoma diagnoses. Although all participants received >250 mg/m2 of DOX, it should be noted that other variables, such as physical inactivity, surgery, radiation, tumor location, dietary habits, weight status, and multiagent chemotherapy, may have contributed to the muscle wasting and reduced physical function seen in our cohort. The present study was not designed to selectively identify the contributions of each of these variables. Larger studies are needed to further establish normative STS test results and SMI and SMD values for AYA patients with cancer to compare the impact of clinical treatments on muscle status and physical performance. 27
Moreover, larger studies should include physical activity quantification to investigate the immediate relationship and impact of activity level on STS performance as well as skeletal muscle. Lastly, we demonstrated that individuals with a “good” STS test result before chemotherapy still experience muscle deterioration. Therefore, “good” performance on the STS test before therapy does not correlate with reduced risk of muscle damage and the late effects associated with decreased muscle function, such as fatigue and inactivity. Future studies that investigate the relationship of STS performance and the development of chronic fatigue and decreased ability to perform the activities of daily living in survivors are needed. This will allow clinicians to identify the individuals who are most at risk of developing muscle fatigue and the resultant late effects and to provide appropriate early interventions to counteract muscle damage.
Conclusion
AYA patients with sarcoma were found to have very poor physical performance on the STS test both at diagnosis and 1 year later. Moreover, poor STS performance was associated with low SMI and SMD values at the T4 level. Implementing physical function tests such as the STS in parallel with surveillance CT scans to accurately monitor skeletal muscle and function changes may lead to the identification of patients at risk of muscle damage as STS test alone did not predict muscle loss. Identifying these at-risk individuals during and immediately after therapy will allow appropriate early interventions to be made to prevent further musculoskeletal deterioration, reduce fatigue, and improve the quality of life in AYA cancer survivors.
Footnotes
Acknowledgment
The authors thank Laura L. Russell, scientific editor, Research Medical Library, for editing this article.
Authors' Contributions
S.V.W.: conceptualization, data curation, formal analysis, investigation, methodology, project administration, validation, visualization, writing—original draft, and writing—review and editing; B.A.: investigation, methodology, project administration, supervision, validation, visualization, writing—original draft, and writing—review and editing; A.L.: data curation, investigation, and writing—review and editing; M.A.T.H.: writing—original draft, and writing—review and editing; J.C.: original draft, and writing—review and editing; S.C.G.: conceptualization, investigation, methodology, supervision, writing—original draft, and writing—review and editing; M.R.: data curation, investigation, methodology, supervision, writing—original draft, and writing—review and editing; E.K.: conceptualization, investigation, methodology, project administration, resources, supervision, visualization, writing—original draft, and writing—review and editing.
Author Disclosure Statement
The authors have no conflicts of interest to disclose at this time. Dr. Gilchrist is former Professor of Cardiology at MD Anderson Cancer Center and is now employed by LabCorp Drug Development and is a consultant for a virtual cardiac rehabilitation company, Moving Analytics. There are no conflicts of interest to disclose related to this article.
Funding Information
This work was supported in part by the Cancer Prevention and Research Institute of Texas (RP200381). This study was additionally supported in part by a donation from the Texas 4000 and the National Cancer Institute P30CA016672 institutional core grant.