




Abstract
Purpose:
Adolescent and young adult (AYA) women facing gonadotoxic cancer treatments are recommended to consider fertility preservation. However, fertility clinics are scarce in number and location. We describe geographic access to fertility clinics in a statewide cancer population.
Methods:
This cross-sectional study included 5,632 AYA women from the North Carolina Central Cancer Registry diagnosed with lymphoma, breast, or gynecological cancers who received gonadotoxic treatment during 2004–2015. Geographic access was defined as travel time from patient residence to the nearest fertility clinic at diagnosis. Multivariable logistic regression was used to calculate prevalence odds ratios (POR) and 95% confidence intervals (CIs) for the association between travel time and individual and contextual factors (neighborhood socioeconomic status and rurality).
Results:
Mean travel time was 51 ± 42 minutes, and 42% of AYAs lived <30 minutes from a clinic. Black non-Hispanic women, those living in advantaged neighborhoods, metropolitan areas, and privately insured had shorter average travel times. Black non-Hispanic women were more likely to live <30 minutes from a clinic than their white non-Hispanic counterparts (POR = 3.3; 95% CI: 2.8–3.8). Publicly insured (vs privately) AYAs and those living in the most (vs least) deprived neighborhoods were 40% less likely to live within a 30-minute drive (POR for both = 0.6; 95% CI: 0.5–0.7). Compared to metropolitan areas, micropolitan (small city) residents were less likely to live <30 minutes from a clinic.
Conclusion:
The burden of travel time to fertility clinics showed important differences by race and ethnicity, neighborhood SES, insurance, and rurality. The results emphasize the need for tailored and multifaceted strategies to improve access.
Introduction
Fertility and reproductive planning are central to quality of life concerns for adolescents and young adults (AYAs, ages 15–39) diagnosed with cancer during their reproductive years.1,2 Two-thirds of AYA women reported interest in having children after treatment.3,4 The most commonly diagnosed cancer types among women of reproductive age include breast, lymphoma, and gynecological sites.5,6 Frequently used therapies to treat these cancers include chemotherapy, pelvic radiation, and gynecological surgery, which are potentially gonadotoxic and may reduce fertility.7,8 National guidelines recommend informing patients about infertility risks prior to initiating treatment, discussing fertility preservation options, and providing an immediate referral to a fertility specialist. 9 Despite guidelines and scientific advancements in assisted reproductive technology (ART), gaps still exist in implementing recommendations.
Fertility specialists provide fertility preservation treatment options to protect reproductive potential before cancer therapy, such as open-accesszing oocytes, sperm, or embryos.4,9 Several studies have reported that AYA women have limited access to these subspecialized medical services, making geographic access a potential barrier to guideline-concordant cancer care.10–15
Geographic access, or accessibility, is the (potential) physical ability of individuals to reach health care locations when in need of a specific service. Accessibility can be measured for an entire study population, regardless of whether a service was utilized (realized), while accounting for transportation burden.16–18 Travel time to the nearest facility is a widely used proxy for accessibility. 18 Nationwide- and state-level geographic access to ART services have been scarcely studied and with varying methodologies.14,19 For example, when defined as the percentage of reproductive-age women living within 60 minutes of a fertility clinic (service area), access in southern states varies widely: North Carolina, 72%, Tennessee, 83%, Mississippi, 41%, West Virginia, 25%, and Virginia 78%. 19 When defined by the percentage of women of reproductive-age living in census-based metropolitan areas with ART clinics, 71% have regional access to at least one clinic (underserved). 14 These studies measured potential access for spontaneous demand of any type of fertility care by all women of reproductive age and may not represent the needs of AYA women requiring an urgent visit for preservation-specific services before starting cancer treatment. Studies of potential access are key to describing the burden of access for specific populations and in identifying potential disparities between locations or demographic groups, which are vital components of planning and policy making.
Neighborhood-level socioeconomic status has been associated with cancer prevalence and mortality,20,21 with moderate evidence of an association with fertility outcomes in the general population. 22 Studies of potential access to fertility clinics in the general population14,19 and reports of service utilization in the AYA cancer population15,23–28 have been inconsistent in measuring access, but commonly use either distance to ART services23–26 or degree of urbanicity.15,27,28 To our knowledge, no studies have explored the intersection of both access measures in this population.
In this cross-sectional study, we aimed to describe potential geographic access to fertility clinics in North Carolina (NC) among AYA women diagnosed with cancer from 2004 to 2015 and to evaluate how individual- and context-level factors relate to geographic access. Our analysis accounted for variations in travel time within the rural–urban spectrum to reflect any variations in burden across NC.
Methods
Study population
We conducted a secondary analysis using data from the AYA Horizon Study, which examined pregnancy outcomes after cancer diagnosis. Eligible women had a first primary diagnosis of lymphoma (Hodgkin and non-Hodgkin), breast, or gynecological (ovarian, uterine, and cervical) cancer ages 15–39 during 2004–2015 in the NC Central Cancer Registry (NCCCR) (n = 7,673). 29 A detailed description of the study has been published; 30 relevant to our analysis, the AYA Horizon Study provided both patient and fertility clinic location in the year of diagnosis, which allowed our calculation of travel time.
We excluded 564 (7%) women for inadequate point location information at diagnosis (missing coordinates, incomplete addresses, or implausible travel time). Next, we selected women who received gonadotoxic cancer treatment as first course of cancer treatment. Exclusions were due to missing treatment (1%), no treatment received (4%), and no gonadotoxic treatment received (4%) for a final sample size of 5,632. The Institutional Review Board at the University of North Carolina at Chapel Hill approved this study.
Individual-level factors
All individual-level factors came from the NCCCR and included cancer type, as defined by International Classification of Diseases for Oncology-Third Edition (ICD-O-3) and AYA Site Recode ICD-O-3-2008 system 31 (Supplementary Table S1), age at diagnosis, year and stage at diagnosis, race/ethnicity, insurance, marital status, first-course of cancer treatment, and longitude and latitude coordinates for residence at diagnosis.
Contextual factors
Contextual factors were assigned using FIPS codes at the census tract level and included rural–urban status and neighborhood socioeconomic status. We used the 2010 primary rural–urban commuting area (RUCA) codes from the, which classify census tracts in four main categories: metropolitan, micropolitan, small town, and rural. 32 To define neighborhood-level socioeconomic status, we used the 2015 area deprivation index (ADI) from The Neighborhood Atlas®33,34 The ADI is a census-based composite measure of deprivation at the census block-group-level that incorporates 17 area-level socioeconomic variables from the 5-year American Community Survey. 33 The state-level ADI variable ranks block groups using deciles (1–10) from least (1) to most (10) disadvantaged. 34
Geographic access to fertility specialty care at SART-member clinics
The Society for Assisted Reproductive Technology (SART) is the largest professional-membership organization for Reproductive Endocrinology and Infertility services. 35 The vast majority of US-based fertility clinics are active SART members, such that >90% of all ART cycles are completed at member-clinics nationwide. Official SART reports indicate that from 2004 to 2010 all fertility clinics operating in North Carolina (NC) were SART members, and only one operating clinic was not affiliated with SART during 2011–2015.35,36 Over 96% of ART cycles were completed in SART-member clinics in NC during the study period.35,36 SART provided years of operation and exact addresses for the 13 affiliated clinics available in NC during 2004–2015. 35 Clinic addresses were geocoded using the Online World Geocoding Service tools in ArcGIS. 37
We measured geographic access as the travel time from each woman’s place of residence at diagnosis to the nearest SART-member clinic available in NC in the year of cancer diagnosis. We used a network-based model 18 for spatial analysis in ArcGIS with road network files from StreetMap Premium for ArcGIS 37 to calculate and map 38 the road-network-based travel time.
Statistical analysis
We identified individual and contextual factors likely associated with geographic access to fertility specialty care based on concepts from the Access to Health Care Conceptual Framework, the Cancer Care Continuum Process,39,40 and the literature on geographic access to and utilization of fertility specialty care and cancer care.14,19,41,42 We calculated the overall and RUCA-stratified proportion of the population with travel times within specific time cut points (15, 30, 60, 90, 120, and 150 minutes) determined both by the distribution of travel time and the prior literature.5,14,19,41,43 We used logistic regression to estimate prevalence odds ratios (POR) and 95% CIs for the likelihood of having a travel time within a specified cut point given the covariates of interest in the overall population and by RUCA categories. Cut points were informed by our descriptive analysis. Multivariable models included age (15–29 vs. 30–39 years), cancer type (gynecological, lymphoma, and breast), insurance (uninsured/public vs. private), marital status (single/divorced/widowed vs. partnered), RUCA (metropolitan, codes 1–3; micropolitan, codes 4–6; rural, for small town and rural codes 7–10), state-level ADI (deciles grouped into quintiles (Q1–Q5) with Q2 as referent group due to marked differences in mean travel times between Q1 and all other quintiles), and race/ethnicity (White non-Hispanic, Black non-Hispanic, and Other Women of Color [WOC] [Asian non-Hispanic, Other race non-Hispanic, and Hispanic of all races]). Additionally, we use the term WOC to combine Black non-Hispanic and Other WOC.44,45 Variables excluded from final models due to lack of association with travel time included cancer type, year and stage at diagnosis, and marital status, with the first three also showing signs of collinearity. We did not account for correlated measures. SAS version 9.4 (SAS Institute Inc., Cary, NC) was used for statistical analyses.
Sensitivity analysis
It is possible that some women living closer to fertility clinics in neighboring states may choose to attend out-of-state clinics. To assess the robustness of results, we identified all SART-member clinics available in 2010 (study mid-point) in four neighboring states (Georgia, South Carolina, Tennessee, and Virginia) from public files. 36 We obtained exact addresses and geocoded 28 additional SART-member clinics, for a total of 37 clinics in five states in 2010. 46 We calculated distance to nearest clinic in the study population and then repeated mean and mean difference calculations excluding women whose closest clinic was not in NC.
Results
A total of 5,632 women with a first primary lymphoma, breast, or gynecological cancer diagnosed ages 15–39 from 2004 to 2015, and who received potentially gonadotoxic cancer treatment were identified in the NCCCR. Overall, 79% received chemotherapy, 2% radiation, and 19% underwent surgery as first-course treatment. From 2004–2015, 13 SART-member clinics, with varying years of operation (range 1–12 years) were available in NC. Five clinics operated during the entire study period. Half of the women had breast cancer, 25% were Black non-Hispanic, 8% Hispanic of all races, and 2% Asian non-Hispanic; 67% had private insurance, 80% lived in metropolitan areas, and 34% lived in the most disadvantaged neighborhoods (Table 1). Figure 1 shows the spatial distribution of SART clinics in NC in relation to statewide RUCA categories, with clinics located centrally in metropolitan areas, and the case count by county (top panel), as well as the clinic distribution in relation to statewide ADI quintiles.

AYA study population count, spatial distribution of SART-member clinics in NC, and spatial distribution of statewide RUCA and ADI categories. Top panel. Shows graduated blue circles the case count aggregated by county for AYA women diagnosed with cancer in NC in 2004–2015 (n = 5,632) who would potentially need fertility preservation services; the 13 SART-member fertility clinics in NC available during the study period (symbols may overlap for locations with more than one clinic close by); and statewide spatial distribution of RUCA categories (census tract-level) in NC. All NC counties (n = 100) had cases during the study period. Bottom panel. Shows counties with SART-member fertility clinics in NC available during the study period (symbols may overlap for locations with more than one clinic close by); and statewide spatial distribution of ADI quintiles in NC (census block group-level). ADI, area deprivation index; AYA, Adolescent and Young Adult. RUCA, rural–urban commuting area; NC, North Carolina; SART, Society for Assisted Reproductive Technology.
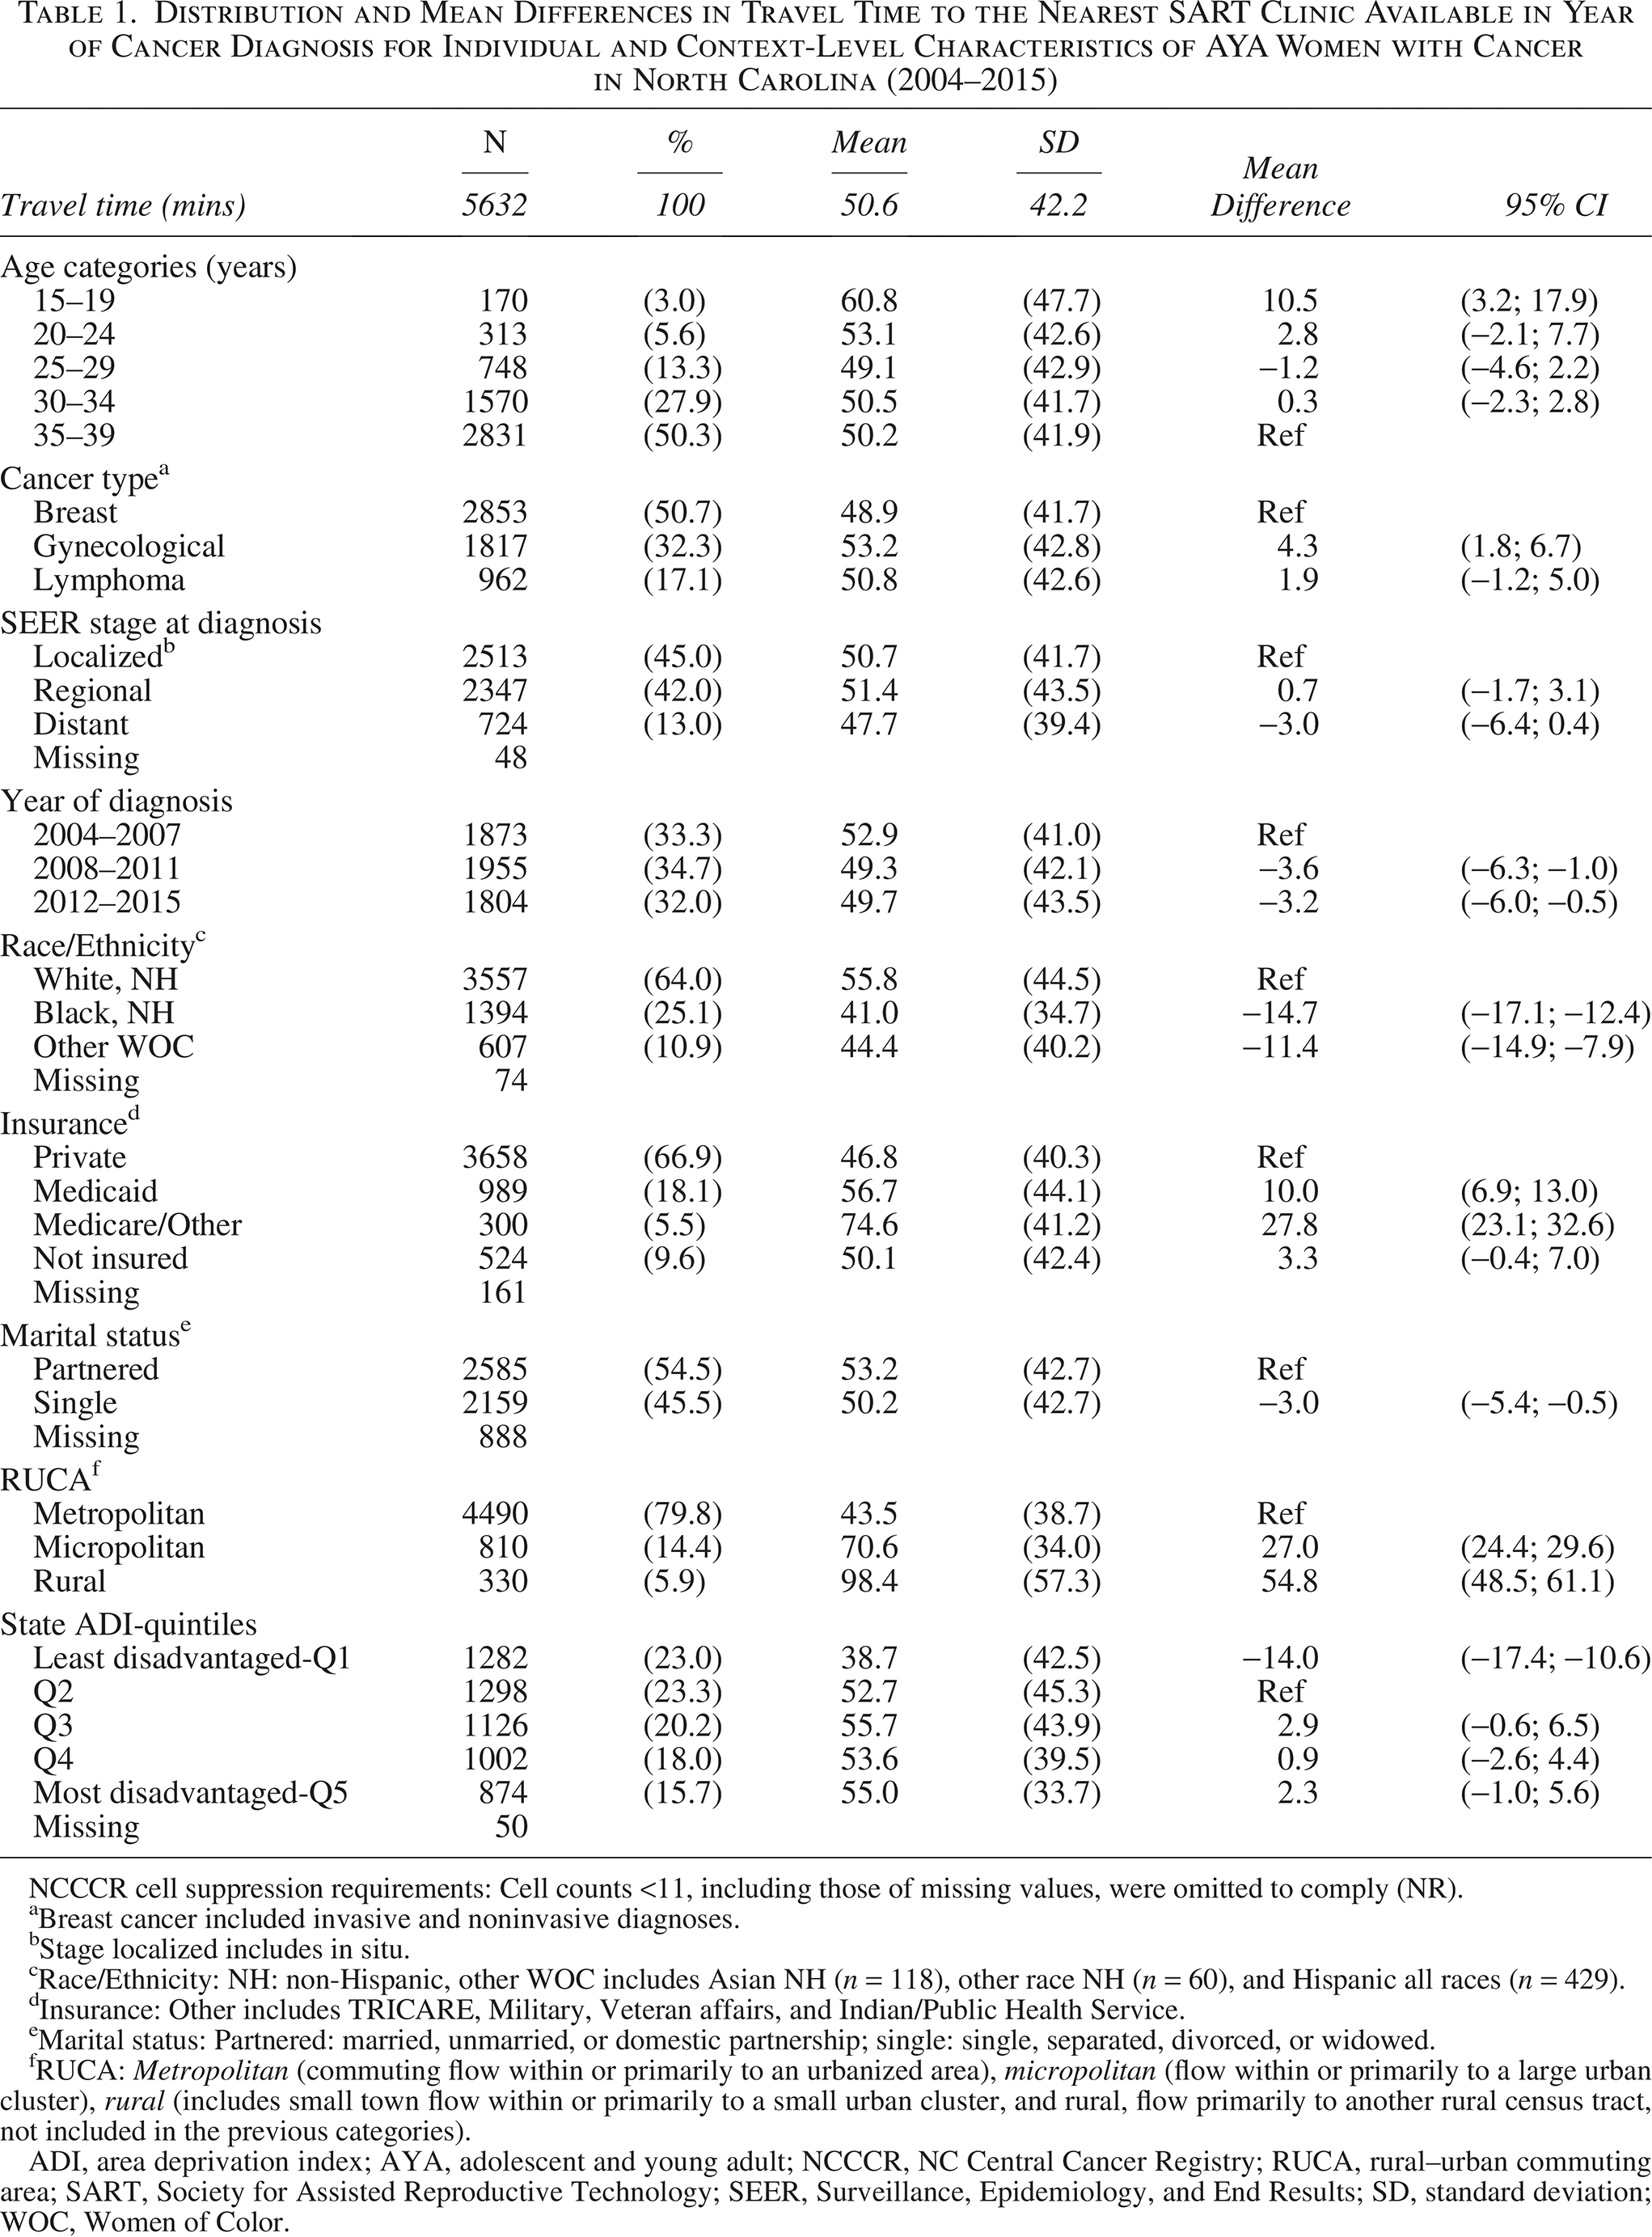
Distribution and Mean Differences in Travel Time to the Nearest SART Clinic Available in Year of Cancer Diagnosis for Individual and Context-Level Characteristics of AYA Women with Cancer in North Carolina (2004–2015)
NCCCR cell suppression requirements: Cell counts <11, including those of missing values, were omitted to comply (NR).
Breast cancer included invasive and noninvasive diagnoses.
Stage localized includes in situ.
Race/Ethnicity: NH: non-Hispanic, other WOC includes Asian NH (n = 118), other race NH (n = 60), and Hispanic all races (n = 429).
Insurance: Other includes TRICARE, Military, Veteran affairs, and Indian/Public Health Service.
Marital status: Partnered: married, unmarried, or domestic partnership; single: single, separated, divorced, or widowed.
RUCA: Metropolitan (commuting flow within or primarily to an urbanized area), micropolitan (flow within or primarily to a large urban cluster), rural (includes small town flow within or primarily to a small urban cluster, and rural, flow primarily to another rural census tract, not included in the previous categories).
ADI, area deprivation index; AYA, adolescent and young adult; NCCCR, NC Central Cancer Registry; RUCA, rural–urban commuting area; SART, Society for Assisted Reproductive Technology; SEER, Surveillance, Epidemiology, and End Results; SD, standard deviation; WOC, Women of Color.
The average travel time was 51 ± 42 minutes. WOC lived closer to clinics than White non-Hispanic women. Medicaid and Medicare insured women had longer travel times than those privately insured. Women living in micropolitan and rural areas had travel times that exceeded those from metropolitan areas by 27 and 55 minutes, respectively (95% CI: 24, 30 and 95% CI: 49, 61) (Table 1). Overall, people living in more urban areas, which includes most WOC in our study population, lived closer to fertility clinics. Roughly 42% lived within 30 minutes of a SART clinic at diagnosis, while 68% lived within 60 minutes and 83% within 90 minutes. These cut points were markedly different across the rural–urban spectrum (Table 2).
Percent of the Study Population with Travel Times to the Nearest SART Clinic within the Specified Cut Points, Overall, and Stratified by RUCA a Category

NCCCR cell suppression requirements: Cell counts <11, including those of missing values, were omitted to comply (NR).
RUCA: Metropolitan (commuting flow within or primarily to an urbanized area), Micropolitan (flow within or primarily to a large urban cluster), Rural (includes Small Town flow within or primarily to a small urban cluster, and Rural, flow primarily to another rural census tract, not included in the previous categories).
Race/Ethnicity: NH: non-Hispanic, other WOC includes: Asian NH (n = 118), other race NH (n = 60), and Hispanic all races (n = 429).
Insurance: Other includes: TRICARE, Military, Veteran affairs, and Indian/Public Health Service.
ADI, area deprivation index; NCCCR, NC Central Cancer Registry; RUCA, rural–urban commuting area; SART, Society for Assisted Reproductive Technology; WOC, Women of Color.
Table 3 shows models with the best fit and without positivity issues for associations between individual- and context-level variables and prevalence odds of living within specific travel times, overall and stratified by RUCA. Overall, the prevalence odds of living within 30 minutes of the nearest clinic was higher for WOC compared to White, non-Hispanic women: Black, non-Hispanic women (OR: 3.3; 95% CI: 2.8, 3.8); other WOC (OR: 2.6; 95% CI: 2.1,3.2). Publicly insured or uninsured women were 40% less likely to live within 30 minutes of a clinic compared to privately insured women (POR: 0.6 95% CI: 0.5, 0.7). Compared to women in Q2 neighborhoods, women in the most advantaged neighborhoods (Q1) at diagnosis had 2.8 times the prevalence odds of living within 30 minutes of their nearest clinic (95% CI: 2.3, 3.3). When compared to metropolitan areas, women in micropolitan and rural areas were 97% and 96% less likely to live within 30 minutes from a clinic (POR: 0.03 95% CI: 0.02; 0.05 and POR:0.04 95% CI: 0.03, 0.07). Travel time cut points for metropolitan, micropolitan, and rural areas with the best model fit were at 30, 60, and 90 minutes, respectively. The prevalence odds of living within each cut point (closer to clinics) were higher for all WOC in metro-and-micropolitan areas, but in rural areas, odds were higher only for Black non-Hispanic women. Women with public insurance were less likely to live closer to clinics in metro and micropolitan areas, but not in rural areas. ADI varied widely in magnitude and direction across RUCA categories.
Prevalence Odds Ratios and 95% Confidence Intervals for the Likelihood of Having a Travel Time from Place of Residence to the Nearest Fertility Clinic within the Set Cut Point, Overall, and Stratified by RUCA a Category

Overall model was adjusted for: age at diagnosis, race/ethnicity, insurance status, ADI, and RUCA.
Stratified models were adjusted for age at diagnosis, race/ethnicity, insurance status, and ADI.
RUCA: Metropolitan (commuting flow within or primarily to an urbanized area), micropolitan (flow within or primarily to a large urban cluster), rural (includes small town flow within or primarily to a small urban cluster, and rural, flow primarily to another rural census tract, not included in the previous categories).
Race/Ethnicity: Other Women of Color includes Asian NH, other race NH, and Hispanic all races.
Insurance: Public includes not insured, Medicaid, Medicare, and other (TRICARE, Military, Veteran affairs, and Indian/Public Health Service).
ADI, area deprivation index; 95% CI, 95% Confidence Intervals; RUCA, rural–urban commuting area.
Figure 2 displays the straight-line travel time routes between each census tract centroid and the nearest SART clinic. In our sensitivity analysis, we found that 468 (8.3%) of women had their nearest SART clinic in a neighboring state. The mean travel time decreased 8 minutes when removing women who matched with an out-of-state clinic (Table 4). The same pattern was observed for mean travel time and mean differences across variables when these 468 women were excluded.
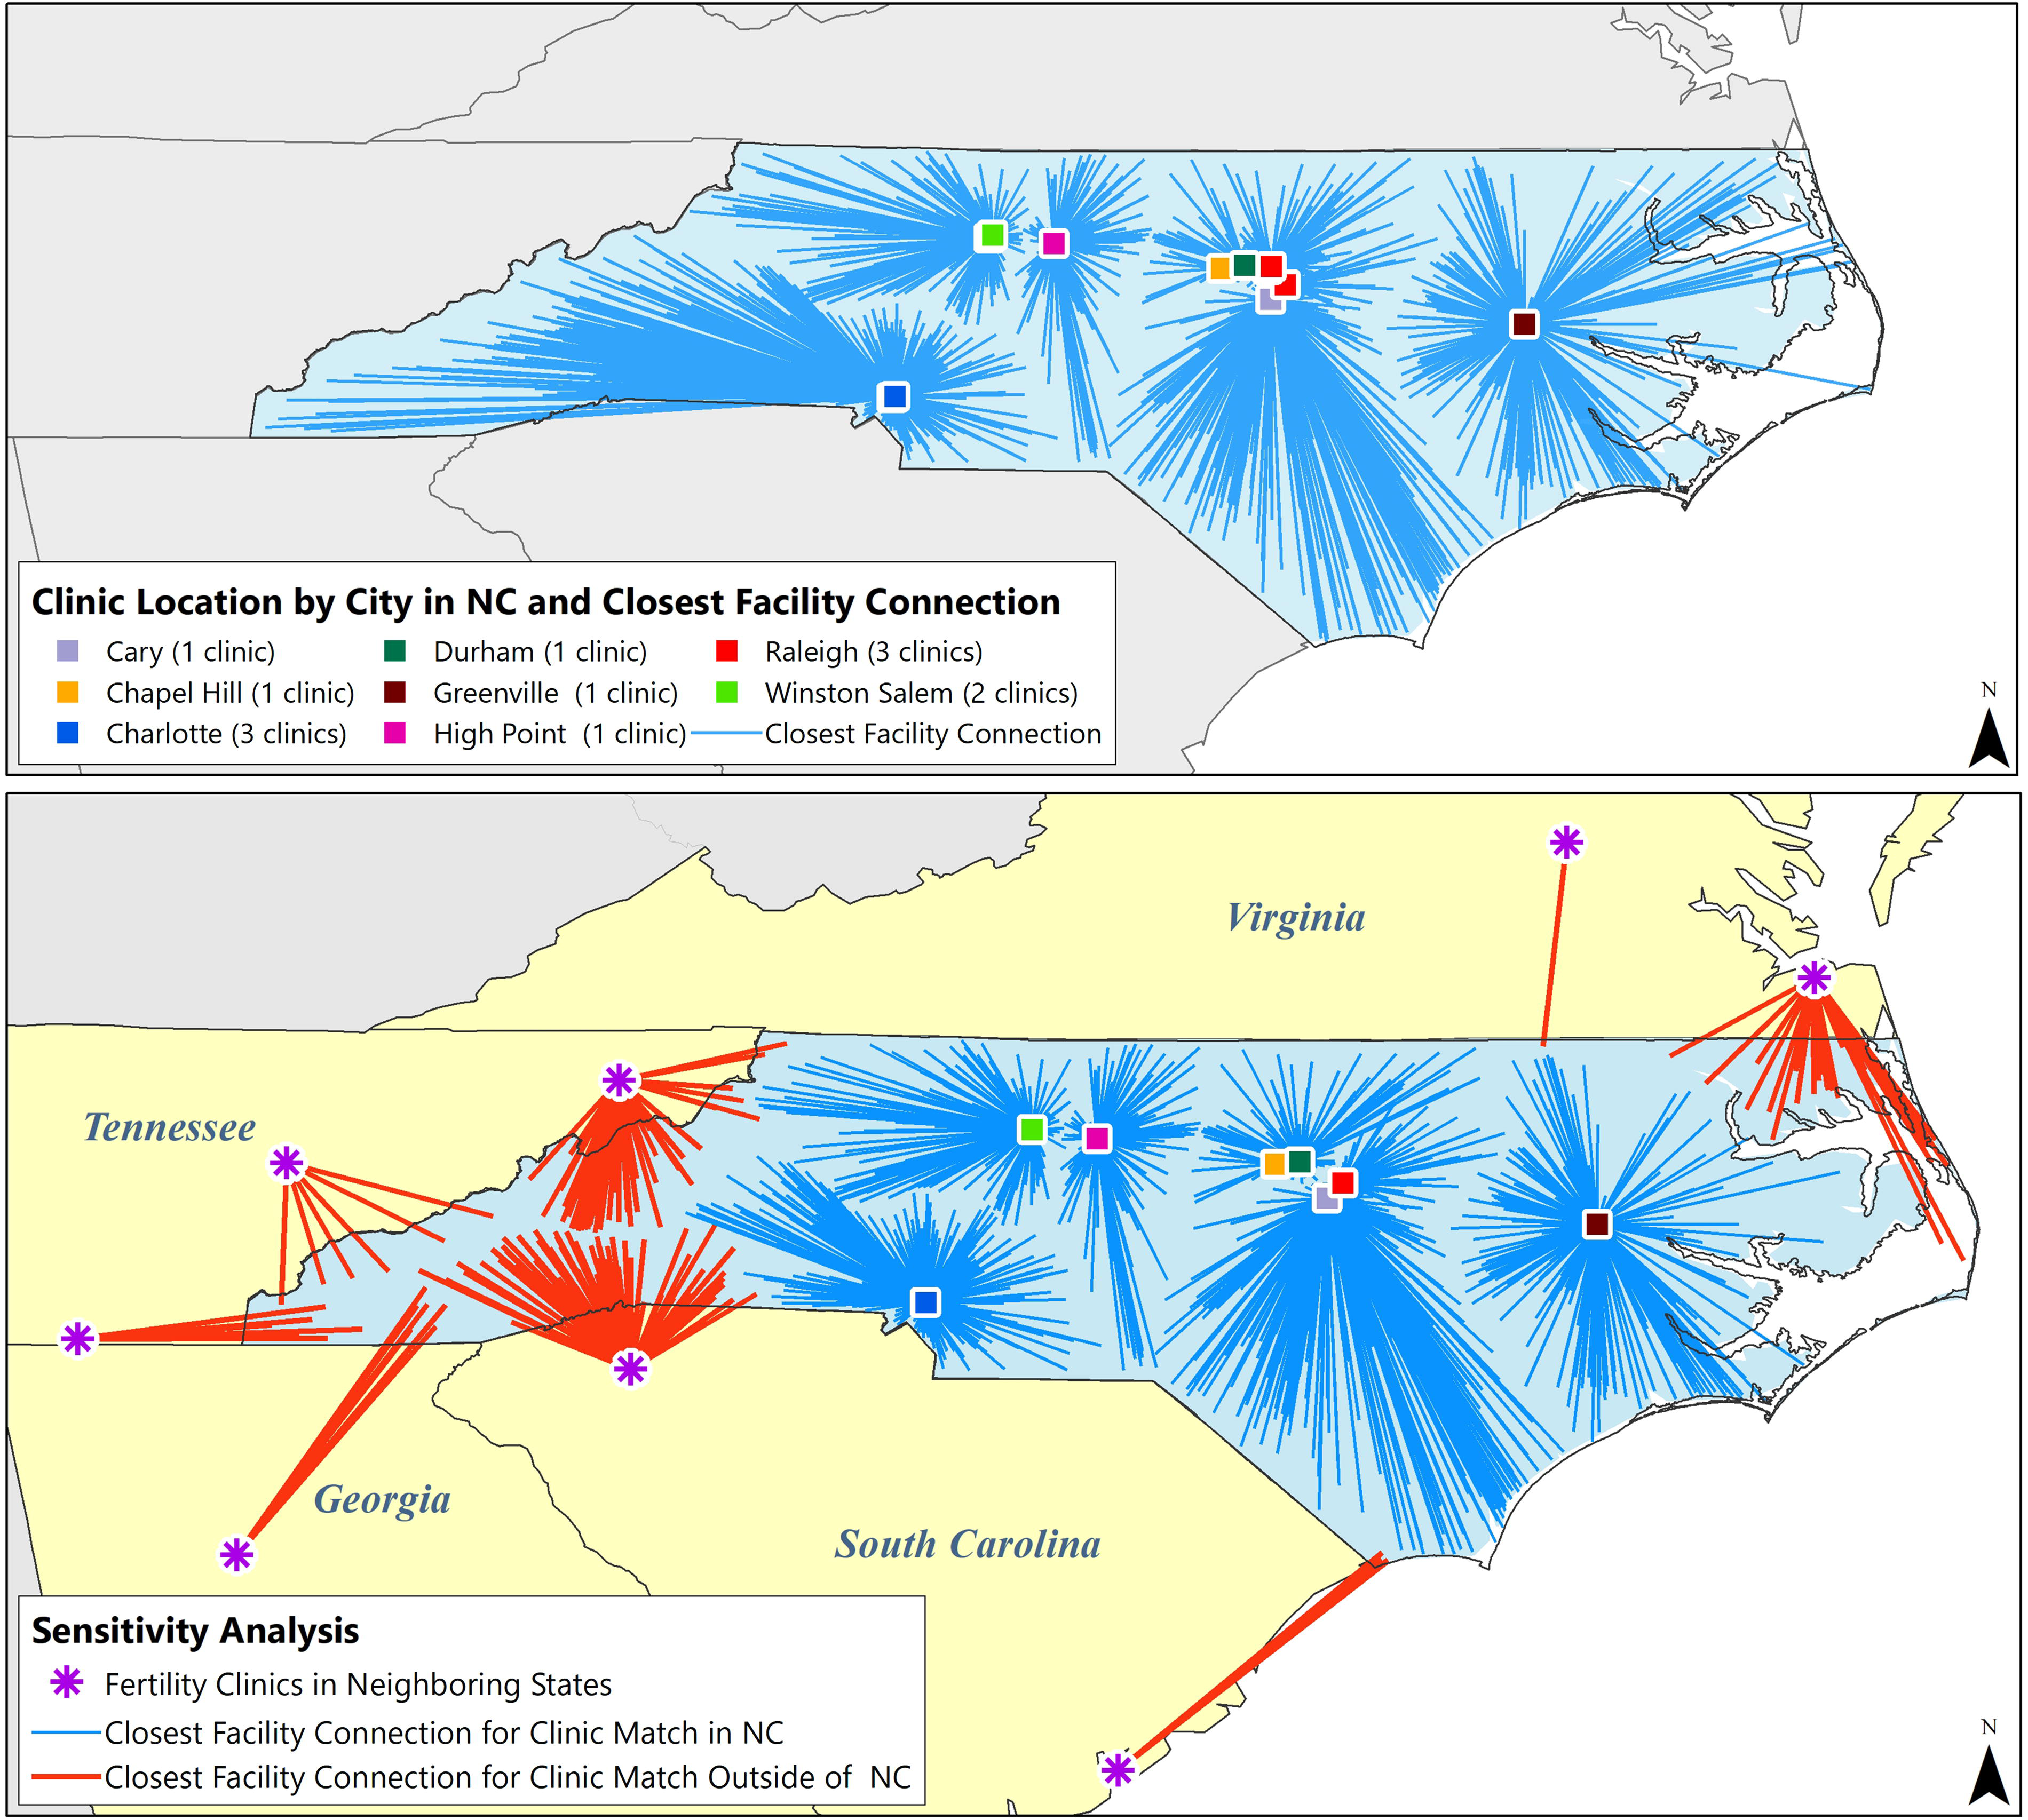
Top panel: Spatial distribution of the 13 SART-member clinics in NC available from 2004–2015 and aggregate measures of straight-line travel time routes (facility connection) from the census tract centroid to the nearest SART-clinic for the AYA study population (n = 5,632). Data were aggregated at the census tract level for visualization while maintaining privacy protection; aggregated data were not used for statistical analysis. Clinics are color-coded by their city location (8 cities). The length of each line represents the travel time in minutes, and longer lines represent longer travel times (routes are displayed as a straight-line for visual aid, but were measured as a route within the street network). If at least one woman resided in a census tract during the study period, the census tract centroid was included in the travel time measurement for this figure. If no path was possible between the census tract centroid and the nearest clinic, lines were not displayed. Bottom panel: Clinics and travel time routes (closest facility connection) used for sensitivity analysis. Spatial distribution for the 9 SART-member clinics available in 2010 in NC (in 8 cities) that were the nearest clinic for 5164 women (data from 2004 to 2015); and spatial distribution for the 8 SART-member clinics available in 4 neighboring states in 2010 that matched as the nearest clinics for 468 women. NC clinics follow the same color-coding system as the top panel. AYA, adolescent and young adult; NC, North Carolina; SART, Society for Assisted Reproductive Technology.
Sensitivity Analysis: Distribution and Mean Difference in Travel Time for Individual and Context-Level Characteristics for AYA Women Diagnosed with Cancer in North Carolina, Whose Nearest Clinic in Year of Diagnosis Was in North Carolina

NCCCR cell suppression requirements: Cell counts <11, including those of missing values, were omitted to comply (NR).
Breast cancer included invasive and non-invasives diagnoses.
Stage localized includes in-situ.
Race/Ethnicity: NH: non-Hispanic, Other WOC includes Asian NH (n = 118), Other race NH (60), and Hispanic all races (n = 429).
Insurance: Other includes: TRICARE, Military, Veteran affairs and Indian/Public Health Service.
Marital status: Partnered: married, unmarried, or domestic partnership; single: single, separated, divorced, or widowed.
RUCA: Metropolitan (commuting flow within or primarily to an urbanized area), micropolitan (flow within or primarily to a large urban cluster), rural (includes small town flow within or primarily to a small urban cluster, and rural, flow primarily to another rural census tract, not included in the previous categories).
ADI, area deprivation index; AYA, adolescent and young adult; RUCA, rural–urban commuting area; SART, Society for Assisted Reproductive Technology; SD, standard deviation; SEER, Surveillance, Epidemiology, and End Results; WOC, Women of Color.
Discussion
We assessed geographic access to fertility clinics in a cohort of AYA women who may need services shortly after diagnosis to minimize treatment-induced infertility. We found that WOC and women living in the most advantaged areas had shorter travel times, while younger women (15–19 years), those insured by Medicaid or Medicare, and residing in micropolitan or rural areas had longer travel times. Travel time varied significantly when stratified by rurality. Because most women lived in Metropolitan areas at diagnosis (80%), results were largely driven by this group, in which 46% of women lived within 30 minutes of a clinic and 71% within 1 hour. In contrast, in micropolitan (14%) and rural areas (6%), less than 3% of women lived within 30 minutes of a clinic and 50% and 25% lived within 1 hour, respectively.
In the AYA cancer population, access to fertility specialty care is integral to accessing high-quality cancer care. 12 Unlike primary and emergency care, 47 there are no guidelines establishing acceptable travel times to specialized and subspecialized cancer care (including fertility), but consideration must be given to the demands of time required for treatment or consultation and frequency of treatment (∼6 visits over 2 weeks in a cryopreservation treatment cycle). 48 A nationwide study on geographic access to cancer specialties among patients with colorectal and cervical cancers found 25% of rural patients required 3 hours of travel to consult a surgical oncologist, and 5% of patients required 5 hours travel to see a medical oncologist. 43 We found that 42% of our rural population would need a one-way trip of at least 90 minutes to a fertility specialist. In contrast, 14% of our Metropolitan population and 27% of our Micropolitan population would have this travel burden.
Limited studies have reported information on geographic access to fertility specialty services including receipt of fertility counseling or use of fertility preservation among AYA women with cancer in the United States. These studies focused on service utilization rather than geographic access as the primary interest. Measurements included distance from residence to a fertility clinic, or classified residence based on population density, such as urbanization or rurality.15,23–28 Differences in utilization were generally not statistically significant; however, this may be because most studies assessed AYAs already attending academic medical centers. Three of these studies used data from the University of North Carolina.23–25 Though not statistically significant, the average distance from the place of residence to the clinic was greater for patients who did not receive fertility counseling, 23 had a late referral to a fertility specialist, 24 and did not undergo fertility preservation. 25 An NC statewide study on use of fertility preservation found lower utilization rates among women living in nonurban areas. 15 In an ancillary survey of Horizon study participants across North Carolina (n = 380), our group has reported that a low proportion (16%) were counseled by a fertility specialist, and those who lived ≥30 minutes from a fertility clinic were 49% less likely to see a fertility specialist than those who lived closer. 49
We found that WOC have shorter travel times to fertility clinics than White, non-Hispanic women, similar to findings in other studies. A Surveillance, Epidemiology, and End Result-based study on disparities in access and utilization of cancer care found African Americans had shorter travel times to any specialized care compared to Whites. 50 A population-based study found non-White and Hispanic participants had shorter travel times to cancer care compared to White and non-Hispanic. 51 Our stratified analysis showed WOC more likely to live closer to clinics in Metro-and-Micropolitan areas, but in Rural areas, only Black non-Hispanic women lived closer.
We used the ADI in our study to capture the relationship between socioeconomic contextual factors and accessibility. Prior studies found greater deprivation indices to be associated with worse outcomes.21,52 In the overall and Metropolitan population, women in the least deprived areas were more likely to live closer to clinics, while in the Micropolitan and rural areas, women living in more deprived neighborhoods were more likely to live closer to clinics.
A review on access to fertility specialty care among Hispanic women reported they are less likely to seek, accept, and receive infertility care, 53 which aligns with prior findings for Black women in the general population. 54 This is unlikely due solely to limitations in geographic access; however, these disparities and unmet demand for fertility services might be exacerbated for women facing a pressing timeline between diagnosis and start of treatment, for which proximity to fertility clinics may be more critical. WOC living in Metropolitan areas and Black, non-Hispanic women living in all areas had an advantage in geographic accessibility over their counterparts by having shorter travel times, which we would expect to see reflected in utilization rates. However, WOC are more likely to face other barriers, including limited transportation options, lower income and insurance, less flexible jobs, unpaid leave, racism, and other forms of discrimination in the health care system, 14 all of which possibly outweigh the benefits of shorter travel times for service utilization.
Study strengths include using multiyear state-wide cancer data sourced in the NCCCR, a gold-certified member of the North American Association of Central Cancer Registries (NAACCR), that provided reliable full case identification, with highly accurate and complete gonadotoxic treatment data, 55 and highly accurate geolocation data for reliable estimation of geographic access by using point-to-point location to calculate travel time for our entire study population. We acknowledge the nearest clinic is not always chosen for various reasons but consider travel time to the nearest clinic as a measure of the minimum burden in accessibility. In 2010, ∼8% of women had as their nearest clinic one in a different state; however, exclusion of these records did not change overall interpretations. The large sample size of our study improved the representativeness of subgroups and precision of estimates, although the small proportions of AYA WOC from different races/ethnicities resulted in grouping them for analysis, which may obscure differences in geographic access among people typically excluded from research. We included context-level data to globally account for socioeconomic characteristics, the rural–urban continuum experience, and the precise spatial distribution of clinics and the AYA women in need of fertility services right after a devastating diagnosis.
Lack of information on individual-level income limited our analysis because fertility preservation services (counseling or treatment) are not required to be covered by insurance in NC. While including insurance status, rurality and ADI may account for some of the burden in accessing fertility care at diagnosis, and individual-level income may be more relevant when care is not covered by insurance. Our results may only be generalizable to southern states given the similarities in rural/urban distribution of the study population, the urban location of fertility clinics, with several states lacking mandated insurance coverage for fertility services (such as the neighboring states included in sensitivity analyses). 19
Institutions providing care to AYAs with cancer may use our assessment of spatial distribution and potential burden of travel time to fertility care as input for evaluating patients’ needs and organizing timely services. For example, organizations may consider offering virtual visits to improve access. This strategy may primarily improve fertility counseling since fertility preservation typically requires in-person testing. Our analyses demonstrate drastic differences in geographic access to fertility specialty care by rural–urban status before any utilization decisions are made.
Authors’ Contributions
N.R.-O.: Conceptualization, formal analysis, writing—original draft, and writing—review and editing. P.L.D.: Conceptualization and writing—review and editing. M.A.T.: Writing—review and editing. S.B.W.: Writing—review and editing. C.D.B.: Data curation and writing—review and editing. C.M.: Writing—review and editing. J.E.M.: Writing—review and editing. V.L.B.: Writing—review and editing. E.W.: Writing—review and editing. H.B.N.: Funding acquisition, conceptualization, supervision, and writing—review and editing.
Footnotes
Acknowledgment
 . Work on this study was supported by the Cancer Information and Population Health Resource (CIPHR), UNC Lineberger Comprehensive Cancer Center, with funding provided by the University Cancer Research Fund via the state of North Carolina. The authors thank Sara Mitra for her support in all areas of this project for several years.
Author Disclosure Statement
E.W.: Redshift is the data vendor for SART.
Funding Information
This work was supported by the National Institutes of Health (R01CA204258 and R01CA211093, to H.B.N.), and St. Baldrick’s Foundation (523803, to H.B.N.), and by a developmental award from the University of North Carolina Lineberger Comprehensive Cancer Center (P30ES010126, to H.B.N.). C.M. was supported by the National Cancer Institute (F31CA260787).
Supplemental Material
References
Supplementary Material
Please find the following supplemental material available below.
For Open Access articles published under a Creative Commons License, all supplemental material carries the same license as the article it is associated with.
For non-Open Access articles published, all supplemental material carries a non-exclusive license, and permission requests for re-use of supplemental material or any part of supplemental material shall be sent directly to the copyright owner as specified in the copyright notice associated with the article.
