
Abstract
This review summarizes and analyzes the clinical outcomes following treatment of a wide range of diseases with recombinant interferons (r-IFNs) and/or natural interferons (n-IFNs). The investigation focuses on the frequency of neutralizing antibodies (NABs) directed against IFN, which are formed during treatment and their clinical impact. r-IFNs (α-2a, α-2b, β-1a, and β-1b) induced seroconversion with generation of NABs in 17.2% of patients studied. The highest incidence of NABs occurred in macular degeneration (61.4%) with the lowest in multiple sclerosis (14.7%). The incidence of antibodies induced against n-IFNs was very low (<0.2%) and was significantly less than that seen for r-IFNs (P<0.0001). Overall, the fraction of relapsed and refractory patients is statistically greater in NAB positive patients compared to NAB negative patients (<0.0001), whereas the percentage of responding patients is higher in the NAB negative cohort (P<0.001). Finally, we also analyzed relapsed and refractory NAB positive patients who switched treatment to n-IFN, such as leukocyte derived Alferon N Injection® (α-n3) or Wellferon® (α-n1). Overall, in 33/40 (82%) of these relapsed or refractory patients, switching to n-IFNs restored the clinical response. This result is consistent with serology studies showing that the NABs directed against r-IFNs do not effectively cross-react with n-IFNs.
Introduction
Early investigators of the clinical utility of r-IFN noted that some patients would experience a relatively sudden loss of IFN-related side effects followed shortly thereafter by a loss of therapeutic effect with relapse (Quesada and others 1985; Oberg and Alm 1997). Neutralizing antibodies (NABs) against r-IFN were detected in the majority of these patients. The specificity of the NABs was directed against the r-IFN, and neutralization of n-IFN was not detected. Therefore, some of these relapsed patients were switched to n-IFN with reinduction of the clinical response.
This report reviews 21 independent studies of type I IFN therapy and examines the incidence of NAB formation, comparing the incidence of relapse, response, and nonresponse for NAB positive versus negative patients. This report also investigates the relative importance of various parameters such as IFN type, weekly IFN dose, study treatment duration, and cumulative IFN dose on the incidence of NAB induction. NABs are associated with a greater frequency of clinical relapse and nonresponse in a variety of disease categories. Conversely, in patients who do not develop NABs, the probability of a sustained response to treatment is greater. Treatment options for patients who have developed NABs associated with relapse or nonresponse during therapy with r-IFN is discussed.
Materials and Methods
In order to evaluate the incidence of NAB formation, the literature was searched for publications in English that contained sufficient clinical and IFN dosing information to determine the disease category and type, dose and duration of the IFN treatment, and the presence or absence of NAB development using a bioassay measuring cytopathic effect (CPE). IFN dose levels given in μg were converted to millions of international units (MIU) for analysis. To determine the relationship of clinical response to NAB status, the publication had to contain information on the IFN type, disease category, and either the clinical relapse rate or response/nonresponse data or both. Finally, the evaluation of patients who developed NABs while receiving r-IFN therapy and were switched to n-IFN required information on both the r-IFN and n-IFN types, disease category, whether the patient had relapsed while on r-IFN, or were nonresponders to r-IFNs, and the clinical response to the n-IFN. This review focused on NAB measured using a biological assay, and did not evaluate the relationship between the presence of non-neutralizing, binding antibodies and NAB.
Table 1 shows the clinical endpoint criteria used to categorize responders in each disease category. Nonresponsive includes those patients who had disease progression, or showed no response to IFN therapy.
HCV, chronic hepatitis C virus; ALT, alanine aminotransferase; HBV, chronic hepatitis C virus; MS, multiple sclerosis; CR, complete response; PR, partial response; HCL, hairy cell leukemia; CML, chronic myeloid leukemia.
The objective of this meta-analysis was to compare the incidence of NABs among the patients who were treated with r-IFNα versus n-IFNα; analyze for factors that may contribute to any differences in the incidence of NABs among the 2 r-IFN and n-IFN patient groups, and assess the differences in relapse, nonresponse, and response for the patients who were NAB positive and negative in the r-IFN treated group.
Effect was defined as the percent of NAB positive patients among the pooled experimental research studies. Differences in effect size was assessed and compared between the groups and among stratified subgroups by type of IFN (r-IFNα and n-IFNα), type of drug (Roferon A, etc.), type of disease [chronic hepatitis C virus (HCV), chronic hepatitis B virus (HBV), MS, solid tumors, hairy cell leukemia (HCL), chronic myeloid leukemia, etc.], route of administration [subcutaneous (SC) and intramuscular (IM)], IFN dose, duration of treatment, and cumulative dose using the Fisher's Exact Test.
Results
Incidence of NAB formation with IFN therapy
Table 2 presents the r-IFN treatment parameters, disease categories, and the incidence of NAB formation from 16 publications.
Measured by cytopathic effect.
IFN, interferon; NAB, neutralizing antibody; MIU, millions of international units; SC, subcutaneous; IM, intramuscular.
Figure 1 shows the incidence of NAB by IFN type. The greatest incidence of NAB was seen with r-IFNα-2a (31.6%) and r-IFNβ-1b (40.2%). The frequency of NABs seen with r-IFNα-2b (11.8%) and r-IFNβ-1a (15.8%) was less than 50% of that seen for r-IFNα-2a and r-IFNβ-1b. n-IFNs, n-IFNα-n1 (0%), and n-IFNα-n3 (<0.2%), rarely produced any NABs. Oberg and Alm (1997) utilized 4 different IFN types, 2 r-IFNs and 2 n-IFNs and measured the development of NAB in patients treated for carcinoid tumors. Their results are included in Tables 2 and 4 and parallel the results shown in Fig. 1. Oberg and Alm (1997) found the following incidence of NABs: r-IFNα-2b (17%), r-IFNα-2a (38%), n-IFNα-n1 (0%), r-IFNα-n3 (0%).

Percentage of patients developing NABs by Interferon Type. NAB, neutralizing antibody.
Figure 2 shows the incidence of NABs for different disease categories, in patients who received a single r-IFN species (α-2a). NABs were reported by CPE. There was a significantly higher percentage of NAB positive patients in age-related macular degeneration (AMD) (P<0.05) compared with all the other disease categories except for malignant carcinoid tumors (MCTs). Also, the percentage of patients positive for NABs in HCL was significantly lower than renal cell carcinoma (RCC), MCT, and AMD. There was no statistically significant difference among the other disease comparisons. Also, the route of administration of r-IFNα (IM versus SC) made no difference in the incidence of NAB (P>0.5).
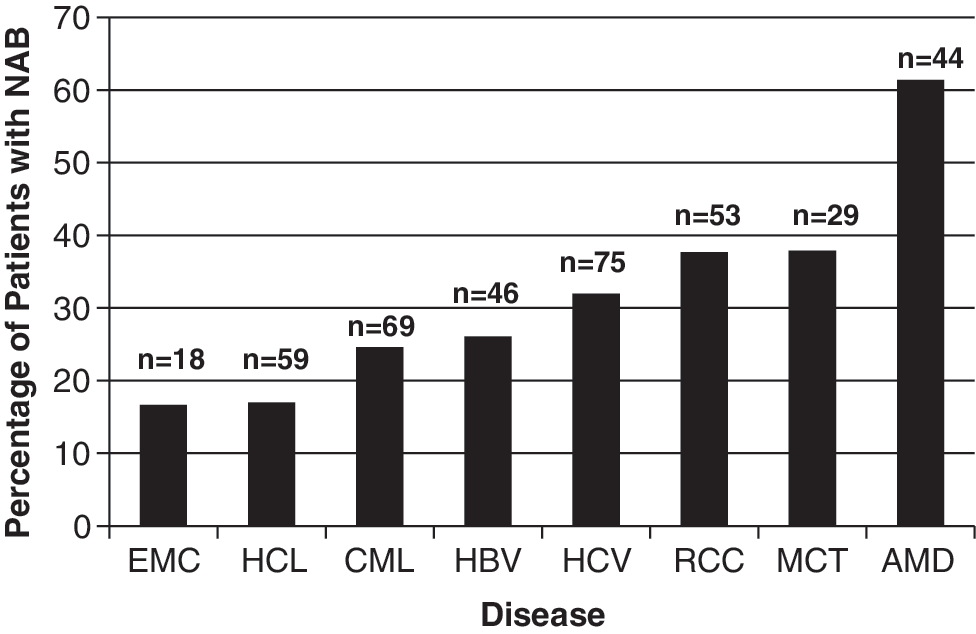
Percentage of patients developing NABs by disease. EMC, essential mixed cryoglobulinemia; HCL, hairy cell leukemia; CML, chronic myeloid leukemia; HBV, chronic hepatitis B virus; HCV, chronic hepatitis C virus; RCC, renal cell carcinoma; MCT, malignant carcinoid tumors; AMD, age-related macular degeneration.
NABs against r-IFNα-2a cross-react against r-IFNβ-2b (Oberg and Alm 1997). Antonelli and others (1999) have shown that during treatment of relapsing-remitting MS with either r-IFNβ-1a or r-IFNβ-1b, the NABs formed recognize both forms of r-IFNβ and therefore, switching the r-IFNβ type from one to the other is unlikely to overcome the inhibitory effects of the NAB. In chronic hepatitis C, treatment with pegylated r-IFN has also been associated with the development of NABs to IFNα-2a and IFNα-2b (Santantonio and others 2006; van der Eijk and others 2006).
Table 3 summarizes clinical data for treatment of condyloma acuminatum, HCV, HIV, and cancer with n-IFNs. These n-IFNs are formed by viral induction of immune cells such as harvested circulating leukocytes (Alferon N Injection®) or a lymphoblastoid cell line (Wellferon®) (which is no longer available in the United States). In contrast to the single isoforms of IFN produced by recombinant technology, viral induction of human immune cells produces a broad spectrum of the IFNs species, some of which also undergo post translational modification. For example, n-IFNα-n3 (Alferon N Injection) contains at least 7 species of n-IFN-α (α-2, α-4, α-7, α-8, α-10, α-16, and α-17) ranging in molecular weights from 16,000 to 27,000 daltons.
Assumes a minimum of 1 wart.
HIV, human immunodeficiency virus; TIW, three times weekly.
Table 3 shows the wide range of dosage levels, treatment durations, and cumulative dosages which overlap those utilized for recombinant treatments presented in Table 2. In contrast to the 15%–61% incidence of NAB formation seen with the r-IFNs, n-IFN treatment shows almost no incidence (<0.2%) of NAB formation.
Table 4 shows that differences in treatment parameters, dosage level, duration of treatment, and cumulative dose do not explain the difference in NAB formation between r-IFNs and n-IFNs that is significant (P<0.0001). There was a statistically significant difference in the incidence of NAB formation between r-IFN versus n-IFN for both high and low dosage levels, long and short treatment durations, and high or low cumulative doses. Also, in 2 disease categories, HCV and MCTs, there was a sufficient number of patients treated with r-IFN and n-IFN to make direct comparisons. In both of these disease categories, the incidence of NABs was significantly lower with n-IFNs. For the subcutaneous route of administration, there was a 19.5% incidence of NAB with r-IFN versus a 0.26% incidence with n-IFN. Therefore, the differences in NAB formation between r-IFN and n-IFN cannot be explained by differences in the route of administration.
High dose level >20 MIU/week; Low dosage level ≤20 MIU/week.
Long treatment duration >40 weeks; Short treatment duration ≤40 weeks.
High cumulative dose >700 MIU; Low cumulative dose ≤700 MIU.
r-IFN, recombinant interferon; n-IFN, natural interferon.
The influence of NABs on the clinical response
Twelve publications were identified that contained sufficient data to include in a meta-analysis of the influence of NABs on the clinical response for a variety of diseases. When possible, 2 types of clinical responses were considered. Some patients with an initial clinical response lost the therapeutic benefits and “relapsed” at the time of NAB formation. Nonrelapse patients were categorized as having either a response or nonresponse. A meta-analysis of the combined data from the 12 studies (Table 5) shows that a greater percentage of NAB positive patients relapsed 70/160 (44%) compared with 50/467 (11%) of NAB negative patients (P<0.0001). A greater response rate 293/536 (55%) was seen for the NAB negative patients compared with the NAB positive patients 33/161 (20%) (P<0.0001). Thus, the development of NAB during treatment with r-IFNs had a negative effect on the overall response rate. One apparent exception to this trend was the response data reported by Quesada and others (1985) in renal cell carcinoma. They reported a response rate of 44% (7/16) in NAB positive patients compared with 20% (5/25) in NAB negative patients. However, closer examination of the data shows that the median duration of remission for the NAB positive patients was only 2 months, which was significantly shorter than the duration of remission for the NAB negative patients, 10 months (P<0.01).
r-IFNα-2a treated patients only.
Includes only patients receiving 20 MIU daily.
Only evaluated relapsed patients.
Nonresponse or relapse.
Evaluated only relapsed patients for NAB status.
AMD, age-related macular degeneration; EMC, essential mixed cryoglobulinemia; RCC, renal cell carcinoma.
Recovery of therapeutic effect by substitution of n-IFN for r-IFN
Following the onset of a clinical relapse or nonresponse associated with the development of NABs against r-IFNα, patients are sometimes switched to n-IFNα. Table 6 summarizes the results from 7 studies reporting this change in IFNα therapy.
n-IFN treatment of patients who developed NABs and relapsed while on r-IFN.
n-IFN treatment of patients who developed NABs and were nonresponders to r-IFN.
All 7 studies reported that at least 50% of the patients switched to n-IFN treatment responded. These responses were seen in a variety of conditions including solid tumors, leukemia, and viral infection. Overall, recovery of the clinical response after switching to n-IFN was 82% (range 50%–100%).
The rationale for switching to n-IFN is that the NABs formed during treatment with r-IFNs do not effectively neutralize n-IFN. Most studies show no ability of NABs formed during r-IFN therapy to neutralize n-IFN. One study, Brand and others (1993) showed that 3 of 15 patients treated with r-IFNα-2a for hepatitis, developed high levels of NABs at the time of clinical relapse. These antibodies showed some cross-reactivity with n-IFNα-n1, although the titers against IFNα-n1 were 20–100-fold less than those against IFNα-2a. Brand speculates that in some cases the immune response to r-IFN will create antibodies against minor epitopes which are common to the n-IFNs and may explain in part why some NAB positive patients fail to regain a therapeutic response after switching to IFNα-n1.
Discussion
While r-IFNs have become the standard initial method of treatment for a variety of diseases, this review shows that in a relatively high percentage of patients (15%–60%) NAB formation occurs. This review focused on publications that detected NAB formation using a cell-based biological assay (CPE), in contrast to other assays using immunochemistry procedures which detect binding antibodies. Previously, Ross and others (2002) showed a good correlation between IFN binding capacities and neutralizing titers with r=0.94 (P<0.0001). Although, von Wussow and others (1991) found that the presence of detectable binding antibodies was not sufficient to abrogate response in patients with HCL, the presence of NAB was sufficient. In Table 5, 4 of the referenced publications measured both NAB using a bioassay and binding antibodies using an immunochemistry procedure and compared relapse rates. The mean relapse rate was 42% for subjects positive for NAB compared with 30% for subjects positive for binding antibodies (Porres and others 1989; von Wussow and others 1991; Steis and Longo 1994; Roffi and others 1995). This result is consistent with the finding that not all antibodies that bind to IFN neutralize biological activity.
Also, we did not evaluate the influence of NAB titers because of the problem of controlling for assay variability and specific activity of the different IFNs among the various studies. von Wussow and others (1987) also found that anti-IFN titers were underestimated when patients were still receiving IFN treatment and that the timing of blood collection in relationship to IFN treatment was an important factor. This timing data was not readily available in the publications reviewed. Structural differences in the various IFNs including glycosylation, sequence variation, aggregate formation, etc. are important factors which may lead to differences in NAB incidence between r-IFNs and n-IFNs. Despite these limitations, patients who develop NAB during r-IFN therapy have a greater likelihood of relapsing after an initial response or of being nonresponsive compared with NAB negative patients. In contrast, the immunogenicity risk of development of NAB formation during treatment with n-IFNs, such as, IFNα-n3, which is approved in the United States (Alferon N Injection) and in Europe (Multiferon®), is very low. This difference in the immunogenicity risk of NAB formation between r-IFNs and n-IFNs was not explained by differences in IFN dose levels or duration of therapy. Porres and others (1989) found that these parameters did not influence outcomes for treatment of HBV with r-IFNα-2a. Also, the NAB formed against r-IFNα, do not cross-react with n-IFNα, or do so at a much reduced level. Because n-IFNα contains multiple n-IFNα species, the cross-reactive NABs detected are usually directed against a minority of the n-IFNα species present. Accordingly, it has been recommended that patients receiving r-IFN be monitored for NAB formation and that consideration be given to switching these patients to n-IFNα (von Wussow and others 1991; Brand and others 1993). In the studies reported here, 82% of initially responding patients who became refractory or were nonresponders to r-IFN due to NAB formation were “rescued” by switching to n-IFNα, such as Alferon N Injection.
Footnotes
Acknowledgments
The authors would like to thank Vamsidhar Vurimindi for statistical analyses, and Russel Lander and Joe Horvath for their assistance with review of the literature.
Author Disclosure Statement
D.R.S., the Medical Director, and W.A.C., the CEO, of Hemispherx Biopharma, Inc., both own stock and options. W.A.C. is a member of the Board of Directors of Hemispherx Biopharma, Inc. Hemispherx Biopharma, Inc. is the manufacturer of the FDA approved n-IFNα-n3 product, Alferon N Injection.