
Abstract
Rhesus macaques provide a valuable research and preclinical model for cancer and infectious diseases, as nonhuman primates share immune pathways with humans. Interferons (IFNs) are key cytokines in both innate and adaptive immunity, so a detailed analysis of gene expression in peripheral blood and tissues may shed insight into immune responses. Macaques have 18 IFN genes, of which 14 encode for 13 distinct IFN-α subtypes, and one for IFN-β. Here, we developed a high-throughput array to evaluate each of the IFN-α subtypes, as well as IFN-β, IFN-γ and 2 subtypes of IFN-λ. With this array, expression of each IFN species may be quantified as relative to a reference (housekeeping) gene (ΔCq) or fitted to its own 4-point standard curve for absolute quantification (copy number per mass unit RNA). After validating the assay with IFN complementary DNA, we determined the IFN expression profile of peripheral blood mononuclear cells from 3 rhesus macaques in response to TLR agonists, and demonstrated that the profiles are consistent among animals. Furthermore, because the IFN expression profiles differ depending on the TLR stimuli, they suggest different biological functions for many of the IFN species measured, including individual subtypes of IFN-α.
Introduction
N
Interferons (IFNs) are expressed by a variety of cells in response to pathogens or tumor cells and have an important role both in the host innate and adaptive immune responses; they attenuate viral replication, activate natural killer cells and macrophages, and enhance antigen presentation to T-cells (Benlahrech and Patterson 2011; Cope and others 2011; Gill and others 2011; Reizis and others 2011). Humans and nonhuman primates express type I IFN, including IFN-α, IFN-β, IFN-ɛ, IFN-κ, and IFN-ω. Each type I IFN protein is encoded by a single gene, except for IFN-α, which in humans includes 13 nonallelic genes with a high level of sequence homology that gives rise to 12 distinct gene products; the mature protein sequences of IFN-α1 and IFN-α13 are identical. While some of the rhesus IFN-α subtypes are homologous to the corresponding human sequences (IFN-α1/13, α2, α6, α8, α14, and α16), 7 others have a partial homology to human IFN-α4, α16, or α21, and have been termed IFN-α23 to IFN-α29 (Woelk and others 2007). Despite signaling through a receptor shared by all type I IFNs, individual IFN-α subtypes are thought to differ in their antiproliferative and antiviral effects (Koyama and others 1990; Foster and others 1996;Yanai and others 2001; Hirankarn and others 2008; Genin and others 2009).
In addition to the type I IFN, rhesus macaques express 2 type III IFNs, IFN-λ1, and IFN-λ3 as opposed to humans who express 3 subtypes of IFN-λ: IFN-λ1, λ2, and λ3 (also known as interleukin (IL)-29, 28A, and 28B, respectively). Although the IFN-λ members are related to IL-10, both structurally and through the use of a common receptor subunit (Kotenko and others 2003), their antiviral and antitumor effects are similar to type I IFN (Witte and others 2010).
To date, the high homology between the gene sequences of the different IFN subtypes had impeded the development of sensitive and specific quantification of individual IFN mRNA and protein. Here, we describe a high-throughput, high-fidelity quantitative real-time polymerase chain reaction assay that uses molecular beacon (MB) and locked nucleic acid (LNA) probes to target unique sequences within the coding region of each IFN species for all 13 rhesus macaque IFN-α subtypes as well as IFN-β, IFN-γ, IFN-λ1 and IFN-λ3. The assay is set up in a 384-well plate format to include 2 housekeeping genes (HKGs), and a standard curve for each gene that allows for absolute quantification of the transcripts as well as calculation of the fold change in expression relative to a control HKG. Using this assay, we assessed patterns of IFN expression in rhesus peripheral blood mononuclear cells (PBMC) that were stimulated with 3 model innate immune response modulators: bacterial lipopolysaccharide (LPS), the ligand for TLR4; poly I:C, a dsRNA that is a ligand for TLR3, retinoic acid-inducible gene-I (RIG-I), and the melanoma differentiation antigen 5 (MDA5); and imiquimod, a synthetic ligand for TLR7.
Materials and Methods
Sequence cloning of the rhesus macaque IFNs
Rhesus IFN sequences were obtained from Ronald Jubin (PBL InterferonSource, Piscataway, NJ) and verified by running against a nucleotide query using the Basic Local Alignment Search Tool (BLAST; National Center for Biotechnology Information, Bethesda, MD). For each species, the coding sequence was cloned into the pUC57 vector (Genscript, Piscataway, NJ) with EcoRV restriction sites on the either side for all, except for IFN-λ1 that was cloned using HindIII restriction sites.
Design and synthesis quantitative real-time polymerase chain reaction primer/probe sets
Primer and probe sequences for measuring gene expression of IFN-β, IFN-γ, and each of the subtypes of IFN-α and IFN-λ were designed using Beacon Designer software (PREMIER Biosoft, Palo Alto, CA) and queried by the NCBI-BLAST algorithm (Altschul and others 1990) to verify the specificity of candidate primer/probe sequences against all rhesus genes. Primer and probe sequences were designed against only the coding regions for mature proteins and, to avoid predicted secondary structures within their sequences and within the targeted complementary DNA (cDNA) sequence, were queried by Web-based software mfold (version 3.2) (Zuker 2003, 2009). Of note, since IFN-α1 is 98% homologous with IFN-α13, they were considered as a one gene product that we term IFN-α1/13. For the other IFN-α subtypes, the probes either are MB structural analogs (Giesendorf and others 1998), or include LNA chemical analogs (Koshkin and others 1998). All probes are conjugated to 6-carboxyfluorescein and either tetramethylrhodamine or Black Hole quencher at the 5′ and 3′ ends, respectively. Primers and the linear and MB probes were synthesized by the Facility for Biotechnology Resources at the Center for Biologics Evaluation and Research (Bethesda, MD). LNA probes were synthesized by Sigma; all primers and probes were purified by HPLC. HKG primer/probe sets for rhesus GAPDH and eukaryotic 18S rRNA were purchased from Applied Biosystems (Foster City, CA).
Specificity was determined by testing each primer/probe set for amplification of 1.0 pM cDNA of IFN-β, IFN-γ, and each IFN-α and IFN-λ subtype. Specificity of IFN-α2 and α23 was enhanced by incorporating the amplification–refractory mutation system (ARMS) (Little 2001) into the primer design and in 2 other instances (IFN-α16 and α27) with an LNA oligonucleotide competitor (Hummelshoj and others 2005). To validate specificity, amplified polymerase chain reaction (PCR) products from stimulated primary cells were sequenced to demonstrate that the amplicon aligned with the template of the appropriate subtype and included bases unique to it (not shown). The sequences of the primer/probe sets are shown in Table 1.
Underlined bases indicate ARMS mutations to enhance specificity.
Upper-case letters indicate LNA bases; italicized bases comprise the stem of the MB probes; the probes for IFN-β and γ are unmodified; (+) or (−) refer to the orientation of the probe.
The assay for IFN-α16 includes an LNA oligonucleotide competitor (CTACCTCAA, 0.5 μM).
The assay for IFN-α27 includes an LNA oligonucleotide competitor (GCCATCTCT, 0.5 μM).
ARMS, amplification–refractory mutation system; IFN, interferon; LNA, locked nucleic acid; MB, molecular beacon.
Isolation of rhesus macaque PBMCs and in vitro cell stimulation with TLR agonists
Blood from rhesus macaques was collected in BD Vacutainer ACD Solution A tubes (Becton Dickinson, Franklin Lakes, NJ) under animal care procedures according to AAALAC. PBMCs were separated by density-gradient centrifugation over Ficoll-Hypaque (Verthelyi and others 2001). Cells were cultured at a density of 1.5–3×10⁶ cells/mL, at 37°C in an RPMI-1640 medium supplemented with 10% fetal calf serum and 100 U penicillin/mL, 100 μg streptomycin/mL, glutamine, nonessential amino acids, HEPES, and β-mercaptoethanol. TLR agonists were added to the cultures as follows: (1) LPS (10 μg/mL; InvivoGen, San Diego, CA); (2) poly I:C (50 μg/mL; Sigma Chemicals, St. Louis, MO); (3) imiquimod (10 μg/mL; InvivoGen, San Diego, CA). The endotoxin level of the agonist solutions (other than LPS) was <0.1EU/mL by the Limulus Amebocyte Lysate test (Lonza, Walkersville, MD). After stimulation, the PBMCs were collected, lyzed with TRIzol reagent (Invitrogen, Carlsbad, CA), and stored at −80°C until further analysis.
RNA extraction, DNase treatment, and cDNA synthesis
Upon extraction of RNA from TRIzol suspension, contaminating (genomic) DNA was removed with TurboDNase (Ambion, Austin, TX) per the manufacturer's recommendations. The efficiency of the DNAse reaction was demonstrated at the validation stage by the lack of gene amplification with primers that do not cross intron/exon junctions, and is supported with multiple samples in which the genes for one or more IFN subtypes are not amplified. cDNA synthesis was performed with the High-Capacity cDNA RT Kit (Applied Biosystems) according to the manufacturer's instructions.
qRT-PCR assay
For template amplification, primers and probes were distributed into 384-well plates as described (Hillyer and others 2012), subsequently dried, and stored at 4°C until used. For analysis, 1 μL of cDNA template from experimental samples or from IFN standard dilutions was added to each well together with 3.75 μL 2×TaqMan Fast Universal PCR Master Mix/No AmpErase UNG (Applied Biosystems) and 2.75 μL of DEPC water. Nontemplate controls were also included.
For the detection of HKG, 0.5 μL of 20×commercial primer/probe mix was added to 1 μL of cDNA solution, 5 μL of PCR Master Mix in a final volume of 10 μL, in the corresponding wells in the plate. Plates were spun briefly in a tabletop centrifuge, placed on a micro-orbital shaker at 2600 RPM for 5 min (Eppendorf MixMate, Eppendorf, Hauppauge, NY), and spun again immediately before qPCR for analysis. PCRs were conducted in a 7900HT Real-Time PCR System (Applied Biosystems) according to the following conditions: 50.0°C for 2 min, followed by 95.0°C for 10 min, 40 cycles of 95.0°C for 15 s, and 59.5°C for 1 min.
ELISA for IFN-α protein
The culture supernatants of TLR-stimulated rhesus PBMCs were harvested after 25h, and the concentration of IFN-α2 protein was measured in triplicate with the VeriKine Cynomolgus/Rhesus IFN-Alpha Serum ELISA Kit (PBL InterferonSource) per the manufacturer's instructions.
Data analysis
Data were analyzed with SDS Software (Version 2.3; Applied Biosystems), and Cq values were exported to an Excel (Microsoft, Redmond, WA) spreadsheet. From each 4-point standard curve, linearity (R2) and PCR efficiency were determined, the latter according to the equation, Efficiency=10(−1/slope), in which perfect efficiency=2.0 (Pfaffl 2004). Expression of each IFN species gene transcript is expressed as copy number/μg RNA input (based on the standard curve of the corresponding gene), absolute quantity normalized to HKG (ΔCq), and as fold-change in IFN expression relative to a reference sample (ie, baseline or control, ΔΔCq).
Results
Design and validation of the IFN gene expression array
Despite the high level of similarity between human and rhesus type I IFN, available human primer/probe sets (Hillyer and others 2012; Puig and others 2012) did not amplify rhesus IFN transcripts (data not shown). We therefore designed a panel of rhesus primer/probe sets using MB and LNA probes that targeted unique sequences within the coding region of each IFN species, and avoided the secondary structure that might interfere with efficient amplification.
As with the human assay (Hillyer and others 2012; Puig and others 2012), optimal concentrations of primers for each assay were titrated at concentrations ranging 100–500 nM with fixed concentrations of probe and template. Having determined optimal primer concentrations, probes were similarly titrated at concentrations ranging from 62.5 to 250 nM. Table 1 shows, in addition to the primer/probe sequences, the corresponding optimal concentrations for each primer and probe sequence and the efficiency for each primer/probe set.
The sensitivity of each IFN assay was determined by amplifying serial 10-fold dilutions of each IFN cDNA (Fig. 1). The primer/probe set for IFN-α14, α16, and α24 consistently detected down to 10 copies of specific template, whereas the remaining assays detected a minimum of 100 copies. PCR efficiencies ranged from 1.77 to 1.98 (Table 1). The linearity of amplification of each template ranged from 10–100 to 108 copies of cDNA (Fig. 1).
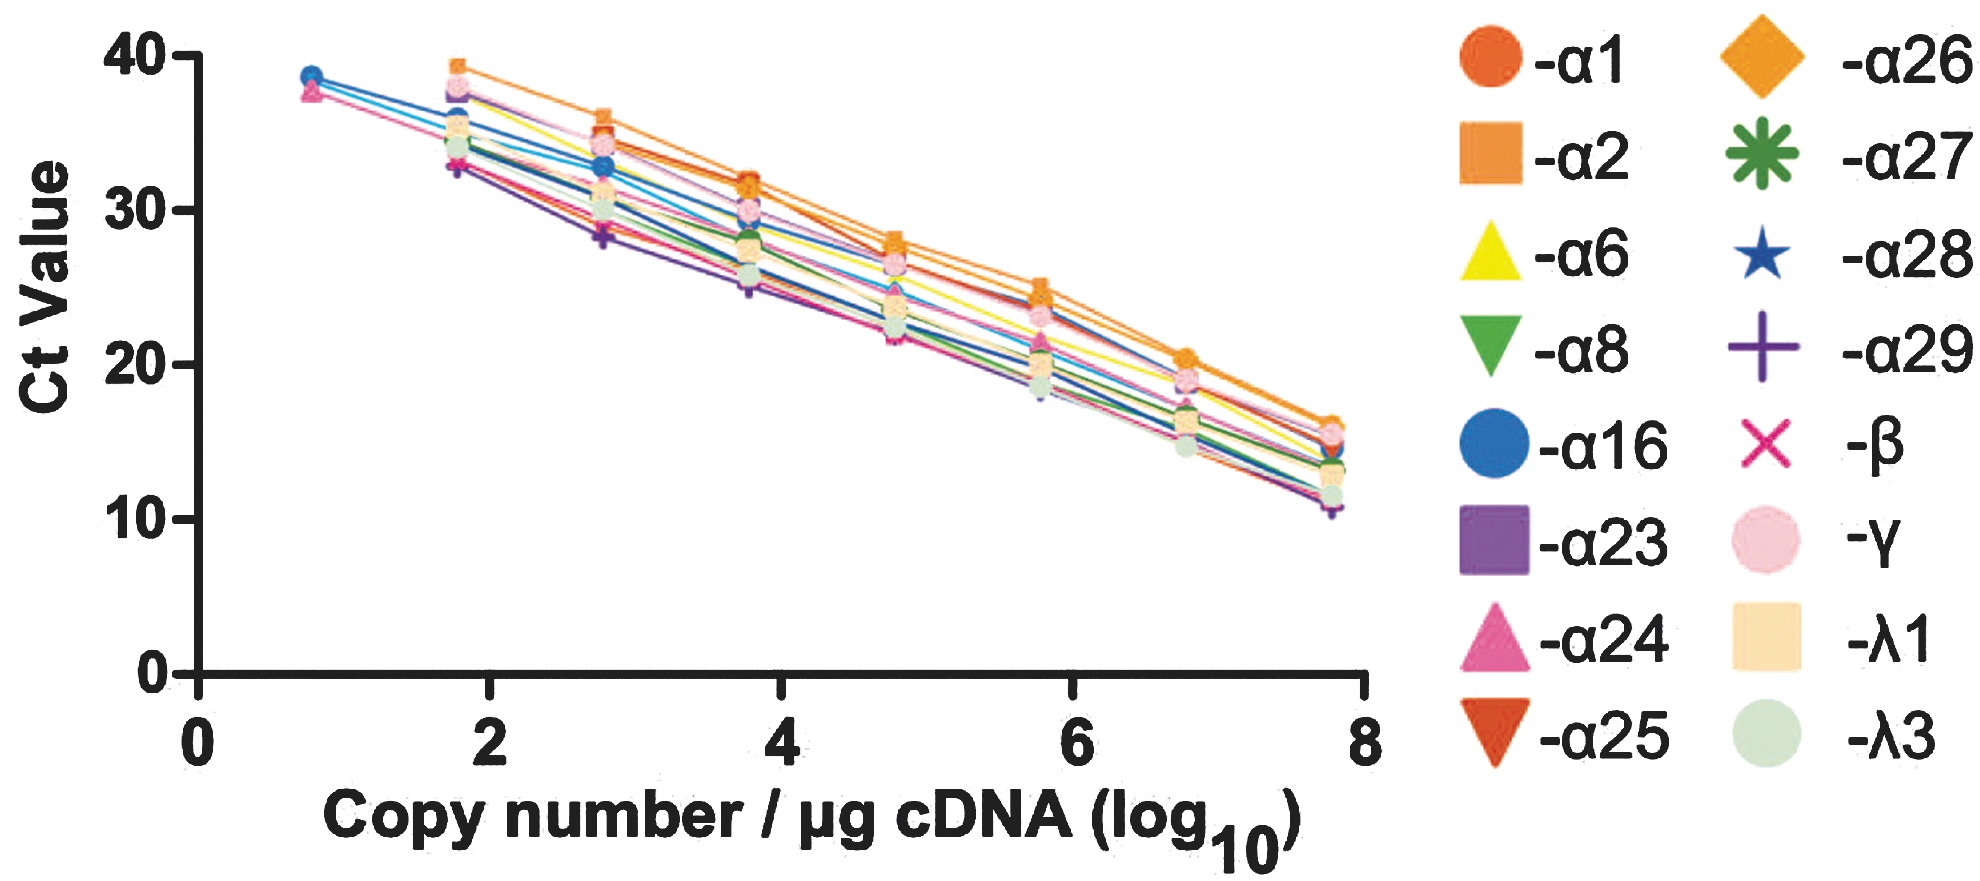
Linearity of amplification and detection of type I, II, and III interferons (IFNs). IFN complementary DNAs (cDNA) were serially (10-fold) diluted and amplified with their specific primer/probe sets in triplicate. The limit of sensitivity of the assay is the cDNA dilution in which the triplicate replications are identical, and the Cq value is less than 40 cycles.
The specificity of each primer/probe set was then tested by cross amplifying 1.0 pM of each linearized plasmid cDNA template with each primer/probe set. Because the primer/probe set for IFN-α2 amplified and detected 4 nonspecific sequences (IFN-α14, α23, α24, and α25) and the primer/probe set for IFN-α23 amplified and detected 6 nonspecific sequences (IFN-α6, α14, α16, α25, α26, and α28), the ARMS method (Little 2001) was incorporated into the design of primers for these 2 subtypes. In addition, the primer/probe sets for IFN-α16 and IFN-α27 detected and amplified IFN-α2 and IFN-α29, respectively (data not shown). This was resolved by using an LNA oligonucleotide competitor (Sidon and others 2006) that yielded an acceptable specificity of that primer/probe set. As shown in Table 2, a minimum of a 75-fold difference in specificity was achieved (6.2 cycles between the IFN-α1/13 primer/probe set detecting the template for IFN-α1/13 versus IFN-α8). In most cases, the specificity was 1,000-fold (∼10 cycles) or greater.
The concentration of each rhesus IFN complementary DNA template was 1.0 pM. Bold numbers indicate the Cq value for the specific target.
Dashes (–) indicate no amplification of the nonspecific target.
Nontemplate control (ie, signal from primer dimers).
The primer/probe array was then formatted to fit a 384-well PCR plate to accommodate a high-throughput analysis of multiple samples, and to include measurement of expression of 2 HKG as well as the 4-point standard curves for each IFN species.
Measurement of IFN gene expression in biological samples
After validating the assay with cDNA template, we assessed IFN expression by rhesus macaque PBMCs by stimulating them in vitro with LPS, poly I:C, or imiquimod for 3 h and by comparing the expression of IFN in stimulated versus unstimulated PBMCs. The HKG GAPDH was used for sample normalization, although similar results were obtained using 18S RNA as the HKG (not shown). The copy number of cDNA template was calculated using the standard curves for each IFN species. Data are plotted on radial plots, in which the rhesus IFN-α subtypes are arranged according to the homology of the amino acid sequences of their mature proteins (Fig. 2), followed by IFN-β, IFN-λ1 and λ2, and IFN-γ.
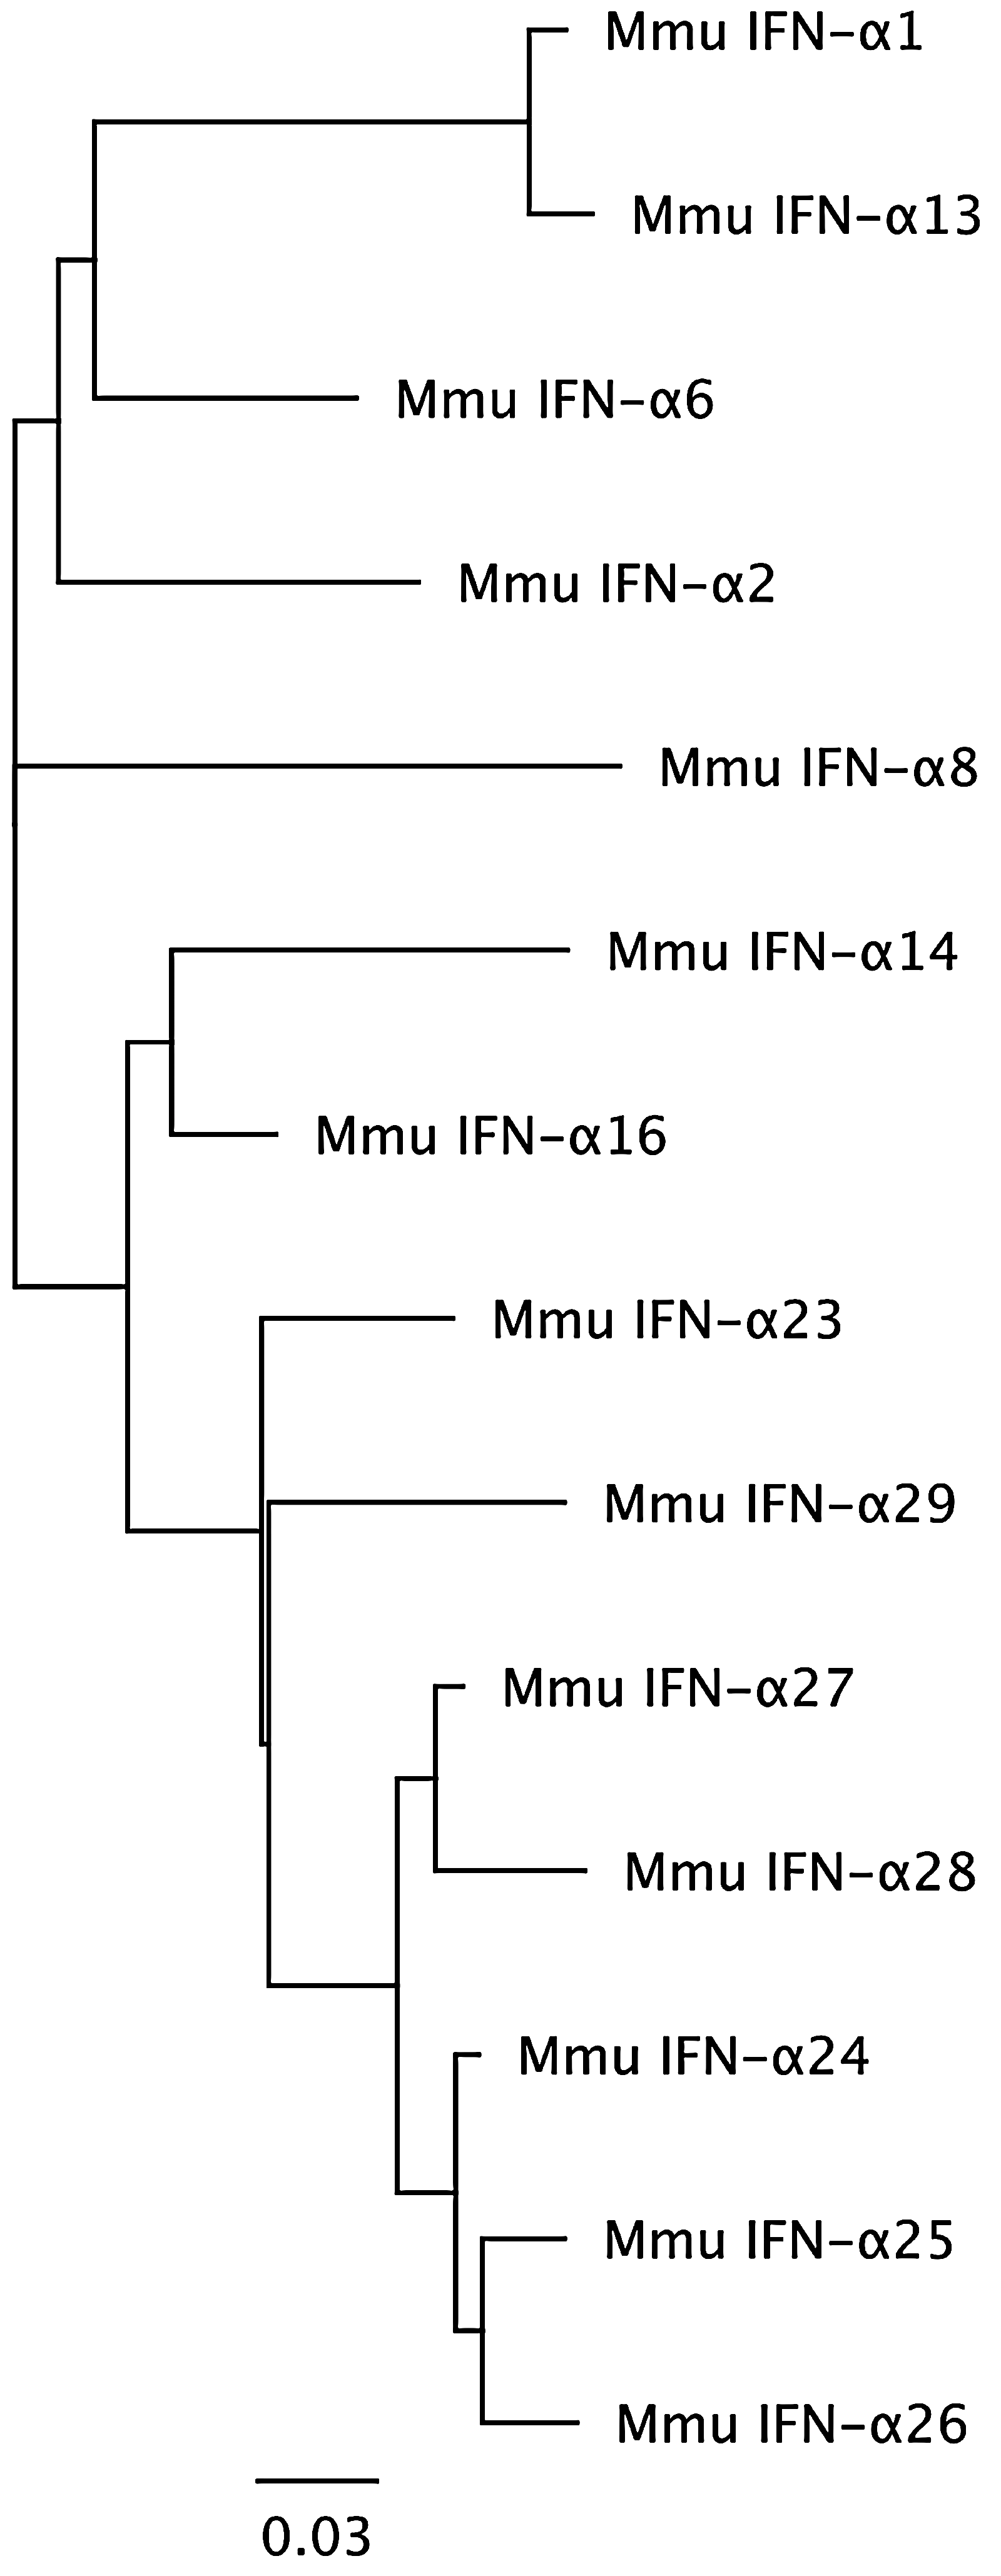
Phylogenetic tree of mature protein sequences of the 14 rhesus IFN-α subtypes. Alignment was set using Geneious Pro (version 5.3.4, Auckland, New Zealand).
Figure 3 shows the radial plots of IFN expression in a log scale calculated by 3 different methods: copy number of template per microgram of total RNA (Fig. 3A), absolute Cq value normalized to HKG (ΔCq, Fig. 3B), and fold increase expression over unstimulated PBMCs (ΔΔCq, Fig. 3C). These data show that expression of IFN-α1/13, α2, α6, α8, and IFN-λ1 was undetectable in the unstimulated cells, but they were expressed after stimulation. In contrast, the following IFN were expressed at low levels at baseline and enhanced after stimulation: IFN-α14, α16, α23 through α29, IFN-β, and IFN-γ.
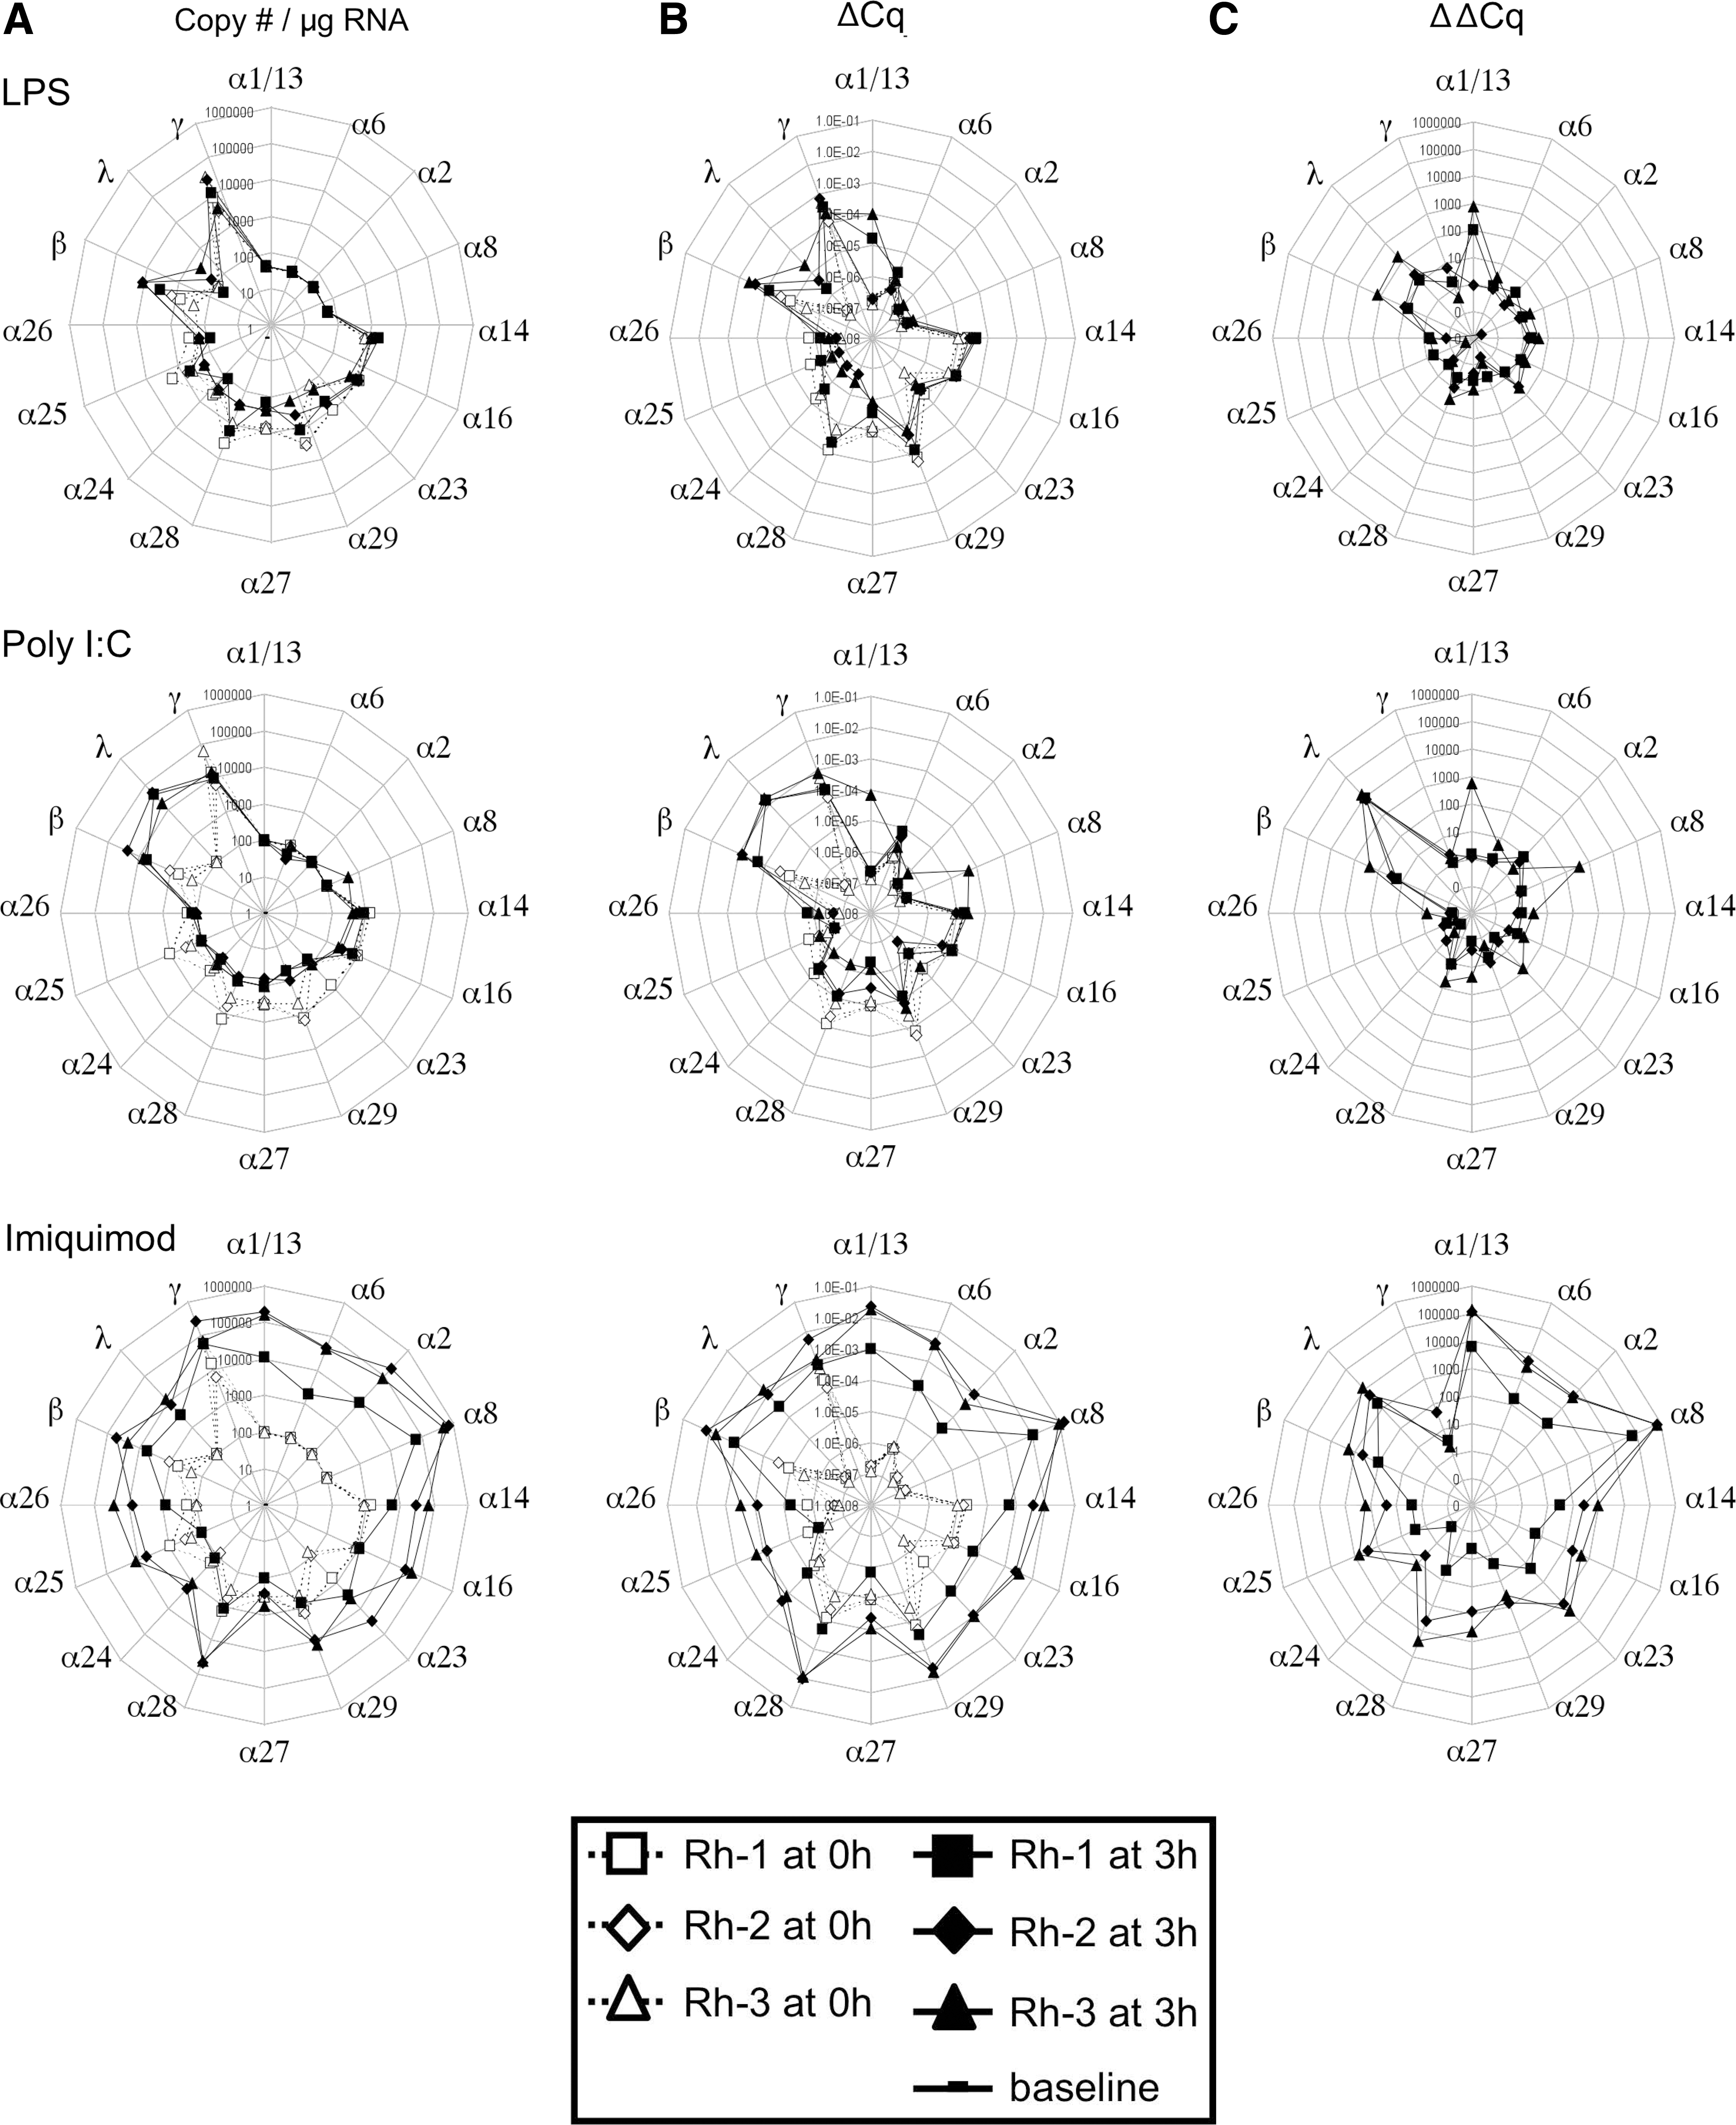
IFN gene expression by rhesus macaque peripheral blood mononuclear cells (PBMCs) in response to stimulation in vitro with TLR ligands. PBMCs from 3 young adult rhesus macaques were isolated from whole blood and stimulated with lipopolysaccharide (LPS) (10 μg/mL), poly I:C (50 μg/mL), or imiquimod (10 μg/mL). Cells were harvested after 3 h of TLR stimulation for measurement of gene expression. Transcript levels of type I, II, and III IFNs are displayed as the copy number of template/μg RNA
After 3 h of stimulation, the 3 TLR agonists consistently enhanced expression of IFN-β and IFN-λ1. LPS and poly I:C elicited a minimal increase in the expression of a few subtypes of IFN-α, but the increase was not consistent among the 3 animals. Additionally, LPS and poly I:C decreased expression of IFN-α27 and IFN-α28 in PBMCs from these 3 animals that were tested. Imiquimod, by contrast, elicited high expression of the genes for most type I IFN.
All animals showed comparable levels of baseline transcription in the genes that were expressed (Cq value varied <2 cycles in each case between animals) and comparable profiles of gene activation within a given stimulus. These data suggest that the IFN signature is reproducible.
Protein measurement of IFN-α2 by ELISA
Figure 4 shows that at 25 h, the IFN-α2 protein concentration in the culture supernatants of the rhesus PBMCs correlated with the gene transcription levels observed in the cells of the same animals. Similar to the IFN signature shown in Fig. 3, PBMCs stimulated with LPS or poly I:C expressed very little (Rh3) or nondetectable levels of IFN-α2 protein. In contrast, imiquimod-stimulated PBMCs from Rh2 and Rh3 expressed increased levels of IFN protein, indicating that certain threshold of transcription is needed to accumulate IFN-α2 protein at detectable levels by ELISA. Further studies, including the analysis of additional IFN subtype proteins, might be necessary upon availability to evaluate the translation of their transcripts.

IFN-α2 protein concentration in the PBMC cultures. Protein levels were quantified by ELISA in the culture supernatants of 3 rhesus macaque PBMCs stimulated with LPS (10 μg/mL), poly I:C (50 μg/mL), or imiquimod (10 μg/mL) for 25 h (mean of 3 replicates±SD).
Discussion
We previously developed a quantitative real-time (qRT)-PCR array to measure expression of human IFN transcripts (Hillyer and others 2012). Since the rhesus macaque provides an important model, we used a similar strategy to develop a set of primers/probes to measure expression of all 13 rhesus macaque IFN-α subtypes, as well as IFN-β, IFN-γ, and the 2 subtypes of IFN-λ. We then demonstrated the relevance of the assay by analyzing IFN expression in response to TLR stimulation.
qRT-PCR is commonly used to measure gene expression in vivo and in vitro, because sensitive, specific, and relatively inexpensive assays can usually be developed in-house. Because the coding sequences of IFN-α subtypes are highly similar and lack introns, assays for their specific expression are complex. Among the structural and chemical modifications available to enhance probe specificity, we used either MB or LNA, and when either of these strategies was insufficient to achieve maximum specificity, we modified the primer sets with the ARMS method (IFN-α2 and α23), or we blocked amplification of a nonspecific subtype with an LNA oligonucleotide competitor (IFN-α16 and α27).
Ours is not the first report of IFN expression patterns by rhesus macaque PBMCs. Recently, Easlick and colleagues evaluated expression of 8 of the 13 rhesus IFN-α subtypes by SIV-infected infant monkeys (Easlick and others 2010). Our study provides additional specific assays to measure the transcription levels of other IFN genes. To our knowledge, this is the only available test to detect rhesus IFN-α23 to IFN-α29 and IFN-λ1 and IFN-λ3. Moreover, the array format presented here allows simultaneous analysis of the IFN genes in 15 different samples, with the aim of minimizing the intra-assay variability.
The sensitivity and efficiency of this rhesus assay are in many cases lower than those reported for our human assay (Hillyer and others 2012). Compared to the human IFN-α subtypes, the level of identity among the rhesus IFN-α subtypes is higher, especially when IFN-α23 through IFN-α29 are included. When confronted with the choice, specificity is obviously the highest priority. The achieved levels of sensitivity and efficiency in our assay are similar to the values that Easlik and colleagues reported for their assay of rhesus IFN-α subtypes (Easlick and others 2010).
Often, qRT-PCR data that demonstrate enhanced (or decreased) levels of gene transcripts in response to stimulation are reported as relative to a control state (fold-increase or ΔΔCq). In our study, in addition to ΔΔCq, we report gene expression as copy number/μg RNA (cDNA) and as a function of HKG GAPDH (ΔCq). We suggest that reporting levels of expression as copy number per mass unit of RNA with standard curves is best, as it takes into consideration differences in efficiency of PCR amplification that may impact upon data interpretation, particularly when differences in expression are not extreme. In the absence of cDNA standards for measurement of copy number, display of data according to the ΔCq method is the next best choice, because as shown in Fig. 3, either of these distinguishes between gene expression that is induced (ie, a gene whose expression is undetectable in unstimulated cells) versus that which is enhanced (detectable gene expression in unstimulated cells). Display of data according to the fold increase in expression (ΔΔCq), however, can be misleading, as it excludes information regarding baseline transcription that may provide insight about regulation of that gene's expression. For example, Fig. 3 shows that in response to imiquimod, IFN-α14 and IFN-α16 are expressed at similar levels to that of IFN-α6, but the ΔΔCq method infers differences in levels of expression. In this case, the fold increase of IFN-α6 is higher, since its expression at baseline is lower. Conversely, the ΔΔCq method may falsely infer equivalency of expression. A ΔΔCq=10 may mean an increase from baseline of 100 to 1,000 copies after stimulation, or from 1,000 to 10,000 copies. The biological consequences of those 2 responses, however, are unlikely to be identical.
TLR agonists were chosen as stimuli to illustrate the differential effect on the IFN subtype expression. In 3-hr cell cultures, imiquimod was able to induce increases of most of the IFN-α genes, as opposed to LPS and poly I:C that moderately increased the levels of a limited amount of IFN subtypes. A more broad and robust upregulation of the expression response of these genes was previously observed with the treatment of Rh PBMCs with TLR9 agonists (CpG types C and D) (Puig and others 2012); however, the authors showed that the timing on the response was critical to capture the relative increases in type I IFN gene expression. Time course studies would be of use in characterizing the kinetics of the IFN response to different stimuli, although this was not the purpose of the present study.
In summary, we report a validated assay for rhesus macaque type I, II, and III IFNs that include all subtypes of IFN-α, and can identify differences in IFN expression patterns among PBMCs stimulated with individual TLR agonists. The assay includes standard curves for absolute measurement of the template copy number, and our data support our assertion that qRT-PCR data are best displayed in this manner, or in the absence of cDNA standards, according to the ΔCq method. We suggest that a comprehensive analysis of type I IFN expression will be of utility in the use of rhesus macaques as models for infectious diseases, vaccine development, and cancer.
Footnotes
Acknowledgments
The authors thank Harold Dickensheets for reviewing the article. In addition, we thank Lewis Shankle and the Animal Care Facility staff for their expert care of the nonhuman primates included in this study. The assertions herein are the private ones of the authors and are not to be construed as official or as reflecting the views of the Food and Drug Administration at large. This work was funded by FDA Intramural Funds, CBER/FDA-NIAID/NIH interagency agreement YI-AI-6153-01, DHSS National Vaccine Program Office, and NIH Intramural Targeted Antiviral Program. This project was supported in part by an appointment to the Research Participation Program at the Center for Biologics Evaluation and Research administered by the Oak Ridge Institute for Science and Education through and interagency agreement between the U.S. Department of Energy and the U.S. Food and Drug Administration.
Author Disclosure Statement
L.M.S., M.H., and R.L.R. are inventors of the technology to measure expression of rhesus macaque IFN-α and IFN-λ subtypes and may derive royalty income from it. No competing financial interests exist.