
Abstract
Influenza virus populations contain several subpopulations of noninfectious biologically active particles that are measured by the unique phenotypes they express. Two of these subpopulations were studied: (1) interferon (IFN)-inducing particles (IFP) and (2) IFN induction-suppressing particles (ISP). ISP are dominant in cells coinfected with one or more IFP; they completely suppress IFN production in cells otherwise programmed to induce it. Influenza virus ISP were shown to act in host cells in a nonspecific and global manner, suppressing IFN induction independent of the family of viruses serving as IFN inducers. ISP must be present within the first 3 h of coinfection with IFP to be maximally effective; by 7 hpi IFN induction/production is refractory to the action of superinfecting ISP. UV target and thermal inactivation analyses revealed that ISP activity was dependent solely on the expression of the NS gene. Low doses of UV radiation enhanced by ∼10-fold the already high IFN-inducing capacity of a virus that expressed truncated NS1. There was no change in the number of IFP, implying that the production of IFN/cell had increased. We postulated that preventing degradation of cellular RNA pol II by viral polymerase prolonged the transcription of cellular mRNA, including IFN mRNA, to enhance the IFN-inducing capacity of the cell without any increase in the number of IFP. These studies point to the dueling roles of IFP and ISP in modulating IFN induction/production, the former activity being critical to the efficacy of live attenuated influenza vaccines.
Introduction
I
In addition to the infectious particles of avian influenza virus that make up a minor, although critical, component of the total particle population (Donald and Isaacs 1954; Desselberger 1975. Marcus and others 2010), stocks of IAV contain different, large subpopulations of quantifiable noninfectious biologically active particles: interferon (IFN)-inducing particles (IFP); IFN induction-suppressing particles (ISP); cell-killing (apoptosis-inducing) particles; and defective-interfering particles (DIP) (Marcus and Sekellick 1985; Marcus and others 2005, 2009, 2010; Ngunjiri and others 2008, 2012a; Malinoski and Marcus 2012). The success of candidate LAIVs depends in large part upon the IFN-inducing capacity of the virus: in particular, the magnitude and efficiency of the IFP subpopulation in a given host cell (Marcus and others 2010; Ngunjiri and others 2012a), along with attendant DIP (Ngunjiri and others 2012a). The intrinsic high sensitivity of influenza viruses to the action of IFN, albeit with some fractions of the virus population transiently resistant to IFN action (Sekellick and others 2000; Cauthen and others 2007; Ngunjiri and others 2012b), is in keeping with the effectiveness of LAIV and their capacity to induce IFN (Richt and Garcia-Sastre 2009; Marcus and others 2010). Indeed, recent in vitro experiments have demonstrated that the efficiency with which candidate LAIVs induce IFN in chicken cells may be used to predict their efficacy as LAIV in chickens (Marcus and others 2010), and in mammals (Ngunjiri and others 2012a; C.-W. Lee, personal communication).
Given the dominate role of IFN in the activity of effective LAIV, and its role as a natural adjuvant (Nagao and others 1998; Bracci and other 2005; Marcus and others 2007; Hai and others 2008), it is important to characterize the dynamic interplay of subpopulations of influenza virus particles known to (1) induce IFN (IFP) and (2) down-regulate IFN induction/production, namely, ISP. In that context, expression of the IFP and ISP phenotypes was shown to reside in distinct particles, and to constitute subpopulations of noninfectious biologically active particles present in numbers that usually exceed infectious particles (Malinoski and Marcus 2012).
This report addresses the genetic integrity of ISPs required to suppress IFN induction/production in cells co-infected with IFP, and the nature of the enhanced IFN-inducing efficiency observed upon exposure of IFP to low doses of UV radiation. This information may contribute to a better understanding of the role of IFP and the regulation of IFN induction/production by ISP during infection, pathogenesis, and the course of the disease.
Materials and Methods
Cells and media
Cell suspensions of primary chicken embryo cells (CEC) prepared from 9-day-old chicken embryos were obtained from Charles River SPAFAS, Inc. CEC are maintained in NCI medium plus 6% calf serum (attachment solution) and incubated at 38.5°C in an air-CO2 mixture to maintain a pH≈7.1. Cells were incubated for 9 days without a medium change to developmentally mature the IFN system. These aged CEC produce copious amounts of acid-stable, type-I IFN when suitably induced (Sekellick and Marcus 1986; Sekellick and others 1990; Schwarz and others 2004).
Viruses
Seed stocks of A/TK/OR/71-NS1[1–230] (H7N3)=[TK/OR-NS1] and its variant A/TK/OR/71-delNS1[1–124] (H7N3)=[TK/OR-delNS1] were generated via reverse genetics and kindly provided by Chang-Won Lee (Ohio State University, Wooster, OH). These 2 virus strains were chosen because they were created from identical plasmids and share the same virus background, A/TK/OR/71-SEPRL (Southeast Poultry Research Laboratory), except for the truncation of the NS gene. Virus stocks were generated in 10-day-old embryonated chicken eggs from specific pathogen-free flocks and stored at −80°C. The TK/OR-NS1 and TK/OR-delNS1 viruses naturally produced stocks with high titers of ISP and IFP, respectively (Marcus and others 2005; Malinoski and Marcus 2012).
IFN induction and IFN induction suppression assays
These assays have been described (Malinoski and Marcus 2012). Briefly, for IFP assays, developmentally aged cells were infected with increasing multiplicities of virus and the amount of IFN produced in 24 h was measured as acid-stable, type-I IFN. Full IFN induction dose–response curves generated in this manner reveal the maximum quantum yield (QY) of IFN produced, and allow for the calculation of the number of IFP in the subpopulation of particles that induced the IFN. For an ISP assay, all of the cells of the monolayer are infected with an IFP at m
Quantification of IFN samples
IFN samples were quantified via the cytopathic effect (CPE) inhibition assay in 96-well trays using vesicular stomatitis virus (VSV-HR) as the challenge virus (Sekellick and Marcus 1986). Cells were vitally stained with neutral red, allowing for the photometric determination of the 50% endpoint for CPE inhibition. Based on this endpoint and the dilution of IFN applied to the cells, the titer of IFN for the sample was calculated. All samples were run in quadruplicate and the titers averaged. Two different standards were applied to normalize the IFN yields from samples generated and assayed on different batches of primary CEC. Aliquots of an rChIFN-α standard (Sekellick and others 1994) were used to calibrate the sensitivity of the cells to IFN action, and UV-irradiated avian reovirus was used to determine the responsiveness of a given batch of cells to an inducer of IFN. In combination, these 2 controls were used as a standard for cell sensitivity to IFN, and for the cells' capacity to produce IFN when induced. All IFN assays were normalized to the average of over 30 batches of CEC.
IFP and ISP titer determination
By utilizing increasing multiplicities of test virus in the sample generation phase, IFN induction, or IFN induction suppression, dose–response curves were produced (Marcus and Sekellick 1985; Marcus 1986; Marcus and others 2005). For IFN induction, the IFP titer of the preparation can be determined by assuming a random (Poisson) distribution of IFP within the cell monolayer. The Poisson distribution dictates that
A similar approach is taken to determine the ISP titer from the IFN induction suppression dose–response curves. Cells were infected by UV-ARV at m
UV-irradiation and UV-target analysis
The protocol by which UV irradiation (254 nm) was performed has been described (Marcus and others 2005). Lethal UV hits occur as the result of dimer formation at adjacent uracil residues in the RNA gene segments and are delivered as a random (Poisson) distribution. The experimentally observed rate of inactivation of infectivity has been reported previously as 1 lethal hit (D37)=82.8 ergs/mm2 (Marcus and others 2005).
Thermal inactivation of IAV
The rate of inactivation of infectivity was determined by plaque reduction as a function of the duration of exposure of TK/OR-NS1 to 50°C. The virus was diluted 1:2 in NCI medium, pH=8.0, for the heat treatment procedure, mimicking previously reported conditions (Marcus and others 2005). The line of best fit through these data corresponds to the equation: y=e−0.243x. The slope of this line (slope=−0.243) is assumed to represent the inactivation of the extant viral polymerase complex associated with any 1 of the 8 gene segments in the virion. The slope of the line representing the rate of inactivation of one specific gene (Fig. 2—dashed line) is calculated as equal to −0.030375 (−0.243/8).
IAV gene segment sequences (sizes) and accession numbers
The sizes of the gene segments used in the UV-target analysis reported here are based on the following entries in the GenBank database, and were first described in the indicated references: DQ870885-DQ870890 (gene segments PB2, PB1, PA, HA, NP, and NA; Cauthen and others 2007); AF073197 (M segment; Suarez and others 1999); and U96740 (NS gene segment; Suarez and Perdue 1998).
Results
UV irradiation inactivates ISP: UV-target analysis
Figure 1 demonstrates that UV irradiation of TK/OR/71-NS1 results in the inactivation of infectivity at an exponential rate (lower dashed line). This theoretical curve was based on an earlier report where 1 lethal UV hit=82.8 ergs/mm2 (Marcus and others 2005). The solid circles represent experimental data following the loss of infectivity measured as plaque-forming particles (PFP) as a function of UV dose and are in good agreement with the expected rate of inactivation represented by the lower line.
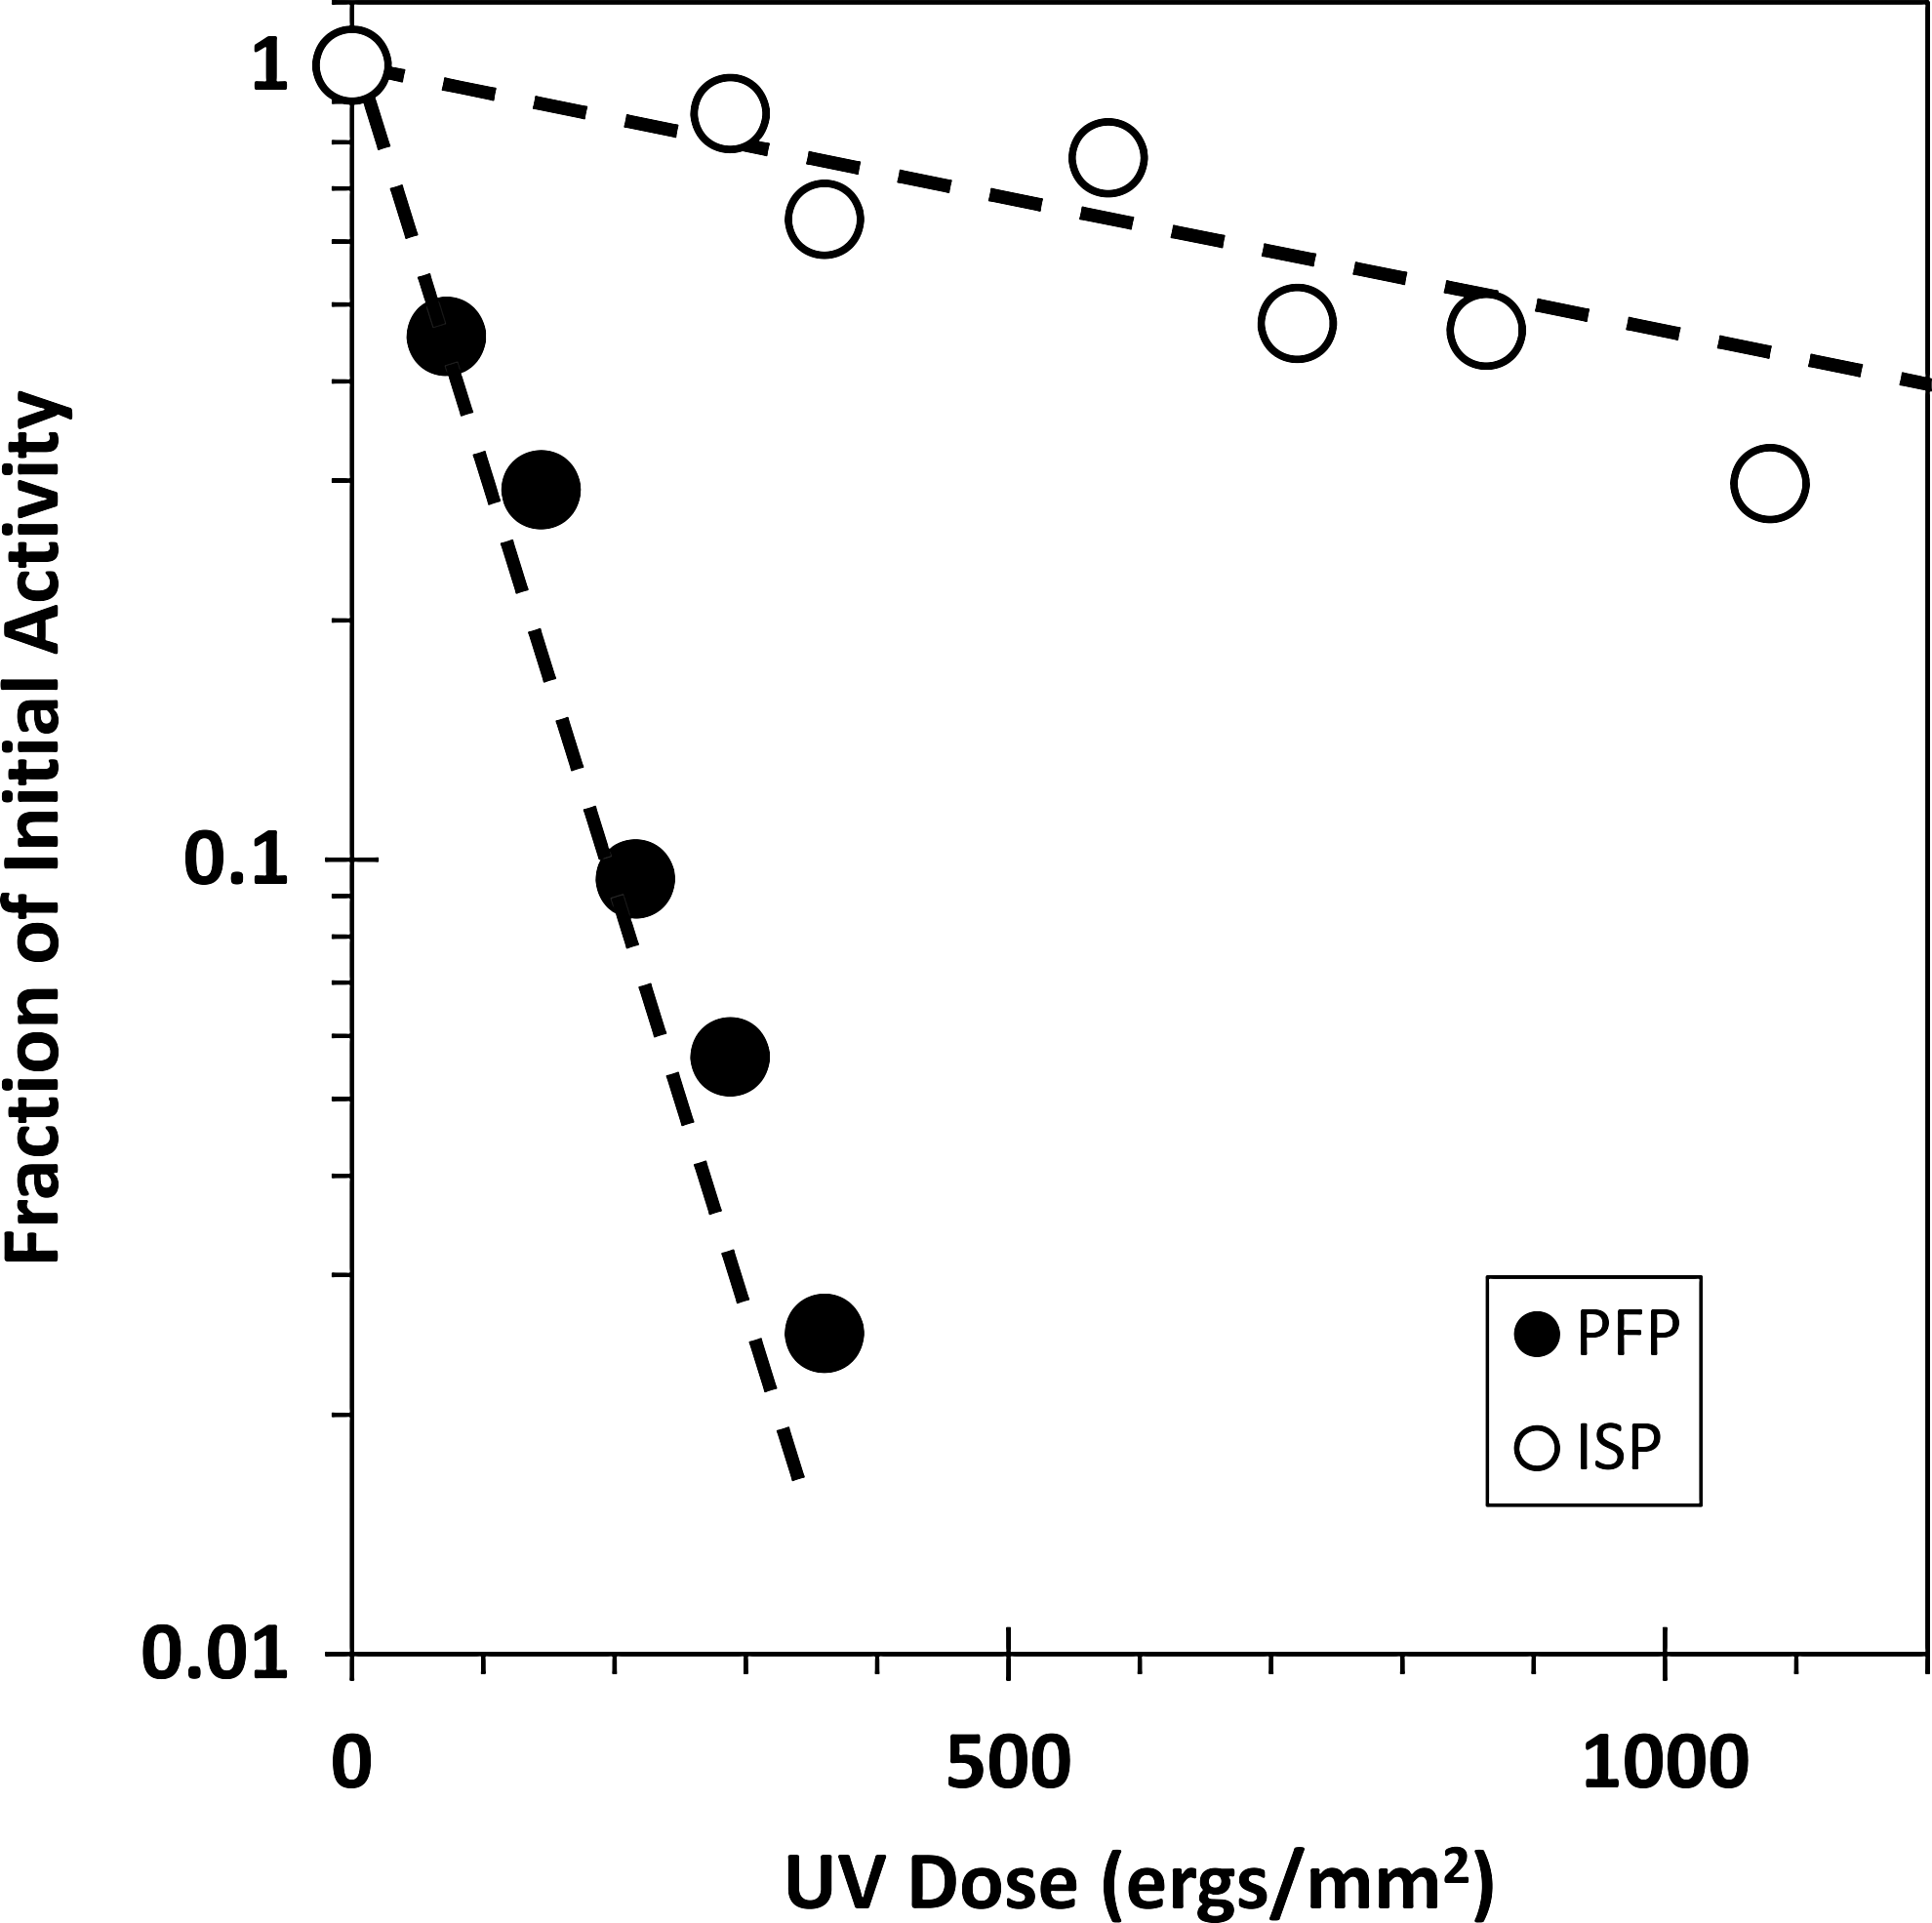
UV radiation inactivates IFN induction-suppressing particles (ISP). The dashed lines are theoretical: the lower line is based on the expected rate of inactivation of plaque-forming particles (PFP) if a single UV hit occurs anywhere in the genome (D37=82.8 ergs/mm2) (Marcus and others 2005); the upper dashed line represents the expected rate of inactivation of the NS gene based on its size relative to the entire genome (865 out of 13,228 nts total; Suarez and Perdue 1998; Suarez and others 1999; Cauthen and others 2007). Solid circles represent infectious particle titers measured as PFP. Open circles represent ISP titers calculated from a series of ISP dose–response assays, performed on multiple batches of primary chicken embryo cells (CEC). Each assay comprised 8 independently generated interferon (IFN) yields and was carried out in quadruplicate.
The upper dashed line (Fig. 1) is also theoretical, representing the expected rate of inactivation of the NS gene based on its size (865 nts) (Suarez and Perdue 1998) relative to the entire genome (13,228 nts) (Suarez and Perdue 1998; Suarez and others 1999; Cauthen and others 2007). Based on size, the NS gene and any biological activities dependent on its expression are expected to be ∼1/15th as sensitive to UV treatment as is infectivity. The open circles in Fig. 1 represent experimental data and demonstrate the loss of ISP, which occurs as a function of UV dose. ISP titers were calculated as described. The good fit of the data to the theoretical curve lends credence to the conclusion that expression of the ISP phenotype requires expression of the NS gene.
Thermal inactivation of ISP
Figure 2(solid line and circles) shows the experimentally determined rate of inactivation of TK/OR71-NS1 infectious particles (PFP) following exposure to 50.0°C as a function of time. Heat prevents viral transcription within the host cell by inactivating the extant viral polymerase complex associated with each gene segment (Brownlee and Sharps 2002). Unlike UV treatment, thermal inactivation allows for the inactivation of expression of gene segments in a gene-size-independent manner. The dashed line (Fig. 2) represents the expected rate of inactivation of expression of a single gene segment relative to the inactivation of infectivity (described in detail in the Materials and Methods). The good match of ISP inactivation (open circles) with the dashed, theoretical line indicates that ISP activity is dependent on the expression of a single gene segment.
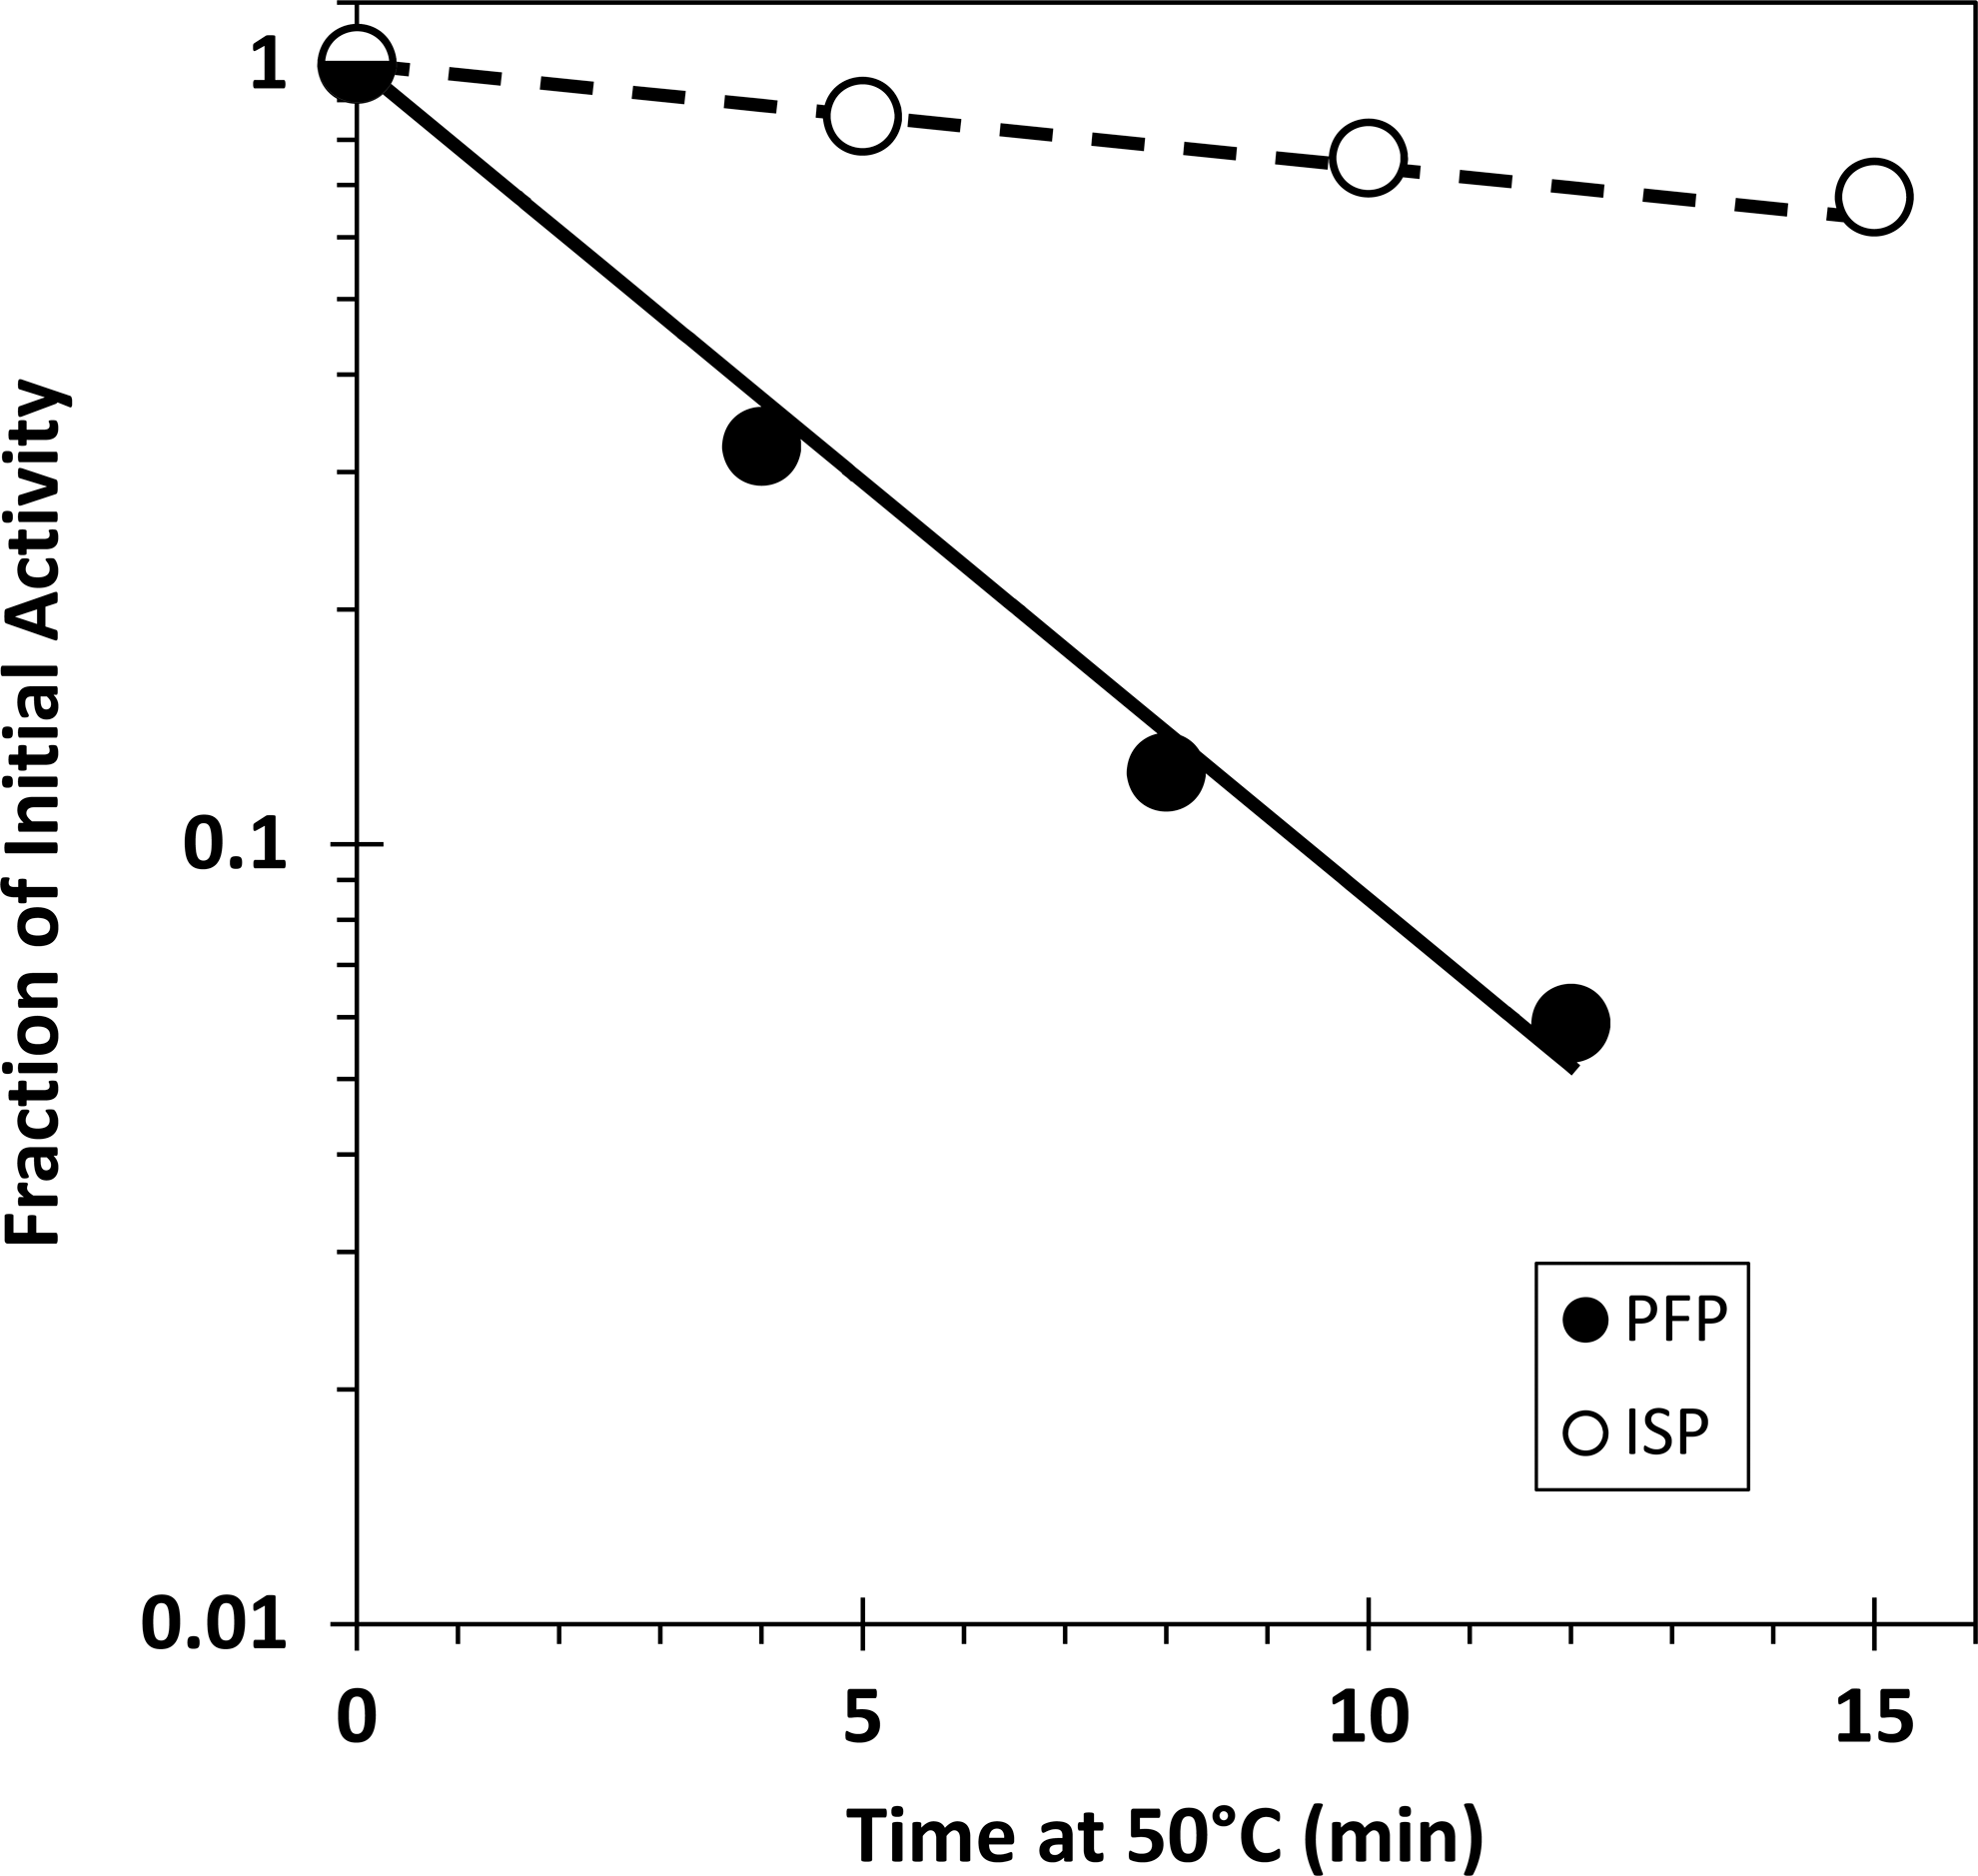
Thermal inactivation of PFP and ISP. Infectious particles of TK/OR-NS1 measured as PFP are inactivated at an exponential rate as a function of time at 50°C (solid circles). The rate of PFP inactivation (solid line) is assumed to represent the inactivation of expression of any 1 of the 8 viral gene segments required for infectivity. The dashed line represents the expected rate of inactivation of a single gene segment, that is, 1/8th the slope of the solid line. The rate of inactivation of ISP is consistent with this biological activity depending on the expression of a single gene segment–the NS gene. The open circles represent the average of 2 ISP titers calculated from an ISP dose–response curve assays comprised of 8 independently generated IFN yield assays in quadruplicate. Exposure of the virus to the highest dose of heat had no effect on the hemagglutinin titer.
UV irradiation enhances IFP efficiency, but not the number of IFP
Genetic truncation of the NS1 protein resulted in a 40-fold increase in the magnitude of IFN yield produced by TK/OR-NS1 in primary CEC (Fig. 3—compare open circles to crossed circles). An egg-derived TK/OR/71-delNS1 stock was used to assess the effect of UV radiation on IFN induction by IFP since it lacks a detectable ISP subpopulation (Malinoski and Marcus 2012). Figure 3 (compare crossed circles to solid circles) shows that the IFN yield induced in aged CEC by TK/OR-delNS1 increases ∼10-fold when the virus is UV irradiated at a dose which maximizes the yield of IFN (UV dose≈450 ergs/mm2) (cf. Fig. 6C in Marcus and others 2005). The IFP titer of the TK/OR-delNS1 subpopulation was calculated both before and after treatment with UV radiation and was found to remain constant at a value of 20×108 IFP/mL. Based on the increase in IFN yield and the constancy of the IFP titer, we infer that the efficiency (the amount of IFN induced per IFP infected cell) of the extant IFP increased 9.5-fold as a result of UV treatment.

Enhancement of IFN induction by influenza A viruses. Magnitude of IFN induction by TK/OR-NS1 (open circles) is increased≈40-fold by genetic truncation of the NS1 protein (circles with cross). UV irradiation of TK/OR-delNS1 (450 ergs/mm2; solid circles) further enhances IFN induction≈10-fold. Comparison of IFN induction dose–response curves for TK/OR-delNS1 (circles with cross) and UV-TK/OR-delNS1 (solid circles) show that the amount of virus which induces 0.63 of the maximum IFN yield is equal for both preparations (dashed lines). Based on a Poisson distribution of IFN-inducing particles (IFP) amongst the cell monolayer, both of these viruses have equal IFP titers (20×108 IFP/mL), despite the increase in magnitude of IFN yield. Quantum yields: TK/OR-NS1≈200 U; TK/OR-delNS1≈8000 U; UV-TK/OR-delNS1≈75,000 U.
The ISP activity of IAV is nonspecific and global in action
Figure 4 shows a series of IFN induction-suppression curves in which the ISP activity of TK/OR/71-NS1 is measured against viral IFN inducers belonging to 4 different virus families: (1) influenza virus TK/OR/71-delNS1 (Orthomyxoviridae); (2) UV irradiated avian reovirus (Reoviridae); (3) Newcastle disease virus (Paramyxoviridae); and (4) vesicular stomatitis virus (Rhabdoviridae). In each series the IFN yield is presented as a fraction of the maximum potential IFN yield of the inducing virus (dashed line) as determined by a control in which a cell monolayer received only the IFN-inducing virus. The rate of IFN induction-suppression is similar for each of the IFN-inducing viruses from the 4 different families, demonstrating that the ISP activity acts independent of the nature of the IFN induction moiety delivered to the host cell.

Nonspecific action of ISP. A series of CEC monolayers were co-infected with a constant dose (m IFP = 5.0) of an IFN-inducing virus and increasing doses of TK/OR-NS1 as ISP. The inducing viruses are indicated in the legend. The nature of the IFN induction-suppression curve generated by TK/OR-NS1 is shown to be independent of the source or type (family) of viral inducer. The absolute number of IFN units produced by 107 CEC as represented by the fraction of IFN yield equal to 1.0 (dashed line) varies for each inducing virus as follows: UV-ARV≈NDV-AV≈38,000 U; VSV T1026R1≈12,000 U; and TK/OR-delNS1≈8,000 U. The ISP titer of the TK/OR-NS1 stock was equal to 50×108 ISP/mL.
We have observed that for most ISP assays, the efficiency of activity decreases with increasing values of m
Temporal dependency of ISP activity
During the course of natural infection not all cells may become simultaneously infected with IFP and ISP. To gain insight into how effective ISP coinfection of IFN-inducing cells would be after IFN induction had been initiated, monolayers of aged CEC were exposed to the IFN-inducing virus UV-ARV (m

ISP activity is time-dependent. Nine-day developmentally-aged CEC were infected with UV-ARV (m IFP = 5.0) at T=0. IFN induction was allowed to progress at 40.5°C and coinfection with the suppressing virus TK/OR-NS1 (m ISP = 5.0) occurred at the times indicated. Cells infected with UV-ARV and mock-infected with suppressing virus were used to determine the maximum IFN yield at each time point after a total incubation period of 20 h (dashed line), and as a control for the physical manipulations. Data points (solid circles) represent the average of 3 independently generated IFN yields, each of which was assayed in quadruplicate and averaged. The error bars represent±SD of the 3 trials.
Discussion
UV (254 nm) irradiation of IAV not only rapidly inactivates infectivity, it also markedly enhances IFN production in CEC (Burke and Buchan 1965) relative to the levels reported for heat-inactivated virus (Isaacs and Lindenmann 1957). More recently, influenza virus variants expressing truncated NS1 proteins, already potent inducers of IFN (Richt and García-Sastre 2009), were shown to induce even higher yields of IFN when exposed to relatively low doses of UV radiation (Marcus and others 2005). For viruses expressing truncated NS1, the observed increase in IFN yield was shown to correspond to the inactivation of a large UV target, the equivalent of 1 or 2 of the polymerase genes (Marcus and others 2005). Furthermore, the IFN yields induced by IAV that expressed full length NS1 also were enhanced by UV radiation (Marcus and others 2005), although a UV target was not identified at that time.
Since IAV populations often contain ISP (Malinoski and Marcus 2012) it was not clear from this earlier work whether the enhanced yields of IFN observed after UV irradiation were due to an increase in IFP activity, a decrease in ISP activity, or both. To distinguish between these possibilities we measured the effect of UV radiation on the IFP and ISP subpopulations of TK/OR-delNS1 and TK/OR-NS1, isogenic except for the NS genes encoding the production of truncated (NS1[1–124])and full-sized NS1 proteins (NS1[1–230]), respectively.
Figure 1 (lower dashed line) shows the expected fraction of surviving infectivity (PFP) as a function of UV dose based on the value that 1 lethal UV hit (D37)=82.8 ergs/mm2 (Marcus and others 2005). It is assumed that 1 lethal UV hit to any 1 of the 8 genes (≈13,228 nts) will inactivate infectivity. The data points (solid circles) for PFP inactivation reveal a good fit based on this model. The upper dashed line in Fig. 1 represents a UV target size of 865 nts, and is equivalent to the expected rate of inactivation of the NS gene. The open circles represent the experimentally determined rate of ISP inactivation. These data fit well a model in which the integrity of the NS gene is required to express the ISP phenotype. Thus, a virus which expressed a full-sized NS1 protein gained IFN-inducing capacity as the suppressive action of NS1 on IFN induction was ablated, either genetically (Richt and García-Sastre 2009; Marcus and others 2010), or physically through UV irradiation.
Based on a Poisson (random) distribution of UV hits to the virus genome and taking into account the differences in size between the 8 gene segments, only 2 lethal hits to the entire genome are required to probabilistically ensure that at least 1 of the 3 polymerase subunit genes has received, on average, one lethal hit. In contrast, only a single lethal hit will be delivered to the NS gene for every 15 lethal hits delivered to the virion, a dose that would certainly inactivate all expression of functional viral polymerase. Since UV inactivation of ISP activity follows the expected rate of inactivation of the NS gene, it follows that synthesis of nascent viral polymerase complex and therefore further amplification of the NS gene is not required. Thus, we conclude that the basal level of NS1 expressed during primary transcription from the extant gene-associated polymerase complex suffices for full expression of ISP activity.
That primary transcription of NS alone suffices to express ISP activity was verified using an independent method of physical inactivation, that is, heat. Figure 2 illustrates the rate of inactivation of infectivity (PFP) (solid line) as a function of time exposed to heat (50°C), and compares it to the rate of inactivation of ISP (dashed line). We assume that thermal inactivation of influenza virus, unlike that of UV radiation, is not dependent on the size of the viral gene segments, but instead, reflects the thermal lability of the heterotrimeric RNA-dependent RNA-polymerase complex associated with the complementary RNA at the 3′-5′ panhandle of each gene segment. Temperatures of 45°C and higher have been shown to inactivate the transcription function of the viral polymerase-RNA complex (Brownlee and Sharps 2002). Notably, only one polymerase-RNA complex appears to be associated with each gene segment (Murti and others 1988). Based on this stoichiometry, the probability of thermal inactivation should be the same for each of the 8 polymerase-gene complexes. Thus, the rate of inactivation for infectivity (Fig. 2, solid line) is assumed to correspond to the inactivation of expression of any 1 of the 8 gene segments since all are required for plaque formation. The expected ratio for the rate of thermal inactivation of a particular gene associated with the expression of the ISP phenotype should be a line with a slope 1/8th of that relative to infectivity. That theoretical rate of inactivation of ISP is shown in Fig. 2 (dashed line). The data points (open circles) fit well the rate of inactivation expected for expression of a single gene segment. Based on the UV target data, we reasonably assume this to be the NS gene.
Having established the parameters of ISP inactivation by UV radiation and heat in a virus that is predominantly ISP, we then investigated the effect of UV radiation on IFN induction by IFP. Figure 3 shows a family of 3 full IFN induction dose–response curves generated by: (1) TK/OR-NS1, which expresses full-size NS1 and has a large subpopulation of ISP (bottom curve); (2) TK/OR-delNS1, which expresses a truncated NS1 through a genetic defect, and displays an ∼40-fold increase in IFN QY (middle curve); and (3) UV-TK/OR-delNS1, which reveals an additional ∼10-fold increase in the IFN QY following exposure to an optimal dose of UV radiation (upper curve).
Based on a Poisson distribution of IFP amongst the cell population in an r≥1 IFN dose–response curve of the types illustrated in Fig. 3 (middle and upper curves), there is an average of m
What remained was to understand the mechanism by which UV radiation enhanced the IFN induction/production of IFP another order of magnitude. Rodriguez and others (2007, 2009), and Vreede and colleagues (Vreede and Fodor 2010; Vreede and others 2010), showed that the polymerase complex of influenza virus degrades cellular RNA polymerase II (RNAP II). From our view this effect represents a mechanism to elicit global shut-off of cellular mRNA in general, and IFN mRNA in particular (see Fig. 4). Additional evidence implicates viral polymerase in the inhibition of IFN production (Graef and others 2010; Iwai and others 2010). Thus, low doses of UV radiation preferentially inactivate expression of the viral polymerase subunit genes, prevent the synthesis of nascent viral polymerase complex, and thereby thwart shut-off of cellular RNAP II. This would prolong transcription of IFN mRNA, and its subsequent translation and result in the elevated yields of IFN recorded in Fig. 3 (cf. the upper and middle curves). Additionally, by reducing the probability of producing nascent, functional viral polymerase, UV radiation also would compromise the viral polymerase-dependent cap-snatching required for priming viral transcription (Plotch and others 1981). This would also upregulate the amount of pre-IFN mRNA being processed and its subsequent translation into IFN.
Recently, a different, albeit mechanistically related, means was described to enhance IFN production in cells programmed to produce IFN (Ngunjiri and others 2012a). This was attributed to the small DI-RNA of DIP out-competing their cognate polymerase subunit to the point where functional viral polymerase would not be available to inactivate cellular RNAP II and shut-down cellular mRNA transcription.
Since TK/OR-NS1 encodes functional viral polymerase (Rodriguez and others 2007, 2009; Vreede and Fodor 2010; Vreede and others 2010), it should also degrade cellular RNAP II. However, UV-irradiated TK/OR-NS1 still expresses ISP activity, even at relatively high UV doses (>450 ergs/mm2; cf. Fig. 1). Such doses would inhibit degradation of host RNAP II by inactivating synthesis of nascent viral polymerase, yet leave ISP activity largely intact because of its small UV target. This suggests that only the activity of NS1 is required for the expression of ISP activity. The mechanism(s) whereby NS1 regulates the QY and/or nature of the IFN induction dose–response curve requires further study. Suffice it to say that the species of the host cell plays a significant role in that regulation (Ngunjiri and others 2012a).
Evidence to date from UV-irradiated and heat-inactivated IAV suggests the IFN inducer moiety of influenza virus preexists in the virion in some form of viral RNA with a threshold for induction as low as one molecule per cell (Marcus 1983), and hence is a relative constant in the 3 examples of IFN induction shown in Fig. 3. Consequently, differences in the degree of relief from various mechanisms of suppression would appear to determine the observed QY of IFN, in keeping with previous observations (Malinoski and Marcus 2012).
The phenotypic expression of influenza virus ISP was shown earlier to be dominant in cells coinfected with influenza virus IFP (Marcus and others 2005). As documented in Fig. 4, the same can now be concluded for IFP from 3 very different virus families. We infer that the action of ISP is nonspecific, and that down-regulation of IFN production is independent of the specific form of the IFN induction moiety produced by each family of IFN-inducing viruses. This is in keeping with the generally accepted concept that influenza viruses, like many RNA viruses, act globally in their capacity to inhibit the expression of cellular genes (Versteeg and Garcia-Sastre 2011).
Can increasing the number of IFP per cell overcome the dominant suppressing activity of a single co-infecting ISP? Cells infected with the UV-ARV at m
Lastly, we asked to what extent the delayed addition of ISP to a cell already programmed to induce IFN could still suppress its production, mimicking in effect one element of the dynamics of virus-cell interaction expected during infection of a host. Figure 5 shows that in cells infected with UV-ARV as the IFP, the addition of ISP up to about 3 h later still sufficed to suppress the yield of IFN virtually totally. Any delay of co-infecting IFP-infected cells with ISP beyond 3 h revealed an increasing degree of escape of IFN induction from suppression by ISP. Thus, by 7 hpi the cell produced a full yield of IFN, implying that transcription of IFN mRNA had escaped suppression and was translated into a QY of IFN when tested 20 h later. Based on the time-course of transcription of IFN mRNA in chicken cells induced by UV-ARV, most IFN mRNA has been transcribed by about 7 h and is subsequently translated (Sekellick and others 1994). These data indicate that once transcription of IFN mRNA is completed ISP will no longer be effective and that that message will be translated to produce IFN.
In the context of a rational approach to the design of live-attenuated influenza vaccines (LAIV), the magnitude of IFN induction/production, its role as an immunoadjuvant, along with the nature of the IFN induction dose–response curve, have been shown to play a significant role in the efficacy of the vaccine (Nagao and others 1998; Marcus and others 2007; Hai and others 2008; Wang and others 2008; Marcus and others 2010; Ngunjiri and others 2012a). The total elimination of ISP subpopulations may not result in the attributes of a LAIV that are most effective as evidenced by a report contrasting 2 effective and 2 ineffective LAIVs (Marcus and others 2010). The effective LAIVs were shown to produce type r=1 or r=2 type IFN induction dose–response curves, indicating that some degree of regulation of IFN induction by ISP may be advantageous in producing more highly effective vaccines. Thus, analyses of subpopulations of noninfectious biologically active particles of influenza virus (Marcus and others 2010; Ngunjiri and others 2012a) may provide insight into the design and production of more effective LAIVs.
Footnotes
Acknowledgments
This study benefited from the services provided by the Animal Cell Culture Facility of the Biotechnology-Bioservices Center of the University of Connecticut. Embryonated chicken eggs and primary chicken embryonic cells were obtained from Charles River SPAFAS, Inc. (North Franklin, CT). The research was supported by a donation to the University's Virus and Interferon ResearchLaboratory.
Author Disclosure Statement
No competing financial interests exist.