
Abstract
The rs2004640 single nucleotide polymorphism and the CGGGG copy-number variant (rs77571059) are promoter polymorphisms within interferon regulatory factor 5 (IRF5). They have been implicated as susceptibility factors for several autoimmune diseases. IRF5 uses alternative promoter splicing, where any of 4 first exons begin the mRNA. The CGGGG indel is in exon 1A's promoter; the rs2004640 allele creates a splicing recognition site, enabling usage of exon 1B. This study aimed at characterizing alterations in IRF5 mRNA due to these polymorphisms. Cells with risk polymorphisms exhibited ∼2-fold higher levels of IRF5 mRNA and protein, but demonstrated no change in mRNA stability. Quantitative PCR demonstrated decreased usage of exons 1C and 1D in cell lines with the risk polymorphisms. RNA folding analysis revealed a hairpin in exon 1B; mutational analysis showed that the hairpin shape decreased translation 5-fold. Although translation of mRNA that uses exon 1B is low due to a hairpin, increased IRF5 mRNA levels in individuals with the rs2004640 risk allele lead to higher overall protein expression. In addition, several new splice variants of IRF5 were sequenced. IRF5's promoter polymorphisms alter first exon usage and increase transcription levels. High levels of IRF5 may bias the immune system toward autoimmunity.
Introduction
I
Polymorphisms in IRF5 are associated with autoimmune susceptibility. The source of risk is likely an increase in the expression of IRF5. IRF5 is a transcription factor for IFN, a cytokine that is involved in the etiopathogenesis of autoimmune diseases, such as systemic lupus erythematosus (SLE) (Niewold and others 2010). Polymorphisms in IRF5 have been associated with higher levels of IFN (Niewold and others 2008; Rullo and others 2010); however, the increase in IRF5 expression is not entirely due to IRF5's own polymorphisms (Alonso-Perez and others 2011). The source of the increase in IRF5 expression and the concordant increase in IFN and other cytokines are key to the connection between autoimmune risk and IRF5's genetic polymorphisms.
Linkage or association studies which compare disease groups and unaffected controls have revealed several markers in IRF5 that are associated with autoimmune disease (Tsuchiya and others 2010). Of IRF5's many disease-associated polymorphisms, only 4 have been identified as functional polymorphisms (Alonso-Perez and others 2011). Two of these functional polymorphisms are in the promoter region of IRF5, and, thus, may directly affect IRF5 expression. This study examines these 2 functional promoter polymorphisms: the rs2004640 single nucleotide polymorphism (SNP) and the CGGGG indel, which is a copy number variant.
The rs2004640 SNP in IRF5 has been convincingly associated with SLE in multiple ethnic groups (Sigurdsson and others 2005; Graham and others 2006; Kozyrev and others 2007; Kawasaki and others 2008; Kelly and others 2008). This polymorphism has also been associated with several other autoimmune diseases, such as rheumatoid arthritis (Sigurdsson and others 2007; Dieguez-Gonzalez and others 2008), systemic sclerosis (Dieude and others 2009), multiple sclerosis (Kristjansdottir and others 2008), ulcerative colitis (Dideberg and others 2007), and Sjögren's syndrome (Miceli-Richard and others 2007).
The IRF5 risk allele at rs2004640 is associated with altered symptoms in autoimmune diseases. For example, multiple sclerosis patients with the risk SNP have a poor response to IFN-β therapy (Vosslamber and others 2011). In rheumatoid arthritis, the rs2004640 polymorphism is associated with anti-citrullinated protein antibody positivity (Kim and others 2008). The IRF5 polymorphism is associated with anti-topoisomerase antibody-positive systemic sclerosis and lung disease (Dieude and others 2009; Agarwal 2010). In SLE, the rs2004640 risk allele in IRF5 is associated with the risk for nephritis (Qin and others 2010) and the presence of dsDNA antibodies (Niewold and others 2012). Importantly, risk haplotypes that include rs2004640 are known to correlate with higher IRF5 levels (Feng and others 2010; Alonso-Perez and others 2011), and to correlate with higher cytokine activity, such as IFNα and TNFα (Niewold and others 2008; Hedl and Abraham 2012).
The rs2004640 SNP is a G/T polymorphism, where the T-risk allele creates an alternate splicing acceptor site for exon 1 (Graham and others 2006). This change creates a sequence-specific recognition site for the spliceosome, enabling use of an alternate first exon, called exon 1B. The T nucleotide is within the intron between exons 1 and 2, and it is removed from the mRNA upon splicing. Without the risk T allele, exon 1B cannot be spliced onto exon 2 and would encode a nonfunctional protein, although this has not been demonstrated experimentally. Unspliced transcripts are usually targeted by nonsense mediated decay (Brogna and Wen 2009).
The CGGGG polymorphism is associated with several autoimmune or inflammatory conditions. It has been associated with SLE (Sigurdsson and others 2005), Sjögren's syndrome (Nordmark and others 2008), multiple sclerosis (Kristjansdottir and others 2008), Crohn's disease, and ulcerative colitis (Dideberg and others 2007). Inflammatory conditions may also be affected by the CGGGG indel. One study found that it was associated with acute coronary syndrome (Fan and others 2010).
The CGGGG indel resides within the promoter for exon 1A, 64bp upstream of its transcription start site. There are either 3 (3X) or 4 copies (4X) of the CGGGG repeat sequence; 4 copies is the risk variant. This additional copy enables binding of additional transcription factors (Sigurdsson and others 2008). The CGGGG 4X variant is associated with higher levels of the cytokines TNFα, IL-12p40, IL-8, IL-1b, and IL-10 (Hedl and Abraham 2012). IRF5 levels may be affected by this indel. One study in thymic tissue found no association between the CGGGG indel and IRF5 levels, although there was decreased usage of exon 1A (Nordang and others 2012). Another study of peripheral blood mononuclear cells (PBMCs) showed increased IRF5 levels from CGGGG 4X risk cells (Sigurdsson and others 2008). The CGGGG indel is also designated rs77571059. It has been described as a GGGGC repeat, as Cs flank the repeat sequences.
Each of the 4 exon 1 options (1A, 1B, 1C, and 1D) has a distinct transcriptional start site, and each is likely under the control of a different promoter. The promoter for each exon is not well studied, although previous work has shown that exons 1A and 1C are controlled by an IRF element and an IFN stimulatory response element, respectively (Mancl and others 2005). Although most alternative splicing does not directly affect transcription levels, alternative promoter splicing—using different first exons—directly affects the levels of transcription. IRF5's first exon is a part of the 5′ untranslated region (5′UTR) and, thus, does not affect the amino-acid sequence. In addition, using different first exons has not been shown to contribute to alterations in the amino-acid sequence of the IRF5 protein (Kozyrev and others 2007). Instead, the effect of using different promoters and first exons is likely to be on the mRNA—such as the level of transcription, alternative splicing, the mRNA secondary structure, the stability of the mRNA, and the efficiency of its translation, all of which were investigated in the present study. The mechanisms of mRNA changes will better explain the pathways that are misfiring in associated autoimmune diseases.
Materials and Methods
Plasmid construction and luciferase assay
For assaying translational efficiency, oligonucleotides representing the 5′UTR with the sequence for wild type and mutated exon 1B were synthesized (Integrated DNA Technologies), annealed, and inserted into the pGL3-Promoter vector (Promega). The longer 5′UTRs that include exons 1A, 1C, and 1D were PCR amplified from cDNA using ExTaq (Takara) and the primers listed in Supplementary Table S1 (Supplementary Data are available online at
Cell lines
Peripheral blood samples were obtained from healthy volunteers after informed consent following an IRB-approved protocol. Peripheral blood mononuclear cells were isolated using lymphocyte separation medium (Mediatech). These cells were induced to form lymphoblastoid cell lines (LCLs) by incubation with Epstein-Barr virus (EBV, B95-8 strain) and 2 ng/mL cyclosporin A (Torcris Biosciences). Cell lines were maintained in RPMI (Sigma) with 10% fetal bovine serum (PerBio) with penicillin/streptomycin/amphotericin (Calbiochem) at 5% CO2 and passaged at least weekly. HEK293T cells were a gift from Dr. Bradford Berges, and they were maintained under the same conditions, but with DMEM as the base media.
Genotyping of volunteers and formation of paired samples
Genomic DNA was extracted (Qiagen) from peripheral blood mononuclear cells and genotyped using TaqMan reagents [Applied Biosystems (ABI)] on a StepOnePlus real-time PCR machine (ABI) at the rs2004640 SNP (ABI SNP Assay C9491614). Genotyping at the CGGGG indel was performed by PCR amplification and 4% agarose gel size determination. Genotyping at rs10488631 (ABI SNP Assay C2691242), which has also been shown to affect IRF5 expression (Rullo and others 2010), was also performed. Heterozygotes were not included in the study. The primers and PCR conditions are in Supplementary Table S1.
Actinomycin D treatments
Actinomycin D, an inhibitor of RNA polymerase, was used to test mRNA stability. At a concentration of 106 cells/mL, 5 μg/mL actinomycin D (Fisher) was applied over 24 h, with aliquots removed and analyzed at 2 and 6 h (Grievink and Stowell 2010). cDNA preparation, quantitative PCR, primers, probes, and conditions are described in PCR of cDNA Libraries section.
Imiquimod treatments
The synthetic TLR7 ligand, imiquimod (also known as R-837), was used for immune activation upstream of IRF5. Cells were treated for 24 h with 25 μg/mL imiquimod (InvivoGen) at a cellular concentration of 1×10⁶ cells/mL.
PCR of cDNA libraries
From actinomycin D-treated or -untreated cells, cDNA preparations were made by extracting RNA using the RNaqueous system (Life Technologies), followed by DNase treatment (Promega), then reverse transcription using SuperScript III reverse transcriptase (Life Technologies). cDNA preparations were used as a template for quantitative PCR. β-glucuronidase was used as the endogenous control for the TaqMan-based experiments, and glyceraldehyde 3-phosphate dehydrogenase (GAPDH) was used for the SYBR green-based calculating of comparative CT values; however, total IRF5 was used as the control value when comparing first exon usage. SYBR green or TaqMan mixes were from ABI. Sequences and PCR conditions are in Supplementary Table S1. All primers and oligos were purchased from Integrated DNA Technologies.
Western blotting
IRF5 protein levels were analyzed in untreated cells that were washed in phosphate-buffered saline and lysed in Laemmli buffer. Lysates were triturated with a small gauge needle and boiled. Equal amounts of whole-cell lysate were loaded onto a 10% sodium dodecyl sulfate-polyacrylamide electrophoresis gel (SDS-PAGE) and transferred to a nitrocellulose membrane. The membrane was probed with antibodies to IRF5 (Abcam monoclonal antibody 10T1). The secondary antibodies used were horseradish peroxidase-conjugated anti-mouse antibodies (Thermo Scientific). Protein bands were visualized with the ECL system (General Electric). Membranes were stripped for reprobing with anti β-actin antibody (NeoMarkers) and visualized as described earlier.
Sequencing
For cloning of IRF5 splice variant analysis, Takara Taq was used with LCL cDNA as a template for reverse-transcription PCR. After size separation on a 1.5% agarose gel, DNA was extracted from individual bands using a gel band extraction kit (Qiagen). Sequencing of IRF5 variants was performed using the forward or reverse primer used in PCR amplification. Plasmid sequencing used purified plasmid DNA and a primer upstream of the insertion site. Sequencing reactions used Big Dye terminator reagents and the 3730xl DNA analyzer (ABI). See Supplementary Table S1 for primers.
Statistical analysis
An unpaired t-test was used to compare means for mRNA and protein data. Regression modeling of the polymorphisms' effect on mRNA and protein levels used backward selection, and included calculating the ANOVA (Data Analysis Plus, Keller Statistics). Paired t-test was used for luciferase levels. An alpha of 0.05 and 2-tailed P values were used in all cases. For comparing mRNA half-life slopes, regression modeling was performed for analysis of covariance.
Computer programs
RNA folding analysis was performed using mfold (Zuker 2003) under standard settings. Alignments and viewing of sequencing files were completed using MEGA 4.0 (Tamura and others 2007). Densitometry on western blots was calculated using Quantity One software (BioRad).
Results
The rs2004640 risk SNP is the more potent driver of high IRF5 expression
Both the CGGGG 4X variant and the rs2004640 T variant have been associated convincingly with autoimmune disease. Both have been dubbed functional polymorphisms, as a logical functional effect can be suggested for each. The proposed effect of both polymorphisms is to increase transcription levels of IRF5. rs2004640 increases IRF5 levels in LCLs and PBMCs (Feng and others 2010; Alonso-Perez and others 2011), and the CGGGG indel has been shown to increase IRF5 in PBMCs (Sigurdsson and others 2008), and decrease 1A-specific IRF5 transcripts in thymic cells (Nordang and others 2012). We measured IRF5 transcription levels in order to compare average expression and perform regression modeling. This identifies the source of changes according to each polymorphism's effect.
Quantitative PCR was performed on cDNA from cells with the risk or protective alleles at each polymorphism. Healthy individuals were used, which removes potentially confounding factors due to existing autoimmune disease. The cells used were from volunteers, all of whom were women, with 58% European American, 33% Hispanic, and 8% Asian (Table 1). PBMCs were converted into LCL by transformation with EBV. LCLs are transformed B cells, a cell in which IRF5 is usually expressed (Su and others 2004) and thus a good model (Table 2).
All percentages are in comparison to the total number of individuals genotyped, n=117. Eight matched sets were chosen from this overall group by matching homozygous risk to homozygous protective samples.
Genotyping at the rs2004640 allele was performed using a TaqMan-based genotyping assay. For rs2004640, risk is homozygous T/T, protective is homozygous G/G. Genotyping at the CGGGG indel was performed by PCR of the genomic region, followed by size analysis on an agarose gel. For the CGGGG indel, risk is homozygous for 4 copies of the CGGGG repeat (4X/4X), protective is homozygous for 3 copies (3X/3X). All samples were from healthy individuals.
mRNA expression levels of IRF5 were 2.7-fold higher in those with the rs2004640 risk allele (P=0.0018), when normalized to the levels of β-glucuronidase. For the CGGGG indel, risk cells were 2.1-fold higher (P=0.030) (Fig. 1A). Western blots were performed on protein extracts from risk and protective cells. The levels of IRF5 protein were 3.18-fold higher in rs2004640 risk cells (P=0.036), and 4.16-fold higher in CGGGG risk cells (P=0.053, which only approaches significance), supporting the mRNA data (Fig. 1B). For both the protein and mRNA data, regression modeling using a backward selection showed that the rs2004640 was the better predictor of IRF5 levels, with the better model excluding the CGGGG effect. The CGGGG indel was not sufficient alone to explain IRF5 mRNA or protein levels (ANOVA, P>0.05), although the rs2004640 SNP was sufficient alone (ANOVA, P<0.05). IRF5 levels were not affected by the rs10488631 genotype, although our sample size for the risk allele at this locus was small.
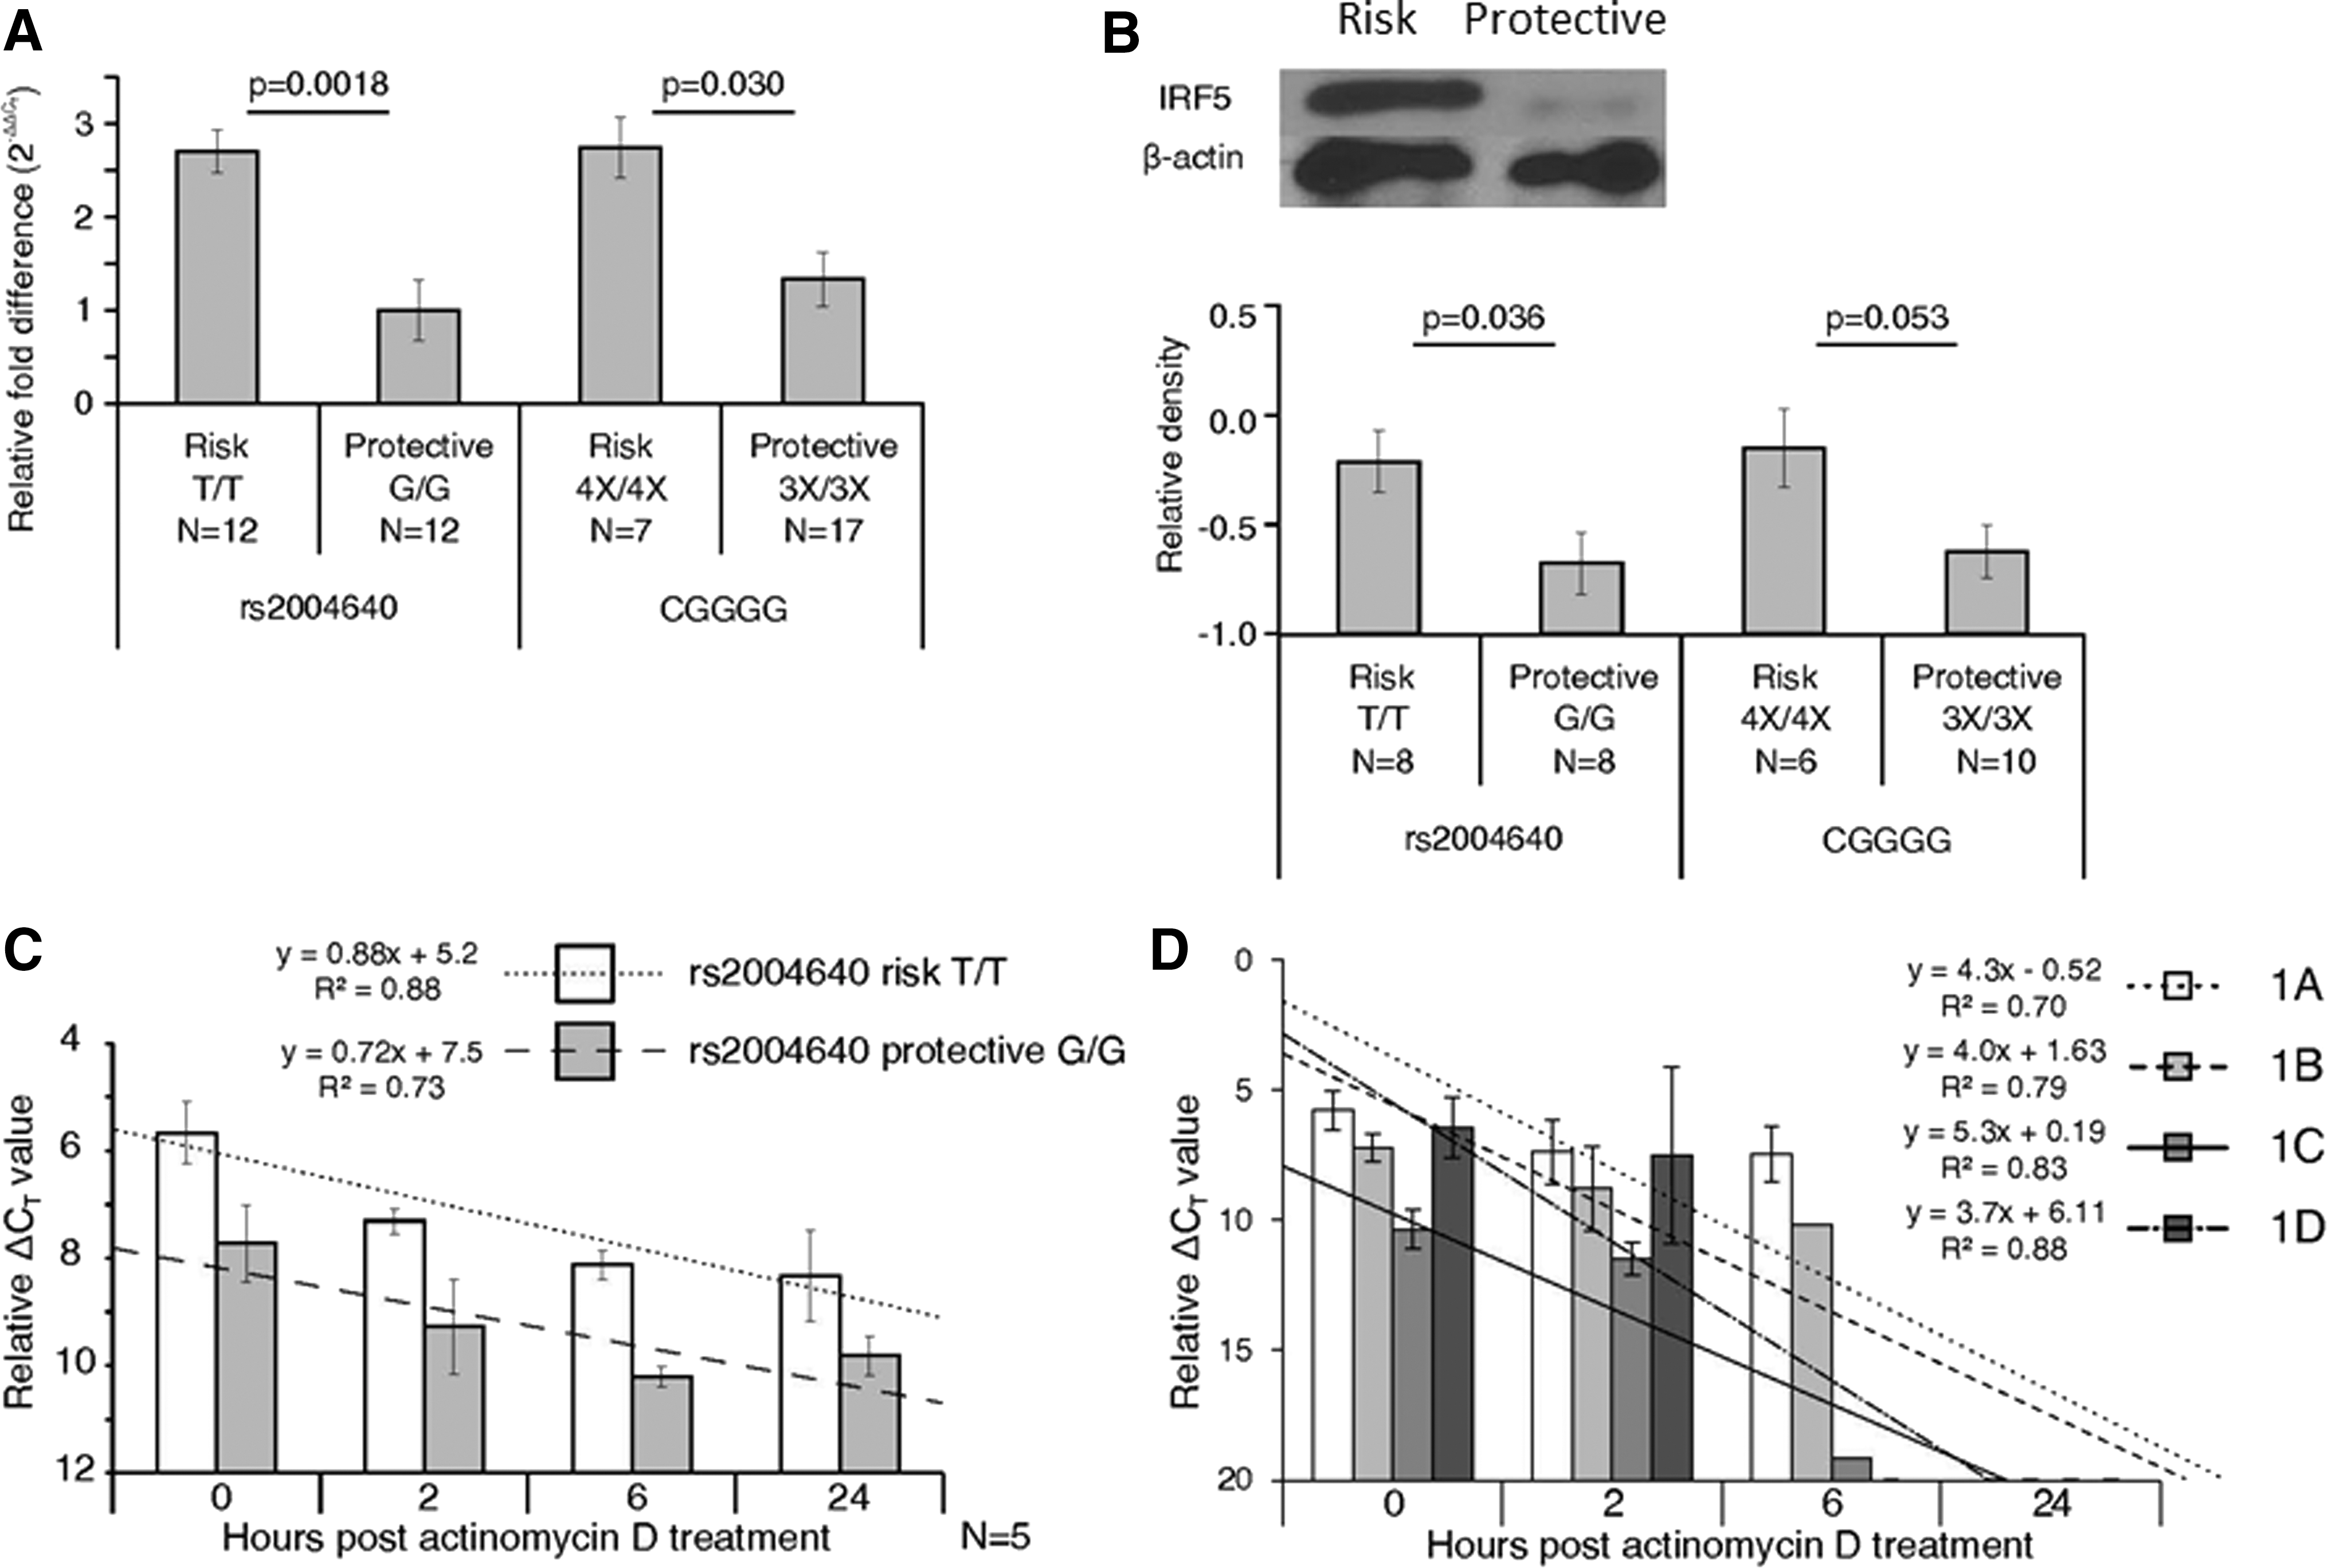
IRF5 mRNA and protein levels are generally doubled in cells with the rs2004640 or CGGGG risk polymorphisms, but mRNA is equally stable, when compared with cells with protective polymorphisms.
One further test of IRF5 mRNA was to evaluate its stability in cells. One polymorphism, rs10954213, has already been shown to affect IRF5 mRNA stability. The risk allele creates an upstream polyadenylation site, producing a shorter 3′ end, which is more stable (Liu and others 2013). The rs2004640 risk T allele enables usage of exon 1B. This changes the 5′ end and may also affect mRNA stability. We also observed that splicing at other sites is also affected when the risk allele is present, which may also contribute to altered RNA half life. Actinomycin D was applied, which inhibits RNA polymerase and, thus, mRNA production. IRF5 mRNA levels were measured at 2, 6, and 24 h after actinomycin D treatment of LCLs. Using a SYBR green-based quantitative PCR, the IRF5 mRNA levels were consistently higher in rs2004640 risk cells (P<0.001). However, no statistically significant difference in half life was observed—all cell types had the same half-life slope over 24 h (Fig. 1C). As expected, no difference was seen due to the CGGGG polymorphism (data not shown).
Using the same actinomycin D-treated samples, the relative stabilities of the first exons of IRF5 were evaluated using a TaqMan-based quantitative PCR assay by comparing the first exon to the total IRF5 expression level (Fig. 1D). Cell lines that could use exon 1B (rs2004640 T/T) were evaluated so that the relative levels of exon 1B could be assessed with the other first exons. The mRNA was more difficult to detect when amplifying just the first exon, with no first exons measurable after 24 h. No first exon seemed to confer added stability compared with other first exons, as no statistically significant differences were observed among slopes.
Exon 1 usage is altered in cells with the risk polymorphisms
The first exon of IRF5 can be any of the following 4 options: exons 1A, 1B, 1C, or 1D. This alternative promoter splicing may be used so that a single protein may be produced in response to many different stimuli. Depending on the cell type and the signals the cell receives, any or all of the promoters may be activated to produce IRF5. The expression level of each first exon was measured in unstimulated LCLs.
For a proportional analysis of first exon usage, levels of each first exon were measured by TaqMan-based quantitative PCR, and normalized to the total amount of IRF5. To calculate proportions, the inverse of the ΔCT was used, as CT values are low when expression is high.
Considering the CGGGG 4X polymorphism, the proportions of the first exon usage did not differ greatly compared with cells with the 3X polymorphism, with exon 1D having the greatest change, 5% lower in risk. The effect of the rs2004640 genotype was more pronounced, due to exon 1B usage only in risk cells. In cells with the protective SNP, 35% of total IRF5 mRNA contained exon 1A, 28% contained exon 1C, and 37% had 1D. In cells with the risk allele, 1A was found in 30% of mRNA, only 20% used 1C, and only 28% used 1D. Exon 1B was exclusively used in risk cells, and comprised 22% of the mRNA (Fig. 2A).
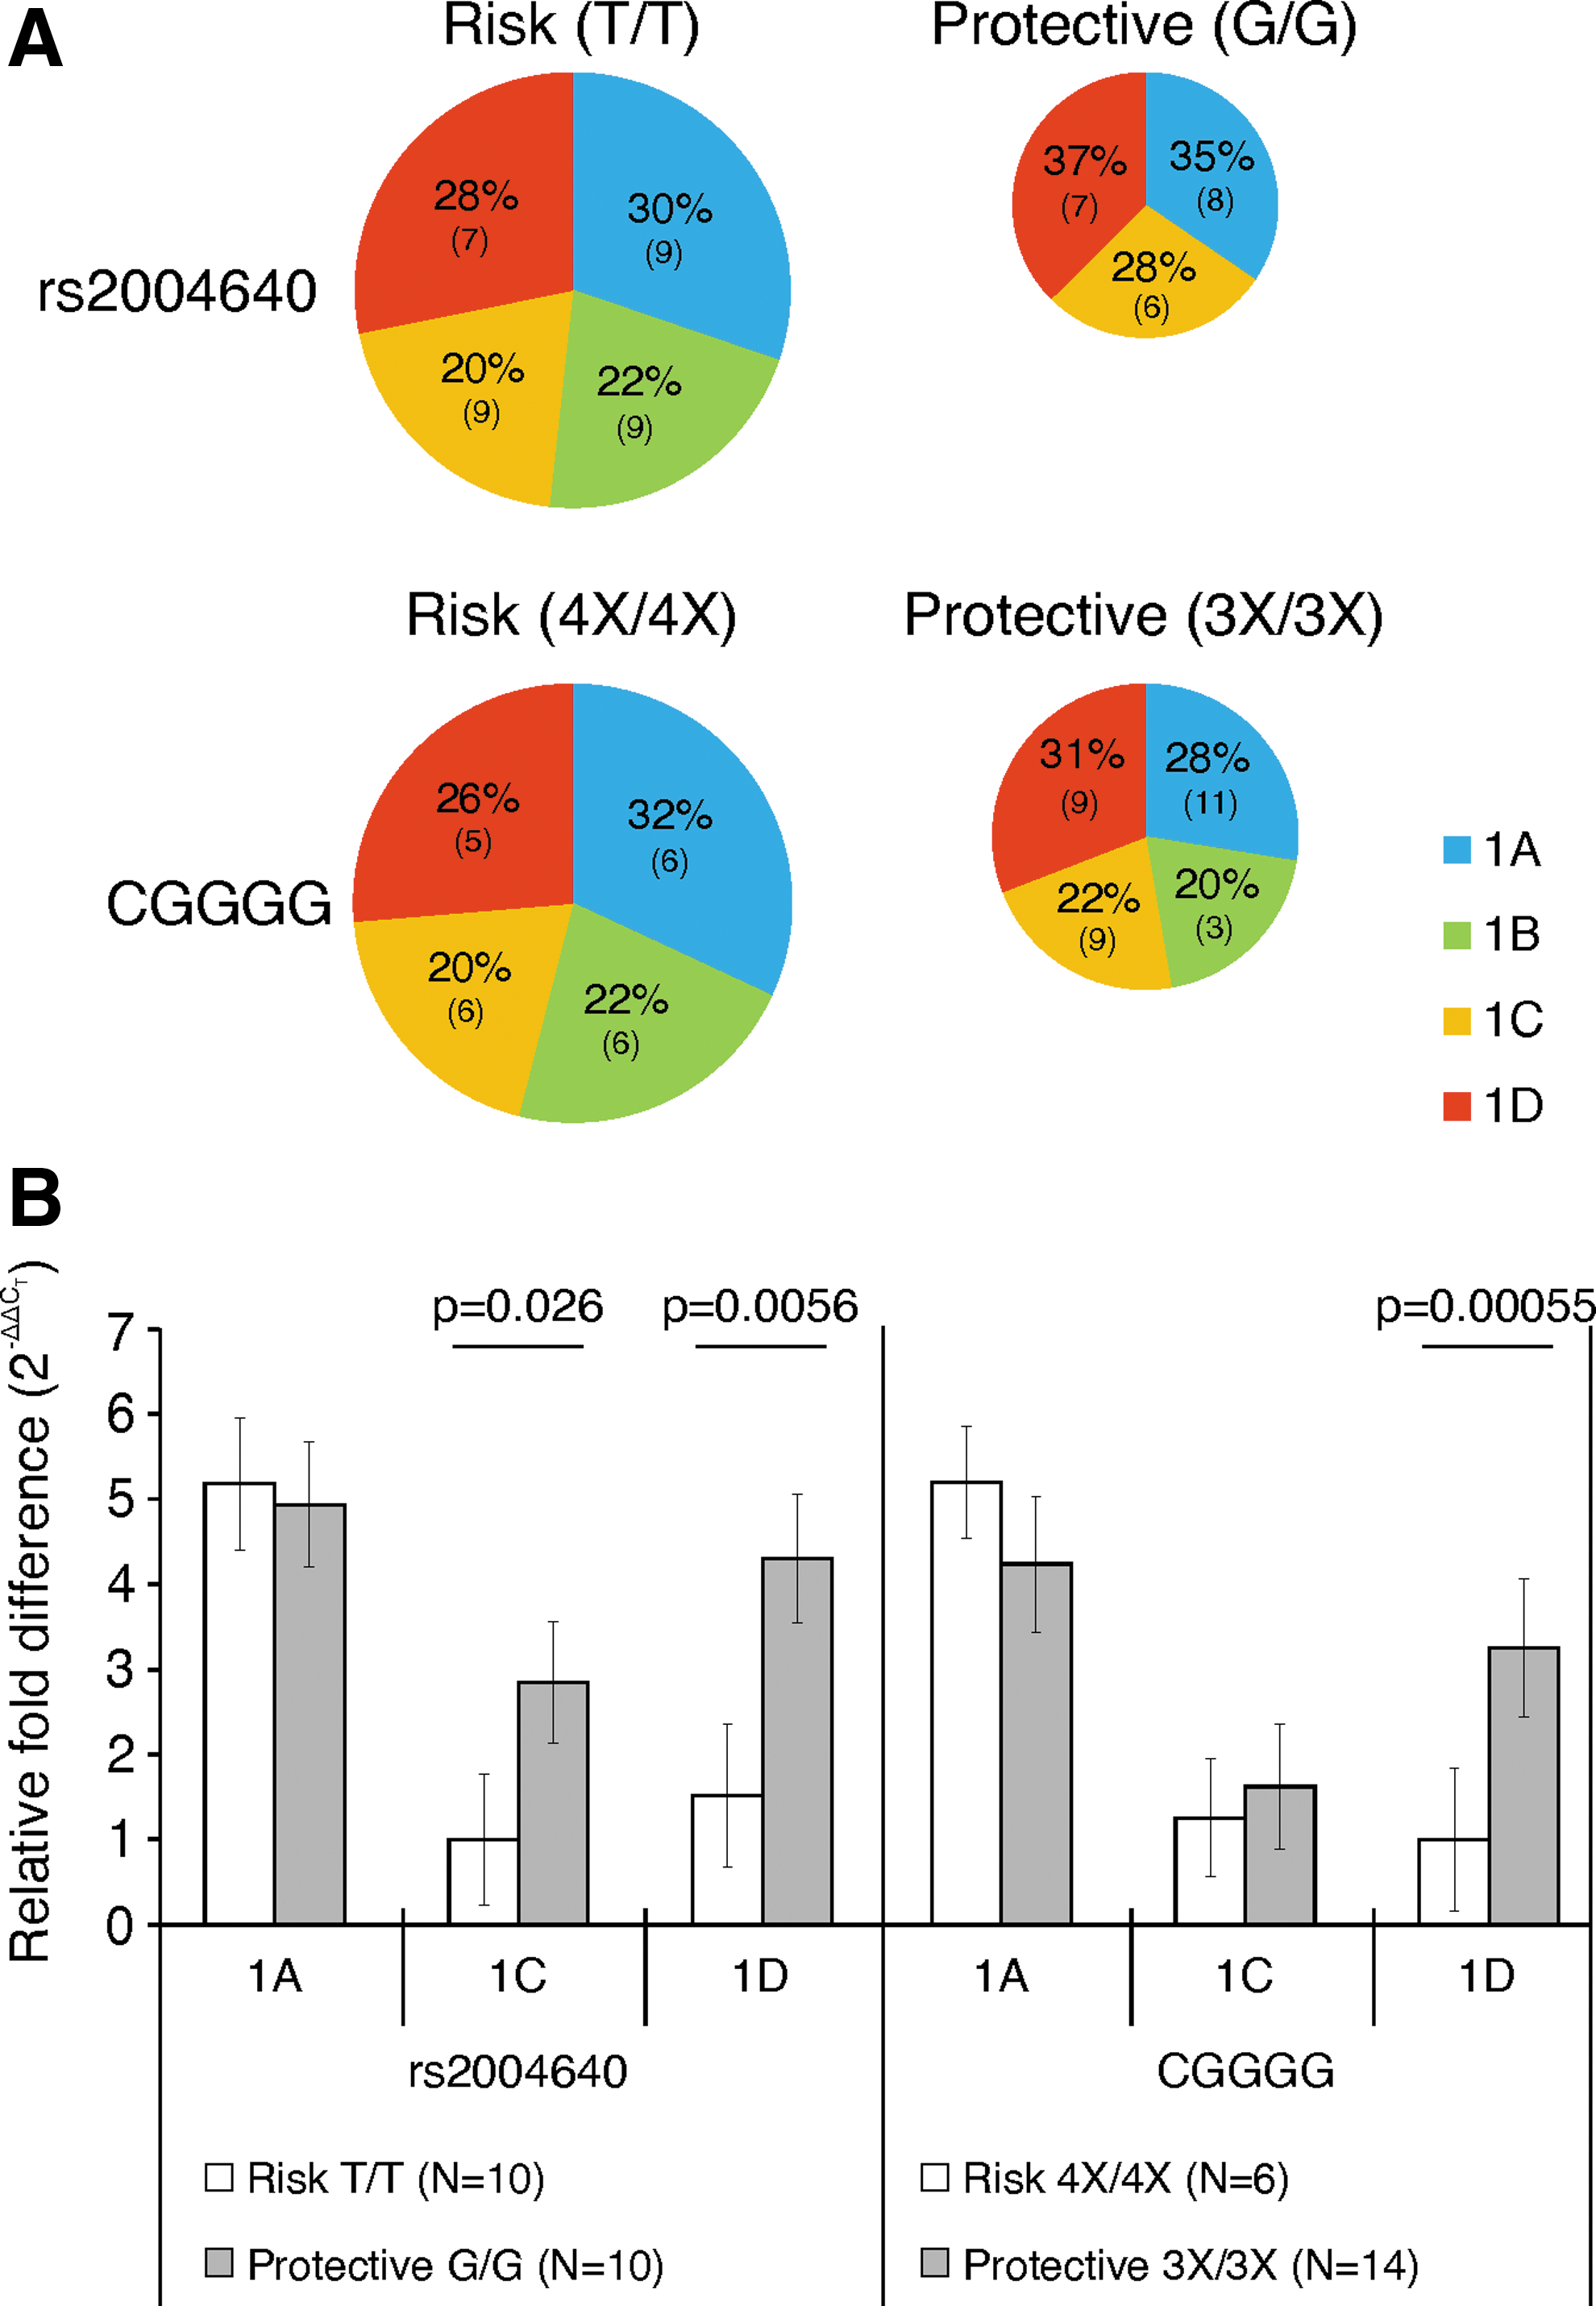
Usage of exon 1C and exon 1D is lower, and exon 1B is higher in cells with the rs2004640 risk allele; exon 1D usage is lower in cells with the CGGGG risk allele.
Relative mRNA concentrations were compared between risk allele-containing and control cells using a SYBR green-based quantitative PCR assay. For the rs2004640 SNP, 1C levels were 2.9-fold lower in risk (P=0.026), and 1D levels were 2.8-fold lower in risk (P=0.0056). The CGGGG indel affected only exon 1D, which was 3.2-fold lower (P=0.00055) (Fig. 2B). When measuring the total level of each exon 1 (comparing with the levels of the housekeeping gene β-glucuronidase instead of total IRF5 levels), exon 1A was used at 4.0-fold higher levels in rs2004640 risk cells; however, this only approached significance (P=0.081, data not shown), and the CGGGG indel exhibited a similar trend.
Transcripts initiating with exon 1B are not well translated compared with the other first exons of IRF5
Since IRF5 mRNA may begin with either of 4 different first exons, we evaluated the translational efficiency of mRNA depending on which first exon was used. It should be noted that exon 1B can only be used by individuals with the risk allele at rs2004640, but the SNP itself was not included on the plasmid, as the SNP is eliminated from the RNA on splicing onto exon 2.
Each of the IRF5 first exon variants was inserted into a luciferase vector, and used to compare the effect on translational efficiency. Luciferase expression was driven by the SV40 promoter in all cases. HEK293 cells, which do not usually express IRF5 (Balkhi and others 2010), were transfected with 1 of the 4 luciferase plasmids as well as a plasmid that expresses a DsRed fluorescent protein, which was included as a transfection control. Values for luciferase expression were then normalized to account for transfection efficiency.
The entire 5′UTR was added in front of luciferase, which includes the first exon and 11 bases of exon 2. Sequencing verified an exact match to published IRF5 5′UTRs (GenBank IDs: NM_002200.3, NM_032643.3, NM_001098627.2, and EU258897.1 for exons 1A, 1B, 1C, and 1D, respectively). Exon 1B was least-well translated, especially when compared with exon 1A (28-fold lower, P=0.048) and when compared with 1D (16-fold lower, P=0.022) (Fig. 3).
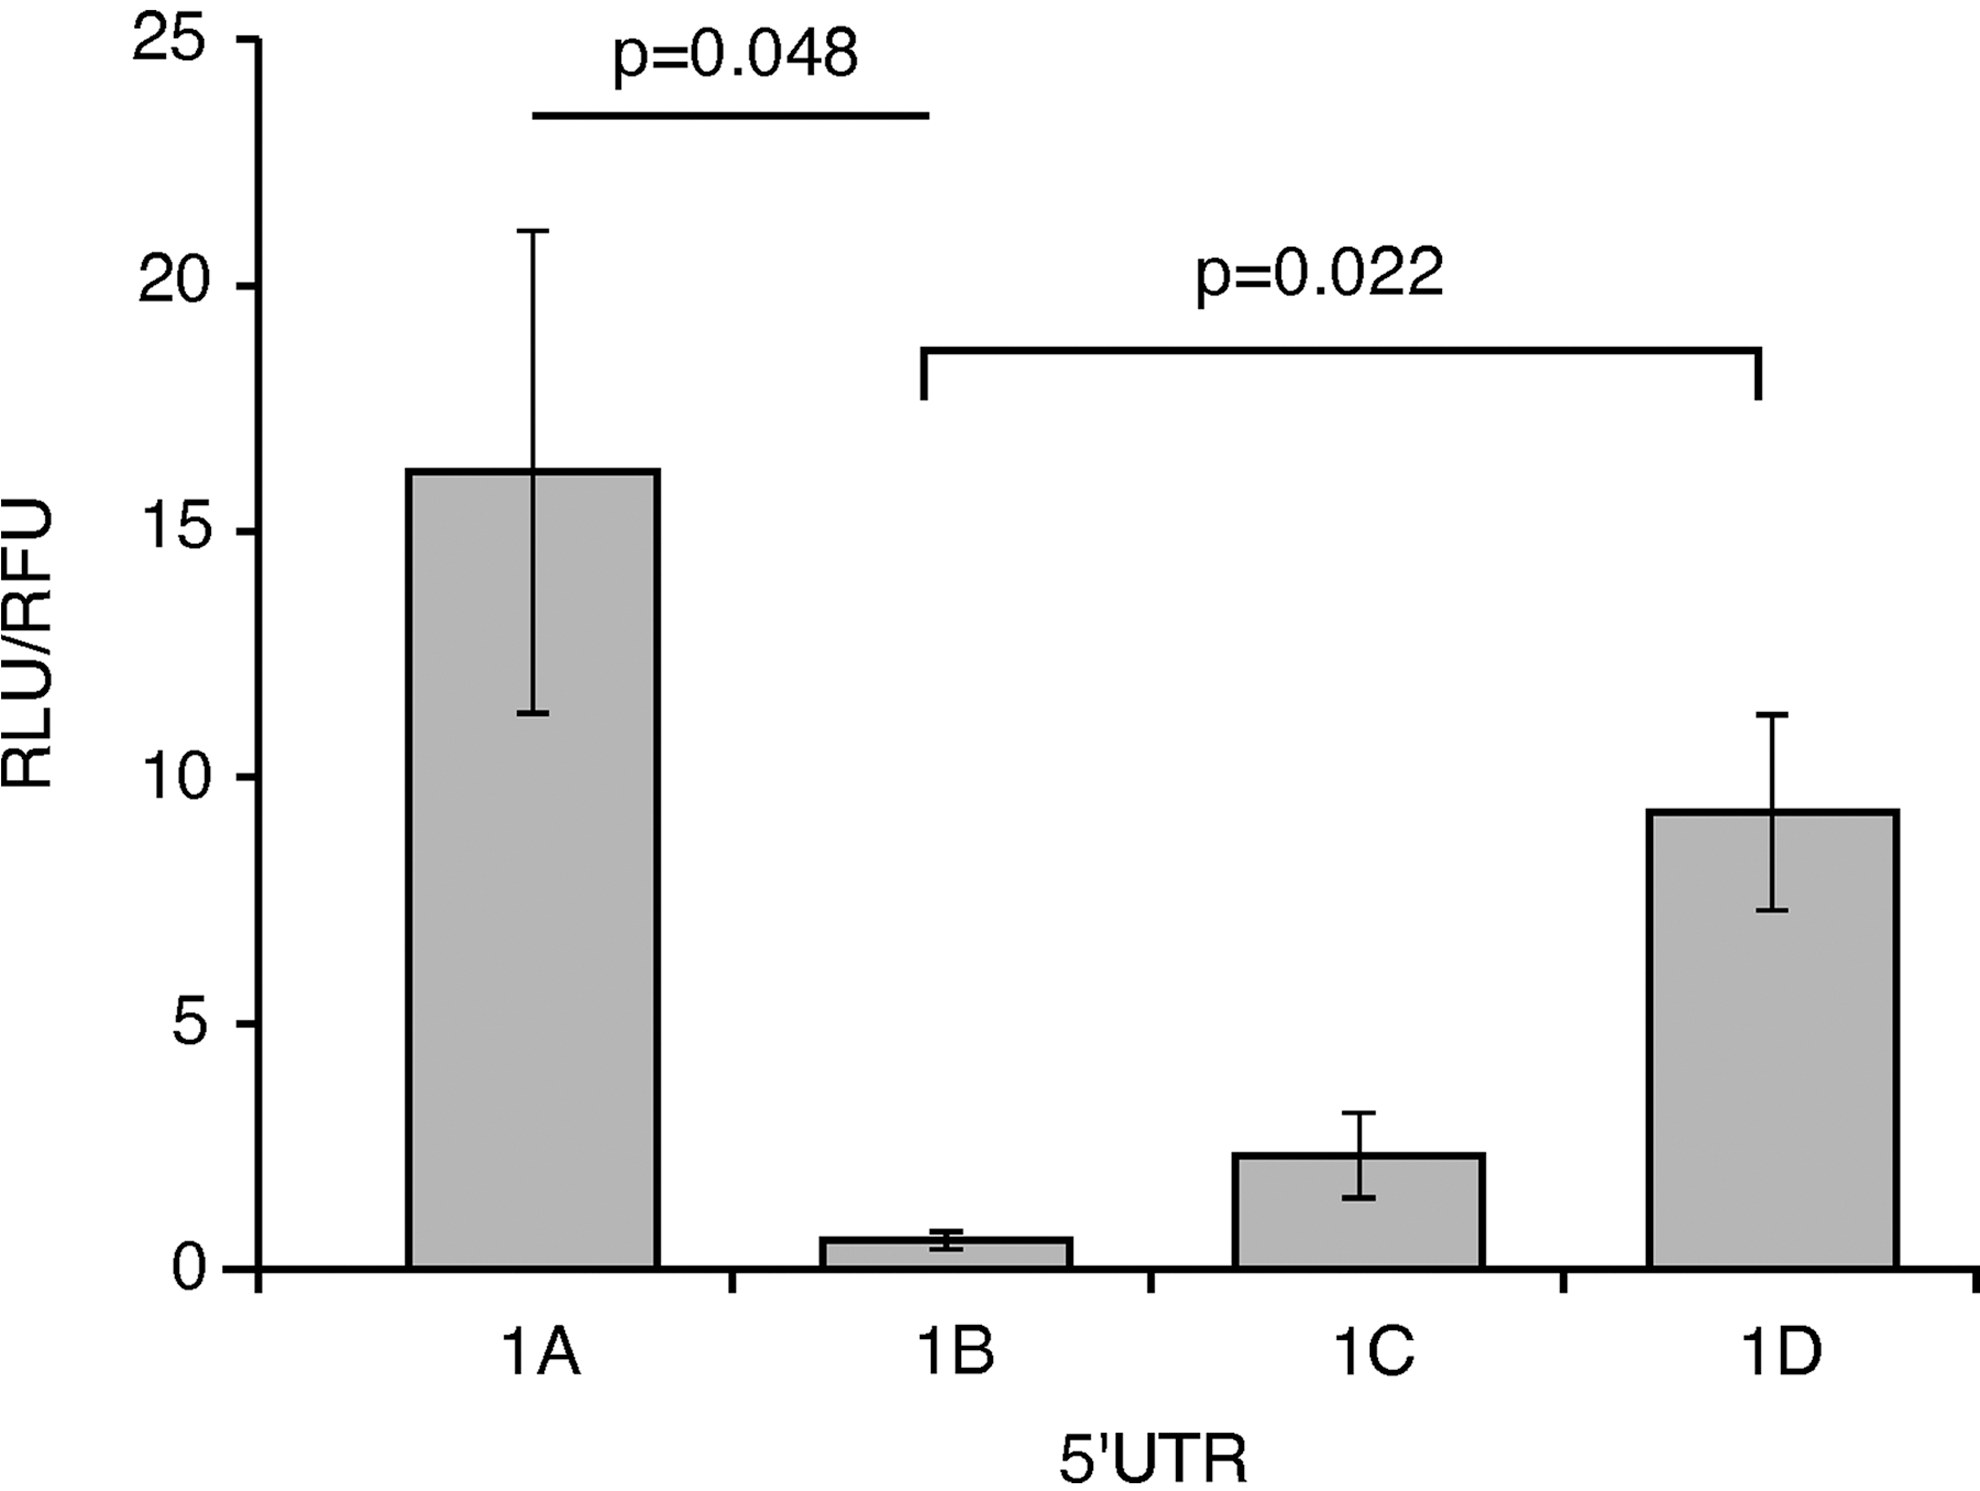
Translational activity levels differ among the 4 IRF5 first exons' 5′UTRs. Four different 5′UTRs, including each first exon of IRF5, were inserted before a luciferase reporter gene, although each had the same promoter, to assay translation efficiency. These plasmids were co-transfected into HEK293T cells with a control red fluorescent protein-expressing plasmid to normalize transfection efficiency. Exon 1B was translated relatively weakly, whereas exon 1A was 28-fold higher (P=0.048) and 1D was 16-fold higher (P=0.022). Bars represent standard error. Averages are from 4 independent experiments. RLU, relative luminescence units; RFU, relative fluorescence units; UTR, untranslated region.
Exon 1B translation is inhibited by a hairpin
The secondary structure of mRNA is often important in translational efficiency, especially near the 5′ end, where translation is initiated (Kozak 1999). Exon 1B-containing RNA was analyzed for secondary structure, due to its low translation level. mfold analysis of IRF5 exon 1B predicted a hairpin, which includes all of exon 1 and 3 bases of exon 2 (Fig. 4A). This hairpin was predicted when analyzing either the 5′UTR alone or the entire mRNA of IRF5 variant 2 (GenBank ID: NM_032643.3), which begins with exon 1B.

Exon 1B translation efficiency is inhibited by a hairpin structure.
To determine whether low translation levels were influenced by the hairpin binding, the hairpin was disrupted. Within the hairpin, 3 G-C base pairs had the strongest ΔG value. At these bases, a guanosine was mutated to adenosine using custom-made oligonucleotides. These G-to-A mutations were predicted to disrupt the hairpin when full-length IRF5 variant 2 mRNA folding was analyzed. The mutated exon 1B was not predicted to self anneal, but instead it annealed to distal areas of the mRNA (Fig. 4B). In order to reform the hairpin to verify that the hairpin structure, not the specific sequence, was responsible for low translation, a variant was constructed with complementary changes to enable hairpin basepairing, but with an altered sequence (Fig. 4C). A folding analysis also placed each of these three 1B 5′UTRs in front of luciferase, instead of with IRF5. The hairpins were predicted to be intact in the wild-type and complementary mutant versions (data not shown).
The 3 versions of exon 1B 5′UTRs were inserted directly upstream of the luciferase coding region in individual plasmids. The 1B wild-type plasmid is the same 1B plasmid from transcripts initiating with exon 1B that are not well translated compared with the other first exons of IRF5 section. Transfections and luciferase activity calculations were performed, as transcripts initiating with exon 1B are not well translated compared with the other first exons of IRF5 section. Elimination of the hairpin structure resulted in a 5-fold increase in translation (P=0.0021). Reconstruction of the hairpin by complementary mutations abolished the increase in translation (P=0.030) (Fig. 4D).
Alternative splicing and identification of 5 novel IRF splice variants with missing nuclear export and PEST domains
Alternative splicing of IRF5 is common, not only the first exon, but downstream as well. Splicing of IRF5 is more common in PBMCs from SLE patients, which has been attributed to increased expression of splicing components such as small nuclear ribonucleoproteins (Feng and others 2010).
Reverse-transcription PCR of IRF5 was performed on LCLs generated from healthy individuals. PCR used exon 1-specific primers and a common reverse primer in exon 7. These primers span the area of IRF5, where alternative splicing is most common, exon 6 (Graham and others 2007). After electrophoresis, several bands were observed that were smaller than the predicted size for full-length IRF5. Bands were gel extracted, purified, and then sequenced to reveal alternative splicing patterns. The number of variants was counted for each sample based on the bands observed after PCR, and subdivided based on the first exon that was used.
The number of splice variants in each sample was dependent on the risk or protective status of the rs2004640 polymorphism. In the protective cells, significantly more variants were found that used exon 1C than in risk cells (5.2 compared with 3.5, P=0.04). In addition, after stimulation with the TLR7 agonist imiquimod, the risk cells had significantly higher numbers of variants using exon 1A per sample (6.7 compared with 4.7, P=0.03). The total number of splice variants that use exon 1A significantly increased after imiquimod treatment, from 4.5 to 6.7 (P=0.01). No other first exons had significant changes in the number of splice variants found based on imiquimod stimulation (Fig. 5).
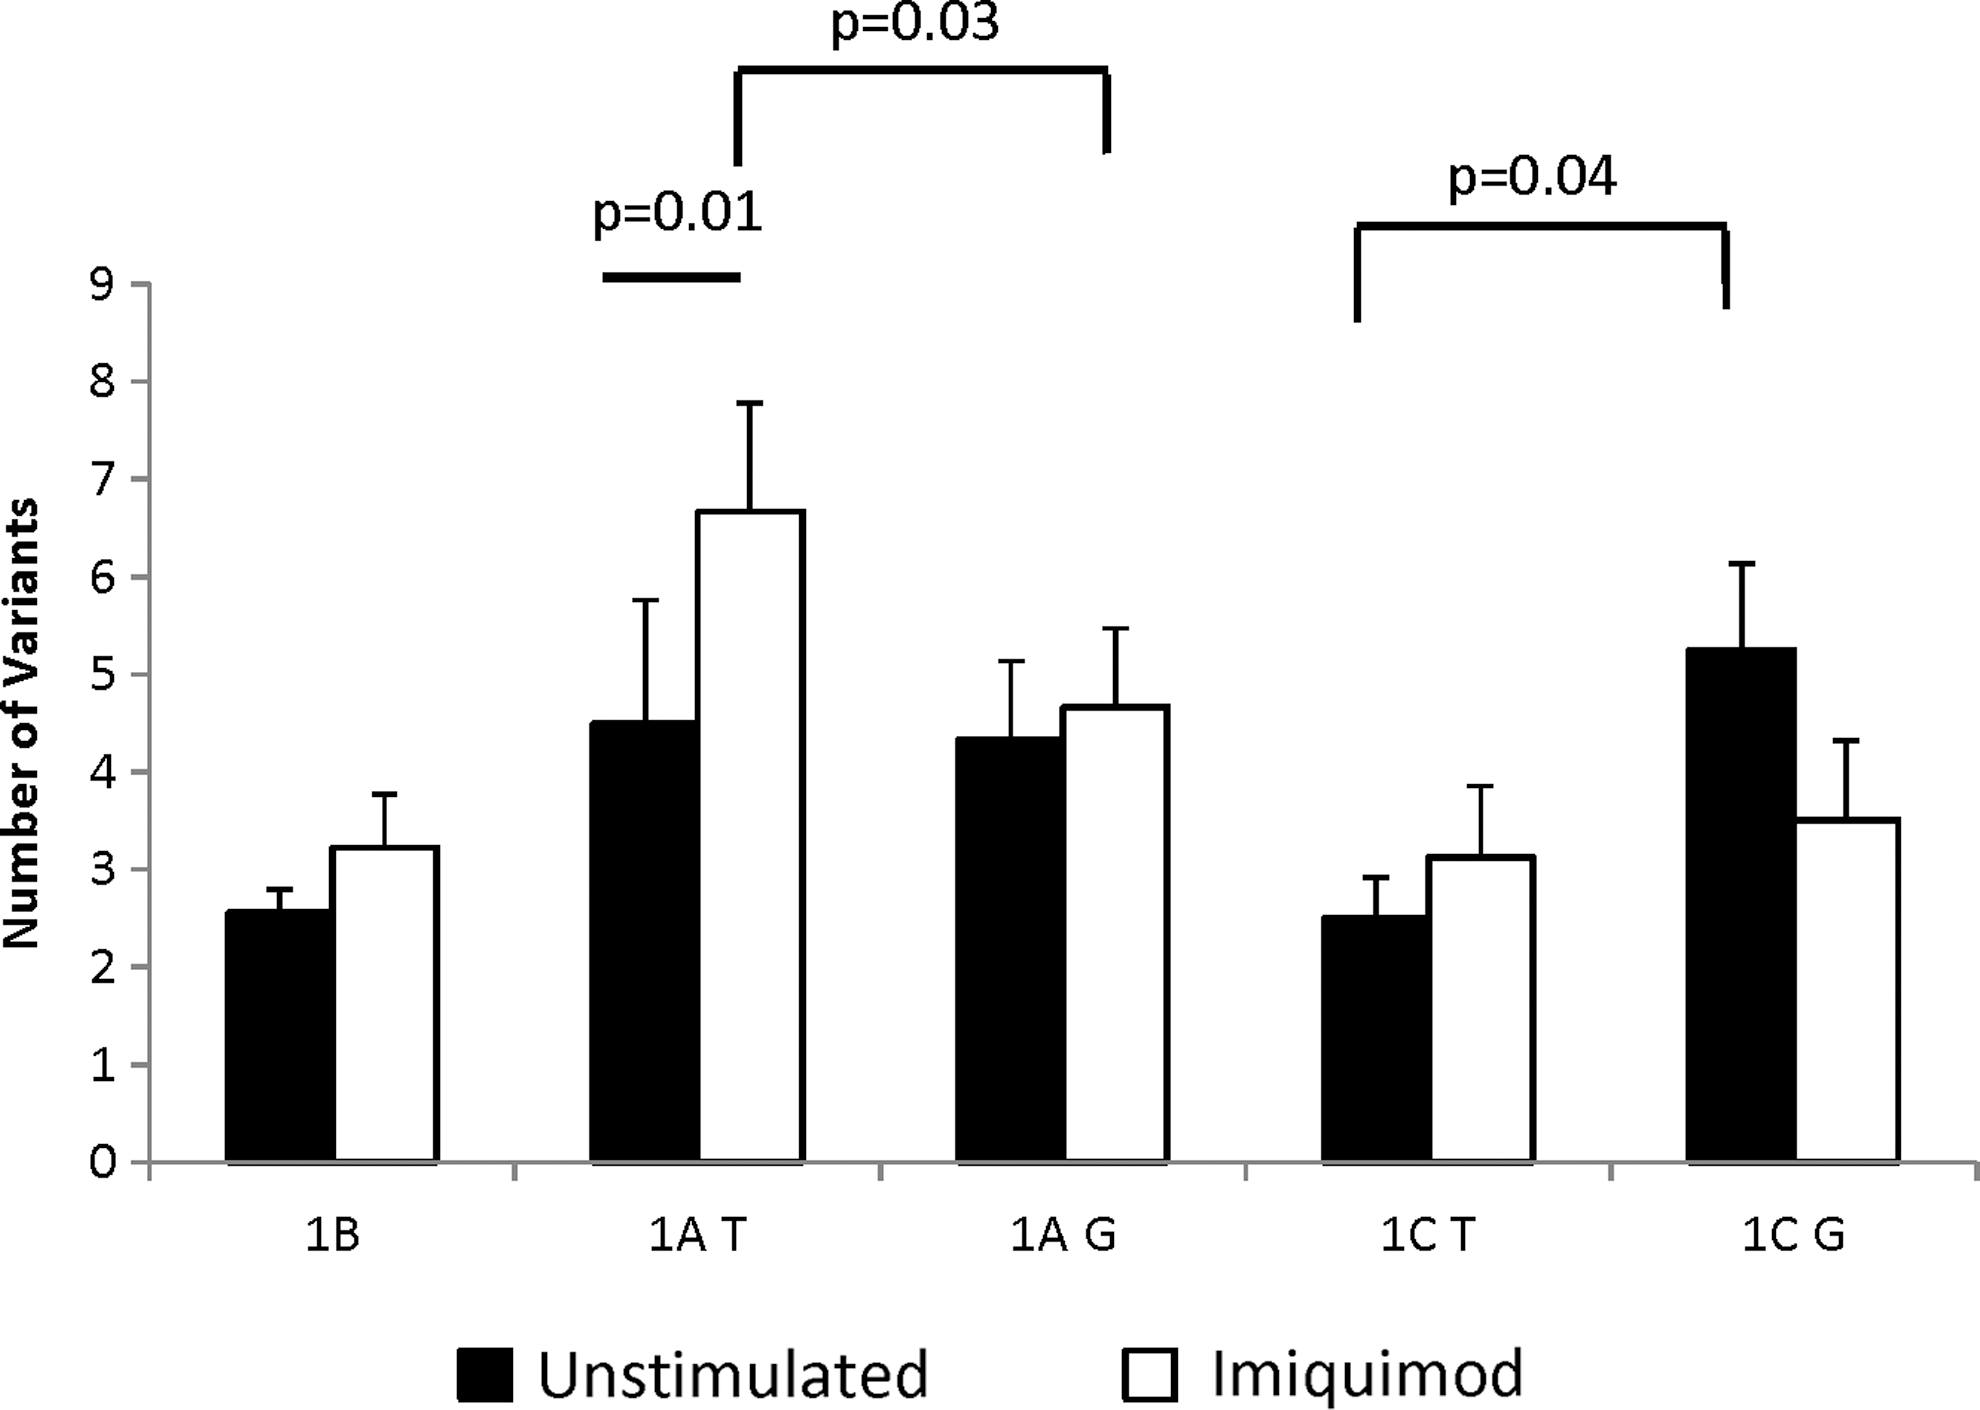
Variation in splice variant number based on the risk allele rs2004640. LCLs homozygous for risk (T) or protective (G) alleles at rs2004640 were either stimulated with imiquimod or left unstimulated. RNA was extracted and amplified using RT-PCR specific for first exons 1A, 1B, 1C, or 1D. Bands were counted, cut out of the gels, and the 5′ ends were sequenced to confirm the presence of IRF5 variants. The figure shows the number of bands detected using primers for each first exon. Treatment with imiquimod significantly increased the number of splice variants that use exon 1A, but only in those cells with the risk allele (P=0.01). After treatment, there were also more splice variants of exon 1A in the risk than in the protective cells (P=0.04). Exon 1C showed a different pattern, where there were a greater number of variants in the protective than in the risk cells (P=0.04), and there was no significant change after imiquimod treatment. N=6 pairs
Five new splice variants were observed. They were sequenced and named variants 13 through 17 (GenBank IDs: JQ950681-JQ950685). Two variants, 13 and 14, exactly match the previously identified variant 8, except variant 13 uses exon 1B and 14 uses exon 1C. All 5 novel splice variants exhibited skipping within exon 6. Exon 6 contains most of the nuclear export signal (NES) (Lin and others 2005) and the instability domain (Barnes and others 2002), which is also referred to as the proline, glutamic acid, serine, and threonine (PEST) domain. Variants 15, 16, and 17 change the frame and would produce a protein with an early stop codon, truncating the transactivation domain. This is similar to previously identified variants 9, 11, and 12. Variants 13, 15, and 16 use exon 1B, and they are only found in cells containing the rs2004640 risk allele. All newly identified variants are shown in Fig. 6, with previously identified variants for a comparison.
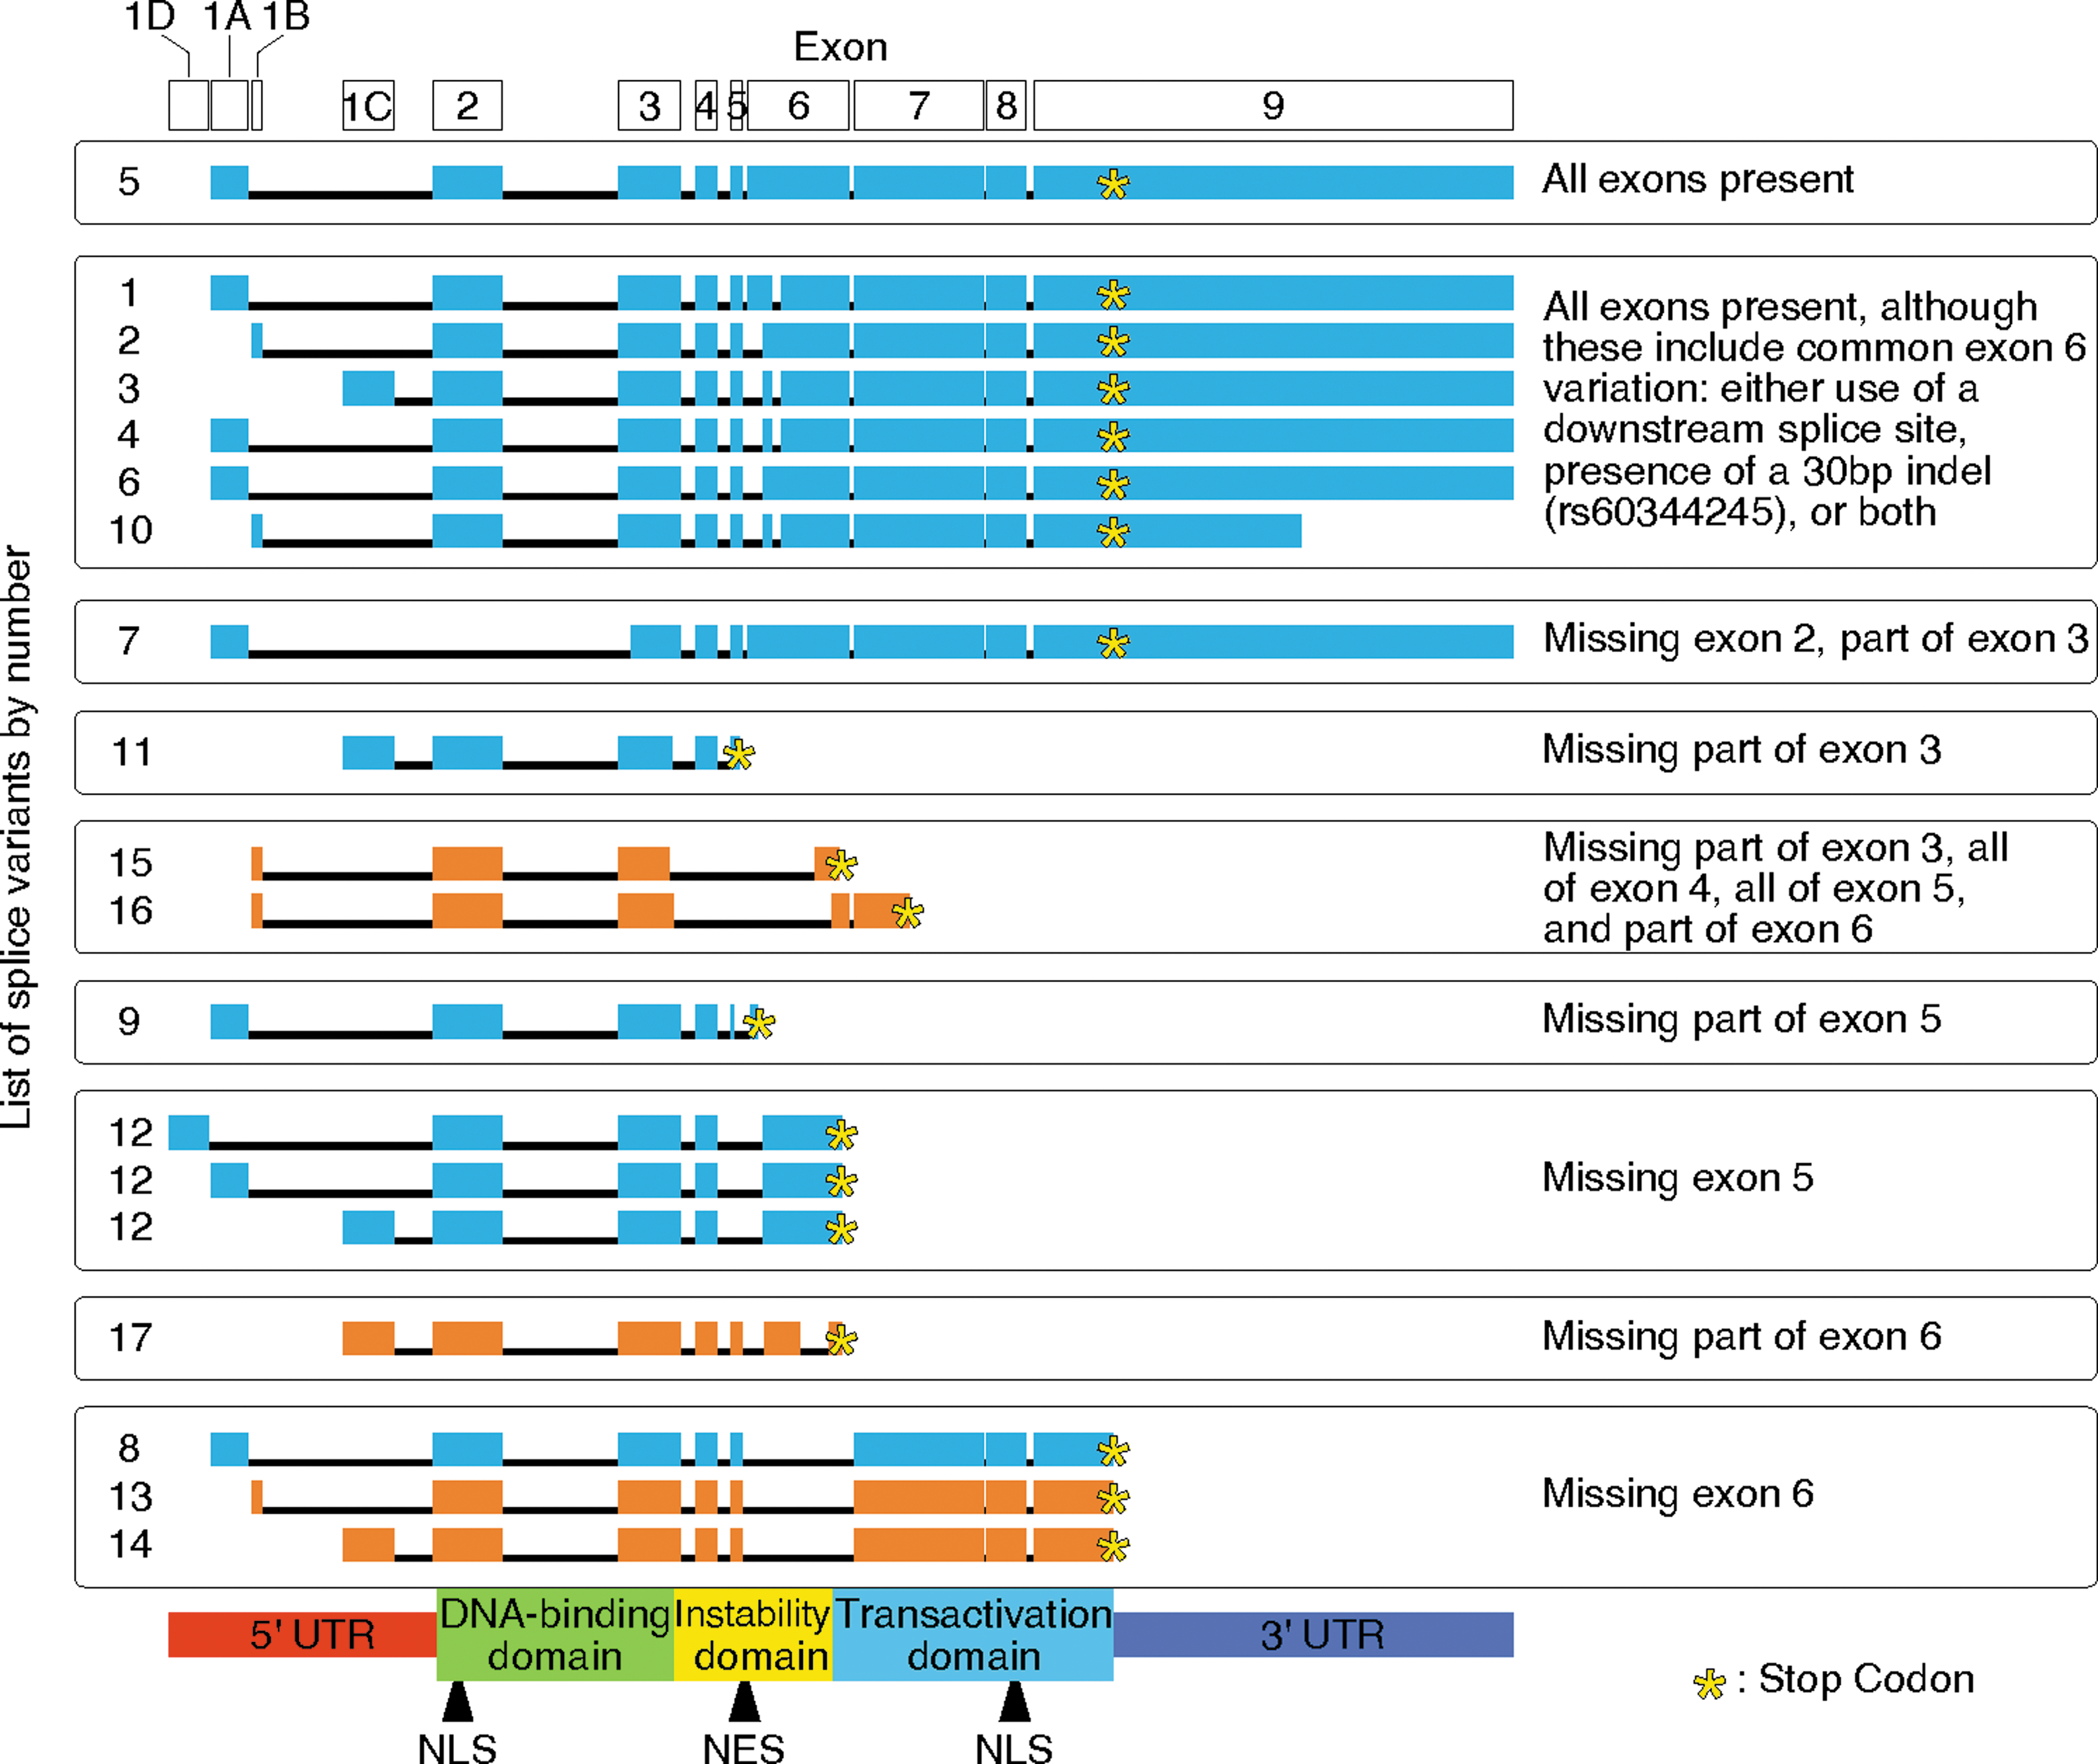
All currently known IRF5 mRNA splice variants organized by splicing events and including 5 novel variants. For the new splice variants shown in orange, LCLs generated from healthy volunteers were used to make cDNA libraries. PCR products were separated by size on agarose gels and sequenced. Boxes represent exons; lines are introns. Functional areas of the encoded protein are indicated at the bottom; exons are indicated at the top. The 4 possibilities for exon 1 are 1D, 1A, 1B, and 1C; and exon 1B is only found in cells with the rs2004640 risk T allele. The first 12 splice variants were previously discovered (blue), and variants 13–17 were discovered in the current study (orange). Boxes were placed around groups based on common splicing events. The common start codon is 12 bp into exon 2, except for variant 7 (which lacks exon 2), and begins in frame in exon 3. Variants 9, 11, 12, and 15 to 17 include frameshift splicing events and have early stop codons (yellow stars). Some variants do not show sequences past the stop codon. The 3′ ends of most variants are not fully sequenced, or their length is variable due to 2 possible polyadenylation signals. Drawn to scale, but introns were reduced in size 10:1. NLS, nuclear localization signal; NES, nuclear export signal.
Discussion
Both the CGGGG indel and the rs2004640 polymorphisms are in the promoter region of IRF5 and affect expression and first exon usage. In LCLs, the levels of IRF5 mRNA and protein were approximately doubled by these polymorphisms. The rs2004640 had the greatest effect on both mRNA and protein levels. There was, however, an overlap of risk genotypes (some samples had both the rs2004640 risk allele and the CGGGG risk allele), and repeating these experiments with a larger sample size may detect independent effects better.
The relative stability of IRF5 mRNA is not significantly affected by the rs2004640 or CGGGG polymorphisms. In addition to being quantified as a whole, IRF5 transcripts were also measured according to first exon usage. Measuring first-exon-specific mRNA stability did not demonstrate that one first exon yields RNA which is more or less stable than another first exon. Instead, similar trends to those seen in Fig. 1 were observed over time, with exons 1A and 1D higher and 1C low throughout. We conclude that in LCLs, IRF5 stability is affected neither by the rs2004640 or CGGGG promoter polymorphisms nor by the first exon used.
In proportion to the total amount of IRF5 mRNA in a cell, the CGGGG 4X variant did little to change the balance of first exon usage, although exon 1D was used less in risk cells. Cells with the rs2004640 T allele used exons 1C and 1D less than protective cells. Taken together, this establishes an rs2004640 splicing profile: Risk allele-containing cells exclusively use exon 1B and use less exon 1C and exon 1D. The risk rs2004640 allele increases IRF5 in spite of low translational efficiency, because it drives a 2-fold increase in overall transcription. This high transcription in people with the risk allele suggests a role for the effect of exon 1B usage on overall protein expression. Increased IRF5 is the likely source of risk for which an association to autoimmunity has been established.
Levels of 1A were proportionally equal between risk and protective cells in both polymorphisms. This excludes the result that there is double total IRF5 in risk cells; therefore, the absolute level of 1A may be higher. When measuring the absolute level of each exon 1 by comparing with a housekeeping gene instead of IRF5, exon 1A was used at higher levels in rs2004640 T/T risk cells and CGGGG 4X/4X risk cells; however, this difference did not reach statistical significance. This increase in 1A levels may help explain why even though translation from exon 1B is low, a higher amount of overall mRNA expression leads to a higher net amount of IRF5 protein in those with the rs2004640 risk T allele.
The spacing between these promoters may be crucial for nucleosome positioning, since transcription start sites are often nucleosome free, allowing transcription factors to bind (Mellor 2005). The 1D, 1A and 1B exons are very close on the genome (see Fig. 5). The space between 1D and 1A is 276 bp, and the space between 1A and 1B is 226 bp. The nucleosome wraps ∼147 bp of DNA with a linker of less than 160 bp (Valouev and others 2011); thus, the 1D-1A-1B spacing is sufficient for a nucleosome to bind in between each. However, they are close enough that if one transcription site is being used, the neighboring sites may be occluded. This could explain, for example, why exon 1D usage decreased when the 1A promoter can bind additional transcription factors due to the CGGGG 4X variant. Exon 1C is 2,501 bp downstream from 1B and is not likely affected as directly.
IRF5 transcripts originating with exon 1B, which forms a hairpin, are translated 5-fold less efficiently compared with a structure without the hairpin. This is likely due to the inability of the ribosome to bind to the occluded 5′ end of exon 1B of IRF5 and to initiate translation. When compared with the expression levels of the other exon 1 variants of IRF5, exon 1B was translated at the lowest levels. This contradicts a previous report by Kozyrev and others (2007), who have a much higher value for the 1B 5′UTR, although other translation levels are in agreement. This difference is likely due to their use of 5′RACE-amplified UTRs, whereas our 5′UTRs used reference sequences for exons 1A-1C and variant 12's 5′UTR for exon 1D (see Transcripts initiating with exon 1B are not well translated compared with the other first exons of IRF5 section).
The usage of exon 1B may have an effect on splicing events other than exon 1, as some splicing is linked. For example if one exon is used, another exon may always be used or never be used. However, except that only one exon 1 can be used per molecule, none of these concomitant splicing events were seen. For example, three 1B variants have exactly the same amino-acid sequence as three 1A variants—1B variants 2, 10, and 13 encode the same protein isoforms as 1A variants 6, 4, and 8, respectively.
Variants 8, 9, and 12 have been shown to be constitutively nuclear (Mancl and others 2005; Martin and others 2007), as they lack the NES in exons 5 and 6. Although they have not been analyzed, it is likely that variants 11 and 13–16 are also constitutively nuclear due to similar patterns of missing amino acids. They also have an intact DNA binding domain. In fact, only one identified variant has any splicing truncation in the DNA-binding domain, variant 7. It is interesting that many of the variants can bind DNA, but have truncations in either the instability domain or the transactivation domain. If DNA binding is active but transactivation is not, the encoded protein will likely be dominant negative.
IRF5 exhibits a high degree of alternative splicing, and alternative splicing of IRF5 was shown to be higher in lupus patients (Feng and others 2010). The ability to alternatively splice IRF5 likely enables a fine-tuned response to a variety of immune signaling events (Mancl and others 2005), but in conjunction with autoimmune disease, this high degree of alternative splicing may be detrimental. Although there are currently 17 known variants of IRF5, there are likely a dozen more ways to splice IRF5. Splicing may occur in response to specific stimuli that would further explain the varied levels of first exon usage and changes in overall levels of expression.
A key effect of these promoter polymorphisms, therefore, is to increase the levels of IRF5, at both the mRNA and protein levels. Several studies have shown that a rs2004640 risk haplotype causes increased expression of IRF5 mRNA or IFN-pathway genes in lupus patients (Graham and others 2006; Kawasaki and others 2008). Our experimental design used only healthy controls with and without the risk polymorphisms. This provided us the advantage of measuring the effect of the risk allele without the confounding factors of disease, as all of our data come from those with the risk factor for autoimmune disease, but not the disease itself. We, thus, infer a causal relationship between high IRF5 levels and autoimmune disease. This is corroborated by Irf5 knockout mice, which are protected from lupus-like disease and have altered cytokine and cell migration responses (Savitsky and others 2010; Tada and others 2011; Xu and others 2012; Yang and others 2012).
High amounts of IRF5 would affect all the roles of IRF5, but depend on the cells in which it was expressed. Our study involved the use of LCLs. Although immune signaling may be dysregulated in LCLs, which are transformed by EBV, both risk and protective cells lines received the same treatment. LCLs have very low (0.3%) somatic mutation rate (Sie and others 2009) and a 96% concordance rate of SNP calls before and after transformation (Londin and others 2011). LCLs are a good model for B-cell gene expression, but care should be taken in applying these results to other cells, which would transcribe the 4 first exons at different rates. These LCLs showed high levels of exon 1A and exon 1D usage. Another cell type, PBMCs, also shows a pattern of high 1A and 1D usage among lupus patients (Feng and others 2010).
The different roles of IRF5 align with the range of autoimmune diseases that it is involved in. As examples, IRF5 functions as a cytokine transcription factor (Barnes and others 2002; Krausgruber and others 2011) and as a p53-independent pro-apoptotic regulator (Hu and others 2005; Yanai and others 2007; Hu and Barnes 2009). Dysregulation of cytokine levels and apoptosis are features of SLE (Emilie and others 1996; Cahir-McFarland and others 2004; Kaplan 2004), the disease that the rs2004640 SNP was first associated with. In addition, IRF5 has been shown to be an important mediator in macrophage differentiation toward pro-inflammatory M1 macrophages (Krausgruber and others 2011). With high levels of IRF5, there would be more pro-inflammatory cytokines, which would provoke a greater immune response. This has been confirmed by association of the rs2004640 risk SNP in IRF5 with macrophage activation syndrome (Yanagimachi and others 2011).
The etiologies of autoimmune diseases are complex, but various genetic and environmental factors contribute to their onset. Studies on genetic risk factors such as the rs2004640 SNP and CGGGG indel in IRF5 point to the pathways involved in disease, and, therefore, to therapies that enable more effective treatments.
Footnotes
Acknowledgment
This study was funded by a Brigham Young University mentoring environment grant.
Author Disclosure Statement
No competing financial interests exist.
References
Supplementary Material
Please find the following supplemental material available below.
For Open Access articles published under a Creative Commons License, all supplemental material carries the same license as the article it is associated with.
For non-Open Access articles published, all supplemental material carries a non-exclusive license, and permission requests for re-use of supplemental material or any part of supplemental material shall be sent directly to the copyright owner as specified in the copyright notice associated with the article.