
Abstract
Extensive damage of liver parenchyma stimulates hepatic cells to transit from quiescence to proliferation with eventual restoration of liver mass and function. Our recent studies have revealed upregulated expression of interferon (IFN)-α and its antiviral activity during the early hours after partial hepatectomy. In this study, we analyzed the response of primary hepatocytes from intact liver to IFN-α mimicking its levels (250 U/mL) during the transition period of liver restoration. The gene expression profile was analyzed with rat genome array 230 2.0 (Affymetrix). After 3- and 6-h treatment we identified respectively 28 and 124 differentially expressed genes responsible for autonomous changes in hepatocytes and those involving non-parenchymal cells in a concerted response to IFN-α. The response has an energy sparing character and affects all levels of gene expression. The factors activating T cells and apoptosis are opposed by those restricting the signal propagation, inhibiting T cells activation, and promoting survival. The partial resemblance between the specific in vitro response to IFN-α and the processes in regenerating liver is discussed. Our study opens the way to a more focused investigation of the liver cell response to quasiphysiological dose of IFN-α.
Introduction
T
There is another active player in innate immunity-interferon (IFN)-α. Until recently, it was considered only as a negative factor, which when administered inhibits the progression of liver regeneration after PH (Theocharis and others 1995). However, its specific activities and strictly controlled production may be engaged in reorienting cellular metabolism during the transition of hepatic cells from quiescence to proliferation. In agreement with this concept, our recent studies revealed a transient upregulation of Ifnα mRNA and IFN-α-specific antiviral activity during 1–3 h post-PH, preceding the G1 phase of the hepatocyte cell cycle. The antiviral activity was nearly one order less than after poly(I)–poly(C) administration (Perepelyuk and others 2006, 2009). The activation of intracellular IFN-α signaling and expression after PH corroborated our results (Han and others 2007; Chen and others 2010).
To approach the impact of quasiphysiological IFN-α production on gene expression we started with the analysis of primary rat hepatocyte response to IFN-α treatment mimicking its endogenous levels during the transition period, that is, at a lower concentration (250 U/mL) and a shorter duration (3, 6 h) than usually applied in in vitro experiments (1,000 U/mL, 16 h) (de Veer and others 2001). The advantage of such an approach is that the biological response may be closer to an in vivo situation than the majority of published IFN-α effects obtained with transformed cell lines. The differentially expressed genes were responsible for autonomous changes in hepatocytes and those involving the non-parenchymal cells in concerted response to IFN-α. The response has an energy sparing character and affects all levels of gene expression. It is less prominent than that usually obtained with higher doses of IFN-α. The factors activating T cells and apoptosis are opposed by those restricting the signal propagation, inhibiting T cells activation, and promoting survival. The specific response to IFN-α bears partial resemblance to the processes in regenerating liver. The results of our study characterize tightly balanced fine-tuned and time-dependent hepatocytes response to IFN-α levels recorded after PH and open the way for a more focused investigation of the liver cell response to quasiphysiological dose of IFN-α.
Materials and Methods
Isolation and cultivation of primary hepatocytes
Female Wistar rats, 200–230 g, 3-months-old, were used throughout. The Ethics Committee of the Institute of Molecular Biology and Genetics of the National Academy of Sciences of Ukraine approved the study protocol. The animals were anesthetized with nembutal (40 mg/kg). Heparin (5,000 U) was injected into v. caudata to prevent blood clotting. Hepatocytes were isolated by the collagenase method (Berry, Friend 1969), their purity was evaluated by light microscopy and their viability by trypan blue exclusion. The cells were suspended in Williams E medium supplemented with 10% heat-inactivated fetal calf serum (FCS), 10 nM insulin, 10 nM dexamethasone, 15 mM HEPES buffer, pH 7.4, 50 U penicillin, and 50 μg streptomycin per mL medium. The cells were added to 6 cm culture dishes at 1.8×10⁶ cells/3.0 mL and cultivated in a humidified atmosphere of 5% CO2/air at 37°C. After 3 h, the medium was sequentially replaced by fresh medium for 16 h and for the next 3 and 6 h by the same medium, but without insulin, dexamethasone, and FCS and supplemented either with rat IFN-α, 250 U/mL (Sigma-Aldrich) or without it.
The concentration of IFN-α was chosen on the basis of antiviral activity of the S3 fraction of liver homogenate against vesicular stomatitis virus (VSV). The mean titer of anti-VSV was in the range 1:320–1:640 for the livers at 0.5, 1.0, and 3.0 h after PH and 2–4 times less in intact liver and after 6.0 and 12.0 h after PH. After standardization, the results obtained corresponded to 10,000–20,000 U per g of liver tissue or ∼108 cells (Perepelyuk and others 2006).
DNA microarray analysis
Total RNA was isolated with RNeasy mini kit (Quiagen). RNA quality was assessed by 28S/18S ribosomal RNA signal ratio on Bioanalyzer 2100 (Agilent). Gene expression profiles were assayed with rat genome array 230 2.0 (Affymetrix) using 5 μg of total RNA of each sample as a template for downstream preparation procedures according to the instruction of the manufacturer. The results of microarray were verified by qRT-PCR (see Supplementary Materials; Supplementary Data are available online at
Data preprocessing and normalization
Affymetrix Chip Description Files (CDFs) were used for probe sets-to-genes mapping, Bioconductor's simpleaffy and affyPLM software packages—for quality control of all upstream procedures for cRNA preparation, Bioconductor's affy package—for data preprocessing and normalization. Data preprocessing was performed using the RMA method for background correction, qspline for normalization, PM-only for PM-correction, and medianpolish for probe set summary. Normalization was carried out in 2 steps: first, within the 4 groups of biological replicas, followed by normalization across all microarrays. A custom R script was applied to normalized data to remove from further analysis probe sets with expression values below the max intensities of minimal spike-in controls.
Differential expression analysis
Two-sample t-test (with random variance model) was separately performed for 3 and 6 h control/experiment pairs using BRB-ArrayTools, v3.8.0. Only genes with nominal significance of the univariate test p<0.005 and with at least 2-fold change of gene expression were considered as differentially expressed.
Gene ontology
Functional annotation of differentially expressed genes was performed in the GO general category “Biological Processes” using the Database for Annotation, Visualization, and Integrated Discovery (DAVID), v6.7, at the confidence level 99%.
Search for binding sites for specified transcription factors
The transcription factor binding sites were searched with COTRASIF (Conservation-aided Transcription Binding Sites Finder) available at
Results
Quantitative changes in gene expression profiles
Incubation of primary hepatocytes with IFN-α during 3 and 6 h revealed 28 and 124 genes that were differentially expressed, with 73 genes of these having known functions. No downregulated genes were found (Supplementary Tables S1 and S2). The results of the microarray assay were confirmed with qRT-PCR applied for several selected genes (Spearman's rank correlation coefficient, r s =0.69, p=0.058) (Supplementary Table S3). Complete data of the microarray experiment have been deposited into GEO database under accession number GSE43723.
Functional analysis of differentially expressed genes
All differentially expressed genes were arbitrarily subdivided into 8 groups according to the predominant functions of their products (Table 1). The first group includes mRNAs encoding proteins known to be direct effectors against different pathogens or in disposing of old or unneeded cellular proteins and organelles. Several GTPases are the earliest responders to IFN-α. They display their immune resources by autophagy, vesicular trafficking, and exocytosis. The cell delivers the products enclosed in autophagosome to lysosomes for hydrolysis. The final peptides are used for presentation on MHC complexes and for the synthesis of currently required proteins (Martens and Howard 2006; Deretic 2012). The products of the other members of this group may impair virus budding (Rsad2) (Wang and others 2007) and hydrolyze 5′ pppssRNA from 3′ end (Isg20) (Espert and others 2003).
Selected from a total of 128 genes altering expression by 2-fold or more. The complete table with gene ontology is available in Supplementary Table S4. Analysis was performed as described in Materials and Methods section.
Aliases are provided for some genes, which are better known by a name no longer used by the HUGO Gene Nomenclature Committee.
Consistent with these changes 2 genes encode proteins inhibiting translation. Early upregulated interferon induced protein with tetratricopeptide repeats 2 (Ifit2) inhibits the ability of eukaryotic initiation factor 3 to stabilize the eIF-GTP-Met-tRNA ternary complex and the formation of 48 S preinitiation complex (Terenzi and others 2006). Later, upregulated eukaryotic translation initiation factor 2-alpha kinase 2 (Eif2ak2) phosphorylates EIF2α, resulting in sequestration of the limiting guanine nucleotide exchange factor EIF2β, inhibition of translation, and the shift of conventional 5′ cap-dependent translation to that dependent on internal ribosome-specific sites in distinctive set of mRNAs (eg, XIAP) (Sadler and Williams 2008).
The same sequential enzymatic reactions catalyzed by E1 (activating enzyme), E2 (conjugating enzyme), and E3 (ligating enzyme) provide protein modifications by ISG15 and ubiquitin (Ub) (Ciechanover 2005; Zhang and Zhang 2011). The differentially expressed genes encode ISG15, E1 enzyme Uba7, Ub-specific protease 18 (USP18), and several E3 ligases. The latter are represented by the members of tripartite motif family (Trim6, Trim21, and Trim25) (Ozato and others 2008); HECT domain family with its subfamilies HERC (Herc3 and Herc6) and Nedd4 (N4bp1); and the family of
Three genes coding for poly (ADP-ribose) polymerases (Parp9, Parp12, and Parp14) are provisionally classified in this group due to their potential ability to modify proteins. Each of them contains a typical catalytic PARP domain at the C-terminus. Unlike the well-studied PARP1, the majority of biochemical characteristics of these 3 PARPs have not yet been investigated (Amé and others 2004).
The next group includes genes related to the transcription machinery. Interferon regulated factor-1 (Irf1) binds to a consensus sequence, which is very similar to the interferon-stimulated response element [ISRE] (Frontini and others 2009). IRF7 organizes with IFN-α the positive regulatory feedback (Ning and others 2011). Both STAT1 and STAT2 may associate with IRF9 forming a transcription factor ISGF3, which binds to the ISRE and regulates transcription of ISGs (Platanias 2005). Three coactivators for nuclear receptors, Pric 285, Ncoa7, and Sp110, activate transcription mediated by peroxisomal proliferator-activated receptor alpha (PPARα) (Surapureddi and others 2002), estrogen receptor (ER) (Shao and others 2002), and retinoic acid receptor (RAR) (Bloch and others 2000), respectively. Other responders serve as coactivators for STAT5 and NFkB-mediated transcription (Cenpj) (Peng and others 2002; Koyanagi 2004) and ATF-mediated transcription (Ifi35) (Wang and others 1996) and as negative regulators: corepressor for a diverse profile of transcription factors (Tle4) (Jennings and Ish-Horowicz 2008), inhibitors restricted to MYB- and JUN-dependent transcription (Rgcd1) (Haas and others 2004), and to methyl CpG-binding protein 1-mediated transcription (Oasl) (Andersen and others 2004). The Lim domain only (Lmo2) factor due to its 2 transcription activating and 2 transcription inhibiting domains may form functionally different DNA-binding complexes (Han and others 2005).
Several genes are responsible for “communication” of hepatocytes with non-parenchymal cells. The Psb9 gene encodes β1i – one of the 3 catalytic subunits of immunoproteasome. Unlike standard proteasome, an immunoproteasome enhances antigen presentation and generates a different spectrum of peptides that specifically activate T cells (Sijts and Kloetzel 2011). The transporter associated with antigen processing (Tap) pumps the peptides degraded in the proteasome across the membrane of the endoplasmic reticulum where the class I MHC molecules assemble to present the antigens to nonparenchymal cells (Sijts and Kloetzel 2011). The genes Cxcl10 and Cxcl11 encode chemokine ligands. Both interact with the ubiquitous cell surface chemokine receptor CXCR3, attract monocytes/macrophages, T cells, NK cells, and dendritic cells to sinusoidal endothelial cells, and promote T cell adhesion (Groom and Luster 2011). One gene encodes the programmed cell death 1
The genes of the next group encode the enzymes of nucleic acid processing and metabolism. RNA-specific adenosine deaminase (Adar) converts adenosine to inosine in double-stranded RNA, interacts with stress granules formed as a result of temporal translation inhibition, and is crucial for cell survival (Weissbach and Scadden 2012). Moloney leukemia virus 10 protein (Mov10) is a RNA helicase, localized to mRNA-degrading cytoplasmic P bodies and required for miRNA-mediated gene silencing and RNA cleavage (Meister and others 2005). Oligo (A) synthetases (Oas1i, Oas1a) indirectly promote RNA degradation through the synthesis of oligoadenylates and activation of the latent RNAse L (Sadler and Williams 2008). The proteins encoded by 5′-nucleotidase, cytosolic III (Nt5C3) and
Distinct mRNAs encode the sensors of dsRNAs and regulators of signaling pathways. The ATP-dependent helicases, retinoid-inducible gene (Rig1) and melanoma differentiation-associated gene 5 (Mda5), recognize viral RNAs and are induced by IFN-α. Being activated they trigger formation of the mitochondrial antiviral signaling (MAVS) complex, which eventually transmits the signal to transcription factors IRF3, IRF7, and NF-kB via TANK-binding kinase 1 (TBK1) (Loo and Gale 2011). Two mRNAs encode IFN-induced protein with tetratricopeptide repeats 3 (Ifit3) and DEAD box polypeptide 60 (Ddx60), which activate the signal transmission from MAVS to TBK1 while Lgp2 and Trafd1 products specifically inhibit RIG1 and its pathway and prevent excessive tissue damage (Sanada and others 2008; Loo and Gale 2011). OAS1i and OAS1a can also recognize double-stranded RNA and they indirectly promote RNA degradation (Sadler and Williams 2008). Another member of the group, inositol polyphosphate-1-phosphatase (Inpp1), may directly affect phosphatidylinositol signaling.
IFN-α affects the structure of the cell surface and the cytoskeleton by upregulating ezrin (Ezr), an intermediate between the plasma membrane and the actin cytoskeleton, and 2′, 3′-cyclic nucleotide 3′ phosphodiesterase (Cnp) possessing microtubule-associated protein-like activity (Irving and others 2012).
The presentation of the main mechanisms of activity encoded by the specified genes does not cover all their resources. Most of the genes are engaged in multiple biological processes according to GO classification (Supplementary Table S4).
Involvement of IFN-α-specific signaling pathways in regulation of differentially expressed genes
The intracellular transduction of the IFN-α signal may occur along several signaling pathways. The Jak/STAT/ISGF3 pathway operates via ISGF3 transcription factor; JAK/STAT via homo- and heterodimers of STAT1 and STAT3-STAT6; PI3K/AKT via NF-kB; and p38/MAPK via various transcription factors (CREB, C/EBP, MAX/MYC, ELK1, SP1, MEF2a, NFAT, ATF, p53, HBP1, and NF-kB) (Platanias 2005). All the genes encoding these transcription factors were either differentially expressed or expressed at considerable levels. We have analyzed the promoters of differentially expressed genes for the presence of binding sites to respective transcription factors. Genes with binding sites for ISGF3 were maximally overrepresented followed by those with binding sites for IRF1 (Table 2). The enrichment of binding sites for NF-κB, MAX/MYC, and NFAT argue for the activation of PI3K/AKT and p38/MAPK pathways while enrichment for STAT4-binding sites suggest the activation of JAK/STAT pathway operating via canonical STAT dimers (Platanias 2005). Our data indicate that STAT4 may be important for the transduction of the IFN-α signal in hepatocytes and define its potential targets (Adamson and others 2009). The distribution of the above-mentioned binding sites within promoters of differentially expressed genes and the prevalence of binding sites for other transcription factors are summarized in the Supplementary Tables S5 and S6.
K: coefficient of overrepresentation,
IFN, interferon; STAT, signal transducing and activator factor; IRF, interferon regulatory factor; NFAT, nuclear factor of activated T cells.
Discussion
In this study, we characterized the response of primary hepatocytes from intact liver to IFN-α at levels that were previously recorded after liver resection. The early upregulated expression, specific antiviral activity, and activated intracellular IFN-α signaling were recently discovered in regenerating rat liver (Perepelyuk and others 2006; Han and others 2007; Perepelyuk and others 2009; Chen and others 2010) against a background of different other manifestations of the innate immune response (Markiewski and others 2006; Riehle and others 2011; Hosoya and others 2013). To approach the problem we mimicked in vitro the quantitative and temporal local levels of IFN-α after PH and delineate the response of primary hepatocytes to such treatment. The analysis of gene expression profiles after 3- and 6-h incubation revealed 24 and 128 differentially expressed upregulated genes, a smaller number than that induced by longer treatment with higher doses of IFN-α, but only partly overlapping with them. In total, they differ in that the response is smaller in magnitude, there is a simultaneous expression of activators and inhibitors of transcription and intracellular signaling, coregulators of transcription factors are involved, in addition to several specific modifiers of proteins (eg, Trafd1, Xiap, Tle4, and Pdcd1lg2) (Lanford and others 2006). The response is cell specific (de Veer and others 2001; Zocco and others 2006) and temporally regulated.
The differentially expressed genes enter the process in a definite sequence (Fig. 1). At the early stage it seems that the cells exploit the strategic advantage of the energy saving principle by using available resources and protein changes to get the fastest response: autophagy to eliminate unneeded cellular materials; reversible ISGylation of preexisting proteins exceeding other types of protein modification; partial inhibition of the energy consuming translation; coactivation of preexisting nuclear receptors to provide faster changes in gene expression in comparison with other transcription factors acting as target proteins of slower responding signaling cascades; switching the mitochondrial dNTP synthesis to the salvage pathway, and finally, the “insistent appeal” to other hepatic cells for their involvement in the process.
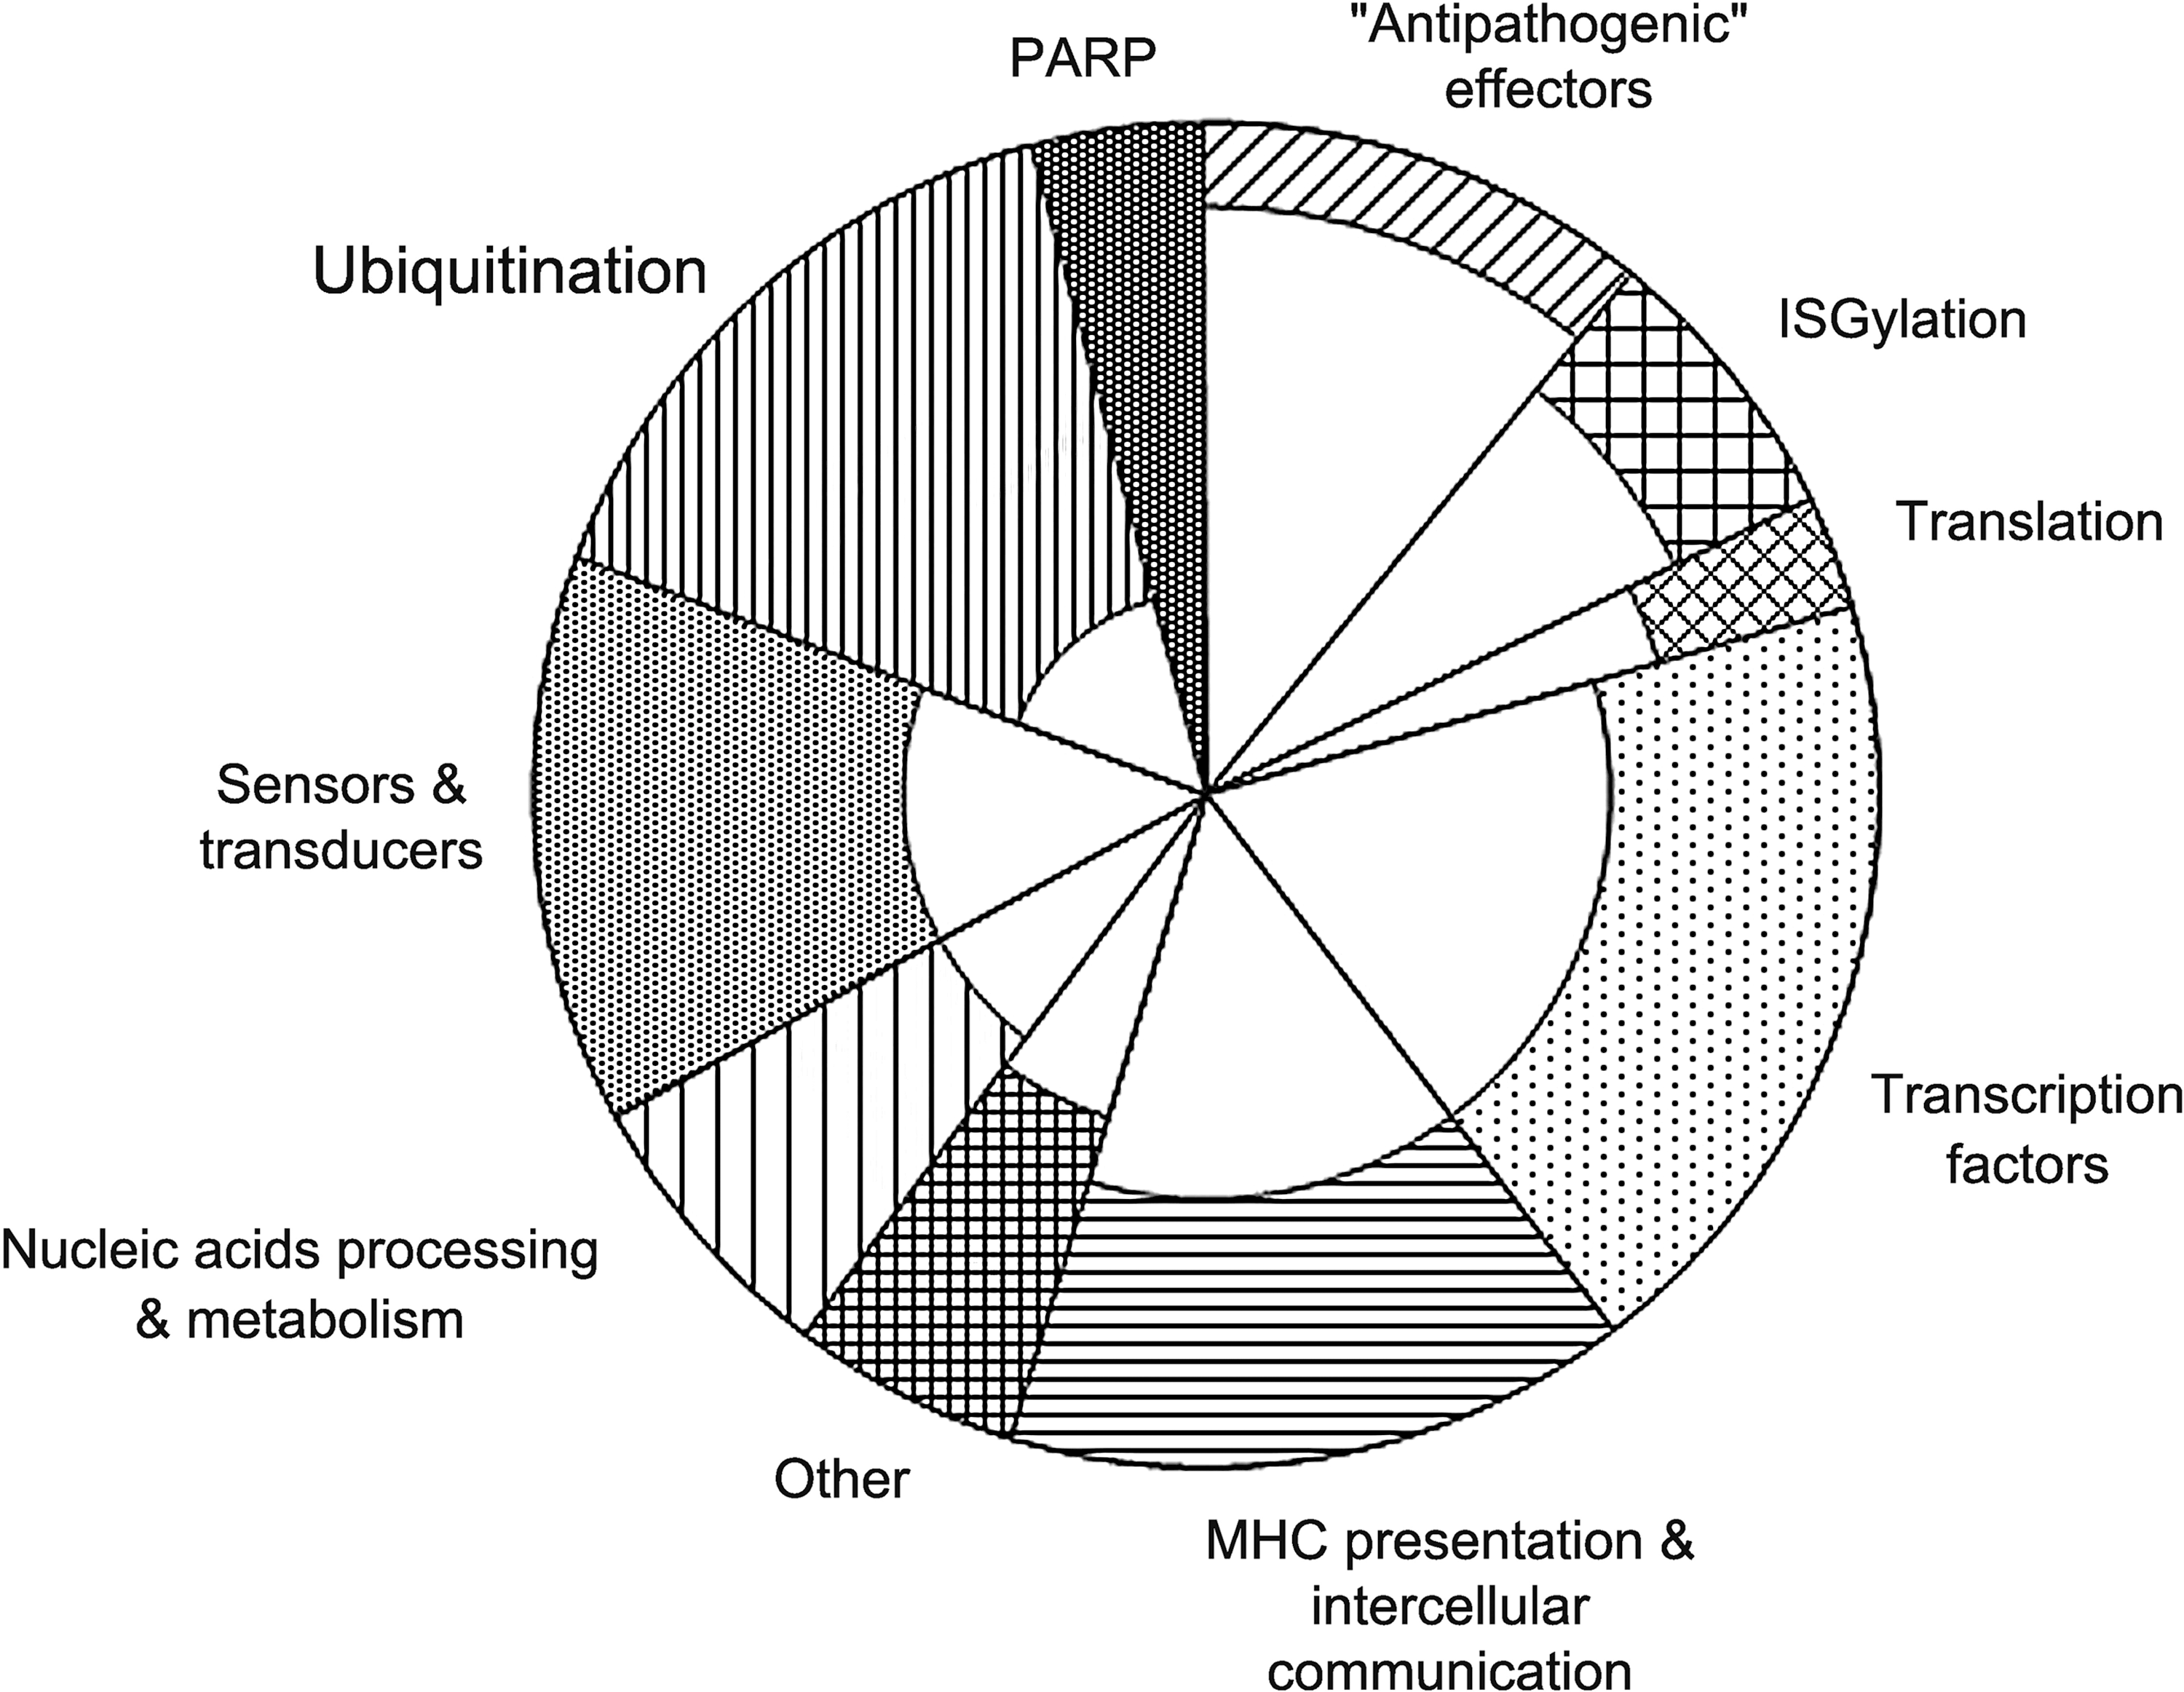
Time-dependent response of differentially expressed genes to interferon (IFN)-α. The square of the large sectors (shaded plus unshaded parts) is proportional to the number of differentially expressed genes after 6 h of treatment of hepatocytes with IFN-α and the square of the inner unshaded sectors — to the number of upregulated genes after 3 h treatment.
The further development of the response is associated with a more intensive nuclear control of gene expression via upregulated STAT1, STAT2, and IRF9 against the background of activated preexisting JAK/STAT, PI3K/AKT, and p38/MAPK pathways (see Table 2); enlargement of the list of differentially expressed genes and increasing the response of previously expressed genes (in most cases) and involving restraining factors. The simultaneous expression of proinflammatory and restraining factors seems to be a distinguishing feature of the hepatocyte response to a specified IFN-α impact. The propagation of IFN-α signaling via activated transmission from MAVS to TBK1 may be opposed by inhibition of RIG1 and its pathway; T cell activation by CXC ligands and MHC complexes — by T cell inhibition via negative coreceptor PD-1; initiator caspase 8 — by the most potent cellular inhibitor of apoptosis, XIAP. Thus, the realization of protein activities encoded by differentially expressed genes would affect all regulatory levels of gene expression and provide a time-dependent and strictly balanced response. More detailed molecular mechanisms of the entire response are as yet poorly understood.
Below, we present the available facts either confirming the involvement of several genes that in vitro respond to IFN-α or arguing in favor of their potential participation in liver restoration. The transition period from quiescence to proliferation has not been systematically studied from this point of view The energy saving principle may be a crucial element during the transition period as ATP levels in remnant liver markedly and rapidly decrease immediately after PH though it is not clear, so far, that the ATP loss may have more to do with a regulatory response (purinergic stimulation) than with the lack of available energy to drive the process (Crumm and others 2008). Not much is known about the driving force. The accumulation of autophagosomes, activated lysosome proteolysis, and upregulated Mx1 and Mx2 expression in hepatocytes were observed at the earliest hours (2–6 h) after PH, while at the next stages, when the proliferation is in progress, the number of autophagosomes gradually decreases (Becker and Lane 1965; Watanabe and others 1998; Xu and others 2010). Previously, autophagy was considered the earliest compensatory reaction for the energy deficit induced by liver resection (Becker and Lane 1965). Now the biological role of autophagy has expanded to include multiple homeostatic functions and interactions with nearly all parts of the immune system (Deretic 2012). Its role at the beginning of regeneration remains poorly investigated from this new perspective.
The number and profile of translated proteins presumably also changes as the expression of classical ISG - Eif2ak2 mRNA in hepatocytes steadily rises and the Eif2ak2 protein transitorily concentrates in the cytoplasm in the period of 1–3 h after PH being equally distributed between the nucleus and the cytoplasm in the hepatocytes of intact liver and after 6 and 12 h post-PH (Perepelyuk and others 2009). There is evidence for an elevated concentration of caspase 8 protein and mRNA in hepatocytes of regenerating liver, even at the beginning of the restoration process (Xu and others 2007; Zorde-Khvalevsky and others 2009). The hepatocyte-specific knockout of this gene delays proliferation after PH and points to the importance of caspase 8 for liver restoration (Ben Moshe and others 2007).
Along the time course of liver regeneration the transcription profiles of IFN-signaling pathway genes were detected in each liver cell type. The IFN-α-mediated JAK/STAT pathway genes, including Irf9, Stat1, and Stat2 and 2 genes from the ATF family, Atf2 and Atf4, together with Ifn-α itself were upregulated in hepatocytes (Han and others 2007; Chen and others 2010). Another class of transcription factors, the nuclear receptors and their ligands, are among the earliest responders to PH (Vacca and others 2013). The most studied are ERα, which in 1 h after resection translocates from cytoplasm to the nucleus (Fisher and others 1984; Francavilla and others 1984); PPARα, which regulates energy homeostasis, cell cycle, and cytokine signaling; and retinoic acid receptor/retinoid X receptor (RAR/RXR) heterodimer. Mice with these genes knocked out show a substantial delay in liver regeneration (Dupont and others 2000; Anderson and others 2002; Yang and others 2010; Vacca and others 2013). The same is true for a deficiency of STAT5 and NF-κB transcription factors, which also impedes proliferation (Cui and others 2007). The coactivators to each of these transcription factors were upregulated in our experiment, but their regulatory role, if any, in regenerating liver remains to be further investigated.
At this time, there are few examples of Ub-dependent degradation of the proteins after PH. Two E3 ubiquitin ligases, damaged DNA-binding protein 1 (DDB1), and SCF(beta-TrCP) complex consisting of Skp1, Cul1 and the F-box protein β-TRCP, direct the inhibitors of cyclins and cyclin-dependent kinases to proteasomes, while gene p28GANK coding for one subunit of the 26S proteasome is upregulated. Inactivation of these genes prevents DNA synthesis (Qin and others 2003; Sekiya and Suzuki 2011; Endo and others 2012). Our own data on ISGylation in regenerating liver give evidence in support of upregulated expression of activating enzyme Uba7 and ligase Trim 25 in liver tissue (unpublished data).
The sequestration and degradation of RNA in processing bodies and stress granules is a new field and we have not found any data in the literature concerning their role in liver regeneration. But it is known that miRNAs are potent regulators of these processes and their profile substantially changes in regenerating liver. Inhibition of the formation of specific miRNA species disables DNA synthesis after PH (Song and others 2010; Chaveles and others 2012; Ng and others 2012). The elucidation of miRNAs targets in the regenerating liver is still ahead.
The activation of the mitochondrial salvage pathway of pyrimidine nucleotides synthesis via cytosolic 5′-nucleotidase is exploited by the liver after PH presumably to meet the requirements of early mtDNA synthesis, which precedes the nuclear one and occurs during transition period (Tjernshaugen and Frizson 1974; Koyama and others 1998). The substantially upregulated expression of 3′→5′ DNA exonuclease in the liver is required for its proper regeneration (Tubo and Berezney 1987).
Various immune mechanisms control liver regeneration (Markiewski and others 2006; Hosoya and others 2013). The activation of genes related to class I MHC presentation in the hepatocyte response to IFN-α correlates with their activated expression after PH. The impairment of MHC class I complex by β2 microglobulin deletion is incompatible with proliferation (Radošević-Stašić and others 1996; Fouzas and others 2008).
Therefore, there is a formal resemblance between the hepatocyte response to IFN-α and the early manifestations after PH, but whether the latter are induced in vivo by IFN-α is an open question that requires a more in-depth study. All data on comparison of both responses are summarized in Table 3.
“h” and “t” designate hepatocytes and liver tissue used for the study. Erα, estrogen receptor alpha gene; Pparα, peroxisomal proliferator-activated receptor alpha gene; Rar/Rxr, retinoic acid receptor/retinoid X receptor gene; Ddb, DNA damaged-binding protein gene; B2m, β2 – microglobulin gene. See details with corresponding references in Discussion section.
We are far from being able to transfer the results of in vitro experiments to the in vivo situation after PH, as far as apparent discrepancies between these conditions exist. First of all, our experiment were done with quiescent hepatocytes in isolation, and thus in the absence of any influence from the liver microenvironment, its cytokines, and signaling molecules released by non-parenchymal cells. In vivo, the liver microenvironment could potentially alter the magnitude and the timing of gene expression changes that occur in vitro. Also, it is known that the different environment of hepatocytes in culture changes their gene expression profile, depending on the extracellular matrix conditions, for example, whether they are plated on a stiff collagen layer or on a soft, gel-like collagen layer or even in a sandwich format (Klingmuller and others 2006). The absence of STAT3 in the set of differentially expressed genes after IFN-α treatment contradicts its upregulated expression after PH where it plays a pivotal role (Chen and others 2010; Wang and others 2010). It is interesting that Stat3 was among the responders to IFN-α in chimpanzee hepatocytes (Lanford and others 2006). The formal resemblance between the expression of a limited number of genes in our experiment and the processes activated during the transition period after PH is not sufficient to consider IFN-α as a candidate regulator at this stage of liver restoration, but it offers a challenge for a more in-depth study. The list of differentially expressed genes presented here characterizes a tightly balanced fine-tuned and time-dependent hepatocyte response to IFN-α levels recorded after PH and gives a possible cue to elucidating its place in the context of liver restoration.
Footnotes
Acknowledgments
We thank Professor Jan Hoek (Thomas Jefferson University) for helpful comments on this article and PhD student Ruslan Rodriguez (Institute of Molecular Biology and Genetics NAS of Ukraine) for making ![]() . This work was supported by the Science and Technology Center of Ukraine (Project No. 4381, 2006; M.O., A.K., B.T.), UNESCO fellowships (A.K., 2009; B.T., 2008), and by the National Academy of Sciences of Ukraine (Project No. 2.2.4.18, 2009–2011, M.O, A.K., B.T.).
. This work was supported by the Science and Technology Center of Ukraine (Project No. 4381, 2006; M.O., A.K., B.T.), UNESCO fellowships (A.K., 2009; B.T., 2008), and by the National Academy of Sciences of Ukraine (Project No. 2.2.4.18, 2009–2011, M.O, A.K., B.T.).
Author Disclosure Statement
All authors declare that no competing financial interests exist.