
Abstract
Type I interferon receptor (IFNAR) has been involved in the progression of chronic hepatitis B (CHB). Oxidative stress is also associated with hepatitis B virus (HBV) infection and might contribute to the structure and function of protein synthesis including the IFNAR family. This study was aimed to determine the possible associations between oxidative stress and peripheral IFNAR expression in chronic HBV infection. Fifty-four CHB patients and 31 liver cirrhosis (LC) patients were consecutively collected, as well as 11 healthy subjects as controls. Expression levels of IFNAR1 and IFNAR2 in peripheral blood lymphocytes and monocytes were measured by flow cytometry. IFNAR1 and IFNAR2c mRNA were detected by real-time reverse transcription–polymerase chain reaction. Levels of plasma-soluble IFNAR and oxidative stress parameters, including xanthine oxidase (XOD), malondialdehyde (MDA), glutathione (GSH), glutathione S-transferase (GST), and glutathione peroxidase (GSH-Px) were detected by enzyme linked immunosorbent assay (ELISA). The frequencies of IFNAR1 and IFNAR2 in lymphocytes and monocytes were significantly increased in CHB and LC patients than in healthy controls. Expression levels of IFNAR1 and IFNAR2c mRNA and plasma-soluble IFNAR level in CHB and LC patients were upregulated compared with healthy controls. Mean fluorescence intensity (MFI) of IFNAR2 in monocytes of CHB patients was higher than that in LC patients. Levels of plasma XOD, MDA, and GST were significantly increased in CHB and LC patients compared with healthy controls. Meanwhile, GSH and GSH-Px in CHB and LC patients were decreased than that in healthy controls. Furthermore, plasma MDA, GSH, and GST levels in CHB patients were higher than that in LC patients. In CHB patients, plasma GST level was negatively correlated with MFI of IFNAR2 in lymphocytes. Our results suggested that oxidative stress play an important role in the regulation of IFNAR in chronic HBV infection.
Introduction
Type I interferons (IFNs) are effective in suppressing HBV replication and have been commonly approved for the treatment of HBV for several years. In general, the anti-HBV activity of type I IFNs is always mediated through the binding to their unique receptors in a targeted cell member (Novick and others 1994). After the binding of IFNs to the type I IFN receptor (IFNAR), receptor-associated Janus family tyrosine kinases-signal transducer and activator of transcription family of proteins (JAK/STAT) signal pathway were activated to stimulate the target cells to ultimately produce an anti-virus protein (Jiang and Tang 2010). Cell-surface IFNAR (de Weerd and others 2007) consists of 2 major subunits: IFNAR1 (Novick and others 1994) and IFNAR2 (Pfeffer and others 1997; Langer 2007). IFNAR2 is divided into 3 forms: IFNAR2a (soluble form), IFNAR2b (short form), and IFNAR2c (long form). IFNAR2c always stimulate the signaling protein, while IFNAR2a and IFNAR2b usually take the reverse (Taniguchi and others 2007). There is another soluble form that has been first cloned by Daniela Novick (Novick and others 1995), which is always reported to be a protein inhibitory factor of IFNAR (Mizukoshi and others 1999). We previously reported (Meng and others 2011) that IFNAR1 and IFNAR2 in lymphocytes and monocytes increased in chronic hepatitis B (CHB) patients and peripheral mRNA level of IFNAR correlated with the antiviral outcome in the treatment of CHB with IFN-α. However, the exact mechanism for the regulation of IFNAR in HBV infection has not been well demonstrated. Recent studies (Gregersen and Bross 2010; Nakamura and Lipton 2011) demonstrated that oxidative stress could modulate protein misfolding and then interrupt the biological conformation of protein. Therefore, oxidative stress may influence the functions of IFNAR.
Previous studies (Demirdag and others 2003; Bolukbas and others 2005; Lin and others 2011) reported that oxidative stress was increased in various clinical forms of HBV infection and it was involved in the induction and progression of CHB (Acar and others 2009; Tasdelen Fisgin and others 2012). In addition to lipid and DNA, proteins are the most abundant biomolecules targeted for oxidative modification upon oxidative stress (Halliwell and Whiteman 2004; Kästle and others 2012). In contrast to the other protein modification, such as formation of methionine sulfoxide (MetO), protein carbonyls are the irreversible products of oxidative protein modification. Thus, proteins containing protein carbonyls have to be degraded by the proteasome to maintain the cellular protein homeostasis (Shang and Taylor 2011). Oxidative modification of proteins in vivo may affect a variety of cellular functions involving proteins: receptors, signal transduction mechanisms, transport systems, and enzymes. Moreover, the accumulation of ROS in hepatocytes may lead to the activation of Kupffer cells, which could activate, produce, and secrete cytokines, such as tumor necrosis factor-α and interleukin-1 (Koike and others 2007; Muriel 2009). These cytokines can increase ROS and play critical roles in hepatic injury (García-Trevijano and others 1999). Finally, continued oxidative stress could cause chronic inflammation and induce hepatocytes damage in viral hepatitis.
To gain more insights into the possible association between oxidative stress and peripheral IFNAR expression in HBV infection, we determined the expression of IFNAR in lymphocytes and monocytes and mRNA level of IFNAR1 and IFNAR2c in peripheral blood mononuclear cells (PBMCs). Plasma level of soluble IFNAR and oxidative stress parameters that could reflect the oxidative stress status in CHB patients were also detected.
Materials and Methods
Patients
Fifty-four CHB patients and 31 HBV-associated decompensated LC patients were consecutively included from May 2011 to January 2012 in the Department of Hepatology, Qilu Hospital of Shandong University, in this present study. CHB patients were fulfilled the 2009 AASLD practice guidelines (Lok and McMahon 2009) and hepatitis B surface antigen (HBsAg) positive for at least 6 months. Decompensated LC patients were fulfilled the guideline of LC (Schuppan and Afdhal 2008) and the following criteria: (1) chronic HBV infection for at least 6 months; (2) obvious symptoms of liver damage, such as hepatic facies, spider nevus, and liver palms; (3) ascites, variceal bleeding, hepatic encephalopathy, and/or jaundice; (4) LC demonstrated by iconography. The grading of hepatic encephalopathy was based on the grading criteria of hepatic encephalopathy practice guidelines (Ferenci and others 2002). The duration history of chronic HBV infection in LC patients ranged 1–25 years. No patients received IFN, lamivudine, adefovir, or any other ant-HBV nucleoside/nucleotide analogue treatment during 6 months before blood collection. Subjects with the following conditions were also excluded: coinfection with hepatitis C virus, hepatitis D virus, or human immunodeficiency virus; severe uncontrolled hypertension; autoimmune diseases; acute or chronic inflammation; and alcohol abuse. Eleven healthy controls were from the Medical College of Shandong University. The study was carried out in accordance with the declaration of Helsinki (World Medical Association, Inc., 2009), and informed consent was obtained from all the patients before donation.
Sample collection
Blood samples were obtained by venipuncture at 7 a.m. into vacuum tubes containing ethylene diamine tetraacetic acid (EDTA) as the anticoagulant for PBMCs and plasma isolation. Plasma for soluble IFNAR and parameters of oxidative stress [xanthine oxidase (XOD), malondialdehyde (MDA), glutathione (GSH), glutathione S-transferase (GST), and glutathione peroxidase (GSH-Px)] was isolated by centrifugation and stores at −80°C until assayed. PBMCs were isolated by Ficoll-Paque (GE Healthcare) density gradient centrifugation (Lostia and others 2009).
Reverse transcription–polymerase chain reaction for the quantitation of IFNAR1 and IFNAR2c mRNA in PBMCs
RNA was extracted from PBMCs (106–107 cells) using the TRIzol Reagent (Invitrogen). cDNA was produced from 1 μg of total RNA by RevertAid™ First Strand cDNA Synthesis Kit (Fermentas). Quantitative reverse transcription–polymerase chain reaction (RT-PCR) was performed with SYBR@ Premix Ex Taq™ (Takara) and carried on Lightcycler (Roche Diagnostics). The 20 μL PCR solution contained 1 μL cDNA, 0.4 μM specific primers, 10 μL SYBR Green premix, and 8.2 μL ddH2O. The reaction condition of PCR was 95°C for 30 s, 45 cycles of 95°C for 5 s, 60°C for 30 s, and 72°C for 30 s, 65°C for 15 s, and 40°C for 30 s. The primers used for IFNAR1 and IFNAR2c have been reported previously (Taniguchi and others 2007) and those of IFNAR1, IFNAR2c, and β-actin (Fermentas) are described as follows: IFNAR1-Forward: AAA GCC AGA GCA CAC ACC AT; IFNAR1-Reverse: GTC CTG CTG TAG TTC TTC AC; IFNAR2c-Forward: ACA AGT GGC GGT GGC TAT AC; IFNAR2c-Reverse: TGG GAA AGG TTG GCT GTG TC; β-actin-Forward: GGG AAA TCG TGC GTG ACT TAA G; β-actin-Reverse: TGT GTT GGC GTA CAG GTC TTT G. β-actin was used to normalize the samples in each PCR. The expression of IFNAR1 mRNA and IFNAR2c mRNA was calculated as a ratio to that of β-actin in PBMCs to determine the relative level of expression. The absence of nonspecific primer–dimer products was demonstrated with melting curve and gel migration analyses. The LightCycler Software 4.0 (Roche Diagnostics, Germany) was used to calculate a threshold cycle (Ct) value and to analyze data.
Flow cytometric analysis of IFNAR1 and IFNAR2
After the removement of plasma components by centrifugation, packed cells were obtained. About 100 μL of packed cells (nearly 5×10⁵ cells) were transferred to a 5-mL tube for flow cytometry (FCM) and incubated with 10 μL monoclonal antibody [phycoerythrin (PE)-conjugated mouse monoclonal anti-human IFNα/βR1: catalog Number FAB45P, R&D Systems, or R-PE-conjugated mouse monoclonal against human IFNα/βR2: product Number 21385-3, PBL Biomedical Laboratory] for 30–45 min (IFNα/βR1 monoclonal antibody incubated at 2°C–8°C; IFNα/βR1 monoclonal antibody incubated at room temperature). Following the incubation, the cells were lysed by the red blood cell (RBC) lysis buffer (R&D Systems Whole Blood Lysing Kit; R&D Systems). Finally, the cells were resuspended in 100–200 μL of the phosphate-buffered saline (PBS) for the final flow cytometric analysis after washing the cells twice or third in 2 mL of the wash buffer (R&D Systems Whole Blood Lysing Kit; R&D Systems). As a control for analysis, cells in another 2 tubes were treated separately with a PE-labeled mouse IgG1 antibody (catalog Number IC002P; R&D Systems) and a PE-labeled mouse IgG2a antibody (catalog Number IC003P; R&D Systems). The cells were analyzed using a FACS Calibur (BD Bioscience, PharMingen) to measure light scatter and PE fluorescence.
ELISA for the measurement of soluble IFNAR, XOD, MDA, GSH, GST, and GSH-Px in plasma
Soluble IFNAR in the circulation was determined by human soluble IFNAR enzyme linked immunosorbent assay (ELISA) kit (1138–50; Groundwork Biotechnology Diagnosticate Ltd.) according to the protocol. OXISelect™ MDA Adduct ELISA kit (Cell Biolabs, Inc.), XOD ELISA kit (E14896h; Wuhan EIAb Science Co., Ltd.), GSH ELISA kit (E0294h; Wuhan EIAb Science Co., Ltd.), GST ELISA kit (E1089h; Wuhan EIAb Science Co., Ltd.), and GSH-Px ELISA kit (E0295h; Wuhan EIAb Science Co., Ltd.) were employed, and standard protocols provided by the manufacturer were exactly followed.
Clinical and laboratory parameters
Aminotransferases (ALT and AST), γ-glutamyl transpeptidase (GGT), alkaline phosphatase (AKP), total bilirubin (TBIL), serum HBV DNA level, blood urea nitrogen (BUN), creatine (Cr), prothrombin time (PT), prothrombin activity (PTA), prothrombin-international normalized ratio (PT-INR), activated partial thromboplastin time (APTT), and serum sodium (Na) were determined using standard laboratory methods by clinical laboratory in Qilu Hospital of Shandong University. The serum viral load of HBV DNA was quantified by RT-PCR. When the serum viral load of HBV DNA is less than 1,000 copies/mL, it is recognized as negative.
Statistical analysis
Data were analyzed by SPSS 17 software (SPSS, Inc.). Results were expressed as the mean±standard deviation. Comparison between groups was analyzed by 1-way analysis of variance. The statistical significance of correlation was determined by the Pearson test. All statistical analyses were two-sided, and P value<0.05 was considered statistically significant.
Results
Clinical characteristics of all the subjects included in the study
The clinical characteristics of CHB patients, LC patients, and healthy controls are shown in Table 1. In decompensated LC patients, there were 26 patients with ascites, 2 patients with variceal bleeding, 4 patients with hepatic encephalopathy (1 patient in grade 1 and 3 patients in grade 2), and 16 patients with jaundices. There were no significant differences in gender between CHB patients, LC patients, and healthy controls. However, the age of LC patients was higher than that of CHB patients and healthy controls. Significant differences were found in ALT, AST, GGT, AKP, TBIL, and ALB levels between CHB patients, LC patients, and healthy controls. Serum PT level was higher in LC patients than that in healthy controls. Serum PTA level was lower in LC patients than that in healthy controls. Serum ALT, GGT, ALB, PTA, and Na levels were higher in CHB patients compared with LC patients (P=0.001, P<0.001, P<0.001, respectively). Furthermore, PT and PT-INR were lower in CHB patients than that in LC patients (P<0.001 and P<0.001).
P<0.05, CHB patients compared with LC patients.
P<0.05, patient group compared with healthy controls.
CHB, chronic hepatitis B; LC, liver cirrhosis; HC, healthy controls; NA, not available; N, number of patients; HBV, hepatitis B virus; ALT and AST, aminotransferases; GGT, γ-glutamyl transpeptidase; AKP, alkaline phosphatase; TBIL, total bilirubin; BUN, blood urea nitrogen; Cr, creatine; PT, prothrombin time; PTA, prothrombin activity; PT-INR, prothrombin-international normalized ratio; APTT, activated partial thromboplastin time.
Expression of IFNAR1 and IFNAR2 in lymphocytes and monocytes of CHB and LC patients
We detected the expression of IFNAR1 and IFNAR2 in lymphocytes and monocytes of CHB and LC patients using FCM (Fig. 1). We found that IFNAR1 and IFNAR2 expression in lymphocytes of CHB and LC patients upregulated [IFNAR1, CHB 4.08%±1.44%, LC 4.52%±1.38%, healthy controls 1.97%±0.78%, P<0.05 (Fig. 1A); IFNAR2, CHB 81.26%±10.83%, LC 85.63%±11.35%, healthy controls 38.22%±8.20%, P<0.05 (Fig. 1B)] Meanwhile, IFNAR1 and IFNAR2 expression levels in monocytes of CHB and LC patients were increased compared with healthy controls [IFNAR1, CHB 10.98%±4.47%, LC 12.07%±5.22%, healthy controls 6.71%±2.16%, P<0.05 (Fig. 1C); IFNAR2, CHB 13.48%±5.24%, LC 14.78%±5.99%, healthy controls 7.73%±2.02%, P<0.05 (Fig. 1D)]. The mean fluorescence intensity (MFI) of IFNAR1 and IFNAR2 in monocytes from CHB and LC patients increased; meanwhile, those in lymphocytes showed increment too [MFI of IFNAR1 in lymphocytes: CHB 3.53±0.99, LC 4.14±2.03, healthy controls 2.48±1.19, P<0.05 (Fig. 1E); MFI of IFNAR2 in lymphocytes: CHB 22.5±5.48, LC 23.50±6.88, healthy controls 9.41±2.36, P<0.05 (Fig. 1F); MFI of IFNAR1 in monocytes: CHB 35.35±13.11, LC 36.72±14.42, healthy controls 13.18±4.24, P<0.05 (Fig. 1G); MFI of IFNAR2 in monocytes: CHB 51.61±16.79; LC 41.38±15.46, healthy controls 23.66±7.71, P<0.05 (Fig. 1H)]. We observed that the frequency of IFNAR1 in lymphocytes has almost no difference between CHB and LC patients (4.08%±1.44% versus 4.52%±1.38%, P>0.05) (Fig. 1A). Meanwhile, the frequency of IFNAR1 in monocytes in CHB patients was not significant different from that in LC patients (10.98%±4.47% versus 12.07%±5.22%, P>0.05) (Fig. 1C). There was no significant difference of the IFNAR2 frequency in lymphocytes between CHB and LC patients (81.26%±10.83% versus 85.63%±11.35%, P>0.05) (Fig. 1B). The frequency of IFNAR2 in monocytes has not been obviously different between CHB and LC patients (13.48%±5.24% versus 14.78%±5.99%, P>0.05) (Fig. 1D). Of great importance, the MFI of IFNAR2 in monocytes from CHB patients was significantly higher than LC patients (51.61±16.79 versus 41.38±15.46, P<0.05) (Fig. 1H). Furthermore, the percentage of IFNAR2-positive lymphocytes was positively correlated with serum HBV DNA (log10 copies/mL) in CHB patients (r=0.363, P=0.041) (Fig. 1I). The MFI of IFNAR1 in lymphocytes was negatively correlated with HBV DNA (log10 copies/mL) in serum of CHB patients (r=−0.355, P=0.027) (Fig. 1J).
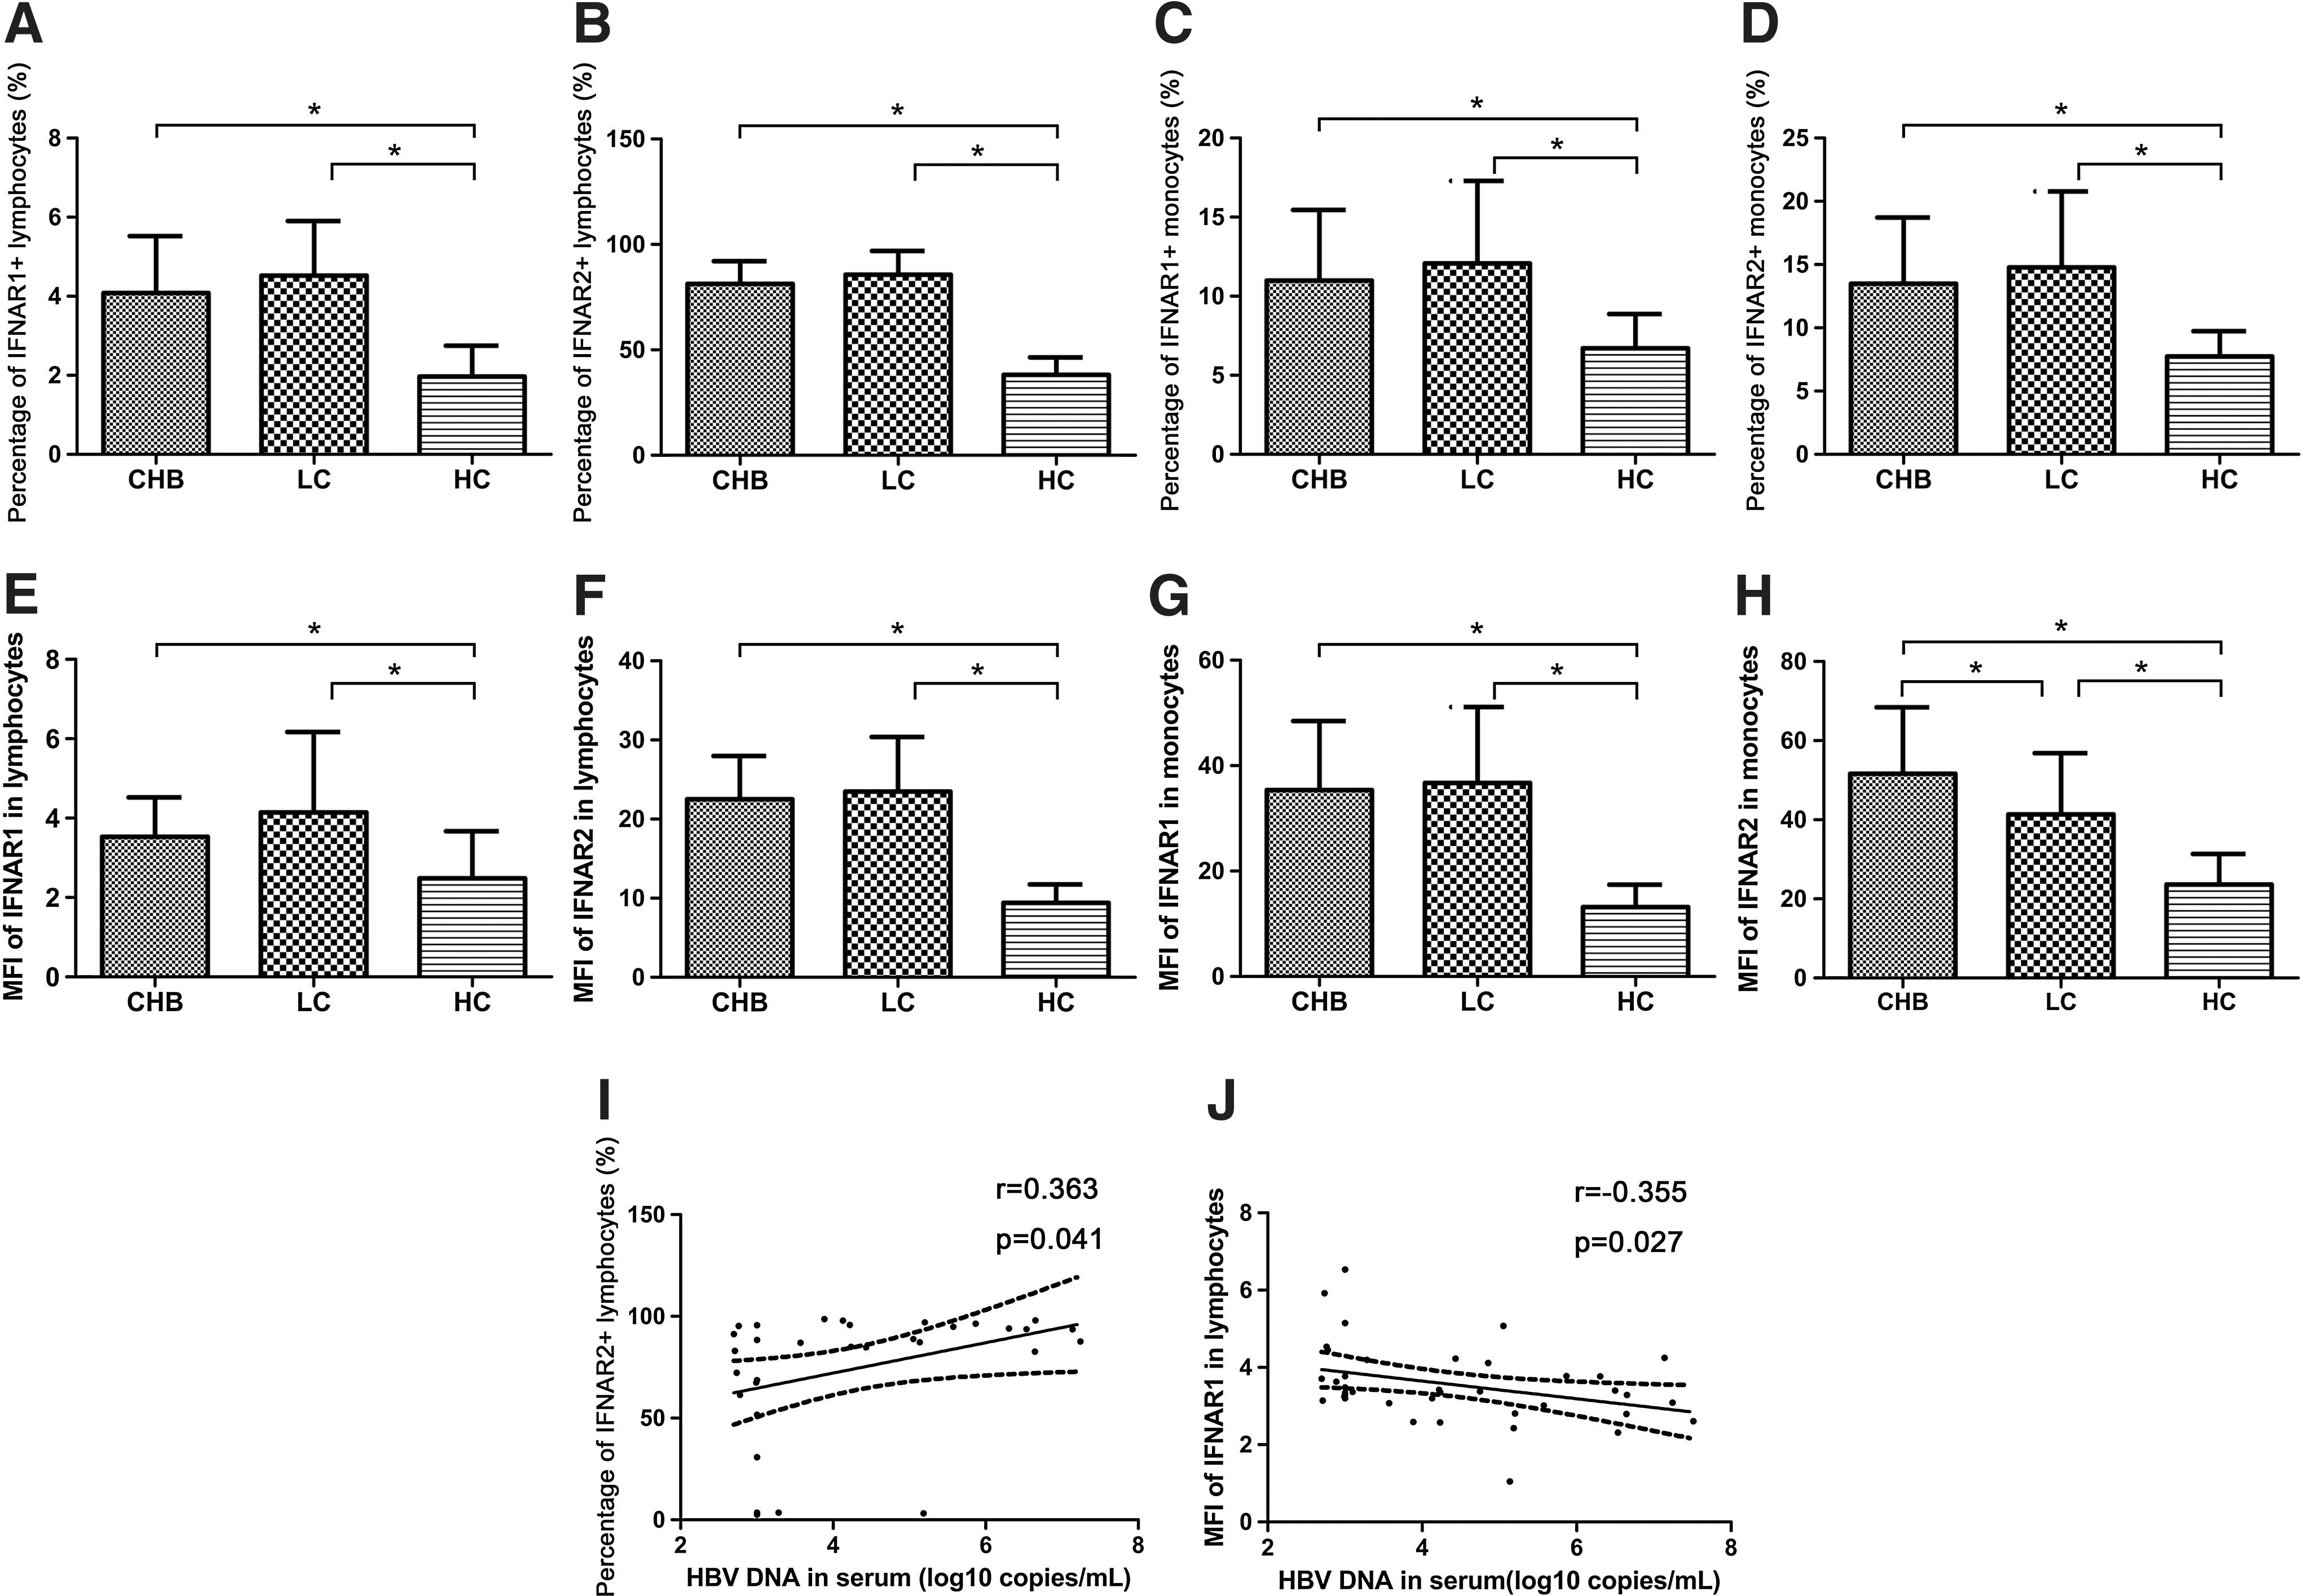
Expression of IFNAR1 and IFNAR2 in peripheral lymphocytes and monocytes of CHB patients, LC patients, and healthy controls (*P<0.05). Percentages of IFNAR1+ lymphocytes
Expression of IFNAR1 mRNA and IFNAR2c mRNA in PBMCs of CHB and LC patients
In this study, we also detected the mRNA levels of IFNAR1 and IFNAR2c in PBMCs with RT-PCR. We observed that mRNA levels of both IFNAR1 and IFNAR2c were upregulated in CHB and LC patients compared with healthy controls (IFNAR1: CHB 6.48±4.68E-3, LC 10.03±8.53E-3, healthy controls 3.11±1.92E-3, P<0.05; IFNAR2c: CHB 5.68±4.39 E-3, LC 4.40±3.19 E-3, healthy controls 3.37±2.16E-3, P<0.05) (Fig. 2). There were no significant differences of PBMCs IFNAR1 and IFNAR2c mRNA level between CHB and LC patients (IFNAR1 mRNA: 6.48±4.68E-3 versus 10.03±8.53E-3, P>0.05; IFNAR2c mRNA: 5.68±4.39 E-3 versus 4.40±3.19 E-3, P>0.05) (Fig. 2). We did not find any significant correlation between IFNAR1 and IFNAR2c mRNA level and clinic characteristics of liver function in CHB patients. There was no significant difference between HBeAg-positive patients and HBeAg-negative patients in the CHB group.
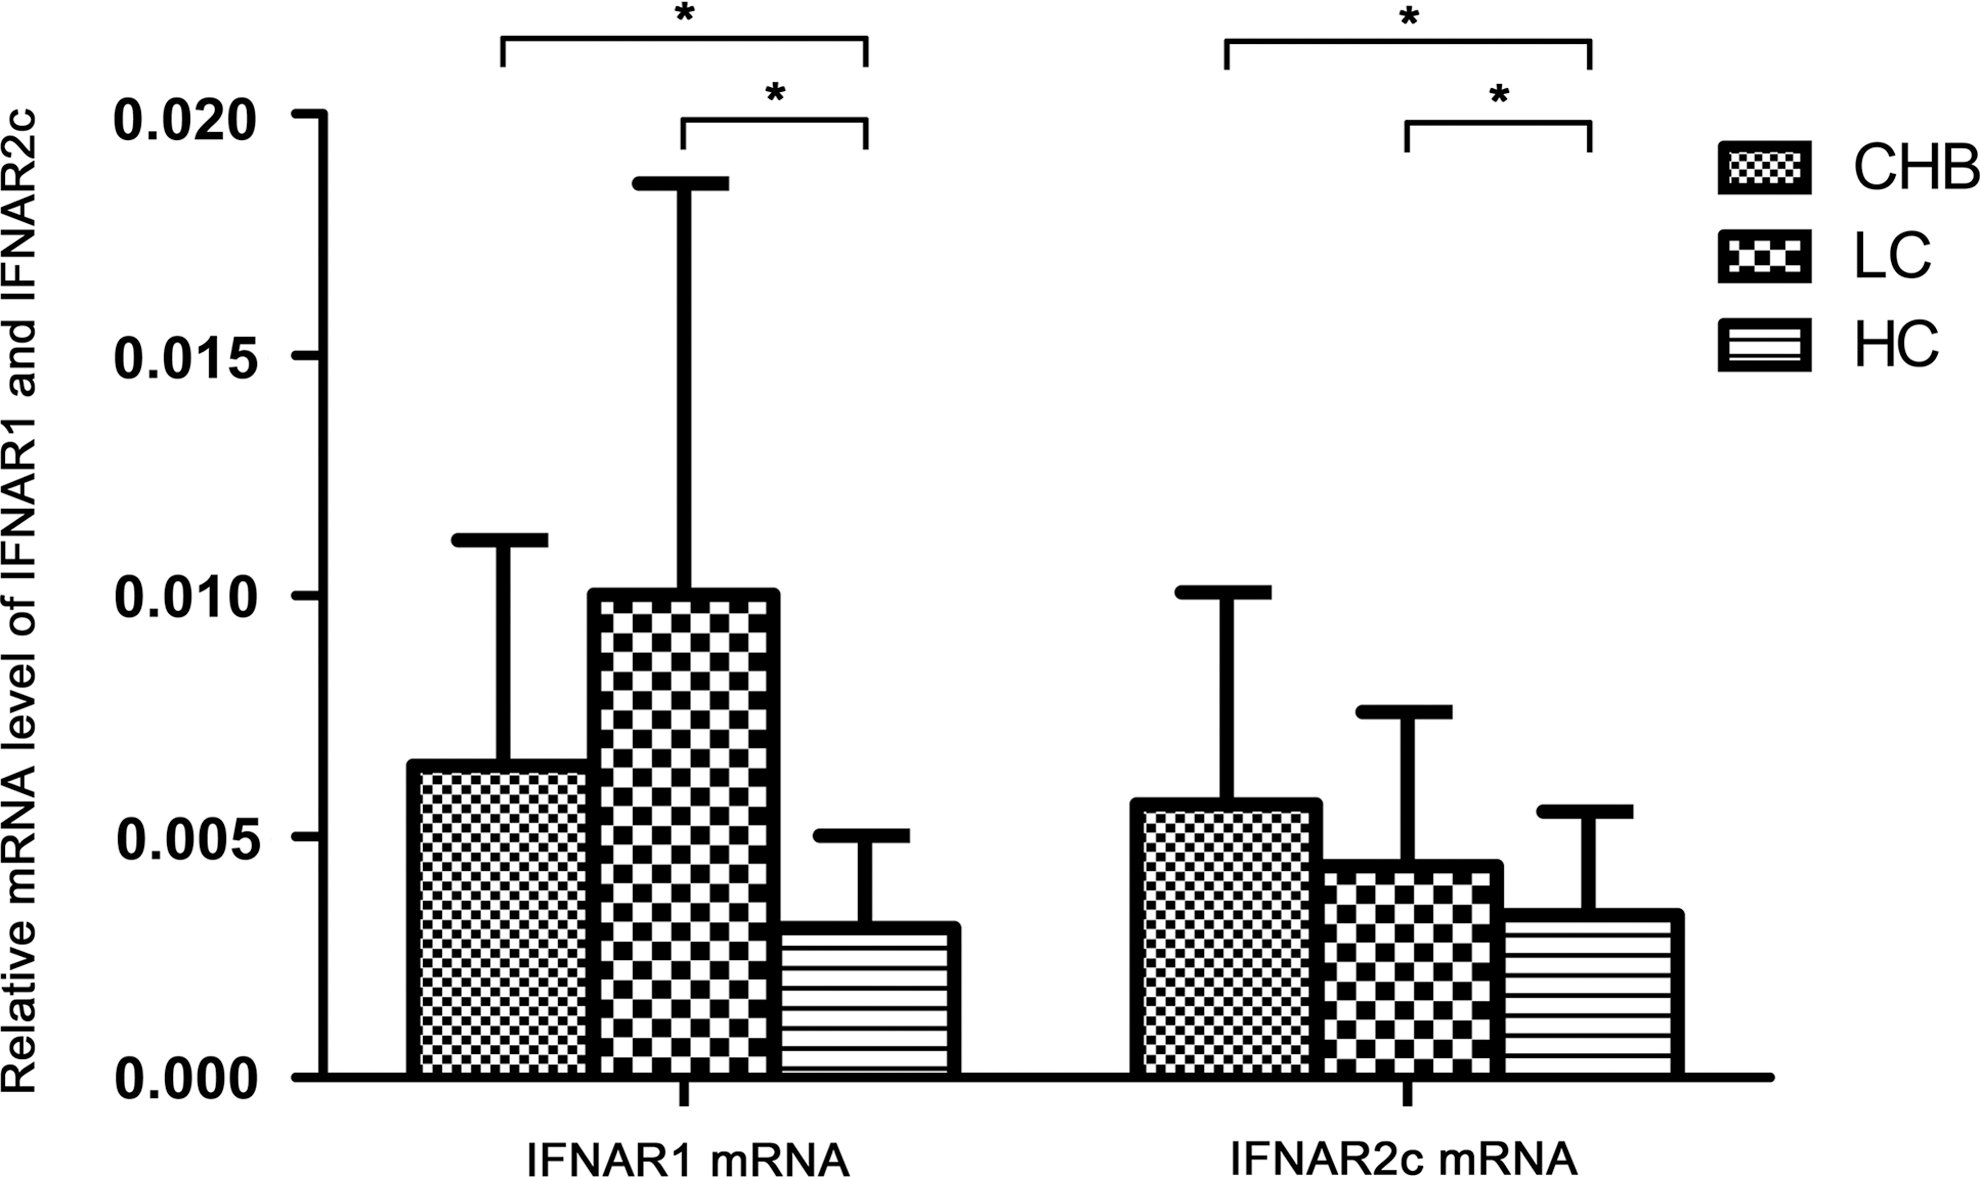
mRNA level of IFNAR1 and IFNAR2c in PBMCs of CHB patients, LC patients, and healthy controls (*P<0.05).
Expression of soluble IFNAR in the circulation of CHB and LC patients
The level of soluble IFNAR in CHB patients significantly increased and that in LC patients increased more compared with healthy controls (CHB, 4.63±4.21 ng/mL; LC, 5.64±2.48 ng/mL; healthy controls, 2.23±1.20 ng/mL; P<0.05) (Fig. 3F). However, we did not find any possible correlation between soluble IFNAR level and clinic characteristics of liver function in CHB patients (ALT: r=0.137, P=0.532; AST: r=0.109, P=0.620; GGT: r=0.080, P=0.717; AKP: r=0.217, P=0.541; TBIL: r=−0.121, P=0.582).
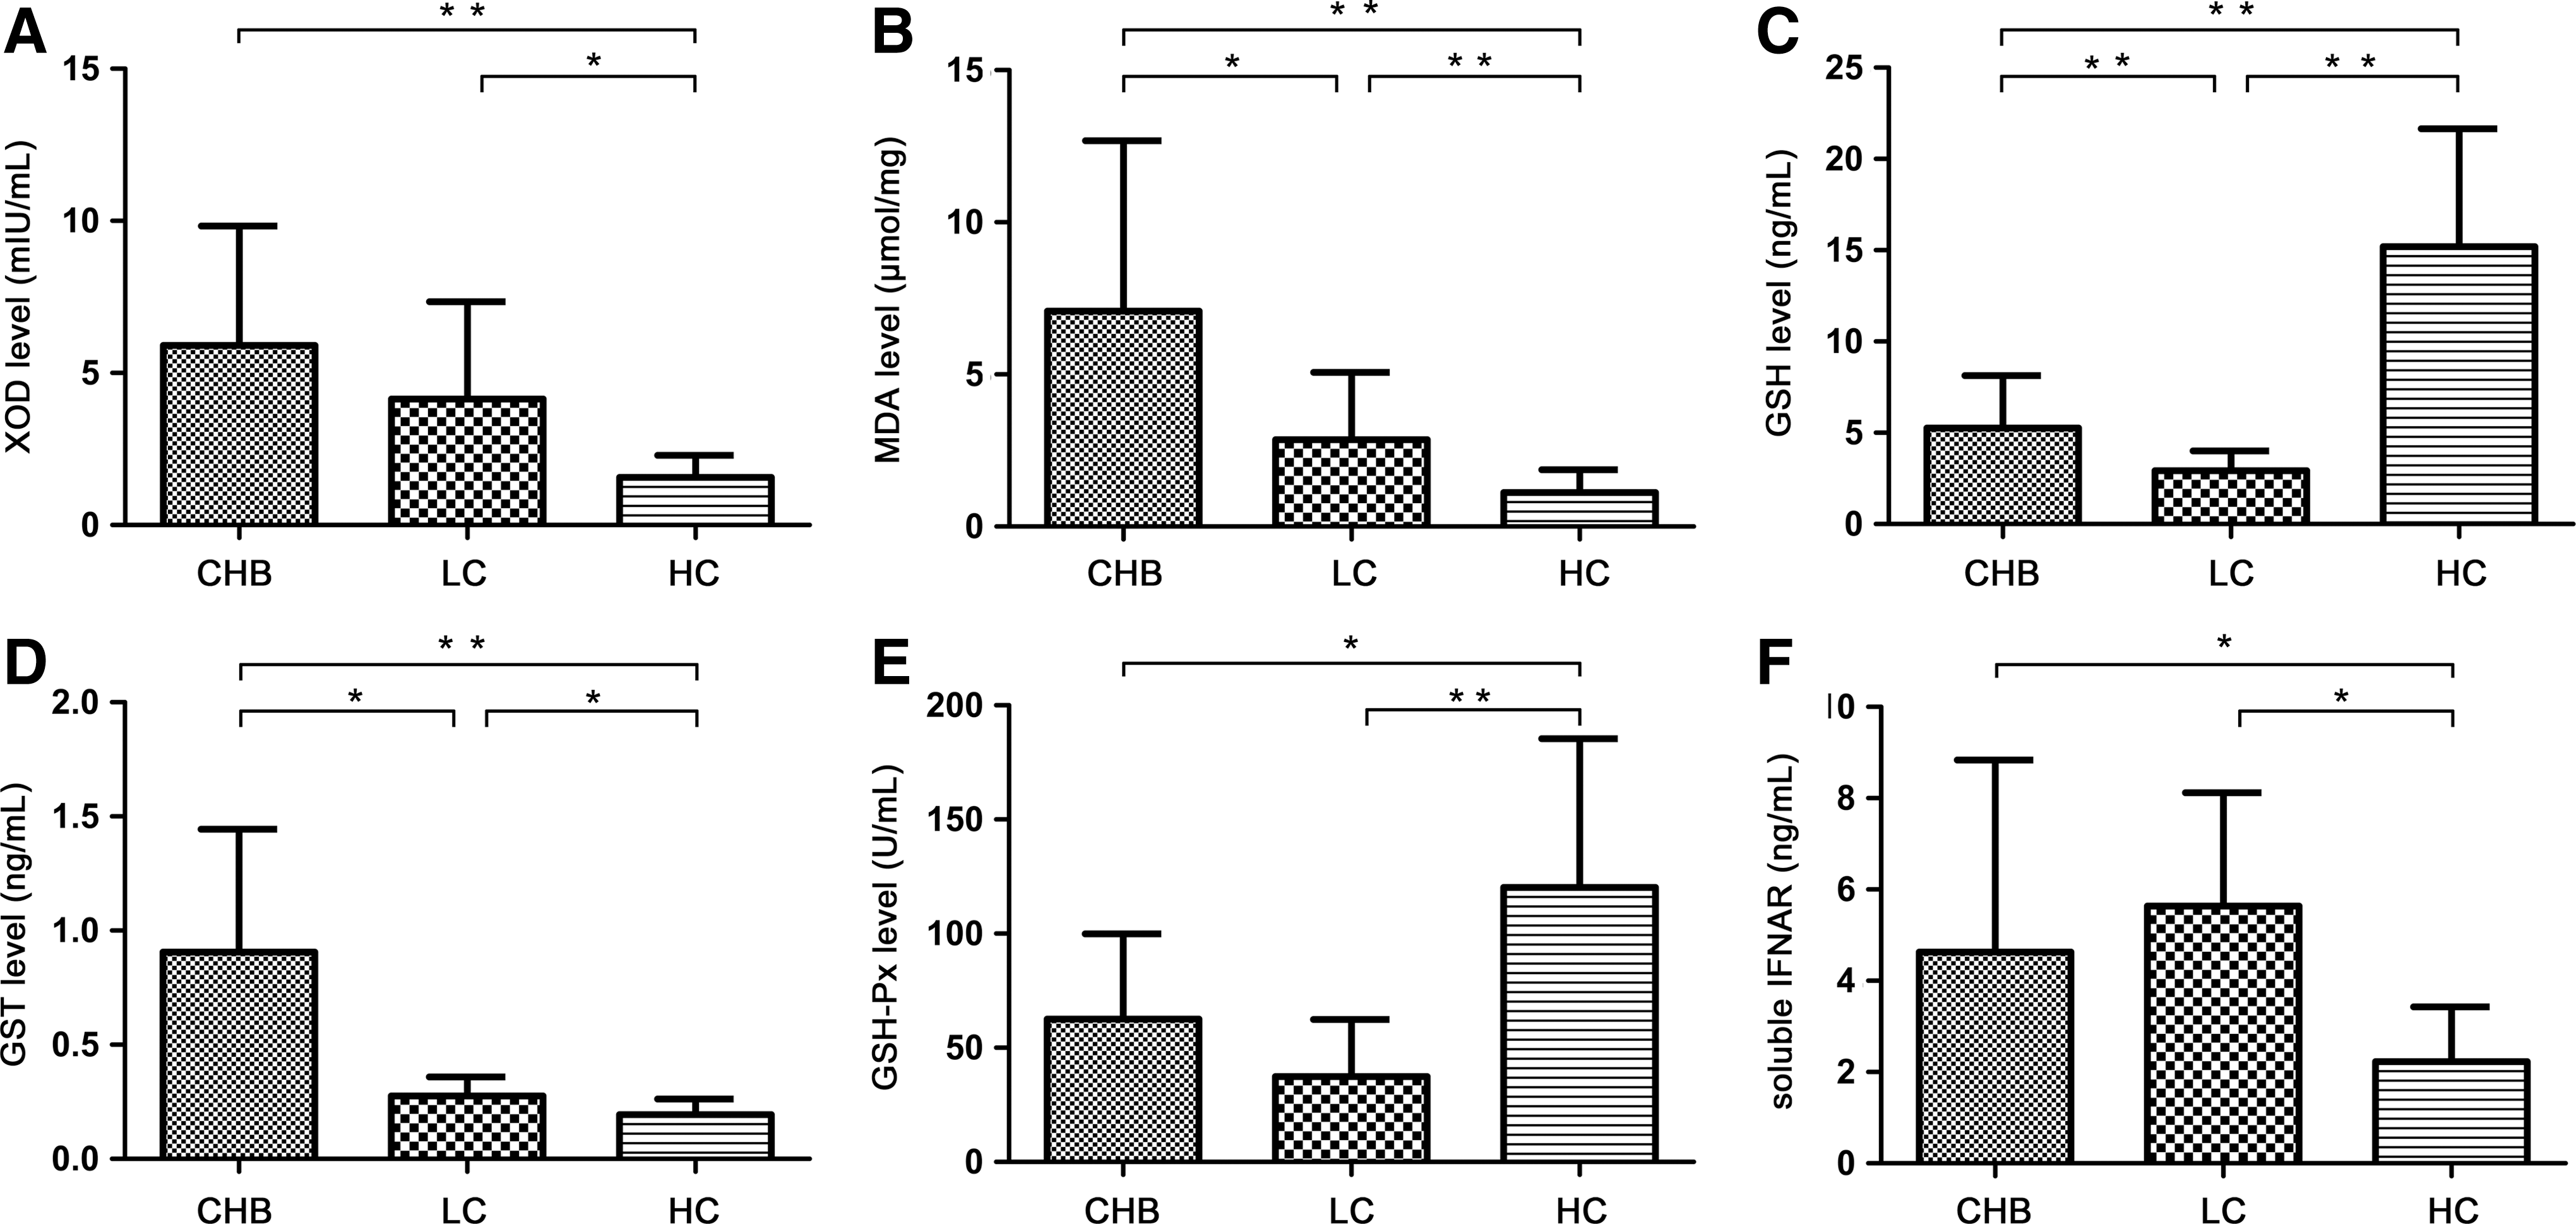
Levels of oxidative stress parameters and soluble IFNAR in plasma of CHB patients, LC patients, and healthy controls (*P<0.05 and **P<0.01). XOD
Levels of oxidative stress parameters in CHB and LC patients
Oxidative stress parameters XOD and MDA expressed in CHB and LC patients significantly increased compared with healthy controls, whereas the plasma level of MDA in CHB patients was higher than that in LC patients (7.08±5.6 μmol/mg versus 2.86±2.20 μmol/mg, P<0.05) (XOD shown in Fig. 3A; MDA shown in Fig. 3B). XOD level was positively correlated with TBIL level (r=0.255, P<0.05) in CHB patients (Fig. 4A). Meanwhile, in CHB patients, MDA level was positively correlated with ALT level (r=0.41, P<0.01) (Fig. 4B) and GGT level (r=0.488, P<0.001) (Fig. 4C).
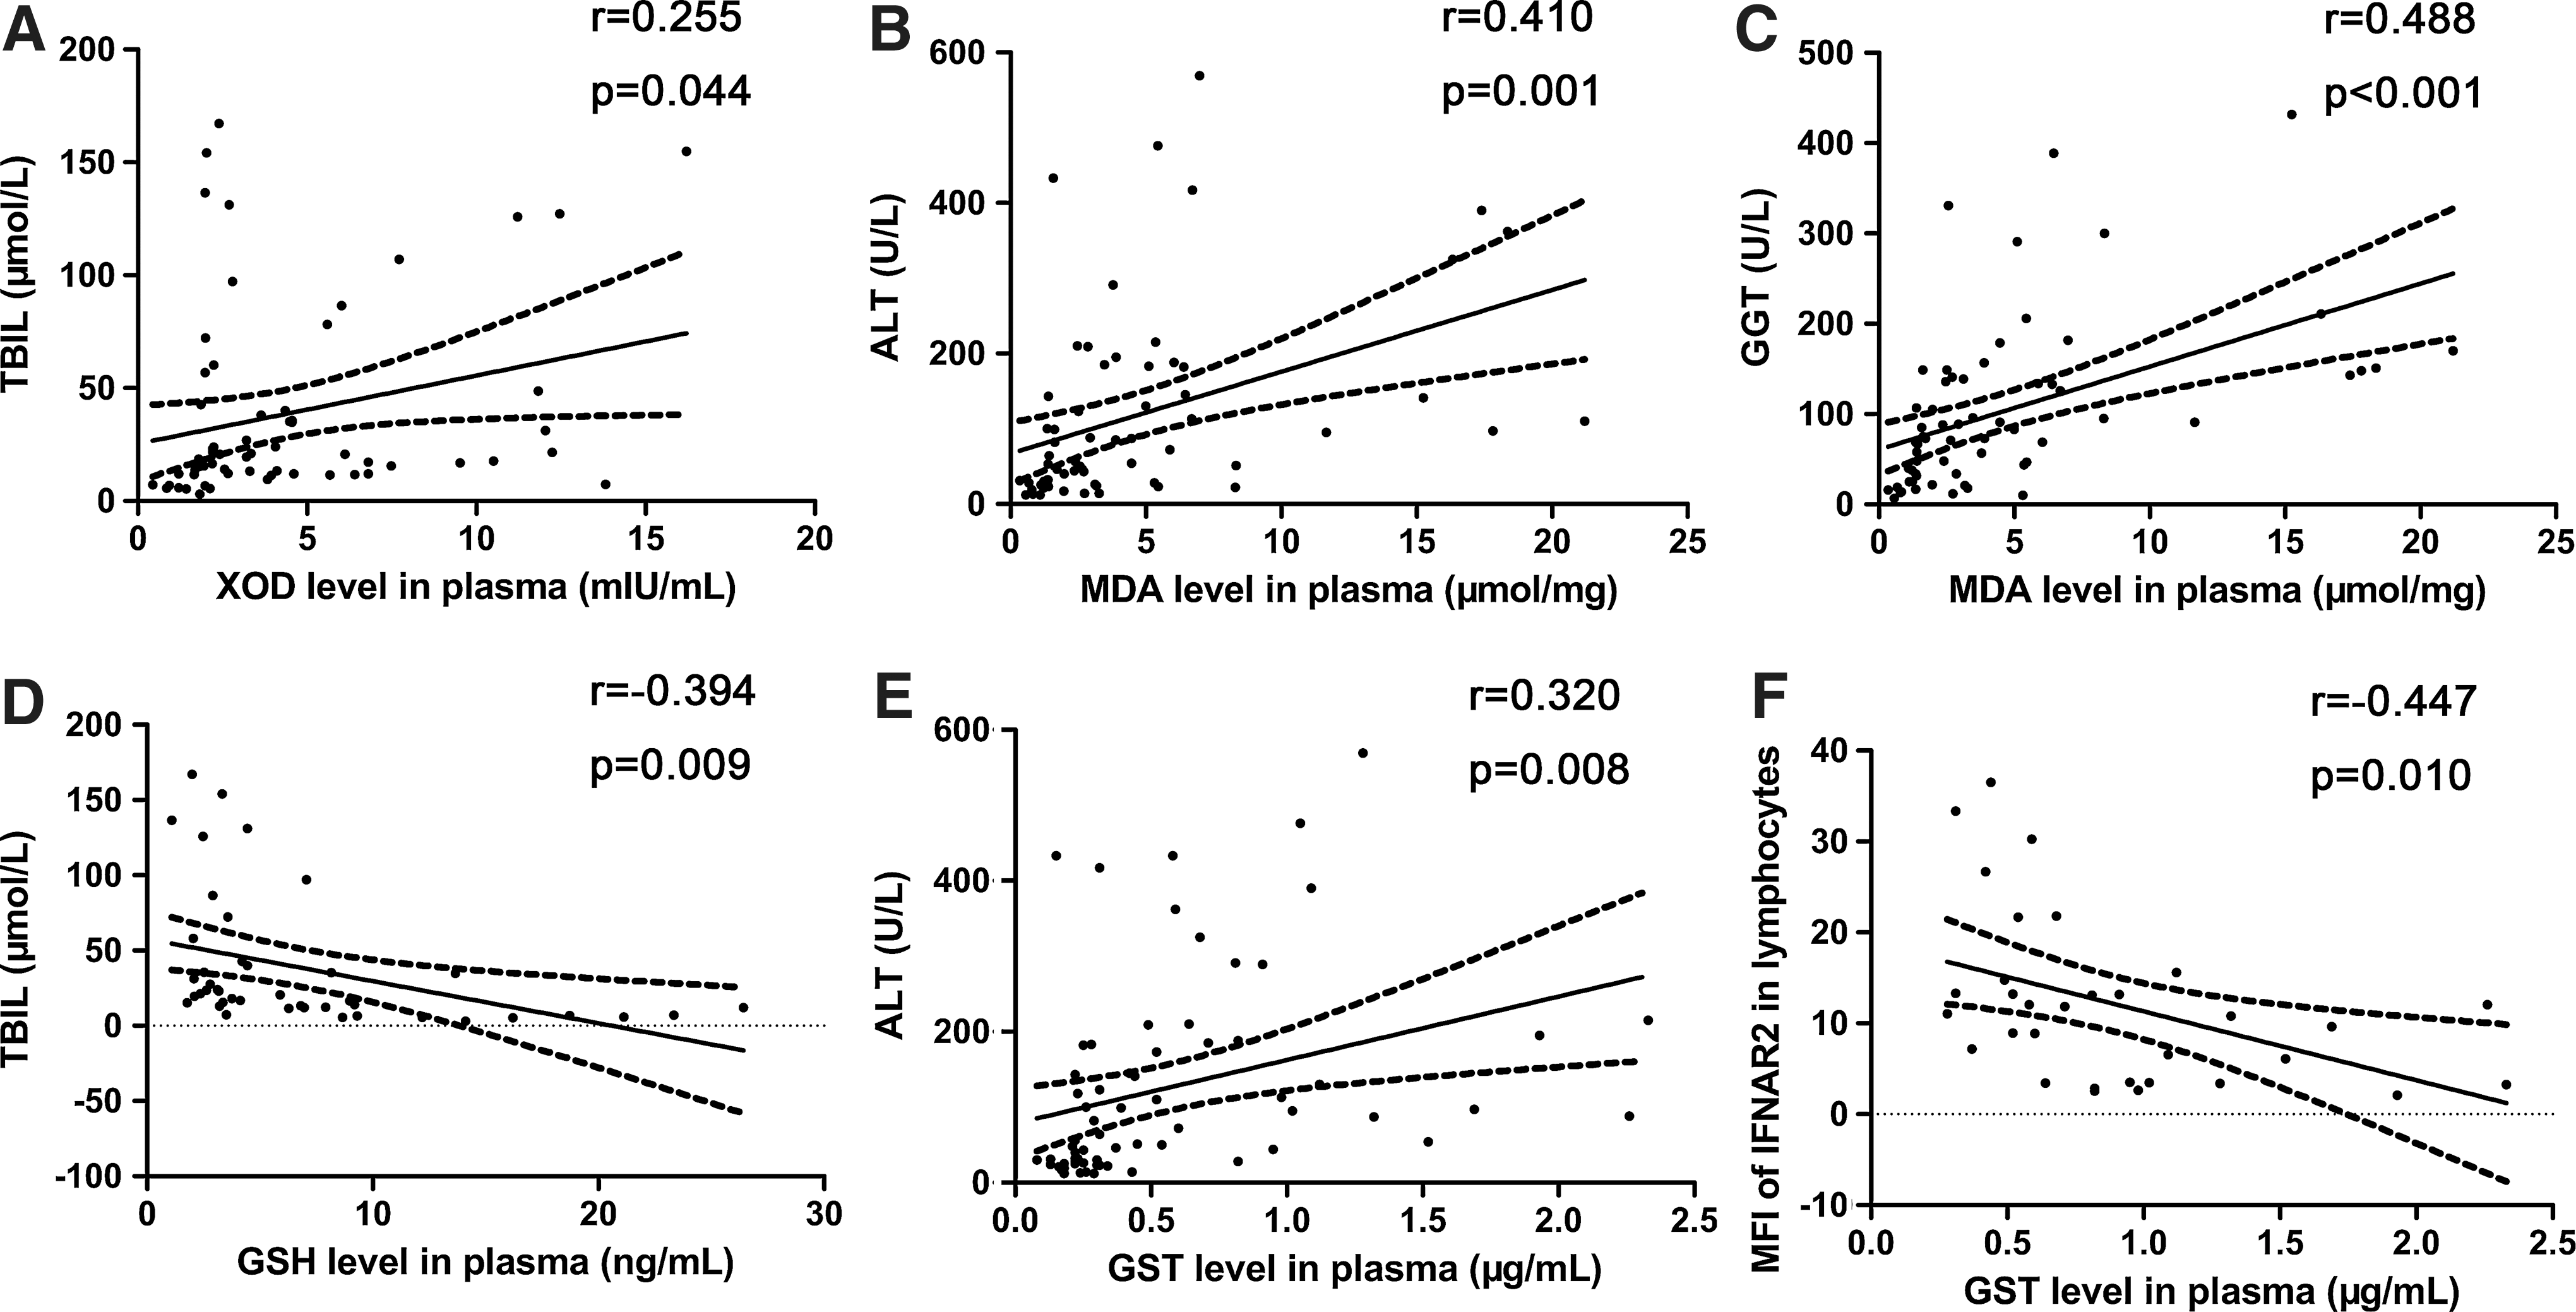
Significant correlations between oxidative stress parameters and clinic characteristics; negative correlation between GST level and IFNAR index. TBIL level in serum correlated with XOD level in plasma
As anti-oxidative stress parameters, GSH and GSH-Px levels in plasma were decreased in CHB and LC patients compared with healthy controls. GSH was also higher in CHB patients than that in LC patients (5.27±2.87 ng/mL versus 2.94±1.07 ng/mL, P<0.01) (GSH shown in Fig. 3C; GSH-Px shown in Fig. 3D). GSH level was negatively correlated with TBIL level (r=−0.394, P<0.001) (Fig. 4D) and age (r=−0.471, P<0.01) in CHB patients, whereas GSH-Px was negatively correlated with age (r=−0.271, P<0.05) in CHB patients too.
As a class of cytosolic enzymes, GST level in plasma of CHB and LC patients was upregulated compared with healthy controls, and it was higher in CHB patients than in LC patients (0.91±0.54 μg/mL versus 0.28±0.08 μg/mL, P<0.05) (Fig. 3E). It was positively correlated with ALT level (r=0.320, P<0.001) in CHB patients (Fig. 4E).
The correlation between IFNAR indices and oxidative stress parameters
To determine the relationship between IFNAR levels and oxidative stress status in CHB patients, we analyzed the correlation between IFNAR expression and the levels of oxidative stress parameters in plasma. We found that the level of GST in plasma was negatively correlated with MFI of IFNAR2 in lymphocytes (r=−0.447, P=0.01) of CHB patients (Fig. 4F). However, there was no relationship between MFI of IFNAR2 in lymphocytes and other oxidative stress parameters (XOD, r=−0.305, P=0.178; MDA, r=0.146, P=0.516; GSH, r=−0.202, P=0.575; GSH-Px, r=0.099, P=0.705). There was no correlation between mRNA level of IFNAR and oxidative stress parameters (IFNAR1: XOD, r=−0.147, P=0.475; MDA, r=0.042, P=0.834; GSH, r=−0.141, P=0.602; GST, r=−0.288, P=0.145; GSH-Px, r=−0.277, P=0.238; IFNAR2c: XOD, r=−0.132, P=0.522; MDA, r=−0.302, P=0.126; GSH, r=0.079, P=0.770; GST, r=0.10, P=0.961; GSH-Px, r=−0.205, P=0.387). At the same time, we could not find any possible relationships between soluble IFNAR and oxidative stress parameters (XOD, r=0.175, P=0.533; MDA, r=0.112, P=0.103; GSH, r=0.633, P=0.067; GST, r=0.171, P=0.541; GSH-Px, r=0.273, P=0.446).
Discussion
IFN-α has been effective in suppressing HBV replication and it is a critical mediator of immune response to HBV infection. The effects of type I IFNs are indirect and mediated by interaction with IFNAR. In virus hepatitis, virus activated kinase (VAK) activates nuclear factor κB (NF-κB), activator protein-1 (AP-1), and interferon regulatory factors-3 (IRF-3) that collaboratively initiate the expression of IFNAR. Type I IFNs bind to IFNAR, initiate JAK/STAT signal cascade, and lead to the expression of numerous interferon-stimulated genes (ISGs), which display antiviral activities.
Previous researchers (Yamaguchi and others 2002; Fujiwara and others 2004) reported that determination of IFNAR2 expression could be useful to monitor its expression in liver tissue. We measured the expression of IFNAR in PBMCs via FCM and RT-PCR. Through FCM, we found that both IFNAR1 and IFNAR2 in peripheral lymphocytes and monocytes were upregulated in CHB and LC patients compared with healthy controls. We also found increased expression of IFNAR1 and IFNAR2c mRNA in PBMCs of CHB and LC patients. From our study, we found that the frequencies of IFNAR1 in lymphocyte and monocytes have almost no difference between CHB and LC patients. Meanwhile, the frequencies of IFNAR2 in lymphocyte and monocytes from CHB patients were not different from those of LC patients. Particularly, the MFI of IFNAR2 in monocytes was higher in CHB patients than that in LC patients. This phenomenon indicates that the expression of IFNAR may decrease following the aggravation of liver damage. The reduction of IFNAR expression could induce the decrement of IFN uptake and then affect the clearance of HBV.
IFN-α has been used for the treatment of CHB and been shown to be effective in suppression HBV replication. However, the continuous virologic response of CHB patients is only 20%–25% after IFN-α therapy. In this present study, we demonstrated that the expression of IFNAR1 and IFNAR2 in peripheral lymphocytes and monocytes from chronic HBV infection was upregulated compared with healthy controls. Moreover, the MFI of IFNAR2 in monocytes from CHB patients was significantly higher than LC patients. In our previous study (Meng and others 2011), we demonstrated that the expression of IFNAR1 in peripheral lymphocytes and monocytes had no difference between responders and nonresponders before IFN-α2b therapy. We also found that pretreatment level of IFNAR2 in peripheral monocytes in responders was higher than that in nonresponders in CHB patients. All the results strongly suggested that IFNAR2 in peripheral monocytes before IFN therapy might be a predictive parameter to evaluate the efficacy of IFN in CHB patients.
As a regulatory protein of HBV, HBX could downregulate the expression of IFNAR and inhibit IFN-α-mediated signal transduction, and then attenuate antivirus efficacy of IFNAR (Cho and others 2012). Ambrus and others (Ambrus and others 2003) suggested that soluble IFNAR may present a virus-against-host defense mechanism and inhibit partly the activity of type I IFN (Novick and others 1995; Ambrus and others 1997). The possible mechanism may be that soluble IFNAR in the circulation could compete with membrane-anchored IFNAR for binding IFN and thus prevent IFN from binding hepatic tissue. Previous studies found that soluble IFNAR could inhibit antiviral activity of IFN-α in vitro (Han and others 2001) and suppress the effectiveness of IFN-α therapy in CHC patients (Mizukoshi and others 1999). Mizukoshi and others reported that serum soluble IFNAR level before IFN treatment was lower in CHC patients with sustained virologic response (SVR) than those without SVR (Mizukoshi and others 1999). Then, they speculated that the soluble IFNAR might be used as an indicator to predict the antiviral outcome of IFN in CHC patients. In our present study, we found that the plasma level of soluble IFNAR in CHB and LC patients upregulated compared with healthy controls. Considering the inhibitive effects of soluble IFNAR on type I IFNs (Novick and others 1995; Ambrus and others 1997), we therefore speculated that the elevated soluble IFNAR may contribute to the resistance of anti-HBV activity during IFN-α therapy in chronic HBV infection.
As a noncytopathic virus, HBV itself has no direct harm on hepatocytes and immune responses are considered as the main cause for liver injury (Chang and Lewin 2007). The antiviral and immunomodulatory effects exerted by type I IFNs are indirect and they are triggered by interaction with IFNAR (Goodbourn and others 2000). In our present study, we found elevated IFNAR 1 and IFNAR2 in CHB and LC patients compared with healthy controls. This phenomenon might be attributed to the biological function of type I IFNs in HBV infection. Type I IFNs could modulate adaptive immunity, including priming B and T cell responses, enhancing the recovery of memory T cells and inducing lasting CD4+ T-cell proliferation (Le Bon and Tough 2002). Except the effects on adaptive immune, type I IFNs participate in innate immune such as NK cells, which contribute to the control of persistent HBV infection (Vivier and others 2008). Type I IFNs could activate NK cells, induce the proliferation of NK cells, and enhance their cytotoxicity (Hervas-Stubbs and others 2011).
Both IFNAR and oxidative stress participate in the pathogenesis of CHB through the involvement in dysfunction of innate immune response. As a cell-surface protein, IFNAR may be modulated by oxidative stress. In this study, we observed significant increment in MDA and XOD levels and decrement of antioxidant enzymatic activities (GSH and GSH-Px) in CHB and LC patients. GST is a class of cytosolic enzymes participated in the protection of cell from ROS, and its level in plasma of CHB and LC patients was increased compared with healthy controls. As an important marker that could reflect hepatocellular damage, GST is rich in hepatic cytosol and release following hepatic insult (Farias and others 2012). The alterations of these oxidative stress parameters indicated that oxidative stress was significantly increased in CHB and LC patient. In addition, GSH level in plasma of LC patients was lower than that in CHB patients. This result indicated that anti-oxidative capacity in LC patients attenuated compared with CHB patients.
The induction of liver damage by ROS may be triggered by 3 main mechanisms: lipid peroxidation, cytokine induction, and Fas ligand induction. Hepatocytes are exposed to ROS continuously and are protected from oxidative damage by antioxidant pathways. The antioxidant pathways conclude enzymatic deactivation and direct reaction with free radicals that could protect cells from ROS (Halliwell 1994). In our previous study (Fan and others 2009), the depletion of GSH and GSH-Px and the increment of MDA, XOD, and GST indicated that ROS played critical roles in hepatocyte damage and apoptosis by impairing of anti-oxidative defense systems. Moreover, HCV could promote hepatic fibrosis progression through the generation of ROS (Lin and others 2010). From our study on oxidative stress, oxidative damage was serious in LC patients, which indicated that oxidative damage exacerbated with the aggravation of liver damage. The correlations between clinic characteristics of liver function and oxidative stress parameters indicated that oxidative stress was associated with the severity of hepatopathy.
In HBV infection, many in vitro studies (Severi and others 2006; Niu and others 2009) have shown that oxidative stress can be induced by HBV. HBX targets mitochondria, alters mitochondrial membrane potential, and then increases the production of endogenous ROS (Lee and others 2004; Lim and others 2010). HBX can downregulate the expression of SeP, which could induce lipid peroxidation (Yi and others 2003). Except these activities of HBX on oxidative stress, HBX also initiates calcium signaling, activates cellular kinases, and leads to the activation of transcription factors NF-κB, signal transducer, and activator of transcription 3 (STAT3) via oxidative stress (Waris and others 2001; Bouchard and Schneider 2004). While NF-κB can collaborate AP-1 and IRF-3 to initiate the expression of IFNAR, HBX could promote the expression of IFNAR via oxidative stress.
In our study, we observed that GST level in plasma was negatively correlated with MFI of IFNAR2 in lymphocytes (r=−0.447, P=0.01) in CHB patients. As one of dimeric phase II enzymes, GST could catalyze conjunction of GSH with ROS and defend hepatocytes against oxidative stress (Boya and others 1999; Tew and Ronai 1999; Raza 2011). They also suggested that the protection capacity of GST to hepatocytes could be attenuated by HBV and aggravate liver injury of hepatitis. In other words, GST takes part in the protection of cell from ROS. Following the further aggravation of liver injury, GST releases from hepatic cytosol into blood. Upregulated plasma level of GST in CHB patients indicates severe oxidative stress status and liver injury. Oxidative stress could induce protein damage and modulate the biological conformation of protein (Tasdelen Fisgin and others 2012). Oxidative stress may promote the induction of IFNAR via NFκB, but severe oxidative stress may induce protein damage more. We conjectured that IFNAR damage caused by oxidative stress may exceed the promotion of IFN expression caused by oxidative stress in CHB patients. However, the upregulation of HBV to IFNAR still predominate compared with the weaken effect of oxidative stress to IFNAR in CHB patients. So, the expression of IFNAR in CHB patients still increased compared with healthy controls.
There are also some limitations in our present study. First, intrahepatic expression of IFNAR should be performed due to the lack of liver biopsy. As is known, not all the patients would like to receive liver biopsy especially in the population with decompensated LC due to the high risk of bleeding. Therefore, IFNAR expressed in liver tissue are being studied in the future work. Second, the exact molecular mechanisms for the influence of GST on IFNAR have not been clarified. Hence, further studies in vitro and in vivo are required to find out the concrete mechanism.
In conclusion, our data indicated that plasma GST level could affect the expression of IFNAR in chronic HBV infection. The negative correlation between IFNAR2 in lymphocytes with GST plasma level strongly suggested that oxidative stress play an important role in the regulation of IFNAR in patients with CHB.
Footnotes
Acknowledgments
This work was supported by grants from Key Project of Chinese Ministry of Science and Technology (2012ZX10002007), National Natural Science Foundation of China (81171579, 81201287), Natural Science Foundation of Shandong Province (ZR2010HM070, ZR2010HQ040), and Independent Innovation Foundation of Shandong University (IIFSDU, 2010TS013).
Author Disclosure Statement
No competing financial interests exist.