
Abstract
The results of clinical and experimental studies suggest that type I interferons (IFNs) may have direct antifibrotic activity in addition to their antiviral properties. However, the mechanisms are still unclear; in particular, little is known about the antifibrotic activity of IFN-β and how its activity is distinct from that of IFN-α. Using DNA microarrays, we demonstrated that gene expression in TWNT-4 cells, an activated human hepatic stellate cell line, was remarkably altered by IFN-β more than by IFN-α. Integrated pathway enrichment analyses revealed that a variety of IFN-β–mediated signaling pathways are uniquely regulated in TWNT-4 cells, including those related to cell cycle and Toll-like receptor 4 (TLR4) signaling. To investigate the antifibrotic activity of IFN-β and the involvement of TLR4 signaling in vivo, we used mice fed a choline-deficient
Introduction
H
Type I interferons (IFNs) constitute a pleiotropic cytokine family with antiviral, immunomodulatory, and antiproliferative effects. On the basis of their antiviral activity, IFN-β and IFN-α, classified as type I IFNs (Pestka and others 1987; Uzé and others 2007), have been widely used as therapeutic agents for viral eradication in patients with chronic viral hepatitis. Type I IFN therapy was found to suppress progressive fibrosis and prevent the subsequent occurrence of HCC in patients without virologic response (Almasio and others 2003; Soga and others 2005), indicating their therapeutic usefulness in preventing hepatic injury, fibrosis, and carcinogenesis.
The differences in the antitumor effects of IFN-β and IFN-α have been thoroughly investigated, and there is a growing body of evidence showing that the antiproliferative effect of IFN-β on certain HCC cell lines is superior to that of IFN-α (Murata and others 2006; Damdinsuren and others 2007). Although IFN-β also has a preferential antiproliferative effect on HSCs (Shen and others 2002; Sekiya and others 2011), few studies have been published concerning the differences in the signaling pathways of IFN-β and IFN-α on HSC lines and the antifibrotic activity of IFN-β in vivo.
In this study, an immortalized and activated HSC line (Shibata and others 2003), TWNT-4, was shown to be a useful tool for analyzing the signaling pathway of IFN-β. As a result of DNA microarray analysis using TWNT-4 cells, we selected the appropriate experimental model of hepatic fibrosis and investigated the antifibrotic properties of IFN-β.
Materials and Methods
Interferons
Natural human IFN-α (Sumiferon; Dainippon Sumitomo Pharma) and natural human IFN-β (Feron; Toray Industries) were used in this experiment. Recombinant murine IFN-β derived from Escherichia coli were obtained from Kamakura Techno-Science.
Cell lines and cell culture
Human HSC line TWNT-4 cells, immortalized by retrovirally introducing human telomerase reverse transcriptase into LI 90 cells, an HSC line from the human liver mesenchymal tumor (Murakami and others 1995), were kindly provided by Dr. Naoya Kobayashi (Department of Surgery, Okayama University, Okayama, Japan, Present affiliation: Okayama Saidaiji Hospital, Okayama, Japan) with the permission of Okayama University (Okayama, Japan). The cells were maintained in Dulbecco's modified Eagle's medium containing 10% fetal bovine serum and 100 U/mL penicillin and 100 μg/mL streptomycin (Invitrogen). A human HCC-derived cell line, HuH-7 cells (JCRB0403) (Nakabayashi and others 1982), was obtained from the Japanese Collection of Research Bioresources and maintained in accordance with the provider's recommendation. All cells were incubated at 37°C in 5% CO2 atmosphere.
Cell proliferation assay
The cells were plated at a density of 5×10² cells/well in a 96-well plate. The next day (day 0), the culture medium was replaced with a fresh one containing different concentrations of IFNs. On days 2, 4, 5, 7, and 11, viable cell count and cell viability values were determined by MTS methods using the CellTiter 96® AQueous One Solution Cell Proliferation Assay (Promega).
Flow cytometry
The TWNT-4 cells were serum starved for 21 h to synchronize the cells in the G0/G1 phase and then the medium was replaced with a fresh one containing IFNs (100 IU/mL) and serum. At 24 h after treatment, the cells were harvested by trypsinization, washed with phosphate-buffered saline (PBS), and fixed in ice-cold 70% ethanol. Following cell washing with PBS, cellular DNA was stained with 0.025 mg/mL propidium iodide (Life Technologies) in the presence of 100 μg/mL RNase A (Life Technologies). The fluorescence intensity of 10,000 cells was measured using a FACSCaliber flow cytometer (Becton Dickinson).
Western blot analysis
The TWNT-4 cells were treated with IFNs (100, 1,000 IU/mL). After treatment for 16 h, the cells were lysed with the RIPA lysis buffer containing protease and phosphatase inhibitors (Santa Cruz Biotechnology) and centrifuged (38,000 g, 10 min at 4°C) to remove insoluble material. Sample aliquots (20 μg of protein) were separated by 4–10% gradient SDS-PAGE and electrotransferred onto polyvinylidene difluoride membranes (Bio-Rad Laboratories). Nonspecific binding was blocked with Blocking One buffer (Nacalai Tesque) and incubated with the primary antibodies, anti-p21 (No. 2947; Cell Signaling Technology) and anti-actin (No. sc-1615; Santa Cruz Biotechnology). The membranes were washed with PBS with 0.1% Tween-20 and incubated with the secondary antibodies, alkaline phosphatase-labeled anti-rabbit IgG (Promega) and anti-goat IgG (Caltag Medsystems), respectively. The immunoreactive protein bands were visualized using a BCIP-NBT solution kit (Nacalai Tesque).
RNA extraction and quality check
The TWNT-4 and HuH-7 cells were treated with IFNs (100 IU/mL). After treatment for 4 h, total RNA was prepared from the cells using the RNeasy® Mini Kit (Qiagen). The RNA concentration and purity were assessed by UV absorbance determined using a NanoDrop Spectrophotometer ND-1000 (Nanodrop Technologies, Thermo Fisher Scientific). For microarrays, confirmation of the RNA quality was performed using a 2100 Bioanalyzer (Agilent Technologies).
DNA microarray
For the DNA microarray analysis, 1 μg of total RNA was amplified and labeled using an Amino Allyl MessageAmp™ II aRNA Amplification kit (Applied Biosystems) in accordance with the manufacturer's instructions. Each sample of aRNA labeled with Cy3 or Cy5 was cohybridized with 3D-Gene™ Human Oligo chip 25k (Toray Industries) at 37°C for 16 h. After hybridization, each DNA chip was washed and dried. Hybridization signals were scanned using a ScanArray Express scanner (PerkinElmer) and processed by GenePix® Pro (Molecular Devices). The detected signals for each gene were scaled using the global normalization method (Cy3/Cy5 ratio median=1). Integrated pathway enrichment analyses were performed using the knowledge-based canonical pathways in MetaCore™ (GeneGO).
Animals and in vivo experimental design
The animal experiments were conducted in accordance with the Guidelines for Animal Experiments, Research and Development Division, Toray Industries, Inc. Seven-week-old male C57BL6/N mice (Charles River Laboratories Japan) were randomly divided into 4 groups, that is, the naive group (n=3), naive+IFN-β group (n=3), choline-deficient
Histopathological examination
Formalin-fixed paraffin-embedded 2 μm-thick slices of liver were processed with hematoxylin and eosin stain and Sirius red stain using established methods. The NanoZoomer Digital Pathology System (Hamamatsu Photonics) was used to acquire digital high-resolution images through the 100× objectives. Image analysis was performed using Definiens XD software (Definiens). Three images per specimen were examined blindly and randomly and Sirius red-positive areas were quantified as the percentage of the fibrosis area.
Measurement of plasma transaminases
Plasma samples were obtained from the abdominal aorta using tubes containing lithium heparin and plasma separator (BD). Plasma alanine aminotransferase (ALT) and aspartate aminotransferase (AST) were measured using a DRI-CHEM system (Fujifilm).
Real-time quantitative polymerase chain reaction
Total RNA was extracted from each liver using the RNeasy Mini Kit (Qiagen) and translated into complementary DNA (cDNA) with High-Capacity cDNA Reverse Transcription kits (Applied Biosystems). Each cDNA was subjected to real-time quantitative polymerase chain reaction (qPCR) using the ABI-Prism 7000 and 7500 Sequence Detection System (Applied Biosystems) and amplified by the SYBR® Premix Ex Taq™ (TaKaRa Bio) reaction mixture utilizing gene-specific primers (Supplementary Table S1; Supplementary Data are available online at
Statistical analysis
In vivo quantitative data were analyzed by Wilcoxon's test. P<0.05 was considered statistically significant from the naive or CDAA control group.
Results
IFN-β inhibits proliferation of TWNT-4 cells more potently than IFN-α
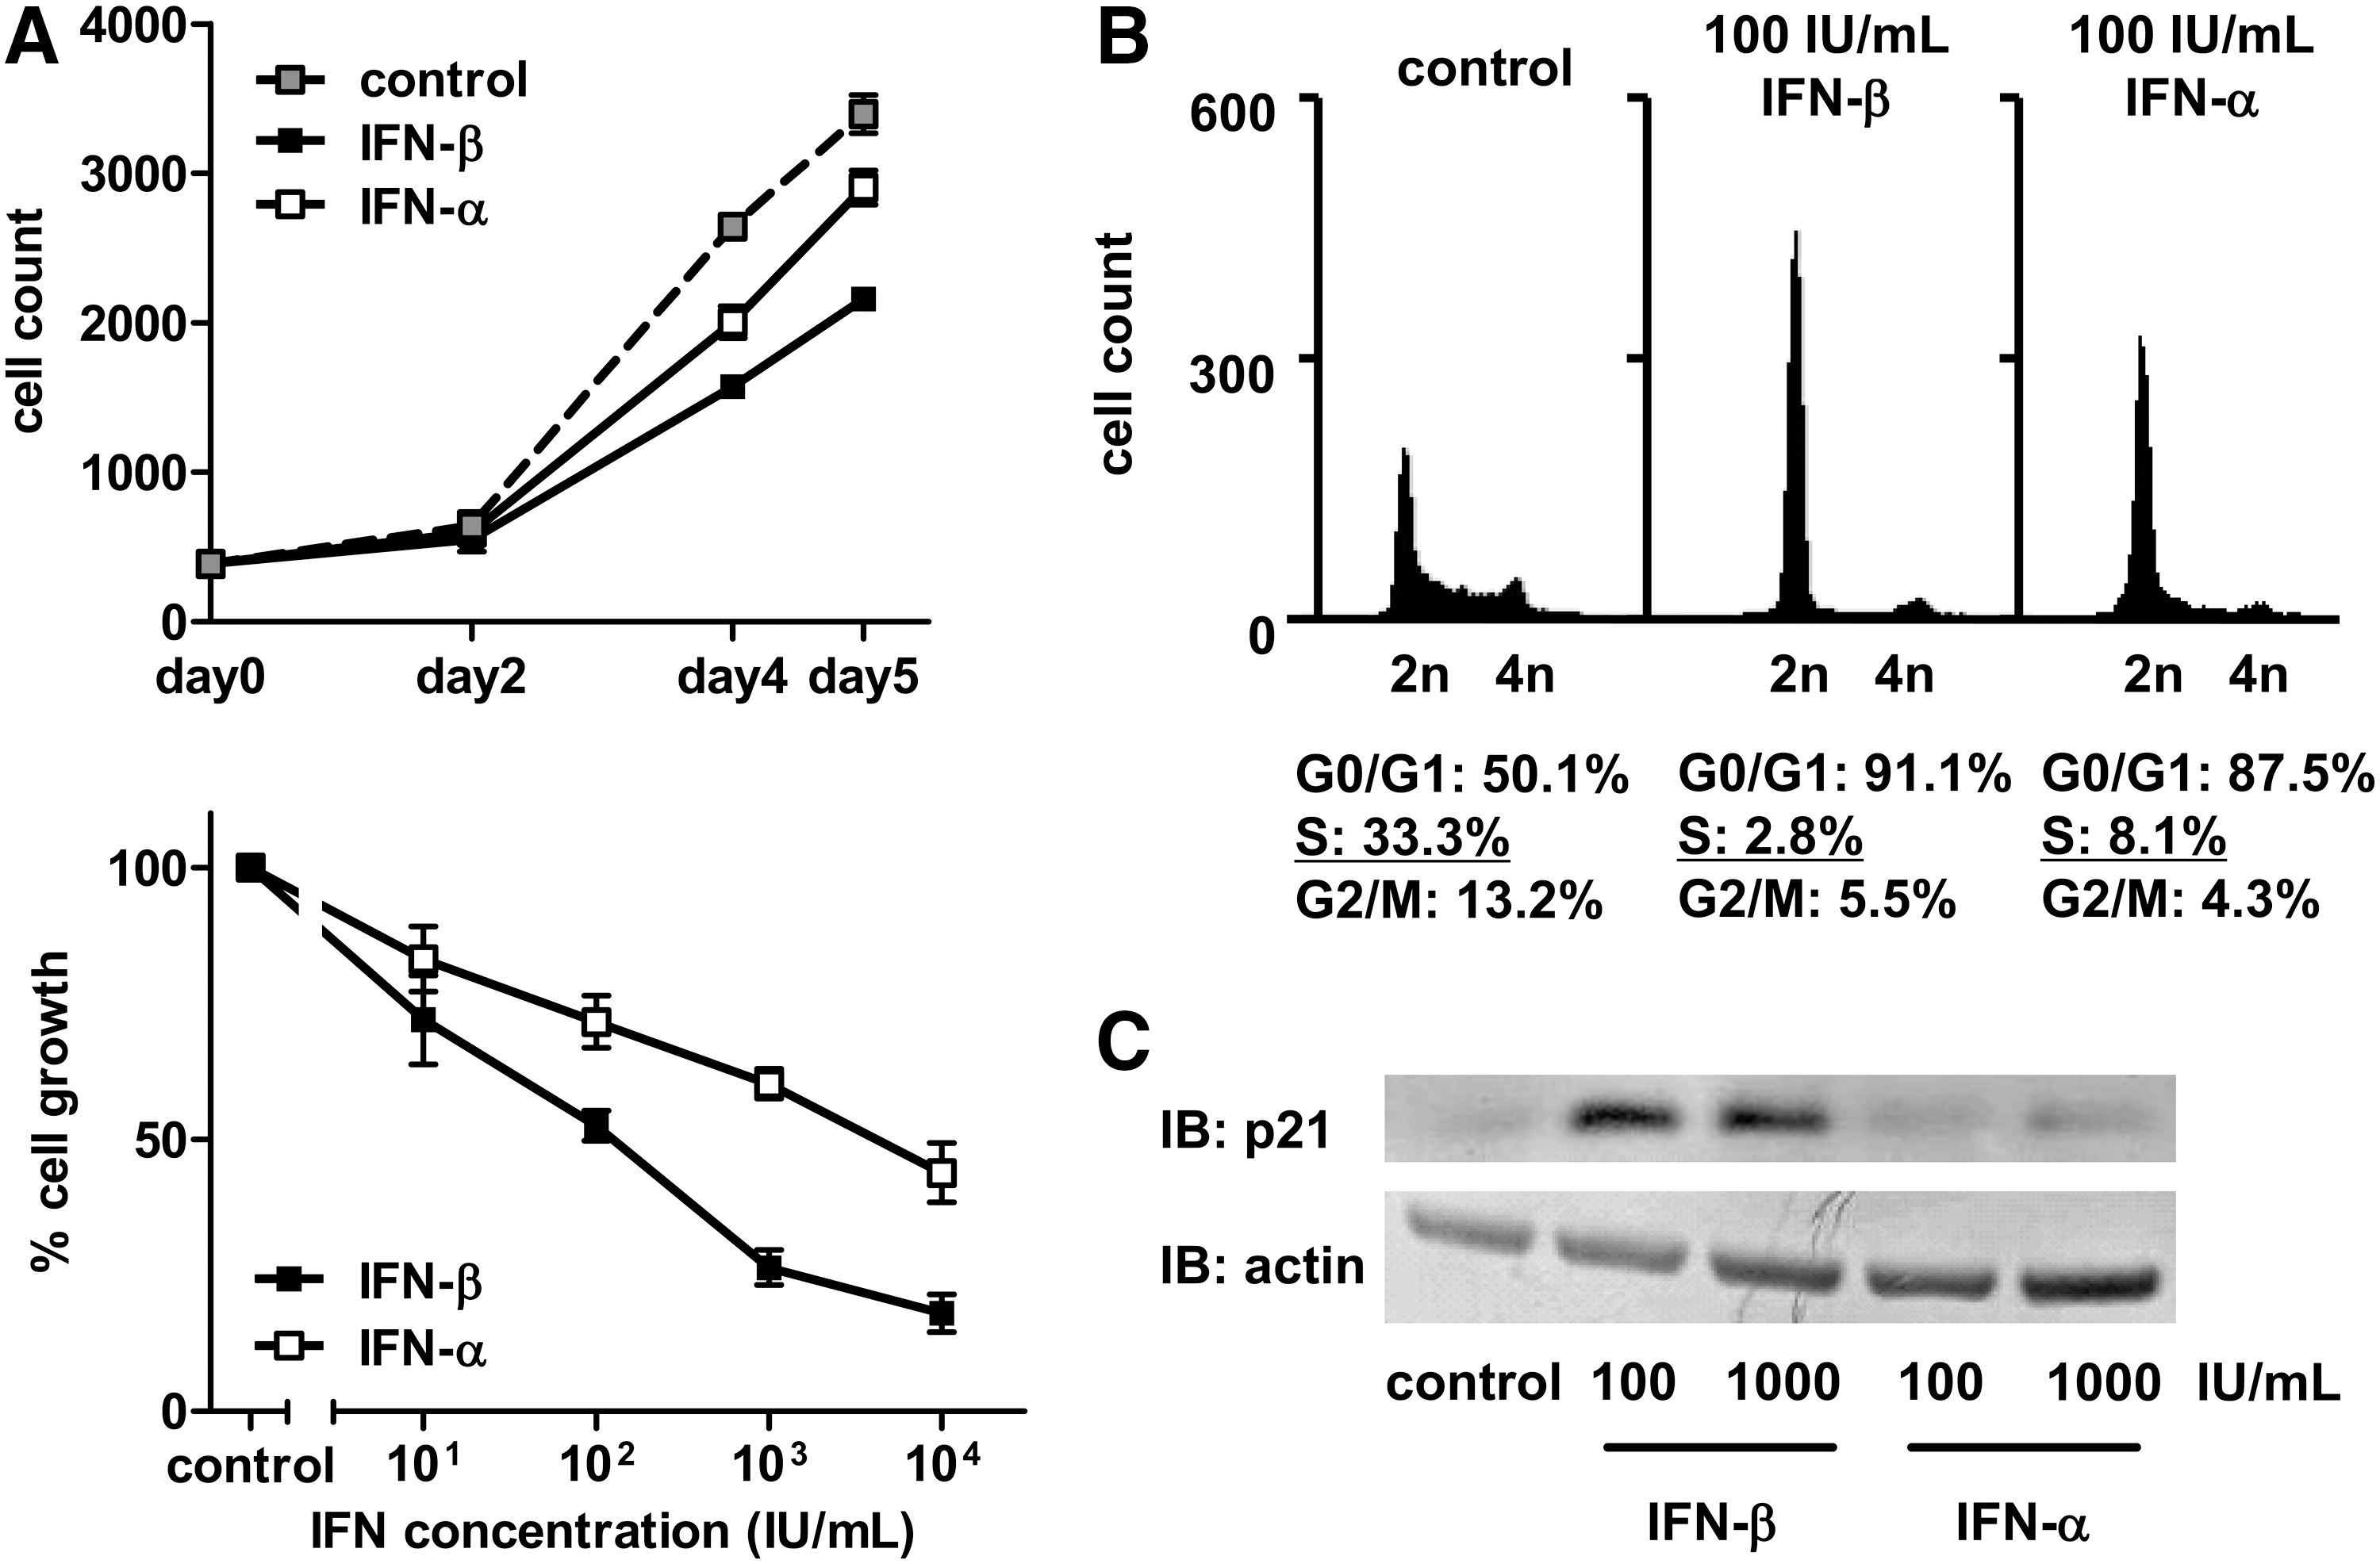
To investigate the antifibrotic effects of type I IFNs on TWNT-4 cells, we first evaluated the effects of IFNs on the cell proliferation. While both IFN-β and IFN-α decreased cell proliferation at a concentration of 100 IU/mL, IFN-β was the more potent of the 2 (Fig. 1A, upper). A dose–response experiment also showed that IFN-β had a more potent antiproliferative effect on TWNT-4 cells than IFN-α (Fig. 1A, lower). This finding was based on the 50% inhibitory concentration (IC50) value, which calculated with linear extrapolation from the values above and below the inhibition threshold was 1.25×10² IU/mL for IFN-β and 4.21×10³ IU/mL for IFN-α. This finding was confirmed in LI 90 cells, the parental cell line of TWNT-4 (Supplementary Fig. S1).
IFN sensitivity profiling of TWNT-4 cells.
Difference in the effect on G1 cell cycle arrest contributes to antiproliferative effect of IFNs in TWNT-4 cells
To analyze the mechanism of the antiproliferative effect of IFNs in TWNT-4 cells, the cell cycle distribution was determined. IFN-β treatment significantly decreased the S phase and the following G2/M phase population at 24 h after treatment; furthermore, the S phase population in the cells treated with IFN-β was smaller than in the cells treated with IFN-α at 24 h (Fig. 1B). We next tested for expression of a key regulator of the G1-S transition, p21/WAF1/CIP1 (Howe and others 1993), and observed increased expression of the p21 protein compared with the control preferentially induced by IFN-β, but not IFN-α (Fig. 1C). Together, these results indicate that IFN-β is superior to IFN-α in terms of induction of G1 arrest through an increase in p21, which is a mechanism that contributes to the antiproliferative effect of IFNs.
IFN-β alters gene expression profiles of TWNT-4 cells substantially more than IFN-α does, and in a different manner
Using a highly sensitive DNA chip, 3D-Gene (Nagino and others 2006), DNA microarray analyses were performed to characterize the type I IFN-induced gene alterations in HuH-7 and TWNT-4 cells and to compare differences between cell types. In HuH-7 cells, similar differential gene expression profiles were obtained in both IFN-β and IFN-α treatments (Fig. 2A, upper). In contrast, there was a striking difference in the number of genes altered between the IFN-β and IFN-α–treated TWNT-4 cells (Fig. 2A, lower), which indicates that there are various genes that are preferentially regulated by IFN-β in the cells. Genes that increased or decreased more than 1.5-fold were defined as having been altered. There were 2,083 and 1,947 differentially expressed genes in the IFN-β and IFN-α–treated HuH-7 cells, and 3,864 and 2,547 genes in the IFN-β and IFN-α–treated TWNT-4 cells, respectively.

IFN-induced gene alteration profiles of HSC line or hepatocellular carcinoma cell line.
Pathway prediction reveals IFN-β–mediated signaling pathways that are uniquely regulated in TWNT-4 cells
To further characterize the effects of IFN-β and IFN-α on the canonical signaling pathway in both cells, these altered genes were sorted based on gene ontology using GeneGo Pathway Maps, and the statistically significant gene maps (false discovery rate <0.003) are listed in Table 1. They were categorized into common or similar pathways (No. 1–5) and unique pathways (No. 6–48), and the former included an antiviral pathway of IFNs (No. 4). The expression of the gene set constituting No. 4 was examined (Fig. 2B), revealing gene induction patterns almost identical to those in HuH-7 cells. In TWNT-4 cells, there were many quantitative or qualitative differences between IFN-β and IFN-α treatments. While the overall level of gene induction by IFNs tended to be weak, IFN-β altered gene expression levels more dynamically than did IFN-α in HuH-7 cells.
FDR, false discovery rate; IFN, interferon.
When unique pathways were of interest, of particular note was the fact that there were various unique pathways of IFN-β (No. 9–43) and IFN-α (No. 44–48) identified in TWNT-4 cells. This indicates that each IFN regulates individual signaling pathways in HSCs. Among pathways unique to IFN-β, a pathway with relevance to the cell cycle (No. 29) was identified, in which expression of the p21 gene was increased (1.89-fold) by IFN-β, as well as that of the p21 protein (Fig. 1C). This finding supports the quantitative difference in effects of IFNs on G1 cell cycle arrest in TWNT-4 cells, as demonstrated by flow cytometer analyses (Fig. 1B). Furthermore, many of the pathways unique to IFN-β (No. 9, 10, 17, 19, 20, 24, 30, 33, 39, and 41) were related to common signaling through Toll-like receptor 4 (TLR4), including IFN-β–induced increased expression of the TLR4 gene (2.14-fold), with an associated increase in gene expression of the TLR4 adaptor molecule myeloid differentiation primary response 88 (MyD88), which was also increased (1.84-fold) by IFN-β.
IFN-β exerts histopathological antifibrotic effect in the livers of mice in a NASH model
To provide fundamental information on hepatocellular damage, we performed biochemical liver function tests and confirmed mild elevation of plasma aminotransferase (ALT and AST) levels in CDAA control mice. The mice on a CDAA diet that received IFN-β showed substantially lower levels of ALT and AST, although these changes were not statistically significant (Table 2). On histopathological examination, CDAA control mice, fed a CDAA diet for 8 weeks, exhibited liver fibrosis with occasional bridging between the centrilobular and periportal areas (Fig. 3A, B) and ∼4.5-fold augmentation of the area compared with naive mice fed a normal diet (1.45% and 0.32%, respectively) (Fig. 3C). This augmentation was considerably reduced by administration of IFN-β (0.57%), whereas IFN-β did not affect the level of fibrosis in the liver of naive mice (0.29%) (Fig. 3C).

Antifibrotic efficacy of IFN-β verified by histopathological evaluation of the livers of mice in a NASH model.
ALT, alanine aminotransferase; AST, aspartate aminotransferase; CDAA, choline-deficient
IFN-β downregulates expression of fibrogenic and MyD88 genes in the livers of mice in a NASH model
To investigate the molecular mechanism of IFN-β antifibrotic properties, we examined the levels of expression of genes for fibrogenic mediators, including collagen α1(I) (COL1A1), collagen α1(IV) (COL4A1), and transforming growth factor-β1 (TGF-β1). The expression of all of these genes was elevated in the livers of mice on a CDAA diet compared with naive mice. However, administration of IFN-β significantly attenuated gene expression of COL1A1 and COL4A1 in the livers of mice on a CDAA diet, whereas there was no significant difference in gene expression of TGF-β1 between CDAA control mice and those on a CDAA diet given IFN-β (Fig. 4A–C). Expression of TLR4 and MyD88 genes was also measured to demonstrate the involvement of TLR4 signaling. CDAA control mice showed higher gene expression of both TLR4 and MyD88 in the liver than naive mice, supporting previous studies that used mouse models of NASH (Kawaratani and others 2008; Velayudham and others 2009). In contrast, the level of expression of the MyD88 gene in the livers of mice on a CDAA diet given IFN-β was equal to that of naive mice (Fig. 4E). Lower expression of the TLR4 gene was also observed compared with that in CDAA control mice, although the change was not statistically significant (Fig. 4D). In the livers of naive mice, administration of IFN-β did not affect expression of any fibrogenic gene of interest, whereas there was slight, but significant, upregulation of expression of TLR4 and MyD88 genes (Fig. 4A–E).

Transcriptional regulation of fibrogenic and TLR4 signaling-related genes by IFN-β in the livers of mice in a NASH model. Total RNA was isolated from the livers of mice described in the legend of Fig. 3, and then real-time quantitative polymerase chain reaction was performed. The results shown represent the mean±SEM (n=3–5) of the gene expression of COL1A1
Discussion
As HSCs display 2 phenotypes, quiescent and myofibroblastic-activated states, it is important to use cells resembling a phenotype of activated HSCs to evaluate the effects of type I IFNs on hepatic fibrosis in vitro. TWNT-4 cells have been reported to exhibit the characteristics of activated HSCs, including fibroblastic morphology and expression of platelet-derived growth factor β receptor, α smooth muscle actin, and COL1A1 (Shibata and others 2003). In this study, we demonstrated that IFN-β inhibited TWNT-4 proliferation more potently than IFN-α through G1 cell cycle arrest, supporting previous studies using rat primary HSCs or other human HSC lines (Shen and others 2002; Sekiya and others 2011). In addition, induction of the p21 protein by IFN-β was detected in TWNT-4 cells, whereas no induction by IFN-α was detected at concentrations up to 1,000 IU/mL, which indicates that TWNT-4 cells are suitable for the investigation of the molecular biological characteristics of IFNs as well as their differences.
For comparative DNA microarray analyses of the effects of type I IFNs on TWNT-4 cells, we selected HuH-7 cells as an appropriate HCC cell line as this has been reported to be more sensitive to IFN-β than IFN-α (Murata and others 2006; Damdinsuren and others 2007). Our DNA microarray analyses revealed that gene expression in TWNT-4 cells was altered more substantially by IFN-β than by IFN-α, and more so than in HuH-7 cells. This finding indicates that HSCs are very sensitive to IFN-β, and that in HSCs, particular pathways are preferentially and selectively modulated by IFN-β. To enhance the credibility of the microarray data, qPCR is useful to independently validate the gene expression changes detected on the microarray. In the case of pathway enrichment analyses conducted in numerous genes, however, qPCR analysis of each gene expression is basically impractical. Therefore, the transcript abundance of interferon-induced protein with tetratricopeptide repeats 2 (IFIT2), as a representative, was measured using the same RNA samples used on the microarray. It was clearly demonstrated that the IFIT2 gene was differentially expressed by qPCR and had similar fold changes to those detected in the microarray (Supplementary Fig. S2). In addition, IFN-β and IFN-α with the same international units of activity would appear to have equivalent antiviral efficacy in HuH-7 cells because of their very similar gene induction pattern of antiviral molecules, which implies that the different gene expression patterns in TWNT-4 cells treated with IFN-β and IFN-α are of significance.
The TLR4 signaling pathway, which is a part of many of the pathways unique to IFN-β–treated TWNT-4 cells, is known to have an important role in regulating fibrogenic responses. A previous study that used HSCs revealed that the TLR4 ligand lipopolysaccharide (LPS) activates inflammatory signals in HSCs through their high expression of TLR4, enhancing HSC activation and fibrosis (Seki and others 2007). Therefore, it is possible that the direct antifibrotic activity of IFN-β is at least partly attributable to modulation of TLR4 signaling in HSCs. Based on this insight, we focused on NASH-related fibrosis to demonstrate the antifibrotic effect of IFN-β using an animal model. The pathogenesis of NASH has not been well understood; however, it can be considered the hepatic manifestation of the metabolic syndrome, and hence NASH is probably the most common cause of hepatic fibrosis worldwide and linked with the increased global prevalence of obesity. Regarding an association between NASH and TLR4 signaling, serum levels of LPS were elevated in NASH patients (Farhadi and others 2008), presumably due to systemic inflammation partly resulting from an overgrowth of gut microflora and increased intestinal permeability (Miele and others 2009).
The CDAA diet-induced mouse model of NASH has been previously demonstrated to represent human NASH by sequentially producing steatohepatitis and liver fibrosis (Denda and others 2002; Kodama and others 2009). Our histopathological examination showed that mice had slight, but significant, fibrosis as a result of being fed a CDAA diet for 8 weeks. Although the feeding period was shorter than that commonly used to validate fibrosis, 20 weeks or more (Denda and others 2002; Kodama and others 2009), we believe it was still long enough to allow a satisfactory statistical evaluation of the effect of IFN-β. IFN-β attenuated development of histopathological fibrosis in the CDAA diet-induced mouse model of NASH at a dose of 104 IU/body. This is important as it is approximately the same dose used in clinical practice (6×10⁶ IU/body), and IFN-β treatment may represent a new therapeutic option for patients with NASH.
It is well known that hepatic injury is largely responsible for the progression of liver fibrosis through accelerated inflammatory responses and follows the activation of HSCs. In this study, the hepatoprotective effect of IFN-β appeared to be absent or weak as manifested by levels of plasma aminotransferases, indicators of hepatocellular damage. Therefore, the detected attenuation of liver fibrosis with IFN-β administration is more likely to result from direct action on HSCs by IFN-β. Meanwhile, given that preventive treatment with IFN-β reduces hepatic injury induced by Con A (Tanabe and others 2007), the possibility remains that the hepatoprotective effect of IFN-β on the NASH model may be detectable using a different regimen. In fact, the preliminary examination had suggested that feeding a CDAA diet for 4 weeks (just before administration of IFN-β in this experimental design) is enough to induce elevation of plasma aminotransferase levels to the plateau phase (unpublished observation) and hence to establish chronic hepatic injury. IFN-β treatment might show a hepatoprotective effect even during the advanced stage of hepatic injury in the NASH model, which would suggest that it probably achieves its antifibrotic effect in an additive manner.
Analyses of fibrogenic gene expression suggest that IFN-β exerts an antifibrotic effect through downregulation of collagen molecules at the transcriptional level. Expression of the TGF-β1 gene did not seem to be affected by IFN-β; in contrast, COL1A1 and COL4A1 have been reported to be common TGF-β1 target genes (Verrecchia and others 2001; Castro and others 2014). These results indicate that IFN-β downregulates fibrogenic gene expression in a TGF-β1–independent manner or that IFN-β modulates protein levels of TGF-β1 in some way. However, the possibility remains that a transient reduction in expression of the TGF-β1 gene was not detected due to the regimen used, in which the liver was removed 3 days after the last administration of IFN-β.
There is considerable evidence that suggests positive regulation of MyD88 by IFN-β in several kinds of cells, including endothelial cells, melanoma cells, and macrophages (da Silva and others 2002; Leaman and others 2003; Thomas and others 2006), supported by the result of our microarray analyses. In addition, in vivo induction of hepatic MyD88 gene expression was observed in naive mice as late as 3 days after the last administration of IFN-β. Strikingly, administration of IFN-β to mice with NASH attenuated the gene expression of MyD88 to the naive level, which seems to be at variance with the above-mentioned results. It is possible that these findings might reflect unconventional activity of IFN-β under the pathological condition in liver fibrosis associated with NASH; however, they are more likely due to a decrease in the population of cells with high expression of the MyD88 gene in the liver of mice with NASH. Taking into account that overexpression of MyD88 induces apoptosis (Aliprantis and others 2000), IFN-β might trigger apoptosis when signals of MyD88 exceed a certain threshold through an additive induction on gene expression of MyD88 in the liver of mice with NASH. It is also possible to interpret this finding in light of the antiproliferative effects of IFN-β.
An experimental study using the CDAA diet model showed that MyD88 deficiency protects against NASH-associated liver fibrosis (Miura and others 2010). Another published study indicates that MyD88-deficient HSCs are completely resistant to LPS-mediated downregulation of bone morphogenic protein and activin membrane-bound inhibitor (Bambi), a TGF-β pseudoreceptor (Seki and others 2007). Taking these data into consideration, IFN-β might lead to a situation where only HSCs with low expression of MyD88 remain in the liver of mice with NASH, which promotes efficient induction of Bambi and inhibition of TGF-β–mediated hepatic fibrogenesis. It is particularly noteworthy that our microarray analyses indicated induction activity of IFN-β on the Bambi gene expression in TWNT-4 cells (2.44-fold); for comparison, no increase was detected in IFN-α–treated TWNT-4 cells, IFN-β, and IFN-α–treated HuH-7 cells (1.04-, 0.88-, and 0.86-fold, respectively). To account for these findings, we propose a bidirectional mechanism of positive regulation of the Bambi gene expression by IFN-β consisting of inhibition of downregulation and induction of upregulation. In this study, we tried to detect both a decrease in gene expression of Bambi, which is thought to occur in HSCs associated with the occurrence of liver fibrosis in mice with NASH, and any recovery effect induced by IFN-β, but found that neither is detectable (unpublished observation). These observations suggest that analysis using whole liver could not identify variation in the expression of Bambi in HSCs. Therefore, further investigations, including cell fractionation analysis, are necessary to confirm whether IFN-β can induce Bambi expression in HSCs of mice with NASH.
Collectively, this study provides the first evidence to show the ability of IFN-β to suppress NASH-related liver fibrosis with accompanying transcriptional downregulation of MyD88. In addition, in vitro investigations using TWNT-4 indicate that the antifibrotic activity of IFN-β is attributable to preferential actions on TLR4 signaling and cell proliferation in activated HSCs. Future studies drawing upon the novel findings of this study and taking a closer look at the IFN-β signaling pathway could lead to a potential strategy to improve NASH-related hepatic fibrosis.
Footnotes
Acknowledgments
This work was supported by a grant from the Ministry of Health, Labour and Welfare of Japan to N. Kawada (2008–2010). The authors would like to express their sincere thanks to Dr. Naoya Kobayashi (Okayama Saidaiji Hospital, Okayama, Japan) for his valuable comments regarding this study.
Author Disclosure Statement
No competing financial interests exist.
References
Supplementary Material
Please find the following supplemental material available below.
For Open Access articles published under a Creative Commons License, all supplemental material carries the same license as the article it is associated with.
For non-Open Access articles published, all supplemental material carries a non-exclusive license, and permission requests for re-use of supplemental material or any part of supplemental material shall be sent directly to the copyright owner as specified in the copyright notice associated with the article.