
Abstract
Langerhans cell histiocytosis (LCH) lesions are characterized by neoplastic CD1a+/Langerin+ histiocytes (LCH-cells) and display many features of chronic inflammation. Cancer cells can escape immune-surveillance through intra-tumoral secretion of immune-suppressive cytokines. We therefore studied by immunohistochemistry the local cytokine milieu and phenotypic characteristics of T-cells and LCH-cells present in LCH lesions collected from 25 therapy naïve patients. LCH biopsies predominantly expressed interleukin-10 (IL-10) (10/25), transforming growth factor-beta (TGF-β) (9/25), or both cytokines (6/25). The absolute number of CD3+T-cells and the CD3+FOXP3− conventional cell (T-CONV) versus the CD3+FOXP3+ regulatory T-cell (T-REG) was comparable for each suppressive cytokine profile (5:1). IL-10-expressing lesions contained, however, a higher proportion of T-CONV expressing the activation markers CD25 98% (38%–100%) and inducible costimulatory molecule (ICOS) 86% (47%–100%) than lesions wherein solely TGF-β was detected (CD25+ 20% (6%–54%); ICOS+ 29% (7%–51%)). Virtually all T-REG expressed CD25 and ICOS in IL-10 lesions, whereas TGF-β+ lesions contained a lower proportion of ICOS+ T-REG (P=0.05). IL-10+ lesions contained more LCH-cells expressing high intensity of ICOS ligand (ICOSL) compared with TGF-β+ lesions (P=0.03). ICOS expression by lesion-infiltrating T-CONV and T-REG positively correlated to the extent of ICOSL expression by LCH-cells (P=0.004). Our study points out that the combined detection of interlesional IL-10 and ICOSL expression by LCH-cells is associated with the highest prevalence of activated T-CONV. Immune profiling of LCH-affected tissues obtained at the time of diagnosis may set the stage for the development of new types of therapies, which aim at local boosting of immune cells that recognize and eliminate neoplastic LCH-cells.
Introduction
T
The microenvironment of LCH lesions is composed of different types of cytokines and immune cell types like macrophages, eosinophilic granulocytes, multinucleated giant cells, and T-cells (Schmitz and Favara 1998; Egeler and others 1999; Annels and others 2003; da Costa and others 2005; Senechal and others 2007). Different subtypes of lesion-infiltrating T-cells have been detected in these lesions such as CD3+FOXP3− conventional T-cells (T-CONV) and CD3+FOXP3+ regulatory T-cells (T-REG). The T-cells appear to interact with LCH-cells in situ as visualized by immunohistochemistry (Egeler and others 1999; Senechal and others 2007). The impact of this interaction on the activation status and effector function of lesion-infiltrating T-CONV is, however, still unclear.
Lesion-infiltrating T-cells are not naïve but rather appear to function in situ as end-stage differentiated effector type cells as they proliferate, express CD45RO, and produce a variety of cytokines (Egeler and others 1999; Annels and others 2003; Senechal and others 2007). Noteworthy, T-CONV acquire these functions after “cross-talk” with professional antigen-presenting cells (APC) and proper T-cell receptor ligation and co-stimulation. T-CONV only express the inducible co-stimulatory molecule (ICOS) after this initial T-cell activation step has occurred (Hutloff and others 1999; Greenwald and others 2005; Ito and others 2008). The interaction between ICOS+ T-cells and ICOS ligand (ICOSL)-expressing professional APC is necessary for both differentiation into cytokine-producing cells (Mesturini and others 2013), immune regulation (Akbari and others 2002; Frey and others 2010), and the induction of antitumor-directed immune responses (Strauss and others 2008; Frey and others 2010; Martin-Orozco and others 2010). This interaction can, however, also lead to immune evasion by tumor cells (Martin-Orozco and others 2010; Conrad and Gilliet 2013; Esendagli 2013; Faget and others 2013). The dual role of ICOS-ICOSL in tumor immunity suggests that the net outcome of ICOS-costimulation is determined by the microenvironment in which the T-cell becomes activated.
A subtype of ICOS-expressing human T-REG has earlier been identified (Ito and others 2008). While ICOS+ T-REG mainly act via the production of interleukin-10 (IL-10), ICOS− T-REG exert their regulatory function solely through the release of TGF-β (Ito and others 2008). IL-10 and TGF-β both facilitate T-REG generation and expansion in vitro and are capable of direct suppression of T-CONV function (Rao and others 2005). The local production of these immunosuppressive cytokines by LCH lesion-infiltrating T-cells and macrophages has already been reported. Noteworthy, IL-10 or TGF-β have only been detected in a proportion of LCH lesions studied thus far (de Graaf and others 1996; Egeler and others 1999; Geissmann and others 2001; Senechal and others 2007; Ohnishi and others 2010). Likewise, the in situ presence of T-CONV and T-REG expressing CD25 and FOXP3 has been reported (Egeler and others 1999; Annels and others 2003; Senechal and others 2007).
We investigated the impact of the local cytokine milieu in relation to ICOSL expression by LCH-cells and the composition of the concurrent T-cell infiltrate and whether any of the immune signatures is associated with a better clinical outcome.
Materials and Methods
Patient materials
Formalin-fixed-paraffin-embedded (FFPE) biopsies from 25 therapy-naïve LCH patients were included in this study. Confirmation of LCH diagnosis was established by clinical symptoms and histopathological evaluation of biopsied tissues. All LCH-affected tissue blocks contained >5% CD1a+ and Langerin+ histiocytes as visualized by routine immunohistochemical staining. Based on the available clinical reports, the patients were stratified by affected site [bone, lymph node (LN) and skin] and by disease manifestation (i.e., mono-ostotic, single-system, poly-ostotic, and multi-system LCH). LCH reactivation was defined as the development of an additional LCH lesion manifesting at another site than the (successfully treated) primary lesion. Clinical follow-up was incomplete for 4 patients, who were excluded from the survival analysis. Patient characteristics are shown in Table 1. This study is part of study protocol P-10.163, which was approved by the Medical Ethics Committee of the Leiden University Medical Center. Research was conducted following the ethical guidelines of the national organization of scientific societies (FEDERA). All participants, or their parents in the case of patients below the age of 18 years, provided verbal or written consent, which was registered in the patient's files and/or in informed consent forms.
The mean age of onset of patients displaying bone LCH lesions, LN involvement or skin lesions is 11.4, 4.0, and 16.5 years respectively; male to female ratio is 7:4. Follow-up data were available for 21 patients, which varied from 65 days to 19 years after primary diagnosis, with a median follow-up time of 10 years.
Follow-up data was available for less than 1.5 years after diagnosis but no signs of reactivation were observed in this follow-up period.
UPN indicates unique patient number; diagnosis is referred to as single system (SS), multi system (MS), mono ostotic (MO), poly ostotic (PO); ST, steroids; CHT, chemotherapy; RDT, radiotherapy; RE, resection; N.A., not available; IL, interleukin-10; LAP, latency-associated peptide; LCH, Langerhans cell histiocytosis; LN, lymph nodes; TGF-β, transforming growth factor-beta.
Immunohistochemical and immunofluorescent staining of LCH biopsies
Four micrometer FFPE tissue sections deposited on coated glass slides were dried overnight at 37°C and stored at 4°C. Selected slides were preheated for 1 h at 63°C and deparaffinized in xylol. Immunohistochemical (IHC)-designated tissue sections were submerged in methanol/0.03% H2O2 for blocking endogenous peroxidase activity where after all sections were rehydrated in ethanol and rinsed in demi water followed by antigen retrieval in boiling citrate buffer pH 6.0 or EDTA buffer pH 8.0 for 12 min. Sections were incubated with/without 10% goat serum for 30 min and incubated overnight with antibodies specific for CD1a, CD3 (Uhlig and others 2006) (DAKO, Glostrup, Denmark), CD25 (Tantibhaedhyangkul and others 2009), CD4 (Tantibhaedhyangkul and others 2009) (Novocastra, Newcastle upon Tyne, UK), ICOS (AF169), latency-associated peptide (LAP) (AB-246-NA) (Dasgupta and others 2006) (R&D Systems, Minneapolis, MN), FOXP3 (22510) (Tzankov and others 2008), IL-10 (ab34843) (Battistella and others 2010; Zhang and others 2011) (Abcam, Cambridge, UK), IL-10 (HP9016) (Hycults Biotech, Uden, The Netherlands), or Langerin/CD207 (929F3.01) (Imgenex, San Diego, CA) all diluted in phosphate-buffered saline (PBS)/1% bovine serum albumin (BSA). Immunofluorescent (IF)-designated tissue sections were incubated for 30 min with secondary antibodies bound to Alexa fluorochromes 488, 546 or 647 (Invitrogen, Grand Island, NY), washed, and mounted with moviol (homemade). Images were recorded by a fluorescent microscope (DM5500B; Leica Microsystems, Rijswijk, The Netherlands) (40× original magnification).
For IHC-based visualization of Langerin-positive cells, alkaline phosphatase-conjugated AffiniPure F(ab′)2 fragment goat-anti-Rat IgG was applied and developed with Vector Blue substrate (Burlingame, CA). Hereafter, sections were again placed in boiling citrate buffer pH 6.0 for 10 min, incubated with ICOSL-specific antibodies (2D3; Lifespan Biosciences, Seattle, WA) diluted in PBS/1% BSA where after Envision Poly-HRP goat-anti-mouse IgG (ImmunoLogic, Duiven, The Netherlands) was applied. LAP and IL-10-stained sections were directly incubated with HRP-labeled Bright-vision anti-rat-rabbit-mouse (ImmunoLogic). Bound HRP was developed with 3,3′-diaminobenzidine substrate (Dako, Glostrup, Denmark). Sections were briefly counterstained with hematoxylin (Kinipath, Duiven, The Netherlands) and mounted with Pertex (Leica Microsystems) or with Vectorshield.
Images were captured on a spectral imaging microscope (DM4000B; Leica Microsystems). Lesional IL-10 expression was visualized with 2 different types of antibodies, which gave identical staining results (data upon request). Control tissue slides were stained in parallel with the same secondary staining reagents and color-developing substrates, but the primary antibody was omitted (negative controls) (Faaij and others 2010; Schrevel and others 2012).
Statistical analysis
Each LCH biopsy was evaluated in a blinded fashion by 2 independent researchers (J.S.K. and W.T.Q.) for the (co)expression of IL-10 and LAP and classified according to the dominantly expressed cytokine: IL-10-predominant, TGF-β predominant, or dual IL-10/TGF-β in the case of comparable LAP and IL-10 expression. Using ImageJ (Javascript 1.44), the numbers of lesion-associated CD3+ T-cells were scored in at least 10 representative pictures (magnification 40×) taken from each biopsy. Given that LCH biopsies may differ from a few mm to several cm in size, the total number of each T-cell subtype was scored and the average number of cells per microscopic field and the percentage of T-cells expressing certain (surface) markers were calculated. Although, quantification of cell numbers in a few FFPE-tissue slides may not be as accurate as flowcytometric analysis performed on a single cell suspension prepared from the entire tissue biopsy, we demonstrate that quantifying proportions of lesion-infiltrating T-cells by IHC can be done in a reliable and objective manner. This is substantiated by data from 2 different blinded experiments, in which CD3 and FOXP3 were stained in combination with either CD25 or ICOS (Fig. 2A, B), where mean difference in the percentage of T-REG among the total number of CD3+T-cells was only 7.7% (P=0.31).
A combinatorial Ruiter scoring method was applied to semi-quantitatively assess the intensity of ICOSL expression and the percentage of ICOSL+ Langerin+ co-expressing LCH-cells (Ruiter and others 1998). While the staining intensity was classified as absent (0), weak (1), clear (2), or strong (3), the corresponding percentage of ICOSL+ LCH-cells was scored as (1) for 1%–5%, (2) for 6%–25%, (3) for 26%–50%, (4) for 51%–75%, and (5) for 76%–100%. A combination score of the intensity and percentage of ICOSL+ Langerin+ cells ranging between 2 and 6 was designated as moderate expression; a score of ≥7 was considered as strong expression (Ruiter and others 1998).
Statistical analysis was performed using Prism Graphpad 5.04 (Graphpad Software; La Jolla, CA). The non-parametric Mann–Whitney test was applied to compare the cellular distribution among the different cytokine profiles and among lesions with a different extent of ICOSL expression. Correlations between LCH-reactivation and the cellular subsets or cytokine profiles were analyzed using Kaplan–Meier analysis and logrank test. A P value of <0.05 was considered as statistically significant.
Results
The prototypic immunosuppressive cytokines IL-10 and TGF-β are expressed in LCH lesions
A panel of 25 LCH-affected biopsies was stained with antibodies specific for either IL-10 or LAP. The latter strategy was chosen since LAP protein noncovalently associates with inactive TGF-β1-complexes at the cellular membrane preceding the release of active TGF-β1 from the cell (Khalil 1999; Annes and others 2003). Hence, LAP-specific immunostaining can be seen as a surrogate marker for TGF-β1 production and release.
Various cell types present in LCH lesions stained positive for either cytokine, varying from small lymphoblastic cells embedded in IL-10 enriched areas to large histiocytic cells including multinucleated giant cells, which almost exclusively stained positive for LAP. The microenvironment of LCH lesions contained either predominantly IL-10 (10/25) (Fig. 1, upper and lower left photographs) or predominant TGF-β (9/25) (Fig. 1, upper and lower right photographs). Some lesions were classified as dual IL-10/TGF-β (6/25) as comparable staining for both cytokines was detected (Fig. 1, upper and lower photographs in the centre). None of the 3 cytokine profiles correlated with any particular affected site (P=0.38), type of LCH manifestation (P=0.74) or risk of LCH reactivation (P=0.35).

Langerhans cell histiocytosis (LCH) lesions display 3 distinct cytokine profiles. Diagnostic LCH biopsies were examined by standard immunohistochemistry for the expression of interleukin-10 (IL-10) (clone HP9016) (upper row) or active transforming growth factor-beta (TGF-β) using a latency-associated peptide (LAP)-specific antibody (bottom row). The brown color indicates the presence of specific cytokine. Representative examples of distinct cytokine profiles are indicated on top of each vertical row of pictures taken from the same (skin) lesion in the same area (magnification 20×). Insets depicted at the upper left corner of each photograph are a larger magnification of the indicated areas. The microenvironment of LCH lesions contained either predominantly IL-10 characterized by abundant expression of IL-10 with sporadic detection of LAP or predominant TGF-β classified by LAP expression while IL-10 was absent or sporadically detected. Some lesions were classified as dual IL-10/TGF-β as comparable staining for both cytokines was detected.
LCH lesions contain comparable numbers of CD3+ T-cells and LCH-cells regardless of the corresponding cytokine profile
The presence of IL-10 and/or TGF-β within the LCH microenvironment raises the question whether these immunosuppressive cytokines affect the number and phenotype of lesion-infiltrating T-cells and LCH-cells. The average number of Langerin+CD1a+ LCH-cells and CD3+ T-cells per microscopic field varied among the biopsies (LCH-cells: median 111; range 31–413; T-cells: median 29; range 8–154). They were, however, not associated with any of the 3 different suppressive cytokine profiles (P=0.27) or with any particular affected site or manifestation form (P=0.62). These data indicate that LCH-cells and T-cells were comparably distributed among the different cytokine profiles.
Activation of infiltrating conventional T-cells is restricted to IL-10 cytokine profiles
The effect of either IL-10 or TGF-β expression on the composition of the corresponding T-cell infiltrate was assessed. As published by others (Senechal and others 2007), discrimination between CD3+FOXP3− T-CONV and CD3+FOXP3+ T-REG was based on a dual IF staining technique, which visualizes membranous CD3 and nuclear FOXP3 expression on the same T-cell (Fig. 2A, B, magnified cells depicted in the lower right of Fig. 2A). Regardless of the type of immune suppressive cytokine present, all lesions contained comparable ratios of T-REG/T-CONV (1:5, Fig. 2D) and comparable average T-REG and T-CONV numbers per microscopic field (P=0.61, data not shown).
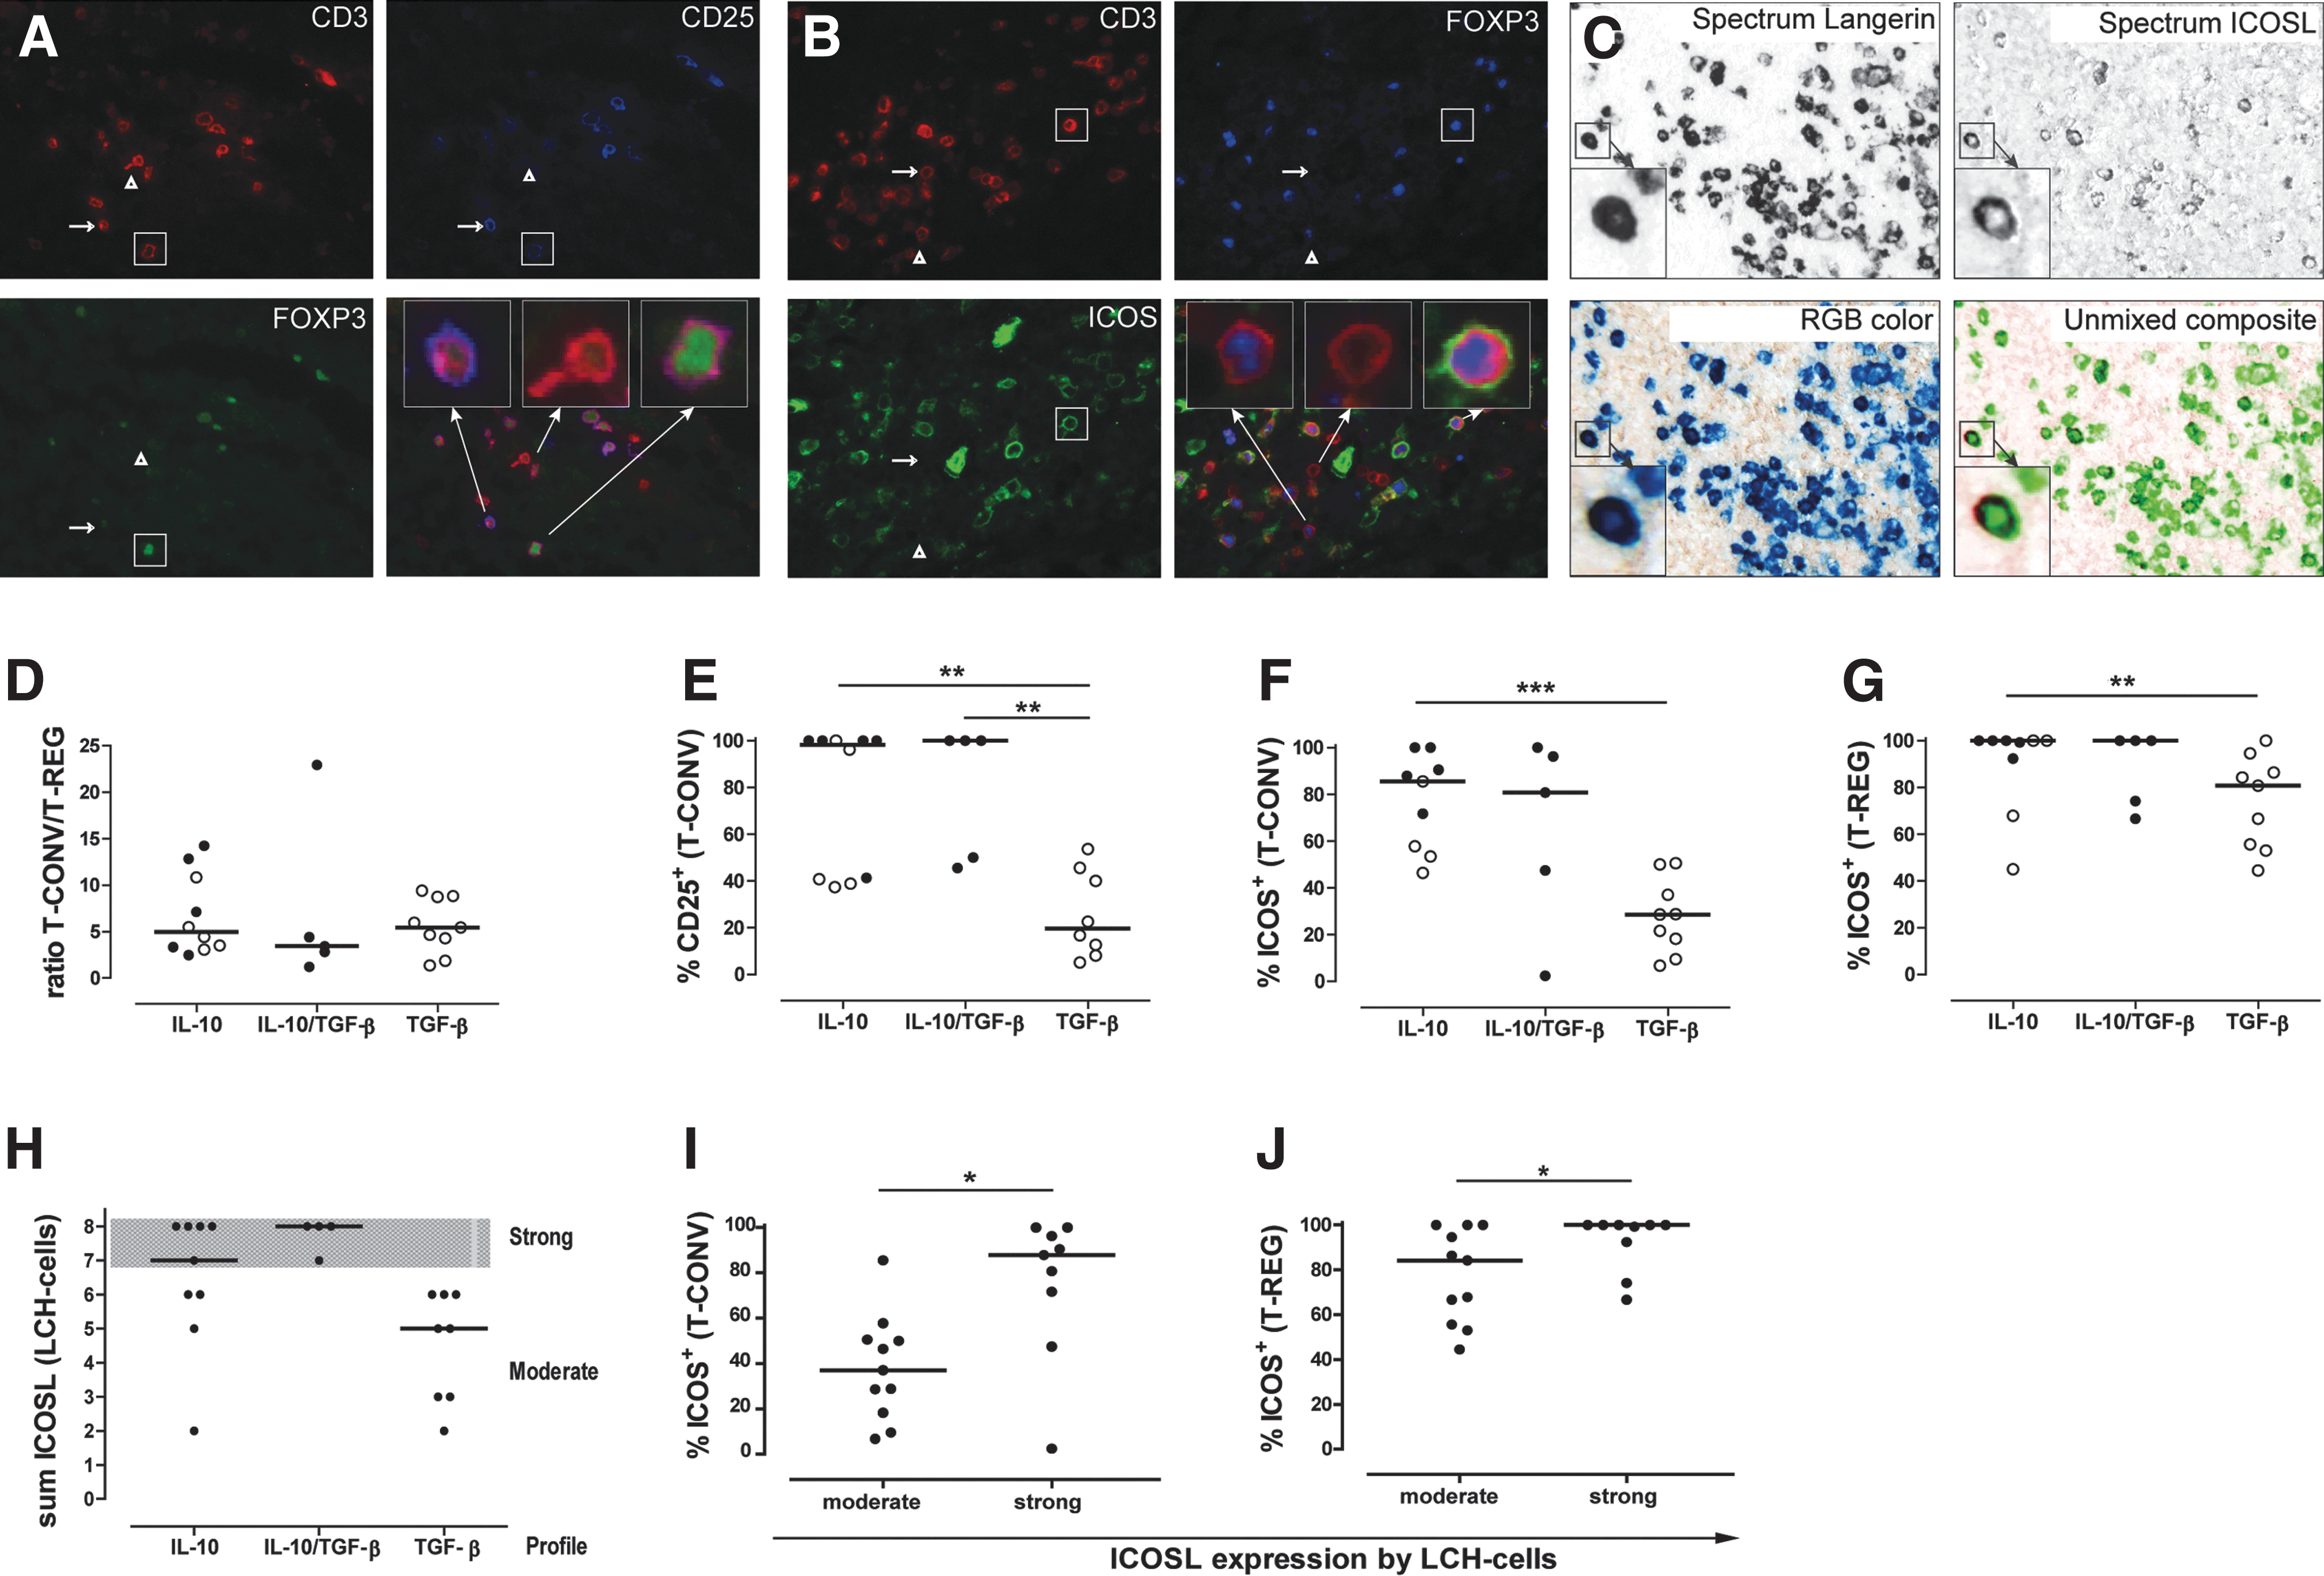
Detection of different T-cell phenotypes and inducible costimulatory molecule ligand (ICOSL)-expressing LCH-cells within LCH-lesions and correlation to the local cytokine environment. After triple IF staining of LCH lesions using antibodies specific for the pan T-cell marker CD3 in combination with the nuclear transcription factor FOXP3 and 2 different cell surface markers each LCH biopsy was scored and the percentage of T-cells expressing certain (surface) markers was subsequently calculated as represented in the following graphs. LCH lesions were additionally stained with antibodies against the LCH-cell-specific marker Langerin (upper left panel) in combination with ICOSL (upper right panel) to detect LCH-cells expressing ICOSL
The activation status of CD3+FOXP3− T-CONV cells was substantiated by the co-staining of the IL-2 receptor, CD25 (blue staining in Fig. 2A). A significant higher proportion of T-CONV expressing CD25 was prevalent in IL-10++ lesions (38%–100%) than in TGF-β++ lesions (6%–54%, P=0.008, Fig. 2E and Table 2). In contrast, all FOXP3+ T-REG expressed CD25 regardless of the corresponding cytokine profile (Table 2). Collectively, these data demonstrate that T-REG and T-CONV were present at comparable frequencies but IL-10+ lesions contained higher percentages of CD25+ T-CONV.
Absolute numbers (n) or percentages (%) of cells are defined as the median (range) of CD3+ FOXP3− T-CONV or CD3+ FOXP3+ T-REG in IL-10-predominant lesions, TGF-β-predominant lesions or lesions expressing both cytokines and in lesions with moderate or strong expression (sum) of ICOSL by LCH-cells; P values indicate the difference between IL-10-predominant lesions and TGF-β-predominant lesions or the difference between lesions with strong or moderate ICOSL expression.
P<0.05, ** P<0.01, or *** P<0.001.
The percentage of lesion-infiltrating ICOS+T-CONV cells and ICOS+T-REG varies according to the corresponding cytokine milieu
Following activation through T-cell receptor ligation, ICOS expression is upregulated by both T-CONV and T-REG (Hutloff and others 1999; Greenwald and others 2005; Ito and others 2008). Importantly, ICOS distinguishes 2 functionally different subtypes of human T-REG (Ito and others 2008). Similar to the expression of CD25, the expression of ICOS on T-CONV and T-REG was assessed for each of the 3 different cytokine profiles (Fig. 2B). Significantly higher numbers of ICOS+ T-CONV were observed in IL-10-predominant lesions (range 3–147) compared with TGF-β-predominant lesions (range 1–21) (P=0.006, Table 2). Likewise, the percentage of T-CONV expressing ICOS was higher in IL-10++ lesions than in TGF-β++lesions (P=0.0008, Fig. 2F and Table 2). While the absolute numbers of ICOS+ T-REG were comparable among the 3 different cytokine profiles (Table 2), the percentage of T-REG expressing ICOS was higher in IL-10-lesions than in TGF-β-rich lesions. The latter LCH lesions contained more ICOS− T-REG (P=0.05). In summary, CD25 and ICOS expressing T-CONV and ICOS+ T-REG are more prevalent in LCH lesions where IL-10 is secreted in the microenvironment.
ICOS expression by lesion-infiltrating T-cells correlates with the extent of ICOSL expression by LCH-cells
Re-exposure to ICOSL in situ may increase ICOS expression, which leads to enhanced cytokine production by T-CONV at their site of action (Beier and others 2000; Ito and others 2008; Martin-Orozco and others 2010). To determine whether ICOSL is expressed by LCH-cells a 2-step IHC staining with ICOSL and Langerin was applied (Fig. 2C). All LCH biopsies contained ICOSL+ Langerin+ LCH-cells, but the percentage of LCH-cells expressing ICOSL ranged from 1% to 100% with staining intensities varying from weak to strong expression levels. As explained in detail in the Materials and Methods section, the staining intensity of ICOSL on Langerin+ LCH-cells was combined with the percentage of ICOSL-expressing LCH-cells. While IL-10++ lesions were generally classified as strongly positive for ICOSL-expression (median Ruiter score of 7), TGF-β++ lesions contained moderately ICOSL-expressing LCH-cells (median Ruiter score of 5) (P=0.03, Fig. 2H and Table 2).
ICOSL expression had no impact on the absolute numbers of ICOS+ T-CONV and CD25+ T-CONV (P=0.22 and P=0.18, Table 2). In contrast, ICOSLhi LCH lesions contained higher percentages of T-CONV expressing ICOS (P=0.01, Fig. 2I and Table 2) and higher percentages of T-CONV expressing CD25 (P=0.006, Table 2). While the number of CD25+ T-REG were comparable (P=0.10, data not shown), these ICOSLhi lesions contained also significant higher numbers of ICOS+ T-REG (P=0.02, Table 2) and higher percentages of T-REG expressing ICOS (P=0.05, Fig. 2J and Table 2).
Taken together, we demonstrate that IL-10-predominant lesions are characterized by many ICOSLhi LCH-cells and high frequencies of ICOS expressing T-CONV and T-REG. In contrast, TGF-β-predominant lesions typically contain ICOSLmod LCH-cells and significantly fewer ICOS expressing T-CONV and T-REG.
Discussion
LCH is increasingly considered to be a neoplastic myeloid disorder with immunological features as reflected by the in situ presence of a large number of immune cells, which accompany the genetically aberrant myeloid LCH-cells. Phenotypical aspects of the immune signature of LCH lesions are not incorporated into therapy decisions. This is the first study demonstrating that, independent of tissue site or type of LCH manifestation, LCH lesions can be classified according to distinct expression profiles of 2 potent immune suppressive cytokines. The presence of IL-10 and TGF-β alone or in combination were found to correlate with the phenotypic makeup of LCH-cells and to the composition of the corresponding T-cell infiltrate.
The identification of these 3 distinct cytokine profiles fits well with the results from previous studies in which the authors failed to detect either TGF-β or IL-10 in 100% of the LCH lesions analyzed (de Graaf and others 1996; Egeler and others 1999; Geissmann and others 2001; Senechal and others 2007; Ohnishi and others 2010). Our data are also in accordance with previous studies demonstrating that IL-10 and TGF-β are mainly expressed by macrophages and LCH-cells while sporadically expressed by eosinophils and T-cells (de Graaf and others 1996; Egeler and others 1999; Senechal and others 2007; Ohnishi and others 2010). Indeed, co-localization of either cytokine with FOXP3 was rarely observed (data not shown).
Although BRAFV600E mutation bearing cancer cells secrete functional TGF-β (Riesco-Eizaguirre and others 2009), the BRAF-mutation status of LCH-cells did not correlate with any of the 3 immunosuppressive cytokine profiles (P=0.99, data not shown). Apparently, there are additional factors that drive intralesional cytokine release by LCH-cells. This study shows an association between the extent of ICOSL expression by LCH-cells, locally produced cytokines, and the activation status of co-present CD25+ICOS+ T-CONV; the latter cells were most prevalent in IL-10+ lesions, which contained ICOSLhi LCH-cells. It is, however, unknown whether intralesional IL-10 induces ICOSL on LCH-cells. Of note, tumor necrosis factor (TNF) has been shown to enhance ICOSL expression on conventional APC (Witsch and others 2002; Martin-Orozco and others 2010). However, no association between TNF and ICOSL expression on LCH-cells was observed in this sample set (P=0.85, data not shown).
Our data show that intralesional T-cells indeed function in situ as end-stage differentiated effector type T-cells producing a variety of T-cell-associated cytokines as earlier reported (Hutloff and others 1999; Greenwald and others 2005). Lesion-infiltrating T-cells are likely activated through T-cell-LCH-cell “cross-talk” as they have been found in close proximity (Egeler and others 2000; da Costa and others 2005) and LCH-cells express several key costimulatory molecules necessary for optimal T-cell activation (Egeler and others 2000; da Costa and others 2005). Thus, despite the presence of immunosuppressive IL-10, activated T-CONV do end up in these LCH lesions.
The various types of T-REG identified in this study, ie, ICOS+FOXP3+ and ICOS−FOXP3+ T-REG, all appear to thrive in either immunosuppressive milieu. We consider FOXP3+ T-cells as being bona fide T-REG since the vast majority (95%–100%) of these cells also co-express CD4 (data not shown) and CD25, which is in line with earlier reported T-REG phenotypes (Senechal and others 2007; d'Hennezel and others 2011; Sun and others 2011). Here, we observed comparable percentages of CD25+ T-REG among the total T-cell numbers [median 15 (range 1%–60%); mean 18%±12%] as reported previously (mean 18%±7%) (Senechal and others 2007). ICOS+ T-REG were more prevalent in IL-10++ lesions where ICOSLhi LCH-cells were detected. Although ICOSL+ melanoma cells promote the activation and survival of particularly ICOS+ T-REG (Martin-Orozco and others 2010), it is unknown whether ICOSL-expressing LCH-cells exhibit similar effects on ICOS+ T-REG.
While the average T-REG:T-CONV ratio was comparable between the different cytokine profiles, relatively more T-REG were observed in lesions containing a high percentage of ICOS+ T-CONV (P=0.0031, data not shown). This indicates that, as in most circumstances of immune homeostasis, an increased influx of activated T-CONV is counteracted by T-REG which tightly regulate local expansion of T-CONV to prevent excessive collateral damage (Jonuleit and Schmitt 2003). While immunohistochemistry is an excellent technique for visualizing nuclear FOXP3 expression, we can, however, not exclude the possibility that LCH lesions also contain recently activated T-cells, which transiently express FOXP3 but do not have a suppressive function (Tran and others 2007; Miyara and others 2009). Note that in vitro suppression assays are the test of choice to unequivocally demonstrate the suppressive function of FOXP3-expressing T-cells. Prospective collection of fresh biopsies to acquire sufficient numbers T-REG for functional analysis is, however, practically impossible given the low incidence of this rare disease.
None of the reported cytokine profiles in this study or any particular composition of the corresponding T-cell infiltrate was found to correlate with a favorable disease outcome. In fact, similar clinical outcomes were registered for patients displaying completely opposite lesional cytokine profiles. These observations may be explained by the fact that in our country it is common practice to deposit steroids in the biopsied tissue (Table 1). Given that steroids suppress the immune system in several ways, interactions between T-CONV and other APC present in the lesion are most likely disturbed by this therapeutic intervention. Nonetheless, our study shows that classification of new onset LCH lesions according to different immune signatures is feasible. Extended immune profiling of biopsied tissues may set the stage for the development new types of therapies, which aim at local activation of immune cells.
Footnotes
Acknowledgments
The authors thank Dr. M.W. Schilham from the Department of Pediatrics, Leiden University Medical Center and Dr. S. van Vliet (Department of Molecular Cell Biology and Immunology, VU University Medical Center, Amsterdam, The Netherlands) for critical comments on the article. Prof. Dr. A. von Deimling (Department of Neuropathology, Institute of Pathology, University Heidelberg and Clinical Cooperation Unit Neuropathology German Cancer Research Center, Heidelberg, Germany) kindly analyzed LCH samples for their BRAFV600E-mutation status (Sahm and others 2012). We thank Prof. Dr. B.J. Rollins, Dr. G. Badalian-Very, Dr. D.S. Nelson, and the Center for Cancer Genome Discovery at the Dana-Farber Cancer Institute, Boston, MA, for BRAF sequencing as published (Badalian-Very and others ![]() ). This work was supported by the “1000 kaarsjes voor Juultje” Foundation.
). This work was supported by the “1000 kaarsjes voor Juultje” Foundation.
Author Disclosure Statement
No competing financial interests exist.