
Abstract
Patients with chronic hepatitis C virus (HCV) infection are at a greater risk of developing insulin resistance (IR). However, little is known about when insulin sensitivity may improve during or after treatment for hepatitis C. In this study, we examined the effect of combination therapy with pegylated interferon-α and ribavirin on IR in patients with chronic HCV infection. We also analyzed factors associated with changes in insulin sensitivity. IR was estimated by homeostasis model assessment (HOMA-IR). HOMA-IR was measured before therapy, during therapy (12 and 24 weeks), and at the end of therapy (EOT; 24 or 48 weeks). We analyzed 78 HCV patients receiving combination therapy. Twenty-two patients (28.2%) exhibited pretreatment IR (HOMA-IR >2.5). In all patients, HOMA-IR was not significantly different from baseline values at 12 weeks (P = 0.823), 24 weeks (P = 0.417), or at EOT (P = 0.158). In patients with pretreatment IR, a significant decrease in HOMA-IR was observed at 12 weeks (P = 0.023), 24 weeks (P = 0.008), and at EOT (P = 0.002). Multivariate analysis using a logistic regression model showed that baseline HOMA-IR is the only factor associated with the decline in HOMA-IR during and after therapy. The eradication of HCV infection was associated with improved insulin sensitivity among patients with pretreatment IR. This significant improvement in insulin sensitivity may occur as early as 12 weeks after the initiation of antiviral therapy.
Introduction
C
Several studies (Kawaguchi and others 2007; Romero-Gomez and others 2008; Arase and others 2009; Huang and others 2012) have suggested that HCV clearance is associated with improved insulin sensitivity, decreased diabetes mellitus, increased insulin receptor substrate-1 and -2 expression in hepatocytes, and glucose abnormalities during follow-up. However, most studies conducted assessments at the end of therapy (EOT) or during follow-up; therefore, it is unclear whether this improvement in insulin sensitivity is because of the effects of pegIFN-α and RBV treatment, weight loss, or improved hepatic function. Nevertheless, early improvement in insulin sensitivity during antiviral therapy provides convincing evidence of a direct role of HCV in IR. In addition, few independent factors are known to be associated with changes in insulin sensitivity after antiviral therapy. In this study, we examined the effect of combination therapy with pegIFN-α and RBV on IR in patients with chronic HCV infection. We also analyzed factors associated with changes in insulin sensitivity.
Methods
The study population comprised 78 consecutive patients with chronic HCV infection undergoing therapy at the Keelung Chang Gung Memorial Hospital, Keelung City, Taiwan, between September 2009 and November 2011. The patients included 37 men and 41 women with a mean age of 53.5 years (range, 22–75 years). Patients were seropositive for HCV antibodies (anti-HCV) and HCV RNA and they exhibited serum alanine aminotransferase (ALT) levels greater than the upper limit of normal (ULN). Patients with HBV infection, autoimmune hepatitis, human immunodeficiency virus infection, heavy alcohol consumption (>20 g/day), and a history of diabetes mellitus were excluded. All patients received either a fixed dose of 180 μg pegIFN-α-2a (Pegasys®; F. Hoffmann-La Roche Ltd., Basel, Switzerland) subcutaneously administered once weekly or a weight-based dose of 1.5 μg/kg pegIFN-α-2b (Peg-Intron®; Schering-Plough Corp., Kenilworth, NJ) subcutaneously administered once weekly and 800–1,200 mg per day of oral RBV for 24–48 weeks. HCV RNA was measured during the treatment to determine the treatment duration [response-guided therapy (RGT); Ghany and others 2009]. A rapid virological response (RVR) was defined as undetectable levels of HCV RNA in week 4 of treatment. An early virological response (EVR) was defined as a 2-log or greater reduction in serum HCV RNA levels from baseline to week 12 of therapy. Complete EVR (cEVR) was defined as undetectable serum HCV RNA levels at week 12 of therapy in patients who did not achieve an RVR. Partial EVR (pEVR) was defined as a 2-log or greater reduction in serum HCV RNA levels from baseline to week 12 of therapy in patients who did not achieve an RVR at week 4 and did not exhibit undetectable serum HCV RNA levels at week 12 of therapy. An SVR was defined as undetectable serum HCV RNA levels at least 24 weeks after EOT. Based on RGT, 72 patients completed the expected therapy, 3 failed to achieve EVR, and 3 with intolerance to the therapy withdrew at 12 or 16 weeks. Of the 72 patients who completed the therapy, 64 were monitored for a further 24 weeks. The other 8 patients who achieved EOT virologic clearance participated in a clinical trial of oral interferon; thus, these patients were excluded from the final SVR analysis.
Anthropometric data, which included body weight and height measurements, were obtained using standardized techniques before and at EOT. Overnight (>12 h) fasting plasma glucose and insulin levels were measured before therapy, during therapy (12 and 24 weeks), and at EOT (24 or 48 weeks). IR was determined by HOMA-IR. The following formula was used to calculate HOMA-IR:
IR was defined as an HOMA-IR of >2.5 (Matthews and others 1985). Aspartate aminotransferase (AST)-to-platelet ratio index (APRI) was used to assess liver fibrosis. APRI was calculated as follows:
For cirrhosis, the 1.0 threshold was 76% sensitivity and 72% specificity and the 2.0 threshold was 46% sensitivity and 91% specificity (Lin and others 2011).
All patients underwent hepatic ultrasonography before treatment. An ultrasonography scoring system, which included assessment of the liver surface, liver parenchyma, hepatic vessels, and spleen index (calculated as the product of the oblique and diagonal diameters), was developed to evaluate the degree of hepatic fibrosis (Hung and others 2003). The degree of hepatic steatosis was graded as none, mild, moderate, or severe based on the discrepancy of echogenicity between the liver and kidneys, the degree of posterior attenuation, and the visibility of the vessels (Lin and others 1993). After ultrasonography, the presence of cirrhosis and/or fatty liver was recorded. Informed consent was obtained from each patient included in the study. The study conformed to the ethics guidelines of the Declaration of Helsinki and was performed with the approval of the ethics committee of the Keelung Chang Gung Memorial Hospital (101-0394B).
Statistical analyses
The Wilcoxon signed-rank test was used to analyze paired samples. Statistical comparisons between the patient groups were performed using the Mann–Whitney U-test for continuous variables and Fisher's exact test for categorical variables. A multivariate logistic regression model was used to determine the independent factors associated with the decrease in HOMA-IR. Database processing and analyses were performed using SPSS for Windows, Version 19 (IBM Corp., Armonk, NY). A P value of <0.05 was considered statistically significant.
Results
Baseline characteristics
We examined 78 patients with chronic hepatitis C. Their demographic data are shown in Table 1. Forty-one (52.6%) patients had genotype 1 infection and 37 (47.4%) had nongenotype 1 infection (32 had genotype 2 infection; 1 had genotype 3 infection; 1 had genotype 6 infection; 1 had genotype 1 and genotype 6 mixed infection; and 1 was unclassified). The mean viral load was 6.37 ± 0.85 log IU/mL. RVR was achieved in 44.9% (35/78) of patients (22% in those with genotype 1 infection and 72.2% in those with nongenotype 1 infection); EVR was achieved in 96.2% (75/78); cEVR was achieved in 82.1% (64/78); and SVR was achieved in 70.3% (45/64).
BMI, body–mass index; AST, aspartate aminotransferase; ALT, alanine aminotransferase; APRI, aspartate aminotransferase-to-platelet ratio index; HCV, hepatitis C virus; HOMA-IR, homeostasis model assessment of insulin resistance; RVR, rapid virological response; SVR, sustained virological response; EVR, early virological response; cEVR, complete early virological response; pEVR, partial virological response; ULN, upper limit of normal.
Twenty-two (28.2%) patients had pretreatment IR. These patients exhibited a high body–mass index (BMI) (26.5 ± 3.3 versus 23.9 ± 3; P < 0.001), high fasting glucose levels (110 ± 28.2 versus 97.7 ± 10.7; P = 0.006), high fasting insulin levels (13.3 ± 3.8 versus 5.2 ± 2.1; P < 0.001), and a high incidence of fatty liver (68.2% versus 32.1%; P =0.005) relative to patients without pretreatment IR. HCV viral load was marginally higher in patients with IR than in those without (6.67 ± 0.72 versus 6.26 ± 0.88; P = 0.056). Otherwise, there were no significant differences in age, sex, AST levels, ALT levels, genotype, the incidence of cirrhosis, and APRI between patients with an HOMA-IR of >2.5 and those with an HOMA-IR of ≤2.5. RVR and SVR rates tended to be lower in patients with IR than in those without (36.4% versus 48.2% achieving RVR and 70% versus 72.3% achieving SVR), but the difference was not statistically significant.
Changes in body weight and IR assessed by the HOMA during and after therapy
After the completion of therapy, body weight significantly decreased (from 64.6 ± 10.6 kg at baseline to 61.9 ±10.8 kg at EOT; P < 0.001). The mean HOMA-IR decreased by 0.1, 0.11, and 0.17 units after 12 weeks, 24 weeks, and at EOT, respectively. There was no significant difference in comparison with the baseline value at 12 weeks (P = 0.823), 24 weeks (P = 0.417), and at EOT (P = 0.158; Fig. 1).

Mean homeostasis model assessment of insulin resistance (HOMA-IR) values at week 0 (baseline), 12 weeks, 24 weeks, and at the end of therapy (EOT) (week 24 or 48) in all patients.
In the 45 patients who achieved an SVR, there was a significant decrease in body weight (from 65.7 ± 9.6 kg at baseline to 62.7 ± 10.1 kg at EOT; P < 0.001) at EOT, whereas the sequential decrease in HOMA-IR at 12 weeks, 24 weeks, and at EOT was not statistically significant. In 19 patients who did not achieve an SVR, there was a significant decrease in body weight at EOT (from 63.8 ± 13.1 kg at baseline to 61.6 ± 13.6 kg at EOT; P = 0.007), whereas a sequential decrease in HOMA-IR at 12 weeks, 24 weeks, and at EOT was not statistically significant (Fig. 2). In 37 patients with abnormal fasting glucose levels at baseline (>100 mg/dL), the decrease in HOMA-IR was significant at 24 weeks (P = 0.032), but it was not significant at 12 weeks (P = 0.564) and at EOT (P = 0.096). In 41 patients with normal baseline fasting glucose levels (<100 mg/dL), no significant decrease in HOMA-IR was evident at 12 weeks, 24 weeks, and at EOT (Fig. 2). In all patients, there was no significant change in HOMA-IR at 12 weeks, 24 weeks, and at EOT regardless of whether an RVR was achieved or whether the HCV infection was genotype 1 or nongenotype 1 (Fig. 2).
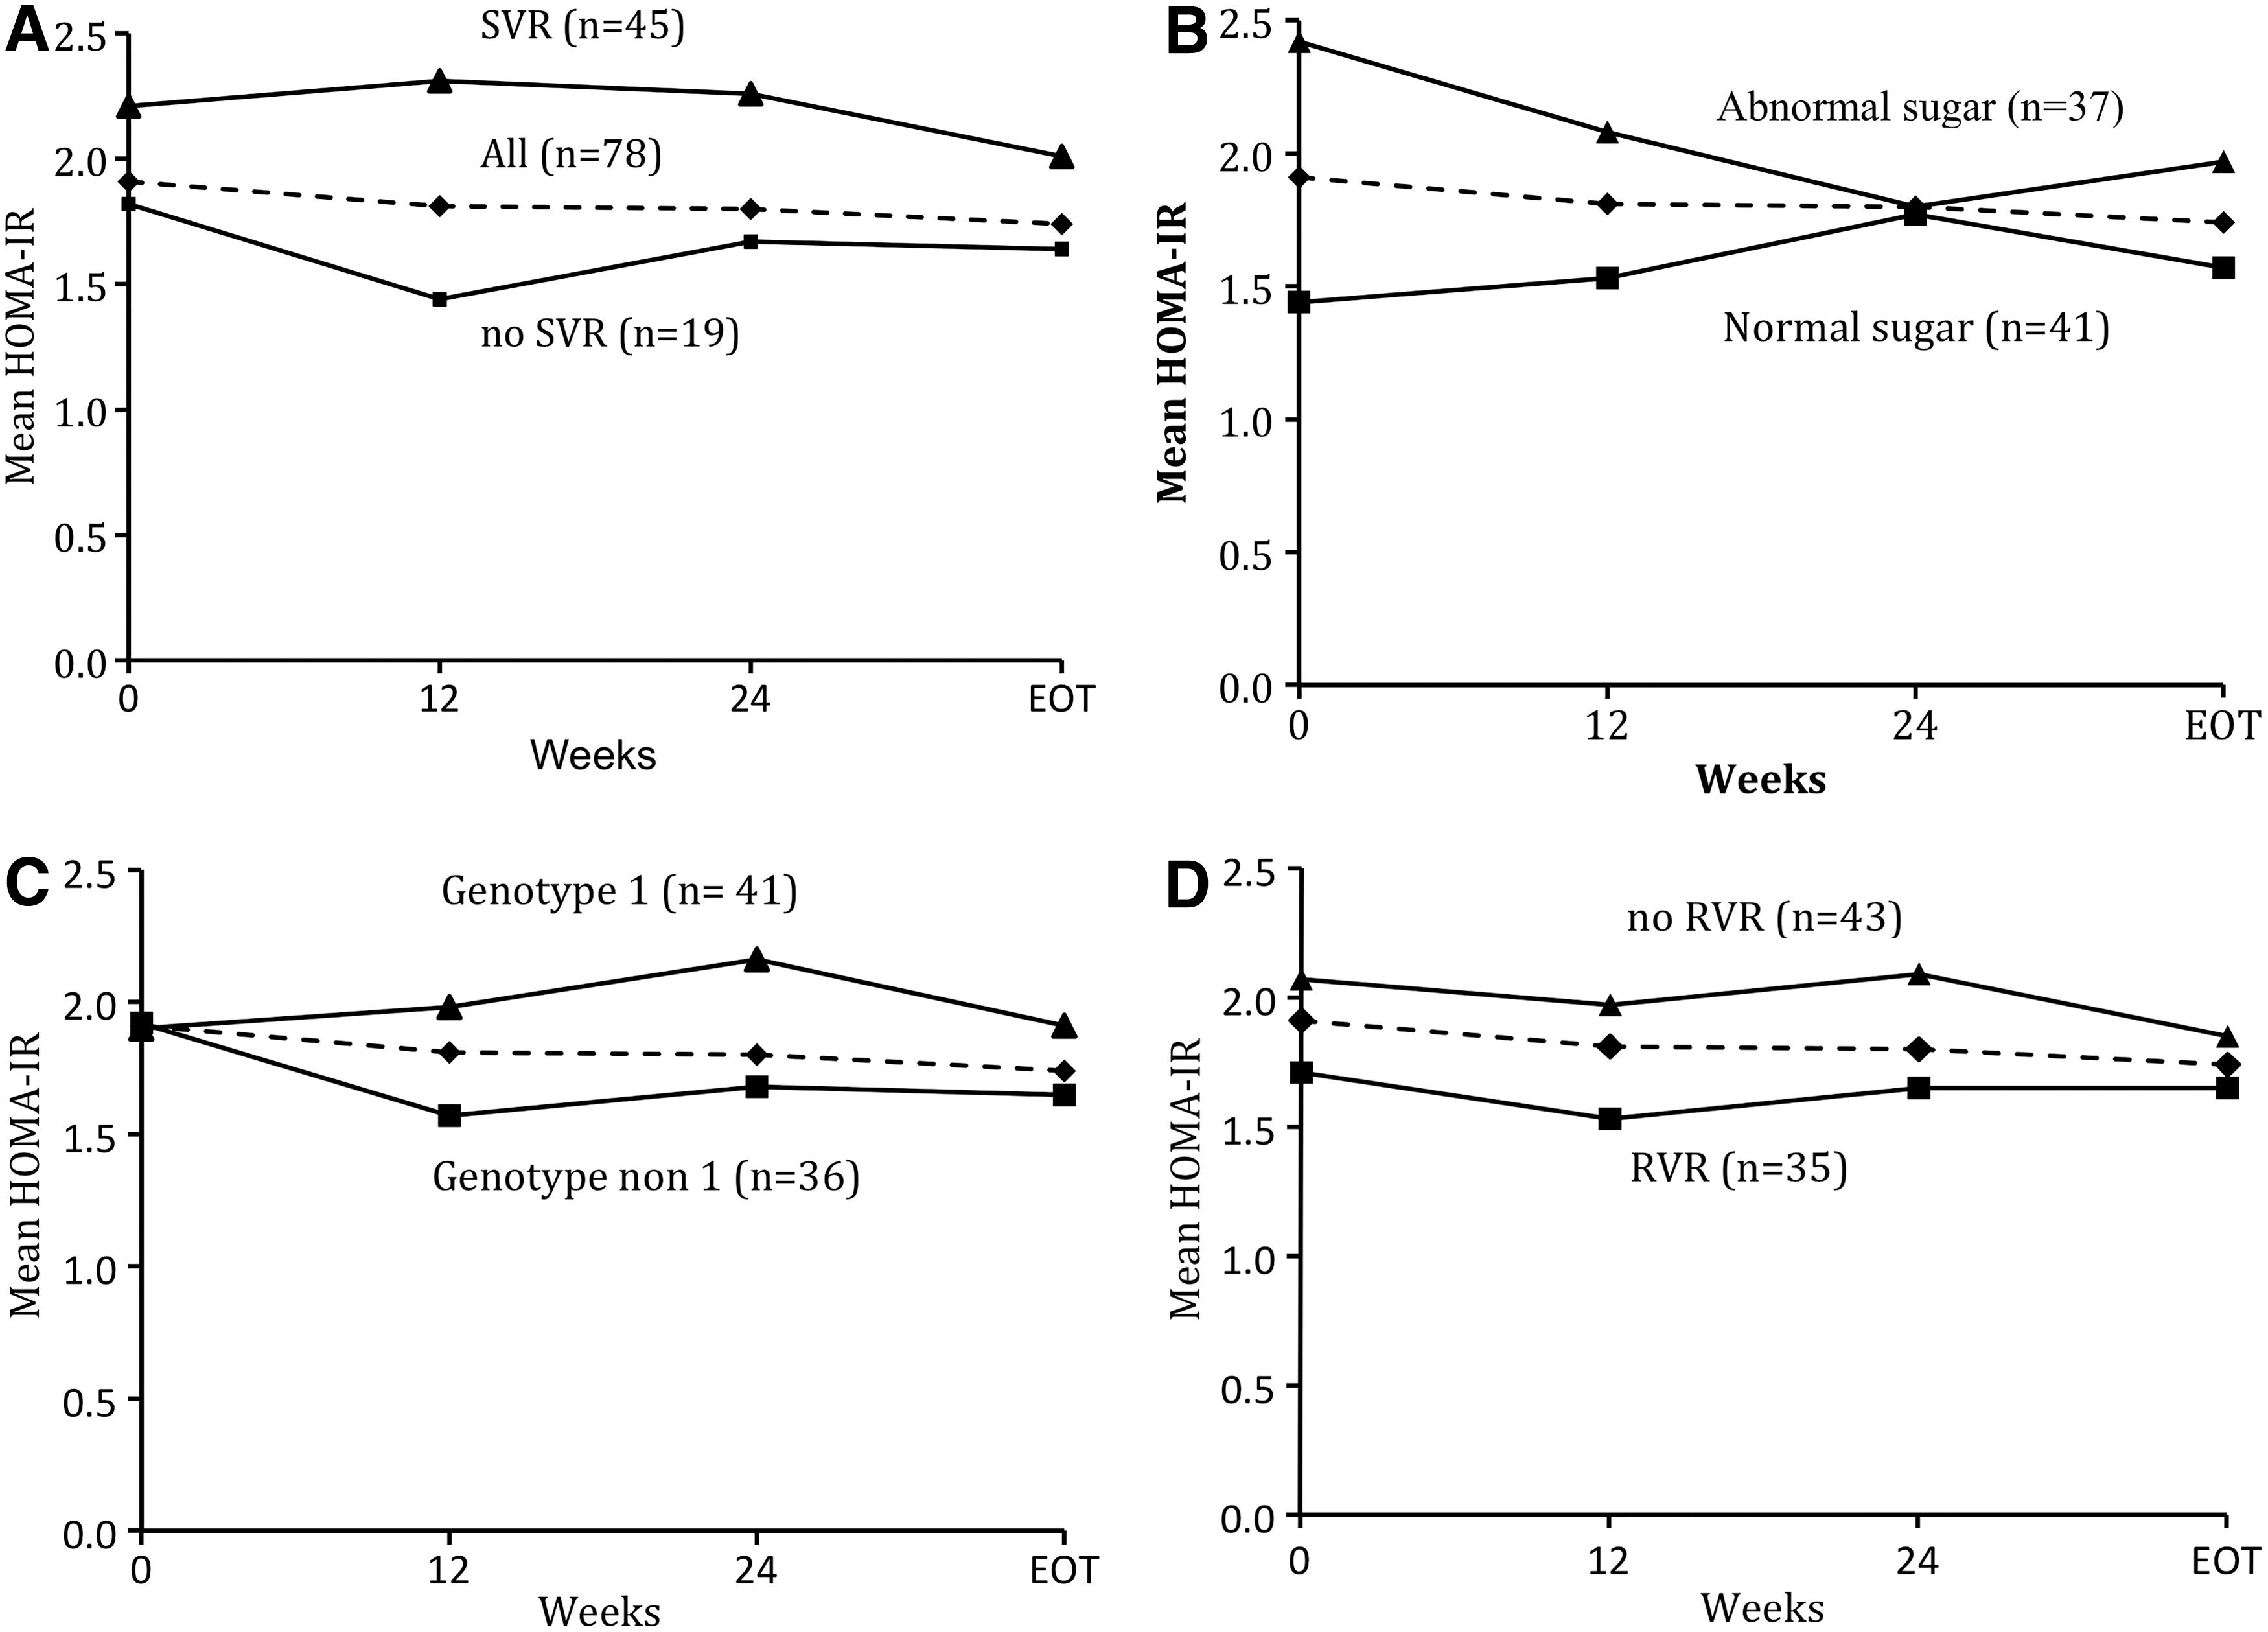
Mean HOMA-IR values at week 0 (baseline), 12 weeks, 24 weeks, and at the end of therapy (EOT; week 24 or 48) in all patients with SVR or without SVR
Changes in body weight and IR assessed by HOMA during therapy in patients with pretreatment IR
In 22 patients with pretreatment IR, there was a significant body weight reduction at EOT (from 70.1 ± 11.4 kg at the baseline to 66.5 ± 11.4 kg at EOT; P < 0.001). In patients with pretreatment IR, a significant decrease in HOMA-IR was evident at 12 weeks (P = 0.023), 24 weeks (P = 0.008), and at EOT (P = 0.002) compared with baseline values. The mean HOMA-IR decreased by 1.4 units at 12 weeks, 1.5 units at 24 weeks, and 1.42 units at EOT (Fig. 3). Although the HOMA-IR decreased at week 24 by a further 0.1 units and at EOT by 0.02 units, it was not significantly different in comparison with values obtained at week 12 (P = 0.67 and P = 0.89, respectively). Fourteen patients (63.4%) with pretreatment IR had an HOMA-IR of ≤2.5 after EOT. The correlation between changes in HOMA-IR and HCV viral load was further analyzed. Patients who exhibited a decline in HOMA-IR at week 12 showed a greater proportion of undetectable HCV-RNA than those who did not during therapy (41.7% versus 34.5%, P = 0.554 at week 4; 94.4% versus 75.0%, P = 0.031 at week 12) (Fig. 4). The SVR group exhibited a greater decrement in mean HOMA-IR at EOT than the non-SVR group (1.67 versus 0.95 units).
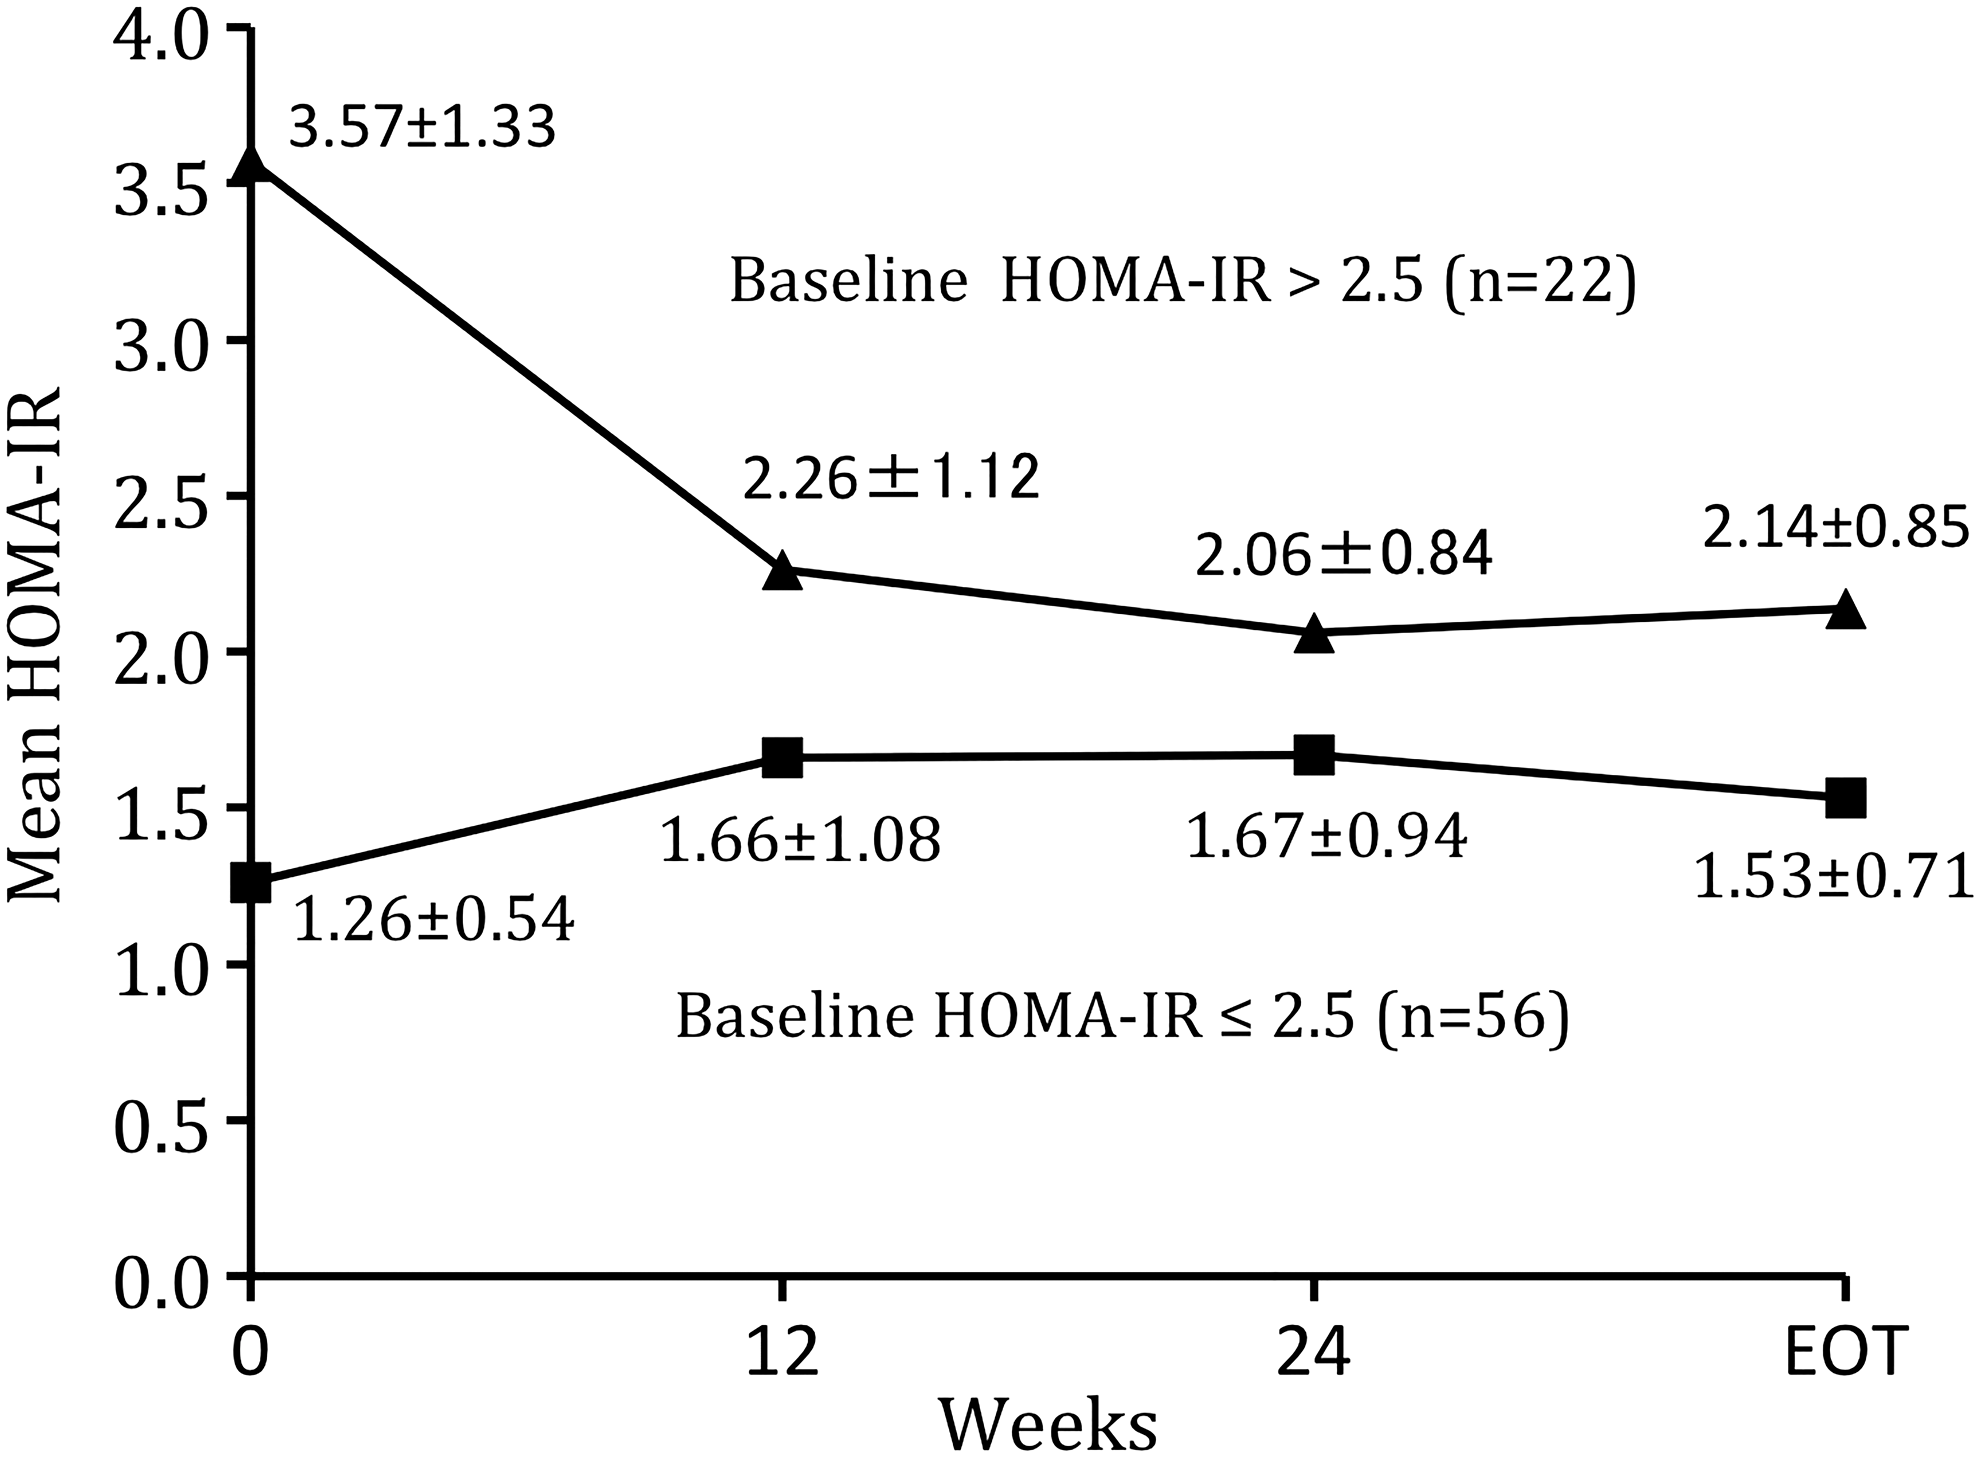
Mean HOMA-IR values at week 0 (baseline), 12 weeks, 24 weeks, and at EOT (week 24 or 48) in 22 patients with HOMA-IR >2.5 and 56 patients with HOMA-IR ≤2.5 at baseline. Change in HOMA-IR from that at baseline to that at weeks 12, 24, and EOT was statistically significant (P = 0.023; P < 0.01; P < 0.01 in baseline HOMA-IR >2.5 patients and P = 0.012; P = 0.01; and P = 0.004 in baseline HOMA-IR ≤2.5 patients).
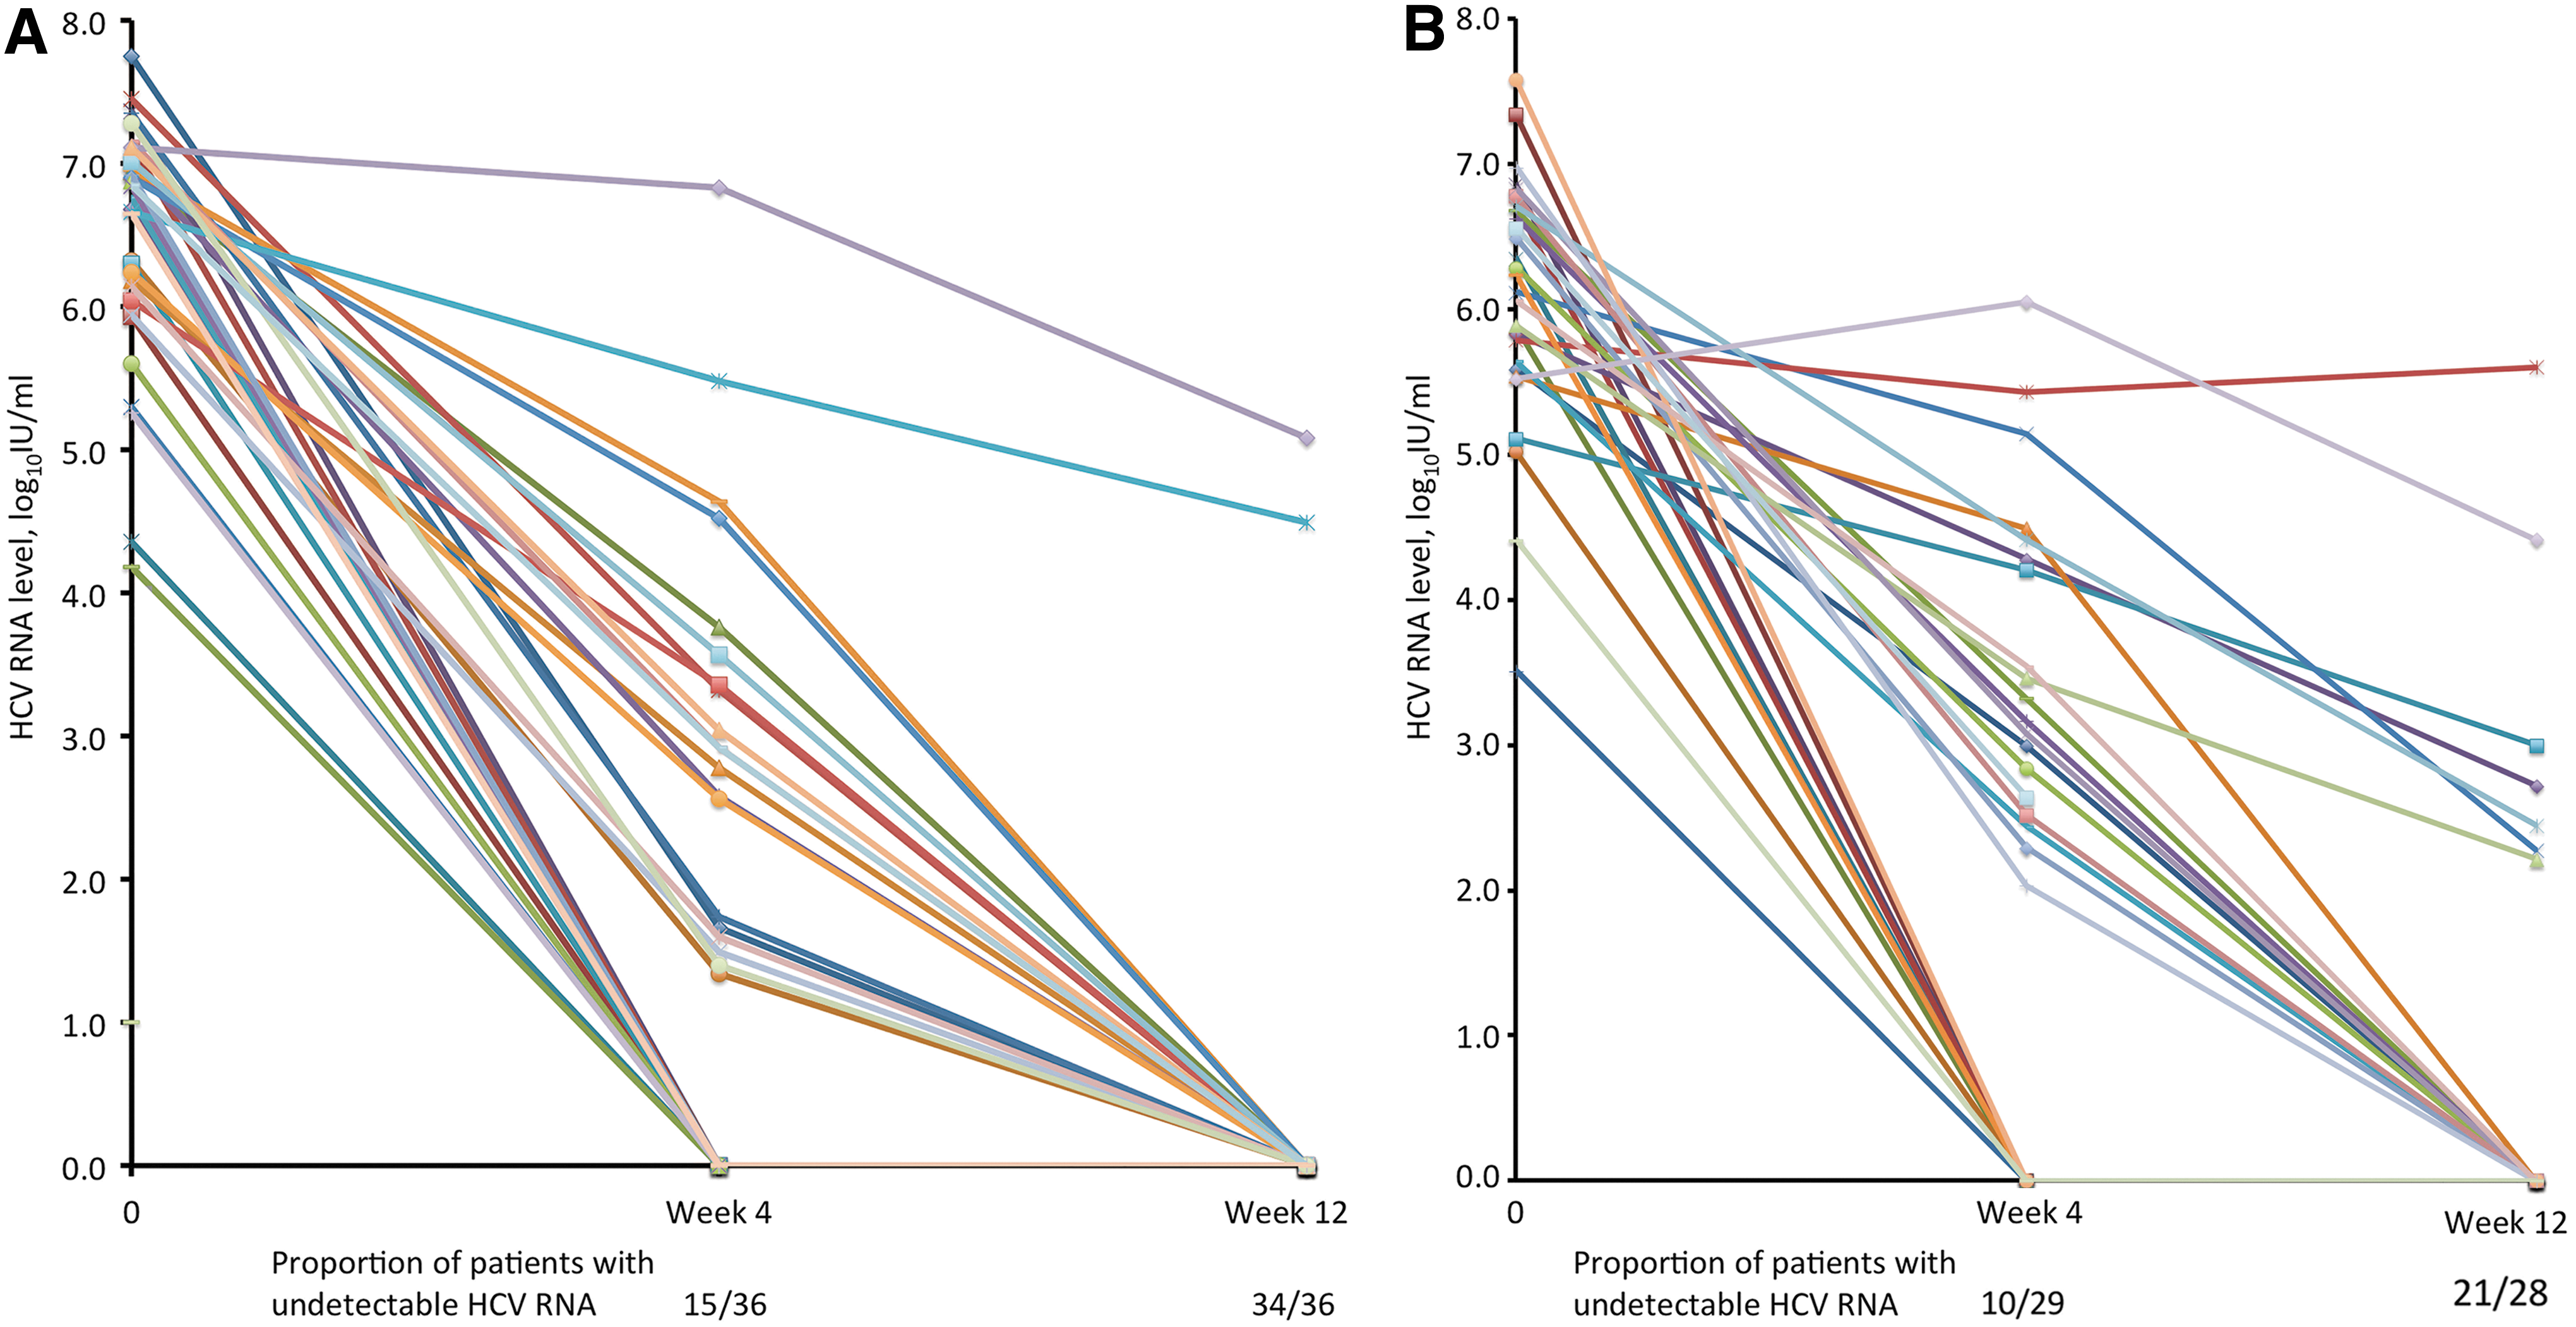
Changes of hepatitis C virus (HCV) RNA level during therapy at week 0 (baseline) and 4 and 12 weeks in patients who exhibited a decline in HOMA-IR at week 12
In 56 patients with a baseline HOMA-IR of ≤2.5, a significant body weight reduction at EOT (from 62.4 ± 9.6 kg at the baseline to 60.1 ± 10.1 kg at EOT; P < 0.001) was observed. In contrast, a significant increase in HOMA-IR was observed at 12 weeks (P = 0.012), 24 weeks (P = 0.01), and at EOT (P = 0.004) in these patients. The mean HOMA-IR increased by 0.4 units at 12 weeks, 0.41 units at 24 weeks, and 0.27 units at EOT (Fig. 2). Furthermore, only 1 patient (1.8%) had an HOMA-IR of >2.5 after EOT.
Factors affecting IR assessed by HOMA
Thirty-seven patients (47.4%) experienced a decline in HOMA-IR during and after therapy. Analyses of factors associated with changes in HOMA-IR are shown in Table 2. Univariate analysis identified higher fasting insulin levels, HOMA-IR, and HOMA-IR of >2.5 as independent factors predictive of a decline in HOMA-IR during and after antiviral therapy. In addition, multivariate analysis using a logistic regression model showed that baseline HOMA-IR is the only factor associated with a decline in HOMA-IR during and after therapy (Table 3). In a subgroup analysis of patients with pretreatment IR, there was no independent factor predictive of a decline in HOMA-IR during and after antiviral therapy.
Discussion
In this retrospective study on chronic hepatitis C therapy, HOMA-IR significantly decreased after the eradication of HCV in patients with pretreatment IR. The significant decrease in HOMA-IR was observed as early as 12 weeks after the initiation of antiviral therapy. At EOT, the restoration of IR occurred in 63.4% of patients with pretreatment IR. Regardless of whether an SVR was achieved, baseline HOMA-IR value was independently associated with a decrease in HOMA-IR during and after therapy.
A direct effect of HCV on insulin signaling by hepatocytes has been observed in experimental models. Our understanding of the direct effects of HCV in modulating insulin signaling through the HCV core protein and NS5A has recently increased (Eslam and others 2011b). Investigation of the effects of antiviral therapy is a classic way to establish an association between infection and pathogenesis. If HCV induces IR, the eradication of HCV by antiviral therapy should improve the HOMA-IR value. IFN-based regimens are the standard therapy for chronic HCV infection. Decreased IR measured by HOMA-IR has been shown to be associated with viral clearance in several studies (Tai and others 2003; Romero-Gomez and others 2005; Kawaguchi and others 2007; Kim and others 2009; Delgado-Borrego and others 2010; Conjeevaram and others 2011; Huang and others 2011; Serfaty and others 2012; Table 4). Kawaguchi and others (2007) treated 89 patients with chronic HCV infection (genotype 1, n = 63; genotype 2, n = 26) using pegIFN-α and/or RBV for 6 months. A significant decrease in HOMA-IR was observed in the sustained responders. Similar results were reported in 2 other studies (Tai and others 2003; Delgado-Borrego and others 2010). Furthermore, Kim and others (2009) indicated that achieving an SVR is the only independent factor related to the reduction of IR. In a large cohort of 341 patients infected with genotype 1 HCV and receiving pegIFN-α plus RBV therapy, Conjeevaram and others (2011) reported that achieving an SVR resulted in sustained improvement in HOMA-IR value. Changes in HOMA-IR were not associated with the baseline values of variables, including AST levels, ALT levels, HCV RNA levels, and BMI. The baseline HOMA-IR value was the only factor associated with a change in HOMA-IR in patients who achieved an SVR. However, Huang and others (2011) reported no significant decrease in HOMA-IR in sustained responders in a study performed in Taiwan. Furthermore, a subgroup analysis showed that the significant decrease in HOMA-IR after treatment occurred in patients with a high pretreatment HOMA-IR, irrespective of whether they achieved an SVR. One possible explanation for these conflicting results is viral factors. Most previous studies included patients infected with genotype 1. The effect of IR on HCV clearance is more evident in a difficult-to-treat cohort (HCV genotype 1 with a high viral load; Dai and others 2009). Pazienza and others (2007) described the genotype-specific mechanisms by which the HCV core protein interferes with the insulin signaling cascade in vitro. Whether the eradication of HCV of different genotypes ameliorates IR to differing degrees remains unknown. Another possible explanation is host genetic polymorphisms near the interleukin 28B (IL28B) gene. A study by Ge and others (2009) suggested that the distribution of IL28B polymorphisms may partly explain the different SVR rates to the same treatment regimen for chronic hepatitis C in different ethnicities. Asian people have favorable IL28B polymorphisms. This factor may explain the high rate of eradication of hepatitis C by pegIFN-α and RBV therapy in Asia (Chuang and Yu 2013). Changes of insulin sensitivity may not differ between Asian patients who do or do not achieve an SVR.
IFN-α, interferon-alpha; pegIFN-α, peginterferon-alpha; RBV, ribavirin; IR, insulin resistance; NA, not available.
One novel finding of our study was that HOMA-IR decreased immediately after 12 weeks of therapy in patients with pretreatment IR. Furthermore, HOMA-IR did not decrease at week 24 or at EOT relative to week 12. To the best of our knowledge, only 1 recent report has investigated changes in HOMA-IR at 12 weeks after combination therapy with pegIFN-α and RBV (Thompson and others 2012). It concluded that viral clearance is associated with improved IR in patients infected with chronic hepatitis C of genotype 1, but not of genotypes 2 and 3. In our pretreatment IR group, 77.3% patients had undetectable HCV RNA levels after 12 weeks of combination therapy. However, the early eradication of HCV contributes to an improvement in insulin sensitivity at an early stage. A similar result was reported by Moucari and others (2010). They demonstrated a close correlation between the extent of HOMA-IR improvement and the decrease in viral load observed after 2 weeks of treatment with danoprevir, a novel and effective DAA. It is established that IR is influenced by lifestyle changes, including weight reduction. Weight loss has been reported in 20%–29% of patients treated with pegIFN-α and RBV (Fried 2002). Greater weight losses occurred after 24 or 48 weeks of therapy (Seyam and others 2005; Chung and others 2010). Most previous studies measured HOMA-IR at EOT (24 or 48 weeks) when weight loss may be an inevitable confounder. In contrast, early significant declines in HOMA-IR after 12 weeks of therapy provided convincing evidence that an improvement in insulin sensitivity was independent of weight loss induced by therapy and unrelated to an improvement in liver function.
We found that the HOMA-IR value of some patients without pretreatment IR increased after therapy, as reported by Huang and others (2011), despite a significant reduction in body weight. Imano and others (1998) reported that patients with chronic hepatitis C develop IR in splanchnic and peripheral tissues after 2 weeks of IFN therapy. The mechanism by which IFN therapy increases insulin sensitivity is poorly understood. Notably, IFN can exacerbate an existing autoimmune tendency, which may subsequently precipitate immune-mediated abnormalities de novo, leading to the emergence of IR and subsequently diabetes mellitus (Fabris and others 2003; Schreuder and others 2008; Daniel and others 2009). One of the molecular mechanisms by which IFN-α induces type 1 diabetes following viral infection is β-cell apoptosis. Viral double-stranded RNA activates the production of IFN-α in various cells, which is directly cytotoxic to β cells. Apoptotic materials induce more IFN-α and activate the immune system (Zornitzki and others 2015). A nationwide survey showed that the interval preceding the development of IFN-α-induced type 1 diabetes was shorter in patients who received combination therapy of pegINF-α and RBV than in those who received nonpegylated INF; this suggests that a longer duration of treatment with pegINF-α and stimulation of the type 1 T helper cell immune response by RBV may increase the risk of developing type 1 diabetes (Nakamura and others 2011).
Few studies have investigated how the early resolution of IR occurs and how long it persists after effective antiviral therapy. In HCV-infected patients, IR leads to the development of type 2 diabetes and possibly increased cardiovascular events. The incidence of new-onset type 2 diabetes is reduced after the treatment of HCV infection (Romero-Gomez and others 2008). A large population-based survey also indicated that antiviral treatment for HCV infection is associated with improved renal and cardiovascular outcomes in diabetic patients (Hsu and others 2014). Whether the resolution of IR equates to a reduction in mortality associated with HCV-related liver disease or even mortality associated with cardiovascular events warrants further investigation.
In conclusion, the eradication of HCV infection is associated with an improvement in insulin sensitivity among patients with pretreatment IR. This significant improvement in insulin sensitivity may occur as early as 12 weeks after the initiation of antiviral therapy.
Footnotes
Author Disclosure Statement
No competing financial interests exist.